
955 Jefferson Avenue
Valley Forge Corporate Center
Norristown, PA 19403-2497
Jacqulynn B. Hugee
Assistant General Counsel
610.666.8208 Telephone | 610.666.8211 Fax
August 31, 2011
VIA ELECTRONIC FILING
Honorable Kimberly D. Bose, Secretary Federal Energy Regulatory Commission 888 First Street, N.E.
Washington, D.C. 20426-0001
Re: RTO/ISO Performance Metrics, AD10-5-000
Dear Secretary Bose:
The six Independent System Operators (“ISOs”) and Regional Transmission Operators
1
(“RTOs”) regulated by the Federal Energy Regulatory Commission (“Commission”) are
pleased to submit the 2011 ISO/RTO Metrics Report. This more than 350-page report
reflects the content outlined in the October 21, 2010 Commission Staff Report on
ISO/RTO Performance Metrics, as applicable and as information is available for each
entity.
The ISOs/RTOs have combined their data and narratives into one report, instead of six separate documents, for the convenience of the readers. This combined report is organized as follows:
• Executive Summary
• ISO/RTO Geography and Operations Statistics
• Performance Metrics and Other Information
o Descriptions - common definitions of metrics and other information
included in each ISO’s/RTO’s section
o California ISO
o ISO New England
o MISO
o New York ISO
o PJM
o Southwest Power Pool
1 The California Independent System Operator Corporation (“California ISO”), ISO New England, Inc. (“ISO-NE”),
Midwest Independent Transmission System Operator, Inc. (“MISO”), New York Independent System Operator
(“NYISO”), PJM Interconnection, L.L.C. (“PJM”), and Southwest Power Pool, Inc. (“SPP”) have each contributed to
this report.
The Hon. Kimberly Bose
RTO/ISO Performance Metrics, Docket No. AD10-5 August 31, 2011
Page 2
Any questions concerning this report should be addressed to the undersigned.
Respectfully submitted,
/s/ Suzanne Daugherty
Suzanne Daugherty
Vice President, Chief Financial Officer & Treasurer
PJM Interconnection, L.L.C. 955 Jefferson Avenue
Norristown, Pennsylvania 19403 (610) 666-4770
daughes@pjm.com
/s/ Jacqulynn B. Hugee
Jacqulynn B. Hugee
Assistant General Counsel - Markets PJM Interconnection, L.L.C.
955 Jefferson Avenue
Norristown, Pennsylvania 19403 (610) 666-8208
hugeej@pjm.com
2011 ISO/RTO Metrics Report
The California Independent System Operator Corporation (California ISO), ISO New England, Inc. (ISO-NE), Midwest
Independent Transmission System Operator, Inc. (MISO), New York Independent System Operator (NYISO), PJM
Interconnection, L.L.C. (PJM), and Southwest Power Pool, Inc. (SPP) assisted in the preparation of this report.
2011 ISO/RTO Metrics Report1
Table of Contents
Executive Summary9
ISO/RTO Geography and Operations Statistics11
Performance Metrics and Other Information
Section 1 - Descriptions
ISO/RTO Bulk Power System Reliability
Dispatch Operations12
Load Forecast Accuracy13
Wind Forecasting Accuracy14
Unscheduled Flows14
Transmission Outage Coordination15
Transmission Planning16
Generation Interconnection16
Interconnection / Transmission Service Requests18
Special Protection Schemes18
ISO/RTO Coordinated Wholesale Power Markets
Market Competitiveness19
Market Pricing21
Unconstrained Energy Portion of System Marginal Cost22
Energy Market Convergence22
Congestion Management22
Resources23
Fuel Diversity23
Renewable Resources23
ISO/RTO Organizational Effectiveness
ISO/RTO Administrative Costs25
Customer Satisfaction25
Billing Controls26
2011 ISO/RTO Metrics Report2
Section 2 - California ISO Performance Metrics27
A. California ISO Bulk Power System Reliability
Dispatch Operations31
Load Forecast Accuracy33
Wind Forecasting Accuracy35
Unscheduled Flows36
Transmission Outage Coordination38
Transmission Planning41
Generation Interconnection42
Interconnection / Transmission Service Requests46
Special Protection Schemes49
B. California ISO Coordinated Wholesale Power Markets
Market Competitiveness49
Market Pricing53
Unconstrained Energy Portion of System Marginal Cost55
Energy Market Convergence56
Congestion Management58
Generator Availability59
Fuel Diversity60
Renewable Resources62
C. California ISO Organizational Effectiveness
ISO/RTO Administrative Costs65
Customer Satisfaction66
Billing Controls67
D. California ISO Specific Initiatives68
2011 ISO/RTO Metrics Report3
Section 3 - ISO New England (ISO-NE)72
A. ISO New England Bulk Power System Reliability
Dispatch Operations75
Load Forecast Accuracy77
Wind Forecasting Accuracy80
Unscheduled Flows81
Transmission Outage Coordination81
Transmission Planning85
Generation Interconnection89
Interconnection / Transmission Service Requests97
Special Protection Schemes103
B. ISO New England Coordinated Wholesale Power Markets
Market Competitiveness107
Market Pricing111
System Marginal Cost116
Energy Market Convergence117
Congestion Management118
Resources120
Fuel Diversity123
Renewable Resources126
C. ISO New England Organizational Effectiveness
ISO/RTO Administrative Costs134
Customer Satisfaction137
Billing Controls138
D. ISO New England Specific Initiatives140
2011 ISO/RTO Metrics Report4
Section 4 - MISO144
A. MISO Bulk Power System Reliability
Dispatch Operations148
Load Forecast Accuracy150
Wind Forecasting Accuracy152
Unscheduled Flows153
Transmission Outage Coordination155
Transmission Planning158
Generation Interconnection162
Interconnection / Transmission Service Requests167
Special Protection Schemes171
B. MISO Coordinated Wholesale Power Markets
Market Competitiveness174
Market Pricing178
Unconstrained Energy Portion of System Marginal Cost182
Energy Market Convergence183
Congestion Management184
Resources186
Fuel Diversity190
Renewable Resources191
C. MISO Organizational Effectiveness
ISO/RTO Administrative Costs193
Customer Satisfaction196
Billing Controls197
D. MISO Specific Initiatives198
2011 ISO/RTO Metrics Report5
Section 5 - New York ISO (NYISO)201
A. NYISO Bulk Power System Reliability
Dispatch Operations204
Load Forecast Accuracy207
Wind Forecasting Accuracy210
Unscheduled Flows211
Transmission Outage Coordination214
Transmission Planning216
Generation Interconnection220
Interconnection / Transmission Service Requests225
Special Protection Schemes228
B. NYISO Coordinated Wholesale Power Markets
Market Competitiveness231
Market Pricing233
Unconstrained Energy Portion of System Marginal Cost237
Energy Market Convergence238
Congestion Management239
Resources241
Fuel Diversity243
Renewable Resources245
C. NYISO Organizational Effectiveness
ISO/RTO Administrative Costs249
Customer Satisfaction252
Billing Controls253
D. NYISO Specific Initiatives255
2011 ISO/RTO Metrics Report6
Section 6 - PJM Interconnection (PJM)261
A. PJM Bulk Power System Reliability
Dispatch Operations264
Load Forecast Accuracy267
Wind Forecasting Accuracy269
Unscheduled Flows270
Transmission Outage Coordination272
Transmission Planning274
Generation Interconnection279
Interconnection / Transmission Service Requests283
Special Protection Schemes286
B. PJM Coordinated Wholesale Power Markets
Market Competitiveness289
Market Pricing294
Unconstrained Energy Portion of System Marginal Cost298
Energy Market Convergence299
Congestion Management301
Resources303
Fuel Diversity306
Renewable Resources308
C. PJM Organizational Effectiveness
ISO/RTO Administrative Costs311
Customer Satisfaction314
Billing Controls315
D. PJM Specific Initiatives316
2011 ISO/RTO Metrics Report7
Section 7 - Southwest Power Pool (SPP)319
A. SPP Bulk Power System Reliability
Dispatch Operations322
Load Forecast Accuracy324
Wind Forecasting Accuracy326
Unscheduled Flows326
Transmission Outage Coordination327
Transmission Planning329
Generation Interconnection332
Interconnection / Transmission Service Requests333
Special Protection Schemes335
B. SPP Coordinated Wholesale Power Markets
Market Competitiveness337
Market Pricing340
Unconstrained Energy Portion of System Marginal Cost343
Energy Market Convergence344
Congestion Management344
Resources344
Fuel Diversity345
Renewable Resources347
C. SPP Organizational Effectiveness
ISO/RTO Administrative Costs349
Customer Satisfaction352
Billing Controls353
D. SPP Specific Initiatives354
2011 ISO/RTO Metrics Report8
Executive Summary
The following report has been prepared by the independent system operators (ISOs) and regional transmission
organizations (RTOs) that are regulated by the Federal Energy Regulatory Commission (FERC). The report provides information on various data points that are common to each of the system operators, and has been prepared at FERC’s direction following the process described below.
The information included, similar to FERC Form 1 information, may be useful to the FERC, stakeholders and the
public at large in compiling information and tracking certain data points that are relevant to ISO and RTO
performance in the areas of reliability, wholesale electricity market performance and organizational effectiveness.
That said, this report does not definitively measure ISO and RTO performance or supplant the various mechanisms
already in place to measure performance. Those include FERC’s triennial market-based rate analysis under Order
No. 697, the respective State of the Market Reports for each ISO/RTO, FERC’s State of the Market Report, or
regional initiatives such as the ―value proposition‖ and other measures developed by ISOs and RTOs.
Moreover, the information provided herein must be assessed in the proper context. For example, the report includes tables comparing forecast accuracy at each of the ISOs and RTOs. However, there are a number of factors that
influence the data and could result in variations among the ISOs/RTOs, including the time of day at which the
forecast is made, the region’s weather variability, data points selected (i.e., hour to hour) and the geographic diversity of the control area. Where possible, and to the extent practicable, this context has been provided along with the data. Absent this context, the data tell an incomplete story.
History of the Initiative
This report originated with a review undertaken by the United States Government Accountability Office in 2008 at the request of the U.S. Senate Committee on Homeland Security and Governmental Affairs.1 To more effectively analyze ISO/RTO benefits and performance, the Government Accountability Office recommended that the FERC work with ISOs/RTOs, stakeholders and other interested parties to standardize measures that track the performance of
ISO/RTO operations and markets, and to report the performance results to Congress and the public.
Accordingly, FERC staff worked with a team composed of personnel from FERC-jurisdictional ISOs and RTOs to
develop the performance metrics that form the basis for this report. As part of this process, FERC held meetings with industry stakeholders for their input and established an open comment period on the proposed metrics which will track the performance of ISO/RTO operations, markets and organizational effectiveness.
1Electricity Restructuring: FERC Could Take Additional Steps to Analyze Regional Transmission Organizations‟ Benefits and Performance,
United States Government Accountability Office, Report to the Committee on Homeland Security and Governmental Affairs, U.S. Senate
(September 22, 2008), GAO-08-987 (http://www.gao.gov/new.items/d08987.pdf).
2011 ISO/RTO Metrics Report9
Information Provided
Following a brief summary of the operations and geographic scope of the reporting ISOs and RTOs, this report
provides information responsive to each of the FERC-proposed metrics. When applicable, the data and information are presented for the period 2006 through 2010.2
These metrics were organized by the FERC, and are presented here, in the categories of reliability, markets, and
organizational effectiveness. The reliability metrics provide information on compliance with and violations of national
and regional reliability standards; dispatch behavior; load forecast accuracy; long-term generation and transmission
planning; and planned outage coordination. Market metrics include pricing; rates for generator availability and forced
outages; statistics on congestion management charges and the amount of charges hedged through congestion
management markets; demand-response amounts as capacity and ancillary services; and the percentage of total
electric energy provided by renewable resources. Organizational effectiveness metrics include ISO/RTO
administrative charges to members compared to budgeted administrative charges and as cents per megawatt hour
(¢/MWh) of load served; customer satisfaction; and the scope and results of audits of billing controls.
Each ISO/RTO provides a brief overview of their region, their data on the FERC metrics and information to the extent applicable and available, and additional information on key initiatives specific to their regional activities.
Emerging Themes
The information provided in this report reinforces the value of ISOs and RTOs. The report illustrates the transparency of ISO/RTO operations and reinforces the value of ISO/RTO operation of the grid and administration of wholesale electricity markets. Specifically, this report shows that:
Balancing authority areas operated by ISO/RTOs function reliably; ISO/RTO organized markets are efficient;
ISO/RTOs are advancing public policy energy objectives; and
ISO/RTOs enable demand response and energy efficiency.
2 The reporting ISOs and RTOs submitted their 2010 ISO/RTO Metrics Report with data and analyses for the period 2005 through 2009 to FERC in December 2010.
2011 ISO/RTO Metrics Report10
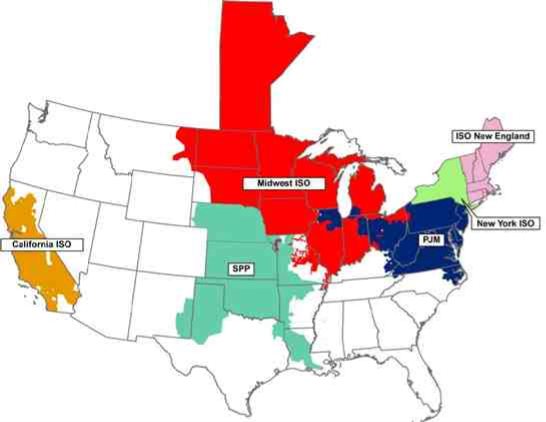
ISO/RTO Geography and Operations Statistics
The map and data below show to the location and breadth of operations for the ISOs/RTOs contributing to this report. These reference points will facilitate understanding some of the similarities and differences amongst the information of ISOs/RTOs in this report.
The table below summarizes the miles of transmission lines, installed generation, and population in each ISO/RTO
region.
ISO/RTOHeadquarters
CAISOFolsom, CA
ISO-NEHolyoke, MA
MISOCarmel, IN
NYISORensselaer, NY
PJMValley Forge, PA
SPPLittle Rock, AR
2011 ISO/RTO Metrics Report
InstalledMiles of
GenerationTransmission
(in megawatts)Lines
57,12425,526
32,0008,130
148,45657,453
37,41610,877
164,89556,499
66,17550,575
11
Population
(in millions)
30
14
42
19
54
15
Section 1 - Descriptions of Performance Metrics and Other Information
A. ISO/RTO Bulk Power System Reliability
All ISOs and RTOs are responsible for compliance with North American Electricity Council (NERC) mandatory
standards and any mandatory standards for the Regional Entities (RE) that apply in the region where the ISO/RTO is located and are subsequently adopted by NERC. The mandatory reliability standards only apply to ISO/RTOs based on the NERC functional model categories for which each ISO/RTO has registered.
Therefore, different reliability standards apply to different ISOs and RTOs. For example, each region may have
reliability standards that apply only within that region, given the particular infrastructure, resource mix, topographical and other differences that exist within the region. The main differences between the ISO/RTO applicable standards are the Regional Entity standards. Each region develops standards applicable for their infrastructure, environment and any other regional differences. Each ISO/RTO may also be registered for different functions, causing them to comply with different reliability standards.
Violations of such standards may be identified by an ISO/RTO and self-reported or may be identified by a NERC
and/or Regional Entity audit of the ISO’s/RTO’s standards compliance. Such violations can then be classified as low,
medium or high severity. This metric is a quantification of all NERC and RRO Reliability Standards violations that
have been identified during an audit or as a result of an ISO/RTO self-report and have been published as part of that
process.
Dispatch Operations
Compliance with CPS-1 and CPS-2
Each Balancing Authority (BA) is responsible for helping maintain the steady-state frequency in their interconnection within defined limits. The BAs do this by balancing power demand and supply in real-time. Under NERC standard BAL-001-0.1a - Real Power Balancing Control Performance, NERC has established standard measurements against which to monitor BA performance in meeting this responsibility. Each Balancing Authority (BA) shall achieve a
minimum compliance of 100% for Control Performance Standard 1 (CPS1) (rolling annual average) and a minimum compliance of 90% for CPS2 (monthly average).
CPS-1 (Control Performance Standard 1) is a statistical measure of ACE (Area Control Error) variability. This
standard measures ACE in combination with the Interconnection’s frequency error. It is based on an equation derived from frequency-based statistical theory. CPS-2 (Control Performance Standard 2) is a statistical measure of ACE magnitude. The standard is designed to limit a control area’s unscheduled power flows.
An alternative method of measurement is using the BAAL (Balancing Authority ACE Limit). The purpose of the BAAL
standard is to maintain interconnection frequency within a predefined frequency profile under all conditions, to
prevent frequency-related instability, unplanned tripping of load or generation, or uncontrolled separation or
cascading outages that adversely impact the reliability of the interconnection. This standard requires the balancing
2011 ISO/RTO Metrics Report12
authority to demonstrate real-time monitoring of ACE and interconnection frequency against associated limits and to
balance its resources and demands in real-time so that its ACE does not exceed the BAALs for a time greater than
30 minutes. In addition, this standard limits the recovery period to no more than 30 minutes for a single event.
Transmission Load Relief or Unscheduled Flow Relief Events
Transmission Loading Reliefs (TLRs) are a procedure used in the Eastern Interconnection to relieve potential or actual loading on a constrained facility. In the Western Interconnection, Responsible Entities are required to take actions as requested by Qualified Transfer Path Operators that result in the specified amount of Unscheduled Flow (USF) relief events for the applicable Qualified Transfer Path. The information provided in this section illustrates the TLR level 3 events or greater and UFR activity for each ISO/RTO from 2005 through 2009.
Energy Management System Availability
The Energy Management System (EMS) at each ISO/RTO performs the real-time monitoring and security analysis functions for the entire ISO/RTO region and includes inputs from portions of adjacent control areas. It includes a full complement of monitoring, generation control, state estimation and security analysis software. This metric measures the percentage of minutes each year that the ISO’s/RTO’s EMS was operationally available for use by the
ISO’s/RTO’s dispatch operations staff.
Load Forecast Accuracy
A load forecast is an informed estimate of the future electrical demand on the ISO/RTO’s system. Accurately
forecasting load is critical because the forecast drives the commitment of generation and/or demand response for
future periods. Inaccurate forecasting can manifest itself in either reliability problems (due to under-commitment of
resources) or in additional costs (due to either over-commitment of resources or inefficient commitment of short lead-
time resources).
Each of the ISOs/RTOs generates load forecasts in a number of different time periods ranging from years ahead to minutes ahead of the actual load period. This report focuses on the day-ahead load forecast for each ISO/RTO, as defined by that ISO/RTO. While there is some variation in the time of day in which each company’s day-ahead load forecast is created, the use of the forecasts is similar - this is the forecast used to make day-ahead unit commitments of resources. Since SPP does not have a day-ahead market, the prior day’s medium-term load forecast (MTLF) is used as the load forecast accuracy reference point.
Generally speaking, higher forecasting accuracy is good as it means that the actual load was closer to the forecast
load. The ISOs/RTOs are striving to improve load forecast accuracy. Mean Absolute Percentage Error (MAPE) is
commonly used in quantitative forecasting methods because it produces a measure of relative overall precision; the
lower the MAPE, the more precise the forecast. However, comparisons between regions can be difficult because the
load drivers vary significantly between regions. Also, results can change from one year to the next based on weather
conditions and variations in patterns of customer usage across all sectors of the economy. A sampling of the regional
variations includes:
2011 ISO/RTO Metrics Report13
Weather Patterns - Certain regions experience more extreme weather variations (e.g., storms patterns,
temperature swings). Generally, regions with more extreme weather variations would be expected to have
less accuracy in their load forecasts.
Industrial Loads - Certain regions have higher concentrations of variable industrial loads which can impact
the load forecasts. Generally, regions with variable industrial loads would be expected to have less accuracy
in their load forecasts.
Geography Diversity - Broader ISO/RTO geographies can lead to netting of potential forecast inaccuracies
in the ISO/RTO region for a more accurate total ISO/RTO region load forecast.
Presented in this section are load forecasting accuracy metrics and MAPE for the yearly average for all hours, the yearly average for the peak hour (the highest load hour) of each day, and the yearly average for the valley hour (the lowest load hour) of each day. In each case the metric is based on the simple average of the absolute difference between the forecasted load and the actual load divided by the forecasted load for all relevant hours.
Wind Forecasting Accuracy
This metric measures the accuracy of the wind generation forecast. The electric power industry will continue to see a significant increase in reliance on largely variable energy resources, such as wind and solar generating facilities. This transformation will impose challenges to operating the bulk power system because the magnitude and timing of
variable energy resources output is significantly less predictable than conventional generation. The ability to
accurately forecast variable energy resources output, therefore, becomes critical to manage uncertainty and maintain bulk power system reliability by facilitating the timely commitment and dispatch of sufficient supplemental resources. Wind forecasting is inherently less accurate than energy forecasting because the wind resource has much higher intrinsic variability than the factors which determine energy usage.
The objective of the chart in this section is to quantify the percentage accuracy of the actual wind generation
availability compared with the forecasted wind generation availability as of the close of the prior day’s day-ahead
market.
Unscheduled Flows
Unscheduled flows are energy flows on each ISO’s/RTO’s transmission interface (interties), defined as the difference between net actual interchange (actual measured power flow in real time), and the net scheduled interchange
(planned or pre-scheduled use of transmission). Unscheduled flow may be comprised of both inadvertent interchange and/or parallel flows.
Inadvertent interchange is relevant from an ISO/RTO perspective, not at the individual tie level. Inadvertent interchange is the difference between net actual interchange (actual power flow measured in real time), for all interties connecting the ISO/RTO with other Balancing Authority Areas within the interconnection.
Parallel flow (occasionally referred to as loop flow) is actual power flow within an interconnection that is generated
within one Balancing Authority Area for delivery directly to load within a second Balancing Authority Area along a
specified contract transmission path. In real time, ―parallel‖ transmission lines through a third party Balancing
2011 ISO/RTO Metrics Report14
Authority Area may partially be used because of the interconnection’s operating configuration, line resistance and physics. Parallel flow typically results in an un-scheduled flow of power, in on one intertie and out on another intertie through the third party Balancing Authority Area. Thus, parallel flow is a subset of unscheduled flow as it uses
unscheduled transmission capacity on the respective interties.
Such unscheduled flow may or may not be detrimental from both an operations and market administration
perspective depending on the direction of prevailing scheduled power flow on each intertie and the direction of the unscheduled flow. Unscheduled flow has the potential to cause path overloads if the power flow contributes to rather than counters the scheduled flow. Unscheduled flows contributing to actual power flow in excess of the system
operating limit adversely impacts scheduled use of the grid, resulting in the need to curtail schedules on the specific intertie and return actual path flows within the system operating limit.
To summarize, unscheduled flow typically has two components, inadvertent energy and parallel flows. Therefore,
unscheduled flow is not necessarily attributable to the ISO/RTO which has its transmission used in an unscheduled
manner by others, due to system resistance, physics and operating configuration. Parallel flow manifests as
unscheduled flow on a tie by tie basis, however, parallel flow ―nets out‖ when considered from a total Balancing
Authority perspective (summation of all ties), and does not contribute to inadvertent interchange. Inadvertent
interchange measures a Balancing Authority’s ability to properly ―cover‖ its load in real time, by regulating with
internal generation or scheduled imports and holding its planned net scheduled interchange through the operating
period.
The unscheduled flow charts in this section reflect the absolute value of the total terawatt hours of unscheduled flows for each ISO/RTO and the absolute value of the total terawatt hours of unscheduled flows for each ISO/RTO as a percentage of total terawatt hours of flows. This section also includes tables reflecting the terawatt hours of
unscheduled flows for the top five interfaces (or fewer if there are not at least five interfaces) for each ISO/RTO. Negative amounts represent unscheduled flows out of the ISO/RTO and positive amounts represent unscheduled flows into the ISO/RTO over the noted interface, except with respect to California ISO and ISO-NE, which have an opposite sign convention with imports being negative and exports being positive.
Transmission Outage Coordination
Centralized transmission outage coordination is an important function of ISOs/RTOs. Each ISO/RTO has procedures
by which planned transmission outages should be noticed to the ISO/RTO by the transmission owner. Then, the
ISO/RTO studies the planned transmission outage to determine whether such an outage request would create any
reliability concerns. Even after approving a transmission outage request, an ISO/RTO can cancel a planned
transmission outage if system conditions have changed such that an outage may create a reliability issue.
The four metrics in this section measure how promptly ISOs/RTOs are receiving planned transmission outage
requests, how effective each ISO/RTO is at processing transmission outage requests, how often each ISO/RTO
cancels previously-approved transmission outages, and the level of unplanned transmission outages in each
ISO/RTO region. Each of these measures addresses transmission lines greater than or equal to 200kV.
2011 ISO/RTO Metrics Report15
Transmission Planning
ISO/RTO’s take a long-term (generally 10 years or more) analytical approach to bulk power system planning with
broad stakeholder participation to address reliability and economic benefit at intra- and inter-regional levels. By
identifying system reliability and economic needs in advance, the planning process gives market participants time to
propose either a market-based solution (e.g., a merchant transmission line, power plant or demand response) or
regulated solution (e.g., a rate-based transmission line). Essential, large-scale transmission projects spanning the
service territories of multiple transmission system owners have been completed or initiated in every ISO/RTO in the
last 10 years. Supply-side resources and demand response, which are effectively integrated into the system, can
sometimes assist in the resolution of transmission reliability issues, thereby potentially allowing the deferral of
transmission solutions. However, creating new transmission solutions may be necessary to prevent supply-side
resources or demand resources from compromising the deliverability of other existing resources.
The identified transmission planning metric provides an indication of the progress made to address reliability needs
or economic opportunities early enough, to engage a broad set of stakeholders, and to successfully carry the projects
to completion.
Generation Interconnection
One important role ISO/RTO’s have is to facilitate unbiased and open access to all potential electric grid users. This function closely aligns with the transmission planning process, as ISO/RTO’s manage the analytical and
administrative processes of generation and transmission facility interconnections. This entails receiving
interconnection requests, conducting impartial, diligent technical analyses of the system reliability impact, individually and collectively, of their usage and interconnection to the grid, and determining and allocating the costs of
transmission upgrades to connect these facilities to the power system.
Average Generation Interconnection Request Processing Time
Generation interconnection is the process of connecting a generator to the electrical grid. When an entity is
proposing to build a new generation unit or upgrade an existing unit, they apply to the ISO/RTO that manages the
transmission access in that area to assess the availability of transmission capacity to export the energy from that new or upgraded generation facility. This performance metric measures the processing time for generation
interconnection requests from time of access application through the study period to the delivery of final answer on the requirements for connection of the proposed units - including any proposed transmission upgrade requirements and associated costs. This metric is calculated as the simple average of the number of days between when a
generation interconnection application is received and when the final application response is provided to the
requestor - for all responses provided during the calendar year.
Generally speaking, a shorter average study period is preferred. However, wide variation is expected between ISOs/RTOs on this metric. There are several drivers to this variation including:
Number of Applications - There is very wide variation in the number of generation interconnection
applications in the regions. In the past few years, wind-rich regions have received large numbers of
2011 ISO/RTO Metrics Report16
applications from wind generation developers. The number of applications has far outpaced any prior period and as a result has driven the redesign of the application and study processes in wind-rich regions.
Complexity of Applications - Applications requesting system upgrades to support the integration of
renewable resources increase the complexity of the application and thus increase the time required to
complete the study. Also, some wind generator manufacturers have been reluctant to provide detailed
models of their equipment, thus delaying studies and making it more difficult to complete accurate analyses.
Tariff Requirements - There is no consistent study period requirement in the various ISO/RTO tariffs and the
requirements continue to evolve to meet regional needs.
Planned and Actual Reserve Margins 2006 - 2010
Across the various ISO/RTO regions, generation planning reserve margin requirements are set by a variety of entities
(e.g., the ISO/RTO, the regional reliability organization, the state utility commission) normally based on a loss of load
study for the region. Once the standard is established, the generation or demand response resources required to
meet that standard is either committed (by the load serving entities in the region) or acquired (via capacity auction by
the ISO/RTO). This metric compares the planned reserve margin to the actual reserve margin for each region.
Generally speaking, an actual reserve margin at or slightly above the planned reserve margin is desired. An actual
reserve margin less than the planned reserve margin indicates an increase in potential reliability issues during peak
periods or periods of regional emergencies. Some ISOs/RTOs have implemented forward capacity markets which
utilize a variable resource requirement curve to procure capacity up to three years prior to the year for which it is
committed.
This section also discusses the participation of demand response resources in ISO/RTO capacity markets.
Percentage of Generation Outages Cancelled by ISO/RTO
Some ISOs/RTOs do not have the authority to approve planned generation outages, though California ISO does
evaluate and approve all planned generation outages. However, each ISO/RTO may cancel a planned generation
outage if the ISO/RTO assesses a reliability concern with commencing the generation outage. This measure reflects
the percentage of planned generation outages reported to each ISO/RTO that were cancelled by that ISO/RTO.
Generation Reliability Must Run Contracts
Periodically, a generation owner may notify an ISO/RTO that a generating unit is going to retire or be mothballed. The ISO/RTO will complete a reliability assessment of that planned retirement or mothballing. If the results of that study indicate the ISO’s/RTO’s customers cannot be served reliability without that generating unit, then the ISO/RTO may place the generating unit under a reliability must run (RMR) contract until generation and/or transmission
upgrades alleviate the identified reliability concern. The information under this topic reflects the number of generating units and the nameplate generating capacity of any generation units under RMR contracts.
2011 ISO/RTO Metrics Report17
Interconnection / Transmission Service Requests
ISOs/RTOs perform engineering studies of proposed new or upgraded generation to assess the potential
transmission system upgrades required for the incremental generation capacity to interconnect reliably to the
respective ISO’s/RTO’s transmission system. Also, ISOs/RTOs have the responsibility to review and approve or reject, based on the anticipated impact to reliability, requests for both transmission service.
The data in this section reflects the number of interconnection and transmission service requests received and
completed as well as the average aging of incomplete interconnection and transmission service requests and the
average time the ISO/RTO took to complete each study. This section also includes the average costs incurred by
each ISO/RTO to complete each type of engineering study related to an interconnection or transmission service
request.
Special Protection Schemes
The North American Electric Reliability Corporation defines a Special Protection System (SPS) as an automatic
protection system designed to detect abnormal or predetermined system conditions, and take corrective actions other than and/or in addition to the isolation of faulted components to maintain system reliability. Such action may include changes in demand, generation output, or system configuration to maintain system stability, acceptable voltage, or power flows. An SPS does not include (a) underfrequency or undervoltage load shedding or (b) fault conditions that must be isolated or (c) out-of-step relaying (not designed as an integral part of an SPS). A Special Protection System may also be referenced as a Remedial Action Scheme.
In comparison with planning and constructing new transmission facilities, SPSs can be placed in service relatively
quickly and inexpensively to increase power transfer capability. The identified SPS metric provides an indication as
the extent to which SPSs are relied upon in RTO regions, either on a permanent or interim basis until a transmission
planning solution can be implemented. This metric also indicates the effectiveness of SPS operations by indicating
the number of SPS activations in which the SPS operated as expected as well as number of SPS activations that
were not intended.
Though SPS data has been presented for 2010 solely, there have been no material changes in the SPS levels of the ISOs/RTOs in this report during the period 2006 through 2010.
2011 ISO/RTO Metrics Report18
B. ISO/RTO Coordinated Wholesale Power Markets
Organized markets offer diverse power products and services, as well as an array of markets that can be used to hedge against price risks. Because average real-time energy prices correlate to short-term forward bilateral prices, ISO/RTO markets foster forward contracting that can stabilize prices. Increased and more accurate price
transparency means better contract pricing.
By using advanced technologies and market-driven incentives, the commitment and dispatch of the generators within
regional markets is more efficient than those absent regional markets. The centralized market commitment and
dispatch allows the most cost effective unit in the region to be fully utilized before the next most cost effective unit,
etc. Also the market incentives motivate generation owners to keep their plants available particularly during peak
periods.
Security-constrained economic dispatch of generators performed by ISOs/RTOs also allows the transmission system to be more fully utilized and congestion to be managed on an economic basis as opposed to the strict ―rights‖ based Transmission Loading Relief methodology. ISOs/RTOs are well-equipped to analyze and actively manage the
reliability and economic considerations of congestion on the power grid and identify more efficient investment
opportunities for upgrades and new facilities.
Market Competitiveness
Each ISO’s/RTO’s independent market monitor (IMM) analyzes measures of market structure, participant conduct
and market performance to assess the competitiveness of the ISO’s/RTO’s markets. A subset of such measures
monitored by the IMMs is included in this section of the report - price cost markup, generator net revenues, and
required mitigation.
Price Cost Markup
Price cost markup percentages represent the load weighted average markup component of dispatched generation
divided by the load weighted average price of dispatched generation. The markup component of price is based on a
comparison between the price-based offer and the cost-based offer of each actual marginal unit on the system.
Relatively low price cost markup percentages are strong evidence of competitive behavior and competitive market
performance.
2011 ISO/RTO Metrics Report19
Generator Net Revenues
Net revenue quantifies the contribution to total fixed costs received by generators from ISO/RTO energy, capacity and ancillary service markets and from the provision of black start and reactive services. For ISOs without central capacity markets, these revenues do not include any revenues from bilateral capacity contracts. Net revenue is the amount that remains, after short run variable costs have been subtracted from gross revenue, to cover total fixed costs which include a return on investment, depreciation, taxes and fixed operation and maintenance expenses. Total fixed costs, in this sense, include all but short run variable costs.
When compared to total fixed costs, net revenue is an indicator of generation investment profitability and thus is a
measure of overall market performance as well as a measure of the incentive to invest in new generation and in
existing generation to serve ISO/RTO markets. Net revenue quantifies the contribution to total fixed costs received by generators from all markets in an ISO/RTO.
Although it can be expected that in the long run, in a competitive market, net revenue from all sources will cover the
total fixed costs of investing in new generating resources when there is a market based need, including a competitive
return on investment, actual results are expected to vary from year to year. Wholesale energy markets, like other
markets, are cyclical. When the markets are long, prices will be lower and when the markets are short, prices will be
higher.
As available for each ISO/RTO, the data in this section reflects the estimated generator net revenues per megawatt
year for a new entrant Combustion Turbine unit fueled by gas and for a new entrant Combined Cycle plant fueled by
natural gas.
Mitigation
The approach to market power mitigation in ISOs/RTOs has focused on market designs that promote competition (a structural basis for competitive outcomes) and on limiting market power mitigation to instances where the market structure is not competitive and thus where market design alone cannot mitigate market power. In ISO/RTO energy markets, this occurs generally in the case of local market power. When a transmission constraint creates the
potential for local market power, the ISO/RTO applies a structural test to determine if the local market is competitive, applies a behavioral test to determine if generator offers exceed competitive levels and applies a market performance test to determine if such generator offers would affect the market price.
ISOs/RTOs have clear rules limiting the exercise of local market power. The rules provide for the capping of offers
when conditions on the transmission system create a structurally noncompetitive local market (generally measured
by the three pivotal supplier test), when units in that local market have made noncompetitive offers and when such
offers would set the price above the competitive level in the absence of mitigation. Offer caps are set at the level of a competitive offer. Offer-capped units receive the higher of the market price or their offer cap. Thus, if broader market conditions lead to a price greater than the offer cap, the unit receives the higher market price. The rules governing
the exercise of local market power recognize that units in certain areas of the system would be in a position to extract uncompetitive profits, but for these rules.
2011 ISO/RTO Metrics Report20
The metric in this section reflects the percentage of generator unit hours prices were capped in the respective ISO’s/RTO’s real-time energy market due to mitigation.
Market Pricing
Market pricing includes three separate metrics: the average annual load-weighted wholesale energy prices for each
of the ISOs/RTOs, the fuel-adjusted wholesale prices and a breakdown of the components of wholesale total power
costs.
The first chart in this section shows the average annual load-weighted wholesale electricity energy spot prices in
ISOs/RTOs with no adjustment for fuel cost changes or for different fuel mixes in different regions. These prices
frequently do not reflect the prices actually paid by utilities and other load-serving entities to purchase power, as the
purchase prices may be set by longer-term contracts. The prices are the spot prices that are paid for power not
covered by such contracts or supplied by the load-serving entities’ own generation. Also, these prices do not reflect
all costs incurred to meet electric load, as load-serving entities may need to pay additional amounts for ancillary
services and capacity market charges, or may need to recover the cost of the generation they own and use to meet
all or a portion of their load.
The second chart in this section shows the average annual load-weighted wholesale electricity energy spot prices,
adjusted for changes in fuel costs. Fuel costs comprise the majority of the costs of providing power. These data are
useful for comparing spot prices within a given RTO over time, but not for comparisons across ISOs/RTOs. Because
the various ISOs/RTOs began operations at different points in time, they have different base years for the fuel
adjustments, making the figures non-comparable across ISOs/RTOs. The different ISOs/RTOs also use different
fuels or fuel mixes based for the fuel adjustment based on their different markets and generation mixes.
Changes in fuel-adjusted power prices within ISO/RTO areas, relative to the levels that would otherwise have
prevailed, reflect a number of factors including: the cost reductions made possible through security-constrained
economic dispatch, incentives for improved generator availability, investments in new more efficient generating units,
changes in relative fuel prices, changes in demand levels and retirement of uneconomic facilities. Fuel adjusted price
models are not complex and do not discount the impacts of fuel-price changes for normalizing costs. For instance,
small changes in fuel adjusted prices from year to year may be the result of uncertainty in the methodology, rather
than changes in the market fundamentals. In addition, the models and methodology used in each of the regions,
while applied consistently in each region, are unique. As such, the tables included in each of the chapters are
incomparable across the regions. The actions of individual market participants, acting under the decentralized
incentives of wholesale market pricing, have resulted in higher power-plant availability, lower outage rates, the
development of demand response programs, and new plant construction when and where needed, all of which have
contributed to lower power prices.
The last chart in this section breaks down the components of the wholesale power costs relative to the various tariffs
administered by each ISO/RTO. The breakdown may include the cost of energy, transmission, capacity, ancillary
products and the administrative costs of the ISO/RTO, and regulatory fees depending on the regional tariff structure.
Energy is typically the largest component, sometimes accounting for more than 70% of the wholesale cost.
2011 ISO/RTO Metrics Report21
Unconstrained Energy Portion of System Marginal Cost
The average, non-weighted, unconstrained energy portion of the system marginal cost measures the marginal energy price in dollars per megawatt hour exclusive transmission constraints and transmission losses.
Energy Market Price Convergence
Good convergence between the day-ahead and real-time prices is a sign of a well-functioning day-ahead market.
Since the day-ahead market facilitates most of the energy settlements and generator commitments, good price
convergence with the real-time market helps ensure efficient day-ahead commitments that reflect real-time operating
needs. In general, good convergence is achieved when participants submit price-sensitive bids and offers in the day-
ahead market that accurately forecast real-time conditions. The two charts below reflect the absolute value and
percentage of the average annual difference between real-time energy market prices and the day-ahead energy
market prices. Data on price convergence in this section does not include SPP, because SPP does not operate a
day-ahead energy market.
Better convergence is indicated by a smaller dollar spread or a smaller percentage difference. Although day-ahead and real-time price differences can be large on an hourly or daily basis, it is more valuable to evaluate convergence over longer timeframes. Participants’ day-ahead market bids and offers should reflect their expectations of market conditions on the following day, but a variety of factors can cause real-time prices to be significantly higher or lower than expected. While a well-performing market may not result in prices converging on a daily basis, it should lead prices to converge well on an annual basis.
Differences between ISO/RTO regions can be driven by several factors including differences in transmission congestion, market rules, virtual market participation and concentration of intermittent resources.
Congestion Management
Congestion occurs when the physical limits of a line, or inter-tie, prevent load from being served with the least cost energy. The costs associated with congestion can be hedged by load serving entities with financial rights available through an ISO/RTO. To assess the performance of an ISO/RTO with respect to the cost of congestion it is important to first quantify the total costs with respect to load served in the system and second to quantify the percentage of congestion costs that were hedged by load served in the system.
The first congestion measure is calculated as the annual congestion costs of each ISO/RTO region divided by the megawatt hours of load served in that ISO/RTO. The second measure is calculated as the percentage of congestion revenues paid divided by the actual congestion charges. While nominal congestion charges may vary from year-to-
year, congestion hedging rights at ISOs/RTOs provide an opportunity for market participants to hedge their exposure to congestion charges before such congestion occurs.
2011 ISO/RTO Metrics Report22
Resources
Generator Availability
Competitive wholesale power markets have provided incentives for generation owners to take actions to achieve
higher power plant availability and lower forced outage rates, particularly during peak demand periods. This has
reduced the cost of producing electricity. The first chart in this section shows the actual average annual generator
availability for each ISO/RTO calculated as one minus the Equivalent Demand Forced Outage Rate. This is a
measure of generator responsiveness when the generator owner has indicated the generation should be available.
It is important to note that another advantage of ISO/RTO coordinated wholesale power markets is that more
accurate data on unit deliverability and performance is required in order to participate in resource adequacy markets
or constructs. This includes rigorous testing and measurement and verification requirements for units that traditionally
have not provided performance data or testing results. This increased scrutiny and data accuracy, in order to ensure
an ―apples to apples‖ comparison, must be measured over time and during periods when ISO/RTO standards
applied.
Demand Response Availability
A tool available to ISOs/RTOs to balance customer demand and available generation is to call upon committed
Demand Response resources to reduce customer demand in times of high usage. Some ISOs/RTOs have begun to
test the availability of Demand Response resources, even if those resources were not called upon by the ISO/RTO.
Where data is available, the second chart in this section shows what percentage of committed Demand Response
resources were either available when called upon by the ISO/RTO or were available via testing performed by the
ISO/RTO.
Fuel Diversity
Fuel Diversity is the mix of fuel types installed and available (capacity) or used (generation) to produce electricity in
each ISO/RTO. The breakdown among ISOs/RTOs is expected to vary widely, due to the availability of resources in
the area, along with political, economic and environmental factors associated with producing electricity from various
fuel types.
Renewable Resources
ISOs/RTOs accommodate and facilitate the development of renewable resources, including wind, solar, hydro,
geothermal and biomass. In recent years, many states within ISO/RTO regions have established renewable portfolio standards that stimulate investment in renewable generation. Several ISOs/RTOs have experienced rapid
development of intermittent renewable resources such as wind generation. Further accelerated development is
expected as the state renewable requirements ramp up and may gain further momentum if proposed federal
requirements are implemented. ISOs/RTOs are facilitating the integration of renewable resources through advances in system planning, system operations and market operations.
2011 ISO/RTO Metrics Report23
Key benefits that ISOs/RTOs provide for the integration of renewable resources, such as wind generation, are onestop shopping for interconnection to the system, access to a spot market for energy, reliance on financial
mechanisms such as financial transmission rights and day-ahead market schedules to define transmission system entitlements, and coordination of dispatch over a broad region with many dispatchable resources.
This performance metric measures the installed renewable capacity (MWs) as a percentage of total capacity (MWs) and renewable energy production (MWhs) as a percentage of total energy (MWhs). For purposes of the charts in this section, renewables are defined to include wind, wood, methane, refuse and solar.
Some jurisdictions consider hydroelectric power to be a type of renewable generation and some distinguish between small and large hydroelectric generating units. Data on total energy from hydroelectric power (including pumped storage) is included in the charts in this section.
The renewable and hydroelectric capacity data is based on either generator nameplate capacity, which is the
maximum rated output of a generator under conditions designated by the manufacturer, or based on seasonal ratings
as a result of capability audits by the regional ISO/RTO. Also included in this section are charts showing data on
capacity from renewable and hydroelectric power resources. The capacity data is based on generator nameplate
capacity, which is the maximum rated output of a generator under conditions designated by the manufacturer.
The results between ISOs/RTOs are expected to vary widely, because the growth of renewable resources in each region will be driven largely by the availability of the renewable resources in the area and the economics associated with harnessing that resource.
2011 ISO/RTO Metrics Report24
C. ISO/RTO Organizational Effectiveness
The members of ISOs/RTOs are looking for services to be rendered by the ISO/RTO in a cost effective manner while addressing members’ needs and billing transactions accurately. The data in this section reflect those three aspects of how well each ISO/RTO is managing these objectives.
ISO/RTO Administrative Costs
Administrative costs are costs associated with carrying out the services and responsibilities to members and
customers under each entity’s FERC approved tariff. The ISO/RTO is entitled to recover 100% of its total expenses through this charge up to specified caps per megawatt hour (MWh) for all service under the tariffs or a dollar cap for the total revenue requirement in the case of the California ISO.
The costs are comprised of budgeted capital investment (capital charges, debt service, interest expense,
depreciation expense), as applicable to each ISO/RTO’s budgeting practice and operating and maintenance
expenses, net of miscellaneous Income. The metrics compare annual actual costs incurred by the ISO/RTO to the approved administrative fees and budgeted costs (net revenue requirement). Generally speaking, a percentage of actual expenses to budgeted expenses as close to 100% as possible is favorable. On an annual basis a small variance from 100% means that the ISO/RTO is forecasting the financial needs of the organization and effectively managing the business to the budget. Taking a longer term view will provide a trend analysis that indicates the relative stability of the organizations’ cost performance.
The first chart in this section reflects each ISO’s/RTO’s actual non-capital expenses as a percentage of their respective approved budgets. Specifically, the comparison below includes compensation, non-employee labor, technology expenses, etc. but excludes depreciation, interest, and debt service costs.
The second chart in this section reflects each ISO’s/RTO’s actual recovery of capital investment costs as a
percentage of their respective approved budgets for capital investment costs. The majority of ISO/RTO capital
investment relates to the hardware and software used to support ISO/RTO reliability and market administration
functions.
The third chart in this section includes each ISO’s/RTO’s total administrative charges per megawatt hour of load
served.
Customer Satisfaction
Customer satisfaction is a standard indicator of performance used in most industries, including the electric power
industry and by each ISO/RTO. Customer satisfaction indicators are used by the ISOs/RTOs to better understand the
customer satisfaction landscape and to develop specific actions in response to customer feedback. Although
numerical customer satisfaction indicators are useful in determining general areas for possible improvements, the
detailed responses provided by each ISO/RTO member afford the greatest information for developing action plans. It
is this action-planning phase where the value lies in any customer satisfaction program, not simply in the numerical
assessment of overall performance. This is why each ISO/RTO asks its own set of unique questions of its customers.
2011 ISO/RTO Metrics Report25
Billing Controls
One significant ISO/RTO function is processing and issuing timely and accurate bills to its members for transmission
service, market transactions and associated fees. In order to enhance customer confidence in the ISO/RTO controls
surrounding these billing processes and to assist public companies that are ISO/RTO members, each ISO/RTO in
this report has committed to independent audits of their billing functions under Statement of Auditing Standard 70
(SAS 70).
There are two types of SAS 70 audits: Type 1 audits which assess the adequacy of the control design and Type 2
audits which both review the adequacy of the control design and whether the controls are being followed. The table in this section that summarizes the type of SAS 70 audit undertaken by each ISO/RTO and what type of opinion was issued by the independent auditor for each year’s SAS 70 audit.
An unqualified opinion indicates that the independent auditor found the control objectives for each of the areas
covered by the audit to be adequately designed and operated for the audit period. A qualified opinion means the
independent auditor found the design and/or the operation of one or more of the control objectives inadequate.
Specific inadequate control objective(s) are identified; the remaining control objectives covered by the audit are
deemed adequate.
2011 ISO/RTO Metrics Report26
California Independent System
Operator Corporation (California ISO)
2011 ISO/RTO Metrics Report27
Section 2 - California ISO Performance Metrics
The California ISO strives to be a world-class electric transmission organization built around a globally recognized and inspired team providing cost-effective and reliable service, well-balanced and transparent energy market
mechanisms and high-quality information for the benefit of our customers. Our company was created in September 1996 as a nonprofit public benefit corporation with the passage of California Assembly Bill 1890 that restructured the state’s power market following the passage of the federal Energy Policy Act of 1992, which introduced competition into the wholesale market. The California ISO incorporated in May 1997 and in March 1998 began serving 80 percent of the state, or 30 million people, with the purpose of managing the state’s transmission grid, facilitating the spot
market for power and performing transmission planning functions.
The California Power Exchange operated the state’s competitive wholesale power market and customer choice
program until the 2000-2001 energy crisis forced it into bankruptcy in January 2001. The exchange ultimately ceased
operation leaving the state without a day-ahead energy market until the ISO opened a nodal market in spring 2009.
During and immediately after the energy crisis, the ISO began addressing underlying infrastructure challenges —
specifically transmission and generation deficiencies — and, with FERC approval, started a comprehensive market
redesign and technology upgrade program. State regulators implemented a resource adequacy obligation in 2004
that prevents under-scheduling so that utilities now must procure in advance 100 percent of their total forecast load
as well as an additional 15 percent margin. Approximately 20,000 megawatts of mainly gas-fired generation have
been built in California since the energy crisis. In 2010, developers added approximately 500 MW of renewable
generation to the system. The ISO remains focused on interconnecting a significant amount of proposed renewable projects. In addition, the ISO has studied and approved significant transmission expansions, including the critical Path 15 link between southern and northern California, as well as enough upgrades (under current conditions) to meet the state’s 33 percent renewables portfolio standard.
The new ISO market design includes a day-ahead market, locational marginal pricing and a full network model of the
grid that analyzes day-ahead energy schedules and potential choke points on the system before they occur. The new
fully integrated forward market allows the ISO to manage the right mix of energy, standby power and transmission
capacity to meet demand in three time frames — day ahead, hour ahead and real time. The new market’s locational
marginal pricing feature reflects the true cost of delivering power, including the cost to deliver power to those areas
with transmission constraints, better enabling the ISO and load serving entities to run the right power plants to meet
local needs. This pricing approach also provides more granular information about the areas that can benefit most
from new infrastructure, which gives developers better information on which to base their economic decisions.
Since the ISO implemented the nodal market in 2009, wholesale energy costs and ancillary services costs have
declined, in part because of better optimization of the system, greater market liquidity, lower demand and lower
natural gas prices. The new market allows generators to bid all their output into the energy and ancillary services
markets at the same time. This increases the supply of bids, enabling the market software to find the most cost-
effective way to use each unit’s capacity. The frequency of mitigating suppliers’ bids and the impact on prices has
2011 ISO/RTO Metrics Report28
been generally low and dropped significantly in the day-ahead market during 2010 according to the ISO’s
Department of Market Monitoring. The new market also reflects increased activity as annual billings have
dramatically risen. Contributing to this robust activity is the new day-ahead market optimization approach, which has created additional opportunities for buying and selling, as has the introduction of new market products.
Since implementing the new market, the California ISO has been taking strategic steps to identify where to add
market functionality or refine the market functions that already exist. In 2009 and 2010, the ISO delivered several
major market enhancements that facilitate the participation of emerging technologies and demand resources in
wholesale markets. In addition, the ISO has focused on ensuring reliable integration of the resources necessary to
meet California’s energy policies by making comprehensive changes to its transmission planning and interconnection
processes. This year, California Governor Jerry Brown signed into law a renewable portfolio standard that requires
load-serving entities to deliver 33 percent of their electricity from renewable resources by the year 2020. Renewables
integration touches nearly all of the core functions of the ISO, including operations, markets and infrastructure
requirements. While several states are pursuing their own renewables goals, California is recognized as a leader in
developing the rules and processes that enable the electric industry to build clean power plants and the transmission
to deliver renewable energy. To this end, the ISO has approved major transmission projects, including the
unprecedented Tehachapi Renewable Transmission Project and Sunrise Powerlink as well as other transmission
upgrades (e.g., reconductoring projects) that have the capacity to handle the influx of thousands of megawatts of
renewable energy.
2011 ISO/RTO Metrics Report29


A. California ISO Bulk Power System Reliability
The California ISO has submitted registrations under the Reliability Functional Model of the North American Electric Reliability Corporation. This model defines the set of functions that must be performed to ensure the reliability of the bulk electric system. NERC’s reliability standards establish the requirements of the responsible entities that perform the functions defined in this model. The table below identifies which NERC Functional Model registrations the
California ISO has submitted as of the end of 2010. The Regional Entity for the ISO is the Western Electricity
Coordinating Council (WECC).
At this time, WECC is the Interchange Authority and Reliability Coordinator for the Western Interconnection.
Typically, transmission owners serve as Transmission Planners and load-serving entities serve as Resource
Planners. The ISO performs its Planning Authority functions in accordance with its FERC approved Order No. 890 compliant tariff. As the Planning Authority, much of the ISO’s core function involves transmission expansion planning related activities, most notably producing the annual California ISO Transmission Plan.
Neither NERC nor FERC published any reliability standard violation for the California ISO during the 2006-2009
period covered by this report. On February 1, 2010, however, NERC published a Notice of Penalty recommending a $0 penalty with a sanction letter for an incident self-reported by the California ISO on November 30, 2007. This
incident, which took place on October 2, 2007, related to possible noncompliance with IRO-STD-006-0 for a
deficiency of providing off-path curtailments of 2.6 MW and 1.7 MW on a 2900 MW rated path. The recommendation was accepted by FERC in a notice dated March 3, 2010.
NERC Functional Model Registration
Balancing Authority
Interchange Authority
Planning Authority
Reliability Coordinator
Resource Planner
Transmission Operator
Transmission Planner
Transmission Service Provider
California
ISO
2011 ISO/RTO Metrics Report30
Dispatch Operations
Balancing authority areas must maintain interconnection frequency within defined limits by balancing power demand and supply in real time. This requirement is measured by Control Performance Standards 1 and 2. Balancing
authority areas are required to maintain compliance of at least 100 percent for CPS-1 over a 12-month period. The California ISO has complied with CPS-1 for each of the calendar years from 2006 through 2010, having exceeded the minimum standard in each of the five years during this period.
California ISO CPS-1 Compliance 2006-2010
200%
180%
160%
140%
120%
100%
80%
20062007200820092010
Balancing authority areas are also required to maintain compliance of at least 90% for CPS-2 during each month in a
12-month period. The California ISO complied with CPS-2 from 2006 through February 2010. Effective March 1,
2010, the ISO began participating in the Reliability Based Control (RBC) proof-of-concept field trial that includes a
waiver from CPS-2 requirements. See, http://www.nerc.com/filez/standards/Project2010-
14_Balancing_Authority_RBC-RF.html. Therefore, the chart below only reflects CPS-2 compliance for the months of
January and February in the 2010 record period.
California ISO CPS-2 Compliance 2006-2010
100%
95%
90%
85%
80%
20062007200820092010
2011 ISO/RTO Metrics Report31
The California ISO is the path operator for Path 66 - the California Oregon Intertie. California ISO data reflects the
number of unscheduled flow relief events from June 18, 2007 through December 31, 2010. These events included (1) ―no impact‖ events (i.e., no tag curtailment actions required); (2) on path tag curtailment actions only; and (3) on and off path tag curtailment actions. The large variability in ISO events during this period is primarily attributable to
substantially different annual hydro and system conditions throughout the Western Interconnection.
California ISO Transmission Load Relief or Unscheduled Flow Relief Events 2007-2010
2,000
1,500
1,000
500
0
2007200820092010
The California ISO maintains an energy management system to perform real-time monitoring. Availability is measured as the percentage of hours that the energy management system is operationally available.
California ISO Energy Management System (EMS) Availability
100%
95%
90%
85%
80%
20062007200820092010
2011 ISO/RTO Metrics Report32

Load Forecast Accuracy
A significant portion of the load in California is centered along the coast in the areas around San Francisco, Los
Angeles and San Diego. During the summer period, particularly during peaks, these regions can experience
significant changes in temperature from what was predicted in the day-ahead timeframe because of the sudden and intense marine influence of the Pacific Ocean. On average, the ISO day-ahead load forecast from a reference point of 9:00 a.m. is 98% accurate. Prior to the day-ahead market that started on April 1, 2009, the load forecast was not used by the ISO to make market commitments and therefore the results are not reported. The data structure prior to that date was also different so the results are not directly comparable.
California ISO Average Load Forecasting Accuracy 2009 - 2010 (1)
100%5%
4%
95%
3%
90%
2%
85%
1%
80%0%
20062007200820092010
Mean Absolute Percentage Error
(1)California ISO data represents the period April 1, 2009 through December 31, 2010.
2011 ISO/RTO Metrics Report33


California ISO Peak Load Forecasting Accuracy 2009-2010 (1)
100%5%
4%
95%
3%
90%
2%
85%
1%
80%0%
20062007200820092010
Mean Absolute Percentage Error
(1) California ISO data represents the period April 1, 2009 through December 31, 2010
California ISO Valley Load Forecasting Accuracy 2009-2010 (1)
100%5%
4%
95%
3%
90%
2%
85%
1%
80%0%
20062007200820092010
Mean Absolute Percentage Error
(1)California ISO data represents the period April 1, 2009 through December 31, 2010.
2011 ISO/RTO Metrics Report34
Wind Forecasting Accuracy
The California ISO has forecasted output from wind resources since 2007 and improved its wind forecast accuracy to manage increasing penetration of these resources to meet California’s renewables portfolio standard. The data
reported below for 2006 through 2009 uses the mean absolute error percentage, which is a method that the ISO believes softens the true error in forecasting by smoothing out the positive and negative deviation spikes that may occur during power production. For 2010, the ISO used the root mean square error to evaluate performance. The ISO believes this method is superior because it does not cancel out positive and negative deviations from different intervals and, therefore, does not mask deviation magnitudes over a large sample. This approach more accurately represents the variance between forecast and actual energy production.
California ISO Average Wind Forecasting Accuracy 2007-2010
100%
95%
90%
85%
80%
75%
70%
65%
60%
55%
50%
20062007200820092010
2011 ISO/RTO Metrics Report35
Unscheduled Flows
The ISO transmission system is part of the Western Interconnection, which is a geographically large, circular 345/500
kV AC system that inherently has loop flow attributable to the use of contract path historical transmission rights as
opposed to a power flow solution dispatch methodology. The absolute value of unscheduled flow as a percentage of
total flows reported by the ISO is sufficiently insignificant such that it does not register on the second chart below.
California ISO Absolute Value of Total Unscheduled Flows 2006-2010
(terawatt hours)
120
100
80
60
40
20
0
20062007200820092010
2011 ISO/RTO Metrics Report36
California ISO Absolute Value of Unscheduled Flows
as a Percentage of Total Flows 2006-2010
45%
40%
35%
30%
25%
20%
15%
10%
5%
0%
20060.08%
20070.01%
20080.01%
20090.01%
20100.04%
20062007200820092010
The table below reflects terawatt hours of unscheduled flows for the top five California ISO interfaces. Positive
amounts represent unscheduled flows out of the ISO and negative amounts represent unscheduled flows into the
ISO, which is the standard in the Western Interconnection.
California ISO Unscheduled
Flows by Interface
Arizona Public Service Co.
Bonneville Power Administration
Los Angeles Department of Water
and Power
Sacramento Municipal Utility District
Salt River Project
2011 ISO/RTO Metrics Report
(terawatt hours)
20062007200820092010
(3)(3)(3)(3)(3)
11011
(7)(8)(10)(10)(10)
(2)(3)(2)(2)(2)
34444
37
Transmission Outage Coordination
This group of metrics looks at whether long duration outages are submitted well in advance so the California ISO
may better plan for reliable and efficient operations. There are many variables involved in performing an outage
study. Most studies can be performed in the time allowed for planned outage submission, but some outages and
combinations of outages can result in more complex studies that require additional time to complete and validate.
Therefore, not having 100% of the planned outages studied within established timeframes is not necessarily
indicative of a failure.
ISO timeframes for approving outages changed with the introduction of the new market design in April 2009. Since that time, outages need to be studied prior to the day-ahead market. In addition, several of the metrics reference a specific voltage level for the outage that could not be systematically determined until an advanced grid topology tool was put in place concurrent with the new market. Accordingly, comparable data is not available for years 2005-2008, and only the period since April 2009 is reported here.
The first metric measures transmission owner performance, not ISO performance.
California ISO Percentage of > 200kV planned outages of 5 days or more that are submitted to ISO/RTO at
least 1 month prior to the outage commencement date 2009-2010
100%
80%
60%
40%
20%
0%
20062007200820092010
The second metric measures compliance with established timeframes; however, as discussed above, the study of a planned outage involves numerous factors and the failure to meet established timeframes in any specific instance does not necessarily equate with any shortcoming of the California ISO. For this metric, no voltage level is specified and the ISO was able to review four years of data.
2011 ISO/RTO Metrics Report38
California ISO Percentage of planned outages studied in the respective ISO/RTO Tariff/Manual established
timeframes 2007-2010
100%
80%
60%
40%
20%
0%
20062007200820092010
The third metric measures how frequently the ISO cancelled previously approved transmission outages. Such
cancellations may occur only if there has been some system or unforeseen weather event in which an approved
transmission outage would cause a reliability concern. It may also indicate whether approval of an outage was based on inaccurate or incomplete information.
California ISO Percentage of > 200 kV outages cancelled by ISO/RTO after having been previously approved
2009-2010
2.50%
2.00%
1.50%
1.00%
0.50%
0.00%
20062007200820092010
2011 ISO/RTO Metrics Report39
The fourth metric measures the frequency of unplanned outages. California ISO data for unplanned outages only
includes outages where the outage start time is prior to the reporting time, and therefore does not include imminent outages where the outage reporting time is prior to the outage start time. The ISO also considers such an occurrence to be an unplanned outage.
California ISO Percentage of unplanned > 200kV outages 2009-2010
30%
25%
20%
15%
10%
5%
0%
20062007200820092010
2011 ISO/RTO Metrics Report40
Transmission Planning
The California ISO conducts transmission planning based on a compliant Order No. 890 process and adherence to NERC, WECC, and ISO planning standards. Annually, the ISO performs a variety of technical studies, such as short and long-term reliability assessments, economic planning assessments, and other key studies that are needed to support the markets and ensure a reliable and secure transmission infrastructure. Since implementing its Order No. 890 compliant process, the ISO completed a reliability assessment in 2008 and reliability and economic assessments in 2009 and 2010. During 2010, the Commission approved ISO tariff reforms to modify its planning process to better address state mandated renewable integration requirements. Under this reformed process, the ISO will continue to perform reliability and economic assessments as it has done in previous plans.
California ISO Number of Transmission Projects Approved to be Constructed for Reliability Purposes
2006-2010
550
500
450
400
350
300
250
200
150
100
50
0
20062007200820092010
2011 ISO/RTO Metrics Report41
California ISO Percentage of Approved Construction Projects Completed
100%
80%
60%
40%
20%
0%
20062007200820092010
Generation Interconnection
In 2008, the California ISO replaced its large generation interconnection serial study process with a more efficient group study or clustering approach for interconnection requests. By using a cluster study approach, the ISO and participating transmission owners can evaluate the large volume of interconnection requests more quickly. The
process includes two cluster windows each year for submitting interconnection requests and a two-phased
interconnection study process. The first group to go through the process (the transition cluster) just completed the Phase II Study process. The annual data below reflects the number of days required to complete interconnection requests in the ISO’s interconnection queue. The ISO expects the processing time of interconnection studies to drop significantly in 2011 under the new cluster study approach. The reported data does not reflect 2006 information, which was subject to a different interconnection study process under the ISO’s tariff.
California ISO Average Generation Interconnection Request Processing Time 2007-2010
1,000
800
600
400
200
0
20062007200820092010
2011 ISO/RTO Metrics Report42
Reserve Margin
The California ISO’s 15 percent planning reserve margin is based on the California Public Utilities Commission’s resource adequacy program. That program requires load-serving entities to demonstrate they have acquired the capacity needed to serve the 1-in-2 forecast of retail customer load plus a 15-17% reserve margin. As part of this program, the ISO accounts for the California Public Utilities Commission’s approved monthly demand response amounts as capacity resources.
California ISO Planned Reserve Margin 2006-2010
40%
35%
30%
25%
20%
15%
10%
5%
0%
20062007200820092010
Bars Represent Planned Reserve Margins
Demand Response Capacity
The California ISO uses the California Public Utilities Commission’s methodology for determining the resources that count as demand response capacity, and the performance expected from such resources when called.
2011 ISO/RTO Metrics Report43
California ISO Demand Response Capacity as Percentage of Total Installed Capacity 2006-2010
12%
10%
8%
6%
4.30%
4%
2%
0%
20062007200820092010
Percentage of Generation Outages Cancelled by California ISO
In 2010, the percentage of generation outages cancelled by the California ISO was 0.07%.
1.00%
0.50%
0.00%
20062007200820092010
Generation Reliability Must Run Contracts
The capacity under reliability must run (RMR) contracts was greatly reduced in 2007 when resource adequacy
provisions established by the California Public Utilities Commission became effective and contracting under the
resource adequacy program provided an alternative to RMR contracting. Capacity procured under resource
adequacy now provides the California ISO with much of the local capacity needed for reliability purposes. The
2011 ISO/RTO Metrics Report44
amount of RMR capacity continues to decline as existing RMR units are retired after being replaced with new units or electrical system improvements. In 2010, the ISO noticed the termination of RMR contracts for 2011 with both the South Bay Power Plant in San Diego, California and Potrero Power Plant in San Francisco, California.
These changes have allowed the California ISO to further reduce costs by releasing a significant amount of generation under RMR contracts without undermining local reliability.
California ISO Number of Generating Units under RMR Contracts
100
90
80
70
60
50
40
30
20
10
0
20062007200820092010
California ISO Capacity (MW) under RMR Contracts
12,000
10,000
8,000
6,000
4,000
2,000
0
20062007200820092010
2011 ISO/RTO Metrics Report45
Interconnection / Transmission Service Requests
The California ISO recently completed the transition cluster study process as part of a reform effort that began in
2008 to transition from a serial study process to a cluster study process. The ISO anticipates ongoing improvements in its ability to process generator interconnection requests. The following tables reflect the number of studies
requested and how many were completed, as well as the average aging of studies and the time required to complete studies within the generator interconnection process. In its current cluster window, the ISO has received a large volume of requests to interconnect renewable generation.
California ISO Number Studies Requested 2006-2010
500
450
400
350
300
250
200
150
100
50
0
20062007200820092010
2011 ISO/RTO Metrics Report46
California ISO Number of Studies Completed 2006-2010
700
600
500
400
300
200
100
0
20062007200820092010
California ISO Average Aging of Incomplete Studies 2006-2010
800
700
600
500
400
300
200
100
0
20062007200820092010
2011 ISO/RTO Metrics Report47
California ISO Average Time to Complete Studies within the Interconnection Process 2006-2010
800
700
600
500
400
300
200
100
0
20062007200820092010
Special Protection Schemes
For 2010, the California ISO had 65 special protection schemes that apply to facilities over 100 kV. Prior to 2010, participating transmission owners in the ISO balancing authority area reported special protection schemes that applied to facilties over and under 100 kV.
2011 ISO/RTO Metrics Report48
B. California ISO Integrated Wholesale Power Markets
Market Competitiveness
The California ISO’s market design relies upon a high level of self-supply and forward-contracting by load-serving entities as a means of mitigating system-level market power. This is consistent with California Public Utilities
Commission policies designed to ensure that the state’s major utilities are hedged for a large portion of their energy supply needs. The potential for market power on a system level basis is addressed by an energy bid cap. In 2010, the maximum energy bid price rose to $1000 per MWh. During 2009, the California ISO also had a cap of $2,500 per MWh on market prices. This market price cap was eliminated starting in April 2010.
Ownership of generation resources within most transmission constrained load pockets of the system remains
concentrated under one or two major suppliers. Therefore, the new market design includes more stringent provisions for mitigation of local market power. These local market power mitigation provisions are similar to the approach
employed by PJM Interconnection. Under this approach, units that must be dispatched to provide additional
incremental energy to relieve transmission constraints deemed to be non-competitive may have their market bids lowered based on a default energy bid, which reflects the unit’s actual marginal operating costs.
California ISO Price Cost Markup
The California ISO estimates the price-cost mark-up for its wholesale market by comparing total estimated wholesale energy costs to costs that would result under competitive baseline prices. The ISO estimates these competitive
baseline prices by re-simulating market outcomes after replacing market bids for gas-fired generation with bids
reflective of the unit’s actual marginal costs.
The table below summarizes the results for the period 2006-2010. California ISO’s wholesale markets have been competitive during this period with a price-cost mark-up reflecting a clear downward trend. In 2010, the price-cost mark-up was negative 2.1 percent.
The price-cost markup and other analysis reflect that prices under the ISO’s new market design have remained
extremely competitive in 2009 and 2010. However, direct comparisons with the price-cost markups reported in
previous years are problematic because of the different way in which the price-cost markup is calculated under the
new market. Specifically, since there was no formal forward energy market in previous years, market costs were
estimated based on a variety of different bi-lateral price indices and cost estimates. With the new market design, the
ISO can estimate these costs based on actual prices from the day-ahead and real-time energy markets. The ISO has
also modified the method used to calculate the competitive baseline price under the ISO’s new market design. It is
now based on a more detailed re-simulation of the market compared to the method used in prior years.
The extremely low price-cost mark-up calculated under the new methodology may also reflect increased efficiencies of the ISO’s new market design, rather than increased competitiveness.
2011 ISO/RTO Metrics Report49
California ISO Price-Cost Mark-up: 2006-2010
15%
10%
5%
0%
-5%
-10%
-15%
20062007200820092010
California ISO Generator Net Revenues
Results for a typical new combined cycle and combustion turbine unit are shown below. The significant increase in new generation costs in 2009 can be largely attributed to cost increases in capital and financing as well as taxes. These cost estimates are based on surveys and third-party research reflecting a more current sampling of costs incurred by builders and investors in new generation as compared to data from the California Energy Commission’s (CEC) 2007 Integrated Energy Policy Report used in this analysis in prior years.
The 2009 and 2010 results for a typical new combined cycle unit show a substantial decrease in net revenues
compared to 2008 net revenues. These net revenue estimates for a hypothetical combined cycle unit fall substantially
below the $191/kW-yr annualized fixed cost estimated provided by the CEC. The decrease in net revenues can
largely be attributed to the decrease in spot market gas market prices and the resulting decrease in electric prices. It
may seem counterintuitive that lower gas prices would decrease net revenues for a new gas resource. However,
older less efficient gas units are often the marginal resources setting prices in the market. Lower gas prices allow
these less efficient units to capture revenues that would otherwise be paid to newer, more efficient generation.
2011 ISO/RTO Metrics Report50
California ISO New Entrant Gas-Fired Combined Cycle (CC) Net Generation Revenues 2006-2010
(dollars per installed megawatt year)
$150,000
$100,000
$50,000
$0
20062007200820092010
California ISO New Entrant Gas-Fired Combustion Turbine (CT) Net Generation Revenues 2006-2010
(dollars per installed megawatt year)
$150,000
$100,000
$50,000
$0
20062007200820092010
2011 ISO/RTO Metrics Report51
California ISO Bid Mitigation
Mitigation of a unit’s market bids is triggered only when a unit is actually required to operate or run at a higher level
due to network constraints previously deemed non-competitive. If a unit is subject to bid mitigation, the unit’s original
market bids are compared to its default energy bid and may be adjusted downwards so that the unit’s bid curve does
not exceed its default energy bid. The unit’s resulting mitigated bid curve is used in the final energy market run.
During 2010, the frequency and impact of mitigation in the day-ahead market dropped significantly. An average of
less than one unit was subject to mitigation each hour, with an average of less than 0.5 units having their bid actually lowered due to mitigation. In 2009, bids were lowered for an average of about 1.4 units per hour in the day-ahead market. The estimated increase in energy dispatched in the day-ahead market from these units averaged less than 5 MW per hour. This compares to an estimated impact from mitigation of about 31 MW per hour in 2009.
In the real-time market, bid mitigation frequency in 2010 was comparable to that of 2009. However, the impact of bid
mitigation increased notably. In 2010, bids for an average of about 2.5 units were lowered as a result of the hour-
ahead mitigation process. This compares to an average of about 3.6 units per hour in 2009. An average of about 0.7
units per hour was dispatched at a higher level in the real-time market as a result of bid mitigation in both 2009 and
2010. The estimated increase in real-time dispatches from these units because of bid mitigation averaged about 60
MW in 2010 compared to about 20 MW in 2009. Thus, while the impact of mitigation on real-time dispatches
increased in 2010, the overall impact of bid mitigation remains low in the real-time market.
California ISO Real-Time Energy Market Percentage of Unit Hour Bids Mitigated due to Mitigation 2009-2010(1)
3%
2%
1%
0%
20062007200820092010
(1)California ISO data represents the period April 1, 2009 through December 31, 2010.
2011 ISO/RTO Metrics Report52
Market Pricing
The California ISO markets implemented in April 2009 introduced a new day-ahead market and redesigned a real-
time market. The overall performance of the new day-ahead and real-time markets have been highly efficient with
energy prices following patterns of well-functioning competitive markets, reflecting production costs, and trending
generally with the price of natural gas, the most prevalent fuel for marginal resources on the system. The ISO
includes wholesale energy pricing from prior years in the reported information below for reference, understanding that
the market structure changed completely in April 2009. Other metrics in this section are reported as of the start of the
new market.
California ISO Average Annual Load-Weighted Wholesale Energy Prices 2006-2010
($/megawatt-hour)
$100
$90
$80
$70
$60
$50
$40$39.91
$30
$20
$10
$0
20062007200820092010
2011 ISO/RTO Metrics Report53
California ISO Average Annual Load-Weighted
Fuel-Adjusted Wholesale Spot Energy Prices 2006-2010 (1)
($/megawatt-hour)
$100
$90
$80
$70
$60
$50
$40
$33.95
$30
$20
$10
$0
20062007200820092010
(1) California ISO base for fuel costs references 2009 gas prices.
California ISO 2009-2010 Wholesale Power Cost Breakdown (1)
($/megawatt hour)
$120Reserve Costs
$100Reliability Costs
$80Bid Cost Recovery Costs
$60Grid Management Charge
$40$38.09$39.91Energy Costs
$20
$0
20062007200820092010
Reserve Costs$0.39$0.38
Reliability Costs$0.25$0.27
Bid Cost Recovery Costs$0.29$0.37
Grid Management Charge$0.78$0.79
(1)California ISO data represents the period April 1, 2009 through December 31, 2010.
2011 ISO/RTO Metrics Report54
Unconstrained Energy Portion of System Marginal Cost
The average, non-weighted, unconstrained energy portion of the system marginal cost measures the marginal
energy price in dollars per megawatt hour exclusive of transmission constraints and transmission losses.
California ISO Annual Average Non-Weighted, Unconstrained
Energy Portion of the System Marginal Cost 2009-2010(1)
$100
$90
$80
$70
$60
$50
$40
$30
$20
$10
$0
20062007200820092010
(1)California ISO data represents the period April 1, 2009 through December 31, 2010.
2011 ISO/RTO Metrics Report55
Energy Market Price Convergence
Price convergence in 2009 under the California ISO’s new market exceeded 92 percent. In 2010 the average day-
ahead and real-time price difference was $3.31 while the percentage difference was 91.2 percent. Price convergence
in the day ahead, hour ahead and real time markets improved substantially from the third quarter of 2009 until the
first quarter of 2010. However, prices diverged significantly in the second quarter of 2010. Price convergence
improved early in the third quarter of 2010, but, starting in September and continuing through the fourth quarter,
prices again diverged. Divergence in this period was concentrated more around peak load hours than the late
evening hours. Much of the divergence in energy market prices has been driven by relatively short but extreme price
spikes in the 5-minute real-time market. The ISO’s Department of Market Monitoring has indentified short-term
modeling limitations, rather than fundamental underlying supply and demand conditions as a primary driver of these
price spikes.
California ISO Day-Ahead and Real-Time Energy Market Price Convergence 2009-2010(1)
$3.50
$3.00
$2.50
$2.00
$1.50
$1.00
$0.50
$0.00
20062007200820092010
(1)California ISO data represents the period April 1, 2009 through December 31, 2010.
2011 ISO/RTO Metrics Report56
California ISO Percentage of Day-Ahead and Real-Time Energy Market Price Convergence
2009-2010(1)
100%
80%
60%
40%
20%
0%
20062007200820092010
(1)California ISO data represents the period April 1, 2009 through December 31, 2010.
2011 ISO/RTO Metrics Report57
Congestion Management
Under the ISO’s new market structure, market participants can acquire congestion revenue rights through a
California ISO allocation and auction process to hedge the cost of congestion on the transmission system. The
objective of the first metric below is to quantify the hourly average congestion cost per megawatt of load served. The
second metric quantifies the congestion cost hedged with congestion revenue rights by dividing the amount of net
revenue the market receives by total congestion costs. In 2010, holders of congestion revenue rights paid more for
these rights in the auction than they did in the previous year. This overpayment reduced net revenue received by the
market. Real time congestion in 2010 was also less negative than it was in 2009. This fact resulted in greater total
congestion costs in the day ahead and real time markets. As a result, the percentage of congestion costs hedged
declined in 2010.
California ISO Annual Congestion Costs per Megawatt Hour of Load Served 2009-2010 (1)
$10
$8
$6
$4
$2
$0
20062007200820092010
(1)California ISO data represents the period April 1, 2009 through December 31, 2010.
2011 ISO/RTO Metrics Report58
Percentage of Congestion Dollars Hedged Through California ISO Congestion
Management Markets 2009-2010(1)
100%
80%
60%
40%
20%
0%
20062007200820092010
(1)California ISO data represents the period April 1, 2009 through December 31, 2010.
Generator Availability
The California ISO average annual generator availability calculation is the total generation MW unavailable due to
forced outages for the year compared to the maximum generation capacity within the ISO. The ISO retired its data
tracking source for this information in 2009. For 2010, the ISO used a new data source to track forced outages.
California ISO Annual Generator Availability 2006-2010
100%
95%
94.20%
90%
85%
80%
20062007200820092010
2011 ISO/RTO Metrics Report59
Fuel Diversity
Generation in the California ISO balancing authority area is made up of natural gas, large hydro, renewable
resources, nuclear, oil and coal. Natural gas generation, the predominant fuel source, covered approximately 63 percent of the installed capacity in the ISO system in 2010. Generation capacity operating on hydro and renewable fuel was the second largest source at 27 percent, nuclear resources followed at approximately 8 percent.
California ISO Installed Capacity 2006-2010
100%
90%
80%
70%
60%
50%
40%
30%
20%
10%
0%
20062007200820092010
Other1.90%1.90%1.00%0.80%1.40%
Hydro26.70%26.20%27.20%26.50%26.20%
Oil1.10%1.00%1.00%1.00%0.70%
Nuclear8.20%8.40%8.40%8.10%7.90%
Gas61.50%61.80%61.70%62.90%63.20%
Coal0.70%0.70%0.70%0.70%0.70%
California ISO Generation Output 2006-2010
100%
90%
80%
70%
60%
50%
40%
30%
20%
10%
0%
2011 ISO/RTO Metrics Report
20062007200820092010
Other0.30%0.20%0.20%0.20%1.20%
Hydro31.00%23.00%22.00%24.00%27.30%
Oil0.90%0.90%0.80%0.80%0.80%
Nuclear18.00%20.00%19.00%19.00%19.00%
Gas49.00%54.00%56.00%55.00%50.70%
Coal1.20%1.20%1.20%1.10%1.00%
60
Demand Response Participation in Synchronized Reserve Markets
The California ISO uses the California Public Utilities Commission methodology for determining the resources that count as demand response, and the performance expected from such resources when called upon. Demand response as a percentage of ancillary services reflects awards or self-provision of non-spinning reserve. Demand response participation in other ancillary services markets is currently limited in the Western Interconnection by WECC rules. But the ISO is taking steps to increase participation by demand response through its initiatives to redesign ancillary services and the development of the proxy demand resource product.
California ISO Demand Response as a Percentage of Reserve Market 2006-2010
12%
11.60%
10%
8%
6%
4%
2%
0%
20062007200820092010
2011 ISO/RTO Metrics Report61
Renewable Resources
The California ISO uses the California Public Utilities Commission methodology for determining the renewables
portfolio standard components of renewable resources, such as wind, solar, geothermal, biomass, biogas and small
hydroelectric generating units. However, the figures reported here do not include renewable resources external to the
ISO balancing authority area, internal renewable resources not connected to the ISO controlled grid, or the
renewable resources to which the ISO does not otherwise have telemetry even though some of these resources
ultimately may count towards the renewable portfolio standard. As a result, this metric does not depict the entire
scope of renewable resources supporting the California ISO’s balancing authority area. Renewable capacity as a
percentage of the total capacity in the ISO system ranged from 11.1% to 12.8% from 2006 to 2010, while renewable
energy ranged from 9.6% to 10.5%.
The ISO is committed to assist the State of California achieve its 33 percent renewable portfolio standard by 2020,
one of the most ambitious renewable energy standards in the country. California law requires electric corporations to
increase procurement from eligible renewable energy resources to 20 percent of retail sales by December 31, 2013;
25 percent of retail sales by December 31, 2016; and 33 percent of retail sales by December 31, 2020.
California ISO Renewable Megawatt Hours as a Percentage of Total Energy 2006-2010
20%
15%
10%
5%
0%
20062007200820092010
*Large hydro generations are not counted in the renewables portfolio standard.
2011 ISO/RTO Metrics Report62
The renewable and hydroelectric capacity data on the next two charts is based on generator nameplate capacity, which is the maximum rated output of a generator under conditions designated by the manufacturer.
California ISO Renewable Megawatts as a Percentage of Total Capacity 2006-2010
20%
15%
10%
5%
0%
20062007200820092010
California ISO Hydroelectric Megawatts as a Percentage of Total Capacity 2006-2010
20%
15%
10%
5%
0%
20062007200820092010
Data on total energy from hydroelectric power (including small resources, large resources, and pumped storage) is
included in the chart below. The large hydroelectric capacities as a percentage amount of total capacity ranged
between 16 to 17 percent from 2006 to 2010, while large hydroelectric energy as a percentage of total energy varied from 6 to 14 percent.
2011 ISO/RTO Metrics Report63
California ISO Hydroelectric Megawatt Hours as a Percentage of Total Energy 2006-2010
20%
15%
10%
5%
0%
20062007200820092010
2011 ISO/RTO Metrics Report64
C. California ISO Organizational Effectiveness
Administrative Costs
The California ISO did not have any material variances between its approved budgets and its actual costs from 2006 through 2010. The administrative charge is currently made up of multiple billing components, with weather, customer activity and other factors affecting the revenue billed and collected. If collections exceed budgeted costs, the
difference is credited to the next year’s ISO revenue requirement and vice versa. Additionally, the ISO may adjust the administrative charge quarterly up or down to reduce or increase over or under collections. The administrative costs per megawatt hour of load served should be reviewed in the context of the widely varying levels of annual load
served by each ISO/RTO, about 249 terawatt hours for the ISO.
California ISO Annual Actual Costs as a Percentage of Budgeted Costs 2006-2010
Non-Capital CostsCapital Recovery Costs
140%140%
120%120%
100%100%
80%80%
60%60%
40%40%
2006200720082009201020062007200820092010
Budget$143$129$137$147$153Budget$62$82$53$60$199
Bars Represent % of Actual Costs to Approved Budgets; Dollar Amounts Represent Approved Budgets (in millions)
2011 ISO/RTO Metrics Report65
California ISO Annual Administrative Charges per Megawatt Hour of Load Served 2006-2010
($/megawatt-hour)
$1.10
$1.00
$0.90
$0.80$0.79
$0.70
$0.60
$0.50
$0.40
$0.30
$0.20
$0.10
$0.00
20062007200820092010
Customer Satisfaction
Instead of using a single client satisfaction metric for developing business improvement initiatives, the California ISO uses a variety of survey instruments to test stakeholder satisfaction. Among these instruments are ―transactional surveys‖ to gauge stakeholder satisfaction with specific projects or stakeholder processes, ―corporate surveys‖ to annually sample senior-level stakeholders across multiple ISO business areas, and ―touch point mapping exercises‖ in which the ISO seeks to better understand business interactions with its customers. Although these surveys yield no single stakeholder satisfaction score, the ISO asks two questions on overall stakeholder satisfaction within the annual corporate survey. The graphic below presents these scores for the past four years.
2011 ISO/RTO Metrics Report66
California ISO Percentage of Satisfied Members 2006-2010
100%
92%
80%
60%
40%
20%
0%
20062007200820092010
Billing Controls
The California ISO received two unqualified opinions following implementation of its new market design in 2009 and
an unqualified opinion in 2010. This is a testament to the completeness and accuracy of the controls the ISO has in
place.
ISO/RTO
California
ISO
20062007
Qualification for
Unqualified SASTwo Control
70 Type 2 AuditObjectives in
OpinionSAS 70 Type 2
Audit
20082009
Qualification forUnqualified SAS
One Control70 Type 1 and
Objective in SASType 2 Audit
70 Type 2 Audit Opinions
2010
Unqualified SAS
70 Type 2 Audit
Opinion
2011 ISO/RTO Metrics Report67
D. California ISO Specific Initiatives
Each year the ISO establishes, with approval of its Board of Governors, annual corporate goals as part of its strategic planning process. These goals measure short-term performance and targeted areas of focus or improvement in a given year. In parallel time, the ISO assesses long-term performance as outlined by its strategic plan. The following performance highlights are a collection of short and long-term performance achievements over the past five years (2006-2010) in the three areas covered by the ISO/RTO metrics in this report.
Reliability
The ISO measures reliability in terms of compliance with operations and planning standards as well as cost. In some cases, the requirements are mandatory while for others, some discretion exists in how to achieve a particular result while
maintaining expected levels of reliability and cost effectiveness.
Renewables Planning and Demand Response. The ISO has a long history of planning for renewables
integration dating back to 2001 when its Participating Intermittent Resource Program was approved by the
Board, and later with conditions by FERC. The program allowed variable resources, such as wind and solar
resources that at the time had limited ability to control their output, to schedule energy in the forward market
without incurring imbalance charges when the delivered energy differed from the scheduled amount.
The ISO is participating in the Western Electricity’s Coordinating Council’s Western Interconnection
Synchrophasor Program, which leverages a mature technology in new ways to manage renewable resources,
electric vehicles and storage. Market enhancements are under development to facilitate energy storage and the
ISO continues to investigate how battery storage can help match renewables generation with available
transmission capacity and how to best use storage for regulation, spinning reserves and frequency response
needs.
The ISO Board approved the Proxy Demand Response proposal in late 2009 that set the conditions for
aggregators and load-serving entities to bid demand reductions into the wholesale markets. And in 2010, the
Board approved the Reliability Demand Response product, which integrates emergency responsive demand into ISO markets and operations.
Last year, the ISO released a 20 percent renewable portfolio standard integration report and commenced efforts to ensure it has sufficient tools to integrate renewable resources to satisfy the 33 percent renewable portfolio standard by 2020. The ISO adopted, and FERC approved, additional reforms to its transmission planning
process in 2010 that allow approval of policy-driven transmission infrastructure projects. This authority will help the ISO plan for transmission expansions necessary to interconnect renewable resources.
2011 ISO/RTO Metrics Report68
Also in 2010, the ISO and various state agencies collaboratively developed California‟s Clean Energy Future. The California Air Resources Board, California Public Utilities Commission, California Energy Commission, California Environmental Protection Agency and the ISO created this visionary road map, a separate detailed implementation plan, and a set of metrics to measure its progress. This effort will ensure the ISO and state agencies are aligned in the effort to implement environmental and energy policies.
Reduced Reliability Management Costs. The ISO targeted over $1 billion of reliability management costs in 2004 and
reduced this figure to $154 million by 2007. The ISO has relied less on reliability must run plants in recent years,
especially from 2007 to 2009, with costs decreasing nearly 68 percent to $39 million. Those costs fell even further in 2010, during which the ISO worked to facilitate the retirement of aging units at the South Bay Power Plant and Potrero Power Plant that were subject to RMR contracts.
Maintaining Reliability Under Extreme Operating Conditions. The ISO has developed a wildfire tracking information
system that combines Google Earth, California Department of Forestry and Fire Protection real-time information, and grid topology to display pinpoint views of threats to the grid. POWERGRID International (formerly Utility Automation & Engineering T&D) magazine awarded the warning system its 2007 Project of the Year Award.
Interconnection Process Improvements. The ISO has enhanced its generation interconnection study processes that
benefit the ISO and its customers in significant ways. The 2008 reform reduced the large, overwhelming amount of
projects requesting interconnections down to a manageable and more meaningful number. By studying geographically and electrically related requests in clusters, the ISO has made the review timelines more predictable with greater cost certainty. It also has streamlined the process that nearly eliminates the need for costly and time consuming restudies and provides the ISO and developers better information about development trends and needs. The ISO implemented additional process reforms in 2010 while working to execute interconnection agreements to support projects seeking tax incentives and guarantees under the American Recovery and Reinvestment Act.
Generation. While generation additions from 2006 through 2008 totaled less than 600 MW each year, more than
2,400 MW of new generation came on line in 2009 — the most since 2005. In 2010, over 2,000 MW of new generation came on line, including about 500 MW of renewable generation resources.
Transmission. The revised ISO transmission planning process is designed to mitigate stranded costs risks as
development patterns change, making sure that its regulatory compliant process addresses reliability needs and, for the first time among the nation’s ISO/RTOs, state energy and environmental goals. This process will serve as the
foundation for infrastructure development over the coming years. The ISO has already made significant progress in
identifying the transmission upgrades needed to achieve the 33 percent renewables portfolio standard. As of this date, the ISO has approved enough upgrades to accommodate the state’s 20 percent and 33 percent renewables portfolio requirement applicable to load serving entities.
Compliance. The ISO has strengthened its compliance efforts over the past few years despite challenging
operating conditions (wildfires, loop flows from early spring melts, etc.), and implementing state energy and
environmental goals. The ISO created a new compliance department in 2008 and had a successful compliance
2011 ISO/RTO Metrics Report69
audit in 2009. The ISO continues to refine its internal compliance programs to ensure it adheres to all reliability standards and tariff requirements.
Markets
In April 2009, the ISO implemented a new market, referred to in its development stage as the Market Redesign and Technology Upgrade. This effort required significant company resources and direct, concentrated leadership from management. To put this accomplishment in perspective the following highlights are noted:
Significant New Market Functionality. The scope of the new market functionality was significant, including the
development of congestion revenue rights, a day-ahead market and locational marginal pricing. The new market
is now more transparent and granular and the pricing at its 3,000 nodes better reflects energy production and
delivery costs.
Extensive Outreach and Collaboration. The ISO conducted extensive outreach to fully support market
participants as they tested their systems to ensure new market readiness. This activity increased confidence in
ISO systems and created unprecedented collaboration that continues. The ISO held its inaugural Stakeholder
Symposium in the fall of 2009 that drew 210 people and promoted open dialogue with members of the Board of
Governors and ISO executives. The ISO has also held several public forums to discuss pressing issues.
Continued Functionality Deployment. The ISO developed and deployed a number of enhancements, including
scarcity pricing and convergence bidding mechanisms, multi-stage generator unit modeling, a resource
adequacy standard capacity product, and an ancillary services must offer obligation policy. To support our
market participants as they upgraded their systems and processes to deploy new market functionalities, the ISO
began holding quarterly stakeholder meetings to discuss implementation issues and schedules. The ISO
continues to develop and implement market enhancements, including those to increase participation of demand
response, energy storage and integrate intermittent renewable resources.
Organizational Effectiveness
Beyond cost and customer satisfaction measures, the ISO also focused on developing its people, business processes and technology capabilities over the last several years. These enabling activities are essential to meet expectations as noted in this report’s metrics, all at a reasonable cost.
People. The ISO developed and launched a technical training program to develop critical skills needed by operators
and engineers to manage a more complex grid. It also established programs that train employees to make better
business decisions and grow their leadership skills. Human Resources implemented a comprehensive talent
management strategy that reduces voluntary turnover as well as a global recruitment program.
Process. The single biggest improvement effort in this area has focused on building a culture of customer service that
included deploying an issue tracking system with associated performance metrics. Resolving issues now requires less
than five business days on average despite having a complex market platform. An August 2008 comprehensive
2011 ISO/RTO Metrics Report70
customer survey, among other things, led the ISO to develop a set of criteria to measure the timeliness of document publication and the effectiveness of those documents in informing stakeholders.
Technology. A state-of-the-art control center in our new headquarters and improved forecasting tools have enhanced
the ISO’s ability to increase its situational awareness. The ISO began operating from its new control center in November
2010, which features a video wall pre-programmed to display critical operating information such as the status of
renewable resources.
Financial. The ISO began to manage its revenue requirement in 2005 with a corporate realignment that resulted in a
$27 million reduction in expenditures in 2006. Since that time, the ISO has been able to hold its revenue requirement
below the $197 million threshold that triggers a rate filing. In 2009, the ISO implemented a payment acceleration
process to reduce market participants’ exposure to unnecessary credit risk. In 2010, the ISO implemented a new
internal credit tracking system that represents a step towards greater transparency into a market participant’s overall
liabilities in the market. This system reduces uncertainty and risk by allowing the ISO to assess more information quickly
about market participant liabilities to protect the ISO market from potential defaults. The ISO is introducing a new
administrative charge structure to take effect in 2012, which will reduce the number of billing components and align with
cost causation principles.
2011 ISO/RTO Metrics Report71
ISO New England (ISO-NE)
2011 ISO/RTO Metrics Report72
Section 3 - ISO-NE Performance Metrics and Other Information
ISO New England is a regional transmission organization (RTO), serving Connecticut, Maine, Massachusetts, New Hampshire, Rhode Island, and Vermont. ISO New England meets the electricity demands of the region's economy and people by fulfilling three primary responsibilities:
Minute-to-minute reliable operation of New England's electric power system, providing centrally dispatched
direction for the generation and flow of electricity across the region's interstate high-voltage transmission
lines and thereby ensuring the constant availability of electricity for New England's residents and
businesses.
Development, oversight, and fair administration of New England's wholesale electricity marketplace, through
which electric power has been bought, sold, and traded since 1999. These competitive markets provide
positive economic and environmental outcomes for consumers and improve the ability of the power system
to meet ever-increasing demand efficiently.
Management of comprehensive planning processes for the electric power system and wholesale markets for
addressing New England's electricity needs well into the future.
ISO New England is an independent, not-for-profit corporation. To effectively carry out its charge, the company, its
board of directors, and its close to 500 employees have no financial interest or ties to any company doing business in the region's wholesale electricity marketplace.
The New England regional electric power system serves 14 million people living in a 68,000-square-mile area. More than 300 generating units, representing approximately 32,000 MW of total generating capacity, produce electric
energy. Most of these facilities are connected through more than 8,000 miles of high-voltage transmission lines.
Thirteen tie lines interconnect New England with neighboring New York State and the provinces of New Brunswick and Québec, Canada. Demand resources now play a significant role in operating the New England power system. As of summer 2010, over 2,000 MW of demand resources (summer rating), representing load reductions and behindthe-meter generators, are registered as part of ISO’s Forward Capacity Market.
2011 ISO/RTO Metrics Report73
Dispatch Operations
Compliance with Frequency Control Performance Metrics (CPS1 and CPS2)
As the registered balancing authority (BA) for New England, ISO-NE is responsible for dispatching the region’s
generation (i.e., supply) to meet its load (or demand) and the scheduled interchange with its neighboring BAs, which
is the agreed-to level of flow over the tie lines between two BAs. In real time, the area control error (ACE) determines
the effectiveness of ISO-NE’s dispatch, or control, performance. The ACE is a measurement of the difference
between the net scheduled interchange and the net actual interchange, with an additional adjustment to support
system frequency. Overgeneration will result in a positive ACE, and undergeneration will result in a negative ACE. To
effectively control the ACE to be sufficiently close to zero or complying with industry standards, ISO-NE dispatches
generators selected for automatic generator control (AGC) to regulate their power output based on control signals
they receive from the ISO every four seconds. The regulation requirements are based on balancing the need to
satisfy the Control Performance Standard (CPS) with the need to minimize regulation procurement and, ultimately,
consumer costs. The CPS sets the limits of a balancing authority’s ACE over specified periods.
Control Performance Standard No. 1 (CPS1) and Control Performance Standard No. 2 (CPS2) are designed to
maintain interconnection steady-state frequency within defined limits by balancing real power demand and supply in
real time. NERC Standard BAL-001-0.1a, Real Power Balancing Control Performance, defines CPS1 and CPS2 as
follows:
CPS1 is the12-month rolling average limit for a BA’s impact of its ACE on system frequency. To be
compliant with CPS1, BAs must achieve a score of at least 100% to avoid an adverse impact on system frequency.
CPS2 compares the BA’s integrated ACE value for clock 10-minute periods (six nonoverlapping periods
per hour) during a calendar month against a NERC-assigned limit (L10). Compliance requires being within
this limit for greater than 90% of the clock 10-minute periods in every month. ISO-NE has an internal goal
of managing CPS2 within a monthly average of between 92% and 97%.
ISO-NE monitors CPS compliance every hour of every day. Further, ISO-NE reviews CPS1 and CPS2 performance on a monthly basis. In addition, ISO-NE reviews CPS compliance annually to determine whether its regulation
requirements, specified as a function of month, day type, and hour, need to be adjusted or modified. Since 2005,
regulation requirements have decreased as a result of more efficient and effective generation dispatch and new
operational tools, such as electronic dispatch and very short-term load forecasting. The system operators also have ensured compliance with CPS2 by carefully monitoring real-time economic dispatch and those generators providing regulation service. Consequently, lower amounts of regulation are needed to provide the required regulation service and subsequently meet the CPS2 target.
ISO-NE was compliant with CPS1 and CPS2 for each of the calendar years from 2006 to 2010 as shown in the following graphs.
2011 ISO/RTO Metrics Report75
ISO-NE CPS1 Compliance, 2006-2010
200%
180%
160%
140%
120%
100%
80%
20062007200820092010
ISO-NE CPS2 Compliance, 2006-2010
100%
95%
90%
85%
80%
20062007200820092010
2011 ISO/RTO Metrics Report76
ISO New England Energy Management System Availability, 2006-2010
The availability of the Energy Management System (EMS), as shown in the next figure, is the key to reliable
monitoring of the electric power transmission system. For the past five years, ISO New England’s EMS has been available more than 99.9% of all hours in each year.
ISO-NE Energy Management System Availability 2006-2010
100%
95%
90%
85%
80%
20062007200820092010
Load Forecast Accuracy
The principal factor affecting load forecast error is the accuracy of weather forecasts, with 60% of the load forecast error driven by weather forecast error. To minimize weather forecast error, ISO-NE uses three weather vendors to provide regional weather forecasts for eight New England cities. These data are used to calculate a load-weighted New England average weather forecast.
ISO-NE forecasters also use three types of short-term load forecast models to produce the day-ahead load forecast
(before 10:00 a.m.), the seven-day load forecast, and an update of the current (intra-) day load forecast. One type of
forecast model is an advanced neural network (ANN) model that uses weather inputs and past history to produce a
short-term load forecast for the upcoming seven days. The ANN-Regular model weighs past load and weather data
evenly, whereas the ANN-Fast model relies more heavily on the most recent weather data. The ANN-Fast model is
particularly helpful during daylight savings time changes or seasonal holidays. Both ANN models are ―retrained‖
annually. The second type, the MetrixND model, is solely dependent on weather inputs. The third type is the Similar Day historic model, which allows the forecaster to view a range of past ―similar‖ days for possible use in the next-day forecast. The Similar Day model is based on predefined time and load criteria.
ISO-NE proactively monitors the performance of the individual load forecast models and regularly communicates with
its weather vendors and the local National Weather Service office to discuss unusual weather conditions or forecasts.
2011 ISO/RTO Metrics Report77


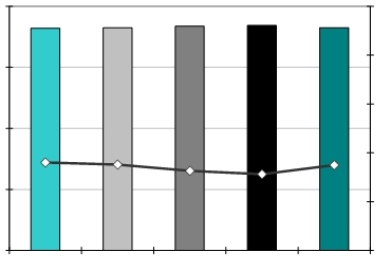

ISO-NE’s load forecasting accuracy is shown in the following table and figures.3
Load Forecasting Accuracy
Reference Point
ISO-NE10:00 a.m. prior day
ISO-NE Average Load Forecasting Accuracy, 2006-2010
100%5%
4%
95%
3%
90%
2%
85%
1%
80%0%
20062007200820092010
Forecasting AccuracyMean Absolute Percentage Error
3 For ISO-NE’s calculation of load forecast accuracy for 2006 to 2010, the actual loads were reconstituted for load-relief estimates resulting
from the dispatch of demand response because of emergency operating procedures invoked by ISO-NE.
2011 ISO/RTO Metrics Report78

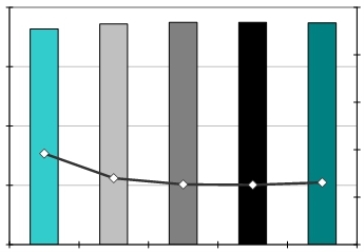

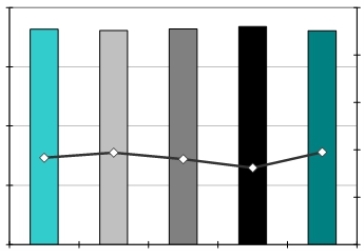
ISO-NE Peak Load Forecasting Accuracy, 2006-2010
100%5%
4%
95%
3%
90%
2%
85%
1%
80%0%
20062007200820092010
Forecasting AccuracyMean Absolute Percentage Error
ISO-NE Valley Load Forecasting Accuracy, 2006-2010
100%5%
4%
95%
3%
90%
2%
85%
1%
80%0%
20062007200820092010
Forecasting AccuracyMean Absolute Percentage Error
2011 ISO/RTO Metrics Report79
Wind Forecasting Accuracy
Currently, ISO-NE has a small amount of installed wind generation capacity (approximately 270 MW). Therefore, no separate forecast for wind generation is done at the regional level.
In New England, variable energy resources (VERs) perform their own forecast of generation for each hour of the next operating day, which they submit to ISO-NE as a self-schedule (forecast) on the day preceding the operating day. While ISO-NE’s current load-forecasting practice and corresponding generation requirements work well for the
present-day system, it will not be viable with a large penetration of VERs into the New England transmission system. This is primarily because of the potential volume of VERs and the quantity of forecast revisions that would be
required owing to the nature of each VER and potentially to its forecast, which may not be aligned with ISO-NE’s metrics and requirements for operation of the larger system.
In 2012, when VER penetration levels are expected to approach 500 to 750 MW of nameplate capacity, ISO-NE will
transition to using a centralized, state-of the art wind power forecasting system. The new forecasting system will
incorporate information from the New England Wind Integration Study (NEWIS), completed in December 2010.4 One
of NEWIS’s major recommendations was for ISO-NE to develop and implement a centralized wind power forecasting
system.
ISO-NE understands a ―state-of-the-art forecasting system‖ to mean a generation forecasting system that, in the
operational timeframe, helps to most efficiently use the energy produced by VERs and non-VERs, while also helping
to ensure system reliability and market efficiency. Such a system works toward these goals by producing a forecast
for expected VER generation, ideally for a range of timeframes (including next hours, next day, and the following
week), to allow for optimizing short-term maintenance scheduling, unit commitment, and real-time unit dispatch.
To transition from the existing forecasting method to this state-of-the-art forecasting system, the first step is to
determine and describe the pertinent goals, methods, and requirements for the system. The second step is to
develop, test, and implement a plan for the transition. The NEWIS Task 2 report addresses this first step by
identifying the recommended goals, methods, and requirements for a state-of the-art wind generation forecasting
system.
The second step, which will detail how ISO-NE will transition from the existing system to a state-of-the-art system, is
in the beginning phases of implementation. Data requirements and specifications are being collaboratively developed
with New England wind power stakeholders, and a request for proposals (RFP) for wind power forecasting services is
being developed.
Although the NEWIS report has focused on wind generation resources as the most significant category of VERs for
the New England power grid, ISO-NE also will be examining requirements for the integration of other types of VERs.
4 See the NEWIS Task 2 report at http://www.iso-ne.com/committees/comm_wkgrps/prtcpnts_comm/pac/reports/2009/newis_report.pdf, the
NEWIS final report executive summary and at http://www.iso-
ne.com/committees/comm_wkgrps/prtcpnts_comm/pac/reports/2010/newis_es.pdf, and the NEWIS final report at http://www.iso-
ne.com/committees/comm_wkgrps/prtcpnts_comm/pac/reports/2010/newis_report.pdf.
2011 ISO/RTO Metrics Report80
ISO-NE has yet to study generation forecasting for solar resources. Presumably, solar-based VERs will depend on insolation as a ―fuel‖ source and on relevant ambient condition data for generation forecasting, including present and expected cloud cover, projected incident solar irradiance (or perhaps theoretical maximum plant output) given no cloud cover, temperature, and relative humidity.5 The data reporting frequency for solar resources would likely be similar to that required for wind generation resources.
Once wind power forecasting is operational, ISO-NE would expect to participate in the metrics for wind forecasting and would provide the data in accordance with business processes envisioned by FERC.
Unscheduled Flows
Because of its geographical and electrical relationship with other systems in the Eastern Interconnection, and based
on the New England congestion management system specified in the ISO-NE Open Access Transmission Tariff
(OATT) filed and approved by FERC, ISO-NE does not use the transmission-loading relief (TLR) procedures for
managing congestion on the interbalancing authority ―interchange‖ transactions.6 ISO-NE is not subject to parallel
flows within its footprint because of the radial interconnection with the remainder of the Eastern Interconnection.
When necessary, ISO-NE-initiated curtailments are accomplished by transmission scheduling software in conjunction
with security-constrained dispatch to meet all reliability requirements. These curtailments can be completed and
executed in real time according to the rules specified in the ISO-NE OATT. ISO-NE does monitor and will respond to
TLRs called throughout the Eastern Interconnection by other reliability entities where ISO-NE transactions may be a
contributing factor.
Transmission Outage Coordination
ISO-NE coordinates transmission and generation facility outages under the authority granted in the Transmission
Operating Agreements (TOAs) and market rules that define the ISO’s responsibilities and obligations to operate the New England transmission system. ISO-NE also operates in accordance with all related governing documents,
including FERC, regional, and national reliability standards, and ISO-NE operating documents. ISO-NE’s role in outage coordination is multifaceted with several aims, as follows:
Maintain overall system reliability
Minimize congestion and thereby reduce overall costs to New England consumers
Provide timely and accurate information for the Financial Transmission Rights (FTR) market
Minimize conditions that would impede the ability of generators to participate in the wholesale electricity
markets
Coordinate with neighboring reliability coordinators and balancing authorities.
5 Insolation is a measure of solar radiation energy received on a given surface area in a given time.
6 ISO New England Open Access Transmission Tariff, Section II of ISO-NE’s Transmission, Markets, and Services Tariff (July 13, 2011),
http://www.iso-ne.com/regulatory/tariff/sect_2/index.html.
2011 ISO/RTO Metrics Report81
ISO-NE coordinates all the transmission and generation outages with New England transmission owners (TOs), local
control centers (LCCs), and New England generation owners/operators (GOs). This includes conducting reliability
assessments of the transmission system and operable capacity, evaluating congestion cost impacts, and
rescheduling outages when conflicts or violations could occur. In addition, ISO-NE and TO senior management meet
quarterly to monitor progress made in coordinating transmission equipment outages and provide direction and
feedback to operations.
The ISO, TOs, LCCs, and GOs have embarked on a multiyear effort to improve outage coordination within the region, which has focused on the following:
Establishing a set of broad performance-based outage-coordination metrics to allow all parties to assess
their performance regarding transmission outage coordination
Enhancing the coordination process and procedures through cooperation by all entities (ISO-NE, TOs,
LCCs, and GOs) to implement best business practices
Implementing increased communications, both through conference calls and face to face, among TOs,
LCCs, and GOs to better coordinate and facilitate outage requests
Emphasizing outage-coordination plans during discussions at the quarterly meetings with nuclear plants
Improving the handling of detailed outage information through the use of new web-based outage-
coordination software
Ensuring that all contributors to the outage process at all levels (project management, engineering, field,
and operations personnel) are aware of the benefits of a broad coordination approach to the planning and scheduling of transmission and generator equipment outages
Improving advanced notification to the New England stakeholders of upcoming transmission outages by
way of the publicly distributed Long-Term Outage Report.
Increasing emphasis on the coordination of major transmission element (MTE) outage planning through a
new metric
Providing incentives to all parties to move toward longer lead times on outage requests (90-day minimum)
through a new metric.
The efforts to improve outage coordination have been concurrent with a significant increase in transmission outage requests resulting from the substantial transmission build-out by the TOs. As the metrics indicate, ISO-NE,
collaboratively with the TOs and LCCs, has improved the lead time of request submissions, reduced last-minute cancellations, and minimized unplanned outages while handling an outage-request volume that has increased approximately 40% over the past six years.
The following figures show ISO-NE transmission outage information for 2006 through 2010. The first figure reflects
ISO-NE’s percentage of >200 kV planned outages of five days or more submitted to ISO-NE at least one month
before the outage-commencement date. The second figure shows the percentage of planned outages studied in the
2011 ISO/RTO Metrics Report82
timeframes established in ISO-NE’s tariff and manuals. The third figure shows the percentage of >200 kV outages
previously approved but cancelled by ISO-NE, and the last figure shows the percentage of unplanned >200 kV
outages.
Percentage of >200 kV Planned Outages of Five Days or More Submitted to ISO-NE at Least One Month
Before the Outage Commencement Date, 2006-2010
100%
80%
60%
40%
20%
0%
20062007200820092010
Percentage of Planned Outages Studied in ISO-NE’s Tariff/Manual-Established Timeframes,
2006-2010
100%
80%
60%
40%
20%
0%
20062007200820092010
2011 ISO/RTO Metrics Report83
Percentage of >200 kV Outages Previously Approved but Cancelled by ISO-NE, 2006-2010
2.50%
2.00%
1.50%
1.00%
0.50%
0.00%
20062007200820092010
ISO-NE Percentage of Unplanned >200 kV Outages, 2006-2010
30%
25%
20%
15%
10%
5%
0%
20062007200820092010
2011 ISO/RTO Metrics Report84
Transmission Planning
This ISO/RTO performance category includes several transmission planning metrics. The metric for the number of facilities approved to be constructed for reliability purposes was determined using the ISO-NE Regional System Plan (RSP) Project List.7 The RSP Project List is a summary of transmission projects for the region and includes
information on project status and cost estimates. Some of these projects are proposed for regional reliability; others are proposed for market efficiency or are merchant transmission projects. The RSP Project List is compiled at least three times per year and reviewed by the Planning Advisory Committee (PAC). The projects on the list are classified as follows, according to their progress through the study and stakeholder planning processes:
Concept
Proposed
Planned
Under construction In service
Cancelled
A transmission project is considered ―planned‖ when ISO-NE has approved it under Section I.3.9 of the ISO New England Tariff.8 Transmission projects with a status of ―under construction‖ or ―in service‖ have received approval under Section I.3.9 of the tariff.
The information used for calculating the number of facilities approved in each year, as shown in the next graph, was
based on the status of each project within the RSP Project List. In each year, transmission projects that progressed
to ―planned,‖ ―under construction,‖ or ―in service‖ were included, also as reflected in the following graphs.9 The
second graph below, which depicts completed projects with ISO-NE approval, was created by comparing the number
of projects that either were ―under construction‖ or ―in service‖ with the number of projects that were ―approved.‖
7 The current RSP Project List is located at http://www.iso-ne.com/committees/comm_wkgrps/prtcpnts_comm/pac/projects/index.html.
8 This part of the ISO tariff covers the review of participants’ proposed plans; see http://www.iso-ne.com/regulatory/tariff/sect_1/section_1.pdf.
9 The graphs reflect many project components accounted for individually that are part of larger projects.
2011 ISO/RTO Metrics Report85
Number of ISO-NE Transmission Projects Approved for Construction for Reliability Purposes, 2006-2010
550
500
450
400
350
300
250
200
150
100
50
0
20062007200820092010
Percentage of ISO-NE Approved Construction Projects Completed by December 31, 2010
100%
80%
60%
40%
20%
0%
20062007200820092010
In recent years, New England has placed a substantial amount of new transmission projects in service, including new
345 kV transmission into northern Maine from New Brunswick and in southwestern Connecticut, southern Vermont,
and Boston. All approved transmission projects are progressing through the implementation process and are
anticipated to be constructed and placed in service unless system conditions change in a way that affects the overall
2011 ISO/RTO Metrics Report86
need for a project. Because of new resources coming on line and changes in the demand forecast, the need for some projects in southern New England are under review.
This ISO/RTO performance metric identifies the completion of FERC Order 890 reliability studies.10 An assessment and transmission plan update of New England’s pool transmission facilities (PTFs) has been conducted annually for 2006 through 2010. ISO-NE has demonstrated compliance with NERC standards and NPCC criteria and directories in each of these years.11
On an ongoing basis, ISO-NE, in coordination with the participating TOs and the PAC, assesses the needs (i.e.,
conducts ―Needs Assessments‖) of the adequacy of the regional transmission system (i.e., the PTFs), as a whole or in part, to maintain the reliability of these facilities while promoting the operation of an efficient wholesale electricity market within New England. A Needs Assessment analyzes whether each PTF within New England’s transmission system complies with the following requirements:
Meets applicable reliability standards
Has adequate transfer capability to support local, regional, and interregional reliability
Supports the efficient operation of the wholesale electric markets
Is sufficient to integrate new resources and demands on a regional basis
Has otherwise various satisfactory aspects of performance and capability.
These Needs Assessments also identify the following:
The location and nature of any potential problems with respect to the PTF
Situations or scenarios that significantly affect the reliable and efficient operation of the PTF, along with
any critical time constraints for addressing the needs of the PTF to develop market responses and to
pursue regulated transmission solutions.
In conjunction with the proponents of regulated transmission solutions and other interested or affected stakeholders,
ISO-NE conducts and participates in ―Solutions Studies‖ (i.e., mitigation plans) to develop and refine regionally cost-
effective regulated transmission solutions to meet the PTF system needs identified in Needs Assessments. Each
proposed transmission solution is then individually and comprehensively evaluated to ensure that it meets the
established need(s) and is sufficiently robust to prevent significant adverse impacts on the reliability, stability, or
operating characteristics of the existing or future power system. All studies are conducted in an organized and
coordinated manner, with many individual ones under the direction of ISO-NE. The aggregate result is a complete
annual assessment of the New England PTFs and an update of the Regional System Plan to address various needs.
10 Preventing Undue Discrimination and Preference in Transmission Service, Final Rule, FERC Order No. 890, Docket Nos. RM05-17-000 and
RM05-25-000 (February 16, 2007), http://www.ferc.gov/whats-new/comm-meet/2007/021507/E-1.pdf.
11 The NPCC website is located at: http://www.npcc.org.NERC’s website is located at http://www.nerc.com/.
2011 ISO/RTO Metrics Report87
Market responses—which may include but are not limited to resources such as demand-side projects, distributed
generation, and merchant transmission facilities—are reflected in Needs Assessments as long as they have an
obligation through the wholesale power markets, such as the Forward Capacity Market, or have contracted with a
third party, such as a state-sponsored RFP. Demand response and other resources may assist in resolving reliability
issues and possibly defer transmission solutions, provided they are adequately integrated into the system. For
demand response to be truly effective in some locations, without compromising the ability to operate other resources
or demand response in other locations, additional transmission may be needed. To date, demand response has had
varying impacts on the need for continued transmission infrastructure investment in New England. Transmission
projects have been reviewed as newly committed demand response has been obtained. In many cases, these
resources have been insufficient in quantity or could not be implemented in locations granular enough to address a
specific reliability concern. In other cases, the addition of demand response has aided in deferring some transmission
needs and has contributed to causing others.
ISO-NE has started a new initiative to begin evaluating new, innovative technologies because these technologies
may be a partial or full solution for reliability issues, and could potentially defer or eliminate the need for transmission
solutions. Technologies such as flywheels, battery and thermal storage, vehicle-to-grid (V2G), and various other
smart grid technologies are being evaluated for integration into the power system. New England is implementing
several smart grid projects in line with the vision established in the Energy Independence and Security Act of 2007.12
In response to FERC Order 890 regarding the provision of regulation and frequency services by nongenerating
resources, ISO-NE is conducting a FERC-approved Alternative Technology Regulation (ATR) Pilot Program.13 The
goal of the ATR Pilot Program is to allow the ISO to identify alternative technologies with new and unique
performance characteristics that may have been unable to participate in the Regulation Market. It also aims to allow
the owners of these ATR resources to evaluate the technical and economic suitability of their technologies as market
sources of regulation service.14
Since 2007, ISO-NE has performed annual economic studies as part of its long-term planning process in compliance
with FERC Order 890. Stakeholders are invited to submit study requests by April 1 of each year. ISO-NE then
designates up to three economic studies to be performed. Study requests dealing with a specific project proposal or
suggesting a specific policy position are not considered appropriate and are subsequently disregarded. All other
economic study requests have been incorporated into recent study efforts as the subject of primary investigation or
as a sensitivity case to another effort, either directly or through analysis of a comparable ―generic‖ project. The
following table shows the number of economic studies requested and conducted for 2007 to 2010.
12 U.S. Congress, Energy Independence and Security Act of 2007 (January 4, 2007); http://frwebgate.access.gpo.gov/cgi-
bin/getdoc.cgi?dbname=110_cong_bills&docid=f:h6enr.txt.pdf.
13 FERC Order No. 890 (February 16, 2007), http://www.ferc.gov/whats-new/comm-meet/2007/021507/E-1.pdf. ―Alternative Technology
Regulation Pilot Program Frequently Asked Questions‖ web page (2009), http://www.iso-ne.com/support/faq/atr/index.html. Also see FERC,
Order Accepting Tariff Revisions (extending the enrollment deadline to allow other alternative technologies to participate in the program),
Docket No. ER10-52-000 (December 10, 2009), http://www.ferc.gov/eventcalendar/Files/20091210163659-ER10-52-000.pdf.
14 Beacon Power has installed 2 MW of flywheels, which have provided regulation services from a location in Tyngsboro, Massachusetts. ―Beacon Power Connects Second Megawatt of Regulation Service,‖ Business Wire (July 20, 2009),
http://www.businesswire.com/portal/site/home/permalink/?ndmViewId=news_view&newsId=20090720005598&newsLang=en.
2011 ISO/RTO Metrics Report88
Number of Economic Studies Requested and Conducted in ISO-NE, 2007-2010
Year
Number of RequestsNumber of EconomicNumber of Requests
ReceivedStudies ConductedAddressed
2010313
(a) In 2007, ISO-NE received no economic study requests but conducted one study. In 2008, ISO-NE received 11 requests and merged these requests into one study, which addressed nine of the requests. In 2009, ISO-NE received six requests and conducted two studies, which addressed five of the six requests. In 2010, ISO-NE received three requests, which it merged into one study that is addressing the needs of all three requests.
Generation Interconnection
The metric for the processing time for generation interconnection requests (IRs) was calculated using the date of an interconnection request as the start date. The end date was either the date an interconnection agreement (IA) was executed or the date the interconnection request was withdrawn. In each year, projects that executed an
interconnection agreement or that withdrew are included in the average processing time for that year.
ISO-NE Average Generation Interconnection Request Processing Time, 2006-2010
(Calendar Days)
1,000
800
600
400
200
0
20062007200820092010
2011 ISO/RTO Metrics Report89
Processing time encompasses a number of tasks, as follows:
Interconnection request review and validation
Scoping meeting
Study agreement development
Study agreement execution by the interconnection customer Feasibility studies
System impact studies
Facilities studies
Interconnection agreement development
The types of IRs that undergo these tasks include generation interconnection requests, elective transmission upgrade requests, and requests for transmission service that require study. The data do not include generator interconnection requests that did not fall under FERC’s jurisdiction.
Several older projects, which were either capacity upgrades or equipment replacements associated with existing
generators, did not result in any changes to the existing interconnection agreements. In these cases, the date of the
approval of the proposed plan was used as the end of the process. Several projects withdrew after executing an
interconnection agreement. In these cases, the execution of the interconnection agreement was considered to be the
end of the process.
In general, a shorter processing time is preferred. The factors that contribute to the year-to-year variations in
processing time include (1) the number of IRs or project withdrawals received each year, (2) the dependence of laterqueued projects on earlier-queued projects, and (3) tariff requirements allowing customers to waive or combine
phases of the interconnection process.15
Initiating and performing meaningful wind interconnection studies continues to be challenging. Wind manufacturers have been slow to provide sufficiently accurate models to allow for the expeditious completion of studies. Complex control interactions have become a factor in wind interconnection studies as well as a risk because of the nature of electronic controls on most wind power plants and the location of many wind plants in remote, and often weak, locations on the transmission system. This has created the potential need for even more detailed modeling from the manufacturers, which further increases the study time.
15 The queue refers to the list of interconnection requests for the New England Balancing Authority Area, which includes the requests submitted by generators to interconnect to the ISO New England electric power system.
2011 ISO/RTO Metrics Report90
Planned and Actual Reserve Margins, 2006-2010
This ISO/RTO performance metric compares ISO-NE’s actual reserve margins (ARMs) with planned reserve margins (PRMs), in megawatts and percentages. A discussion of the results and findings for New England is provided below. The following figure shows the PRMs (bars) and the ARMS (line) from 2006 to 2010.
ISO-NE Planned and Actual Reserve Margins, 2006-2010
40%
35%
30%
25%
20%
15%
10%
5%
0%
20062007200820092010
Note: The bars represent PRMs, and the line represents ARMs.
Actual Reserve Margin: The ARM is based on data published annually within ISO-NE’s Forecast Report of
Capacity, Energy, Loads, and Transmission (CELT Report).16 Information for the ARM for a particular year and as a percentage of load is included in the CELT Report in the next year’s publication.
Planned Reserve Margin: The PRM is based on the Net Installed Capacity Requirement (NICR), which ISO-NE sets annually for the region.17 The value for a particular year can be obtained by applying the following formula using the NICR (August value, if monthly NICR values are published) and the forecasted annual peak load published in ISONE’s CELT Report for that year:
PRM MW = (NICR MW) - (forecasted annual peak load MW)
The PRM also can be expressed as a percentage of forecast annual peak load using the following formula:
[(PRM MW) / (forecasted annual peak load MW)] x 100
The following table compares ISO-NE’s ARMs and PRMs for 2006 through 2010.
16 The CELT Report, 2011-2020 Forecast Report of Capacity, Energy, Loads, and Transmission, is available at http://www.iso-
ne.com/trans/celt/report/index.html.
17 NICR = ICR - HQICC (Hydro-Quebec Installed Capacity Credit).
2011 ISO/RTO Metrics Report91
ISO-NE Actual and Planned Reserve Margins, 2006-2010
Year
Reserve MarginReserve Margin
Type(MW)
Reserve Margin (%)
2010Planned2,95010.5
The lowest ARM occurred in 2006 at 4,253 MW and 15.1%, and the highest was in 2009 at 9,603 MW and 38.3%.
The lowest PRM occurred in 2007 at 2,712 MW and 9.9%, and the highest was in 2008 at 2,990 MW and 10.7%.
ISO-NE’s Forward Capacity Market (FCM) transition period (2007-2009) encouraged the installation of capacity.
Under the FCM Settlement Agreement, the amount of unforced capacity that could request inclusion was not capped, thus ISO-NE had more capacity than needed to meet its peak demand and operating reserve requirements.18 This can be seen by the increase in the ARM from 2007 to 2009. Most of the increase during this period was the result of growth in the participation of demand-response resources and increased capacity imports in response to the FCM transition payment rate, which was in excess of prevailing rates in adjacent regions.
ISO-NE’s FCM began on June 1, 2010. Each annual Forward Capacity Auction (FCA) procures capacity resources to
meet the region’s projected resource adequacy requirement three years into the future. Additional resources or
portions of resources without a capacity supply obligation (CSO) may continue to participate in the energy and
reserves markets and provide additional installed capability.19 The quantity of resources procured within the FCA is
derived by proposing an Installed Capacity Requirement (ICR) value.20 The ICR is a measure of the installed capacity
resources projected to be necessary to (1) meet reliability standards in light of total forecast demand requirements for
the New England Balancing Authority Area, and (2) maintain sufficient reserve capacity to meet reliability standards.
More specifically, the ICR is the quantity of resources needed to meet the reliability requirements defined for the New
18 Unforced capacity is the amount of installed capacity associated with a resource, adjusted for availability.
19 In the ISO-NE system, a capacity supply obligation is a requirement for a resource to provide capacity, or a portion of capacity, to satisfy a portion of the ISO’s Installed Capacity Requirement acquired through a Forward Capacity Auction, a reconfiguration auction, or a CSO bilateral contract through which a market participant may transfer all or part of its CSO to another entity.
20 The methodology for calculating the ICR is set forth in Section III.12 of Market Rule 1. The ICR is eventually reviewed and approved by
FERC.
2011 ISO/RTO Metrics Report92
England Balancing Authority Area of disconnecting noninterruptible customers no more than one time every 10 years (0.1 loss-of-load expectation; LOLE).
In 2010, the first year of the FCM, the decrease in ARM reflects ISO-NE’s procurement of resources to meet the ICR.
While there is still an excess of resources above the ICR, the 2010 ARM value is significantly smaller than those of
the ARMS during the transition period. The gap between the ARMs and PRMs are expected to decrease once the
FCM floor price is removed, and as ISO-NE continues to procure only enough resources to meet the LOLE reliability
requirement.
ISO-NE develops the demand forecast primarily through the methodology it has used for a number of years.
However, the forecast continues to reflect incremental improvements to the methodology itself, as well as economic
and demographic assumptions reviewed periodically and supported by the New England Power Pool (NEPOOL)
Load Forecast Committee (LFC).21 The methodology is updated when necessary in consultation with the NEPOOL
LFC.22 The peak-load forecasts of the entire New England Balancing Authority Area are a major input into the
calculation of the ICR, and the peak-load forecasts for the individual load zones are used to develop the associated
local sourcing requirements (LSRs) from import-constrained load zones and maximum capacity limits (MCLs) from
export-constrained load zones.
The FCM is designed to address changes in (1) the demand forecast, (2) resource availability, and (3) load and
capacity relief assumed obtainable by operator actions implemented during a capacity deficiency that occurs in the three-year period between administering the applicable FCA and the corresponding capacity commitment period (CCP). For each CCP, ISO-NE conducts three annual reconfiguration auctions (ARAs) during the interim period that adjusts the amount of regional capacity procured within the FCA.
To calculate the ICR for each ARA, ISO-NE uses the most recent version of the 10-year demand forecast, as
published in April of each year in the most current CELT Report. By accounting for fluctuations in the demand
forecast, resource availability, emergency actions for load, and capacity relief from system operators, the
development of the ICR for each ARA ultimately ensures system reliability through the procurement of the correct amount of regional capacity.23
Within the FCM, demand-side and supply-side resources each can provide capacity. While demand response has
participated in the ISO-NE capacity markets since 1998, the number of demand resources providing capacity to the
region has grown considerably. Since opening up the capacity market to demand-side resources in 2006, the region
21 NEPOOL is a voluntary association of the participants in New England’s wholesale electricity marketplace.
22 Two locations on ISO-NE’s website contain more detailed information on short-run and long-run forecast methodologies; models and inputs;
weather normalization; forecasts of regional, state, and subarea annual electric energy use and peak loads; high- and low-forecast bandwidths;
and retail electricity prices. This information is located at: http://www.iso-ne.com/markets/hstdata/hourly/index.html and
http://www.iso-ne.com/trans/celt/fsct_detail/index.html.
23 Within ISO-NE’s FCM, both active (demand response) and passive (energy efficiency) demand-side resources are allowed to be treated as capacity to serve regional load. Past and future nonmarket demand response and energy efficiency are not nor will be reflected within the ICR calculation. Thus, in turn, they are not nor will be reflected in the ARM or PRM.
2011 ISO/RTO Metrics Report93
has seen the amount of demand response grow from 500 MW to more than 2,000 MW. The following graph shows
the percentage of compensated capacity during summer (peak) months that was categorized as demand response.
ISO-NE Demand-Response Capacity as a Percentage of Total Installed Capacity, 2006-2010
12%
10%
8%
6.47%
6%
4%
2%
0%
20062007200820092010
To achieve further benefits from the increase in demand resources, ISO-NE recently implemented improvements to the software and communications infrastructure used between demand resources and the ISO during real-time operations. New dispatch rules have been in place since June 2011 to allow operators to call on demand resources where, when, and in the amount they are needed.
2011 ISO/RTO Metrics Report94
Percentage of Generation Outages Cancelled by ISO-NE
ISO-NE may cancel a planned generation outage if it assesses a potential reliability concern arising from the outage. The following graph shows the percentage of planned generation outages ISO-NE cancelled from 2006 to 2010, which has never been greater than 1%.
ISO-NE Percentage of Generation Outages Cancelled, 2006-2010
1.00%
0.50%
0.00%
20062007200820092010
Generation Must-Run Contracts
The following table provides details about the Reliability Agreements in place with units within the New England
Balancing Authority Area from 2006 through May 2010. To ensure system reliability, local generation may be
required to run where the system is constrained. Through its planning processes, ISO-NE develops transmission
alternatives to ensure continued reliability of the power system and forecasts resource capacity requirements to meet forecast demands.
2011 ISO/RTO Metrics Report95
ISO-NE “Must-Run” Generation Contracts, 2006-2010
# of
YearAgreements
200616
200710
200810
20099
Jan to May 20109
Jun to Dec 20101
Total MW% of Systemwide
# of Units(SummerCapacity
SCC)(a)(Summer SCC) (a)
345,84319
193,20310
193,20010
172,7119
172,7119
11620,5
Total
Total Reliability
Payments
$348,687,863
$140,755,214
$127,217,346
$84,925,919
$10,898,731
$1,978,830
$714,463,903
(a) SCC stands for seasonal claimed capability, a generator's maximum dependable load carrying ability during the summer months (June-September).
Through competition in the Forward Capacity Market and transmission system improvements, the number of
generating units being compensated through Reliability Agreements has trended downward over time. All ―must-run‖
generation contracts were terminated as of May 31, 2010. Beginning with the FCM on June 1, 2010, generating
resources can have delist bids denied if they are deemed necessary for reliability.24 Depending on the type of delist
bid denied, these resources may be compensated on the basis of the delist bid price or through a cost-of-service
agreement.
In New England, a Demand-Response Reserve (DRR) Pilot Program was implemented on October 1, 2006, with the
goal of determining how small demand-response resources (with a maximum load reduction of less than 5 MW)
would perform under frequent dispatch conditions similar to those of generators dispatched for system contingencies.
The first phase of the DRR Pilot Program commenced on October 1, 2006, and the final phase ended on May 31,
2010.
Under the DRR Pilot Program, ISO-NE separately solicited demand-response resources for each winter and summer
season in the same timeframes as the Forward Reserve Market (FRM) procurement periods. A variety of small
demand-response resources were selected to represent the population of resources that would likely participate in a
competitive market.
The following table shows the percentage of ancillary services (defined as hourly total 30-minute reserve requirement) supplied by DRR assets:
24 Delist bids are requests by existing capacity resources to be removed from a Forward Capacity Auction.
2011 ISO/RTO Metrics Report96
ISO-NE Demand Response as a Percentage of Total Hourly Reserve Requirement, 2006-2010
12%
10%
8%
6%
4%
2%
0.82%
0%
20062007200820092010
Interconnection/Transmission Service Requests
This ISO/RTO performance metric identifies the number of requests to ISO-NE for interconnection service or
transmission service. The metric for the number of requests for 2006 to 2010, as shown in the following graph, was
calculated by summing the number of requests ISO-NE received in a calendar year. The majority of the projects are
associated with generation interconnection requests, while only a handful of projects are associated with elective
transmission upgrade requests and requests for transmission service that require study. Factors affecting the number
of interconnection study requests include standards resulting from FERC’s Orders 2003 and 2006, the
implementation of New England’s Forward Capacity Market, state requests for proposals for generation resources,
and state policies regarding treatment of renewable resources.25 To limit the number of interconnection requests
based on speculative project proposals that caused a backlog in the ISO’s Generator Interconnection Queue, in 2009
FERC accepted amendments to ISO-NE’s tariff, which increased the deposit structure for large generating facilities
seeking interconnection. ISO-NE understands formal complaints to mean Section 206 complaints, and no entity has
filed such a formal complaint against ISO-NE.
25 FERC, Standardization of Generator Interconnection Agreements and Procedures, 104 FERC ¶ 61,103, Docket No. RM02-1-000, Final Rule
(July 24, 2003), http://www.ferc.gov/legal/maj-ord-reg/land-docs/order2003.asp. FERC, Standardization of Small Generator Interconnection
Agreements and Procedures, Docket No. RM02-12-000, Final Rule (May 12, 2005),
http://www.ferc.gov/EventCalendar/Files/20050512110357-order2006.pdf.
2011 ISO/RTO Metrics Report97
ISO-NE Number of Interconnection Study Requests, 2006-2010
500
450
400
350
300
250
200
150
100
50
0
20062007200820092010
The indices in the next graph were calculated by totaling the number of studies completed in a calendar year. The studies included feasibility, system impact, and facilities studies for generation interconnection requests; elective transmission upgrade requests; and requests for transmission service that require study. These indices do not include studies for generator interconnection requests that did not fall under FERC’s jurisdiction. Projects that were queued later may be electrically dependent on the results from projects that were queued earlier. This limits the number of studies that can be conducted simultaneously.
ISO-NE Number of Studies Completed, 2006-2010
700
600
500
400
300
200
100
0
20062007200820092010
2011 ISO/RTO Metrics Report98
The indices in the graph below were calculated by summing the age of incomplete studies as of December 31 of a
calendar year. To determine the age of a study, the start date used was the date on which the study agreement was
fully executed. The studies included feasibility, system impact, and facilities studies for generation interconnection
requests; elective transmission upgrade requests; and requests for transmission service that require study. These
indices do not include studies for generator interconnection requests that did not fall under FERC’s jurisdiction.
ISO-NE Average Age of Incomplete Studies, 2006-2010
(Calendar Days)
800
700
600
500
400
300
200
100
0
20062007200820092010
ISO-NE conducts studies in the order they enter the interconnection queue. Thus, the start of one study can be delayed if it is dependent on the results of another study with an earlier queue position.
The indices in the next graph were calculated by summing the ages of studies completed in a calendar year. To
determine the age of a study, the start date used was the date on which the study agreement was fully executed. The studies included feasibility, system impact, and facilities studies for generation interconnection requests; elective transmission upgrade requests; and requests for transmission service that require study. The indices do not include studies for generator interconnection requests that did not fall under FERC’s jurisdiction.
2011 ISO/RTO Metrics Report99
ISO-NE Average Time to Complete Studies, 2006-2010
(Calendar Days)
800
700
600
500
400
300
200
100
0
20062007200820092010
Average Cost of Each Type of Study Completed
To determine the cost of a study, the annual expenses for a project were summed and counted in the year the study was completed. These expenses were then averaged for projects completed during a given year. The studies
included feasibility, system impact, and facilities studies for generation interconnection requests; elective
transmission upgrade requests; and requests for transmission service that require study. The indices do not include studies for generator interconnection requests that did not fall under FERC’s jurisdiction.
Several issues affect the calculated indices:
Average study costs may include costs that were incurred by the respective transmission owners
performing the requested and necessary studies, which were then submitted to ISO-NE for direct billing back to the requesting customer.
The cost of developing an interconnection agreement typically is included in the cost of a system impact
study, which increases the apparent cost of system impact studies.
In several cases, a system impact study has been completed, but development of the interconnection
agreement is continuing into 2011.
Facilities studies may be waived under ISO-NE’s tariff. This accounts for the low number of facility studies. The calculated indices are shown in the following tables.
2011 ISO/RTO Metrics Report100
Number of Completed Feasibility Studies by ISO-NE, 2006-2010
Year
Number of Completed
Feasibility Studies
Number of Completed Feasibility Studies With
Cost Data
Cost of Studies Completed
in Calendar Year
201088$94,960
Number of Completed System Impact Studies by ISO-NE, 2006-2010
Year
Number of Completed
System Impact Studies
Number of Completed
System Impact Studies With
Cost Data
Cost of Studies Completed
in Calendar Year
Number of Completed Facilities Studies by ISO-NE, 2006-2010
Year
Number of Completed
Facilities Studies
Number of Completed
Facilities Studies With Cost
Data
Cost of Studies Completed
in Calendar Year
201011$131,692
2011 ISO/RTO Metrics Report101
The following trends have been observed for the analysis periods:
An increasing number of wind projects have been subject to Material Modification Determinations because
of project proponents changing the type of wind turbines being used in their project(s) after the System Impact Study has commenced.
Projects are trying to extend their commercial operation dates when reliability transmission upgrades in
the area are delayed.
More projects are in proximity to each other and are directly competing with other projects within the
interconnection queue. This is leading to study delays because of earlier-queued project dependencies.
Wind interconnection studies are becoming more involved and detailed, in part because of the complex
interactions of the electronic controls of wind generators and other equipment, especially in the weaker parts of the power system where the largest interest in development is occurring.
Degradation in overall system performance is occurring because of the introduction of new wind
resources, which do not have the robust behavior of other resources they are displacing. This further complicates interconnection studies for subsequent wind projects.
Projects withdrawing from the interconnection process have generally indicated business reasons for the
withdrawal rather than difficulty within the interconnection process itself.
More projects are having difficulty securing Power Purchase Agreements. In many areas of New England,
Power Purchase Agreements must be approved by the state’s Public Utilities Commission, and construction cannot begin until this approval is received.
An increasing number of projects are being issued a Notice of Withdrawal because they are not meeting
their obligations under ISO-NE’s interconnection procedures. Most projects have been able to resolve their deficiencies.
Most of the new generation interconnection requests being proposed are for wind or biomass projects. The
following figure shows the resources in the ISO-NE Generator Interconnection Queue, by state and fuel type, as of April 1, 2011. The 85 active projects in the queue total 7,992 MW.
2011 ISO/RTO Metrics Report102
Resources in the ISO-NE Generator Interconnection Queue,
by State and Fuel Type, as of April 1, 2011
New HampshireVermont
430 MW333 MW
5.4%4.2%
Rhode IslandMaine
677 MW2,457 MW
8.5%30.7%
Masssachusetts
1,872 MW
23.4%
Connecticut
2,223 MW
27.8%
OtherOil
Renewables43 MW
484 MWNuclear0.5%
6.1%42 MW
0.5%Coal
Hydro &36 MW
Pumped0.4%
Storage
1,135 MW
14.2%
Gas
3,266 MW
40.9%
Wind
2,986 MW
37.4%
Notes: The natural gas category includes a 9 MW fuel cell project. The 1,135 MW of total hydroelectric and pumped storage projects includes only 35 MW of hydroelectric projects.
Special Protection Systems
The New England transmission system has a number of special protection systems (SPSs). An SPS is a protection
system designed to detect abnormal system conditions and take corrective actions other than the isolation of faulted
elements. Such actions may include changes in load, generation, or system topology to maintain system stability,
acceptable voltages, or power flows. These systems are designed and maintained in accordance with the NPCC
Directory 7 and ISO-NE Planning Procedure No. 5-5, Special Protection Systems Application Guidelines.26 The
NPCC identifies three types of SPSs, depending on the potential impact to the interconnected and local systems:
NPCC Type I SPSs recognize or anticipate abnormal system conditions resulting from design and
operating criteria contingencies. The misoperation of a Type I SPS or its failure to operate would have a significant adverse impact outside the local area, will result in a violation of a NERC system operating limit (SOL), and will likely result in a violation of an interconnection-reliability operating limit (IROL).27 The
corrective action taken by these SPSs, along with the actions taken by other protection systems, is
intended to return power system parameters to a stable and recoverable state.
26 NPCC Regional Reliability Reference Directory # 7, Special Protection Systems (December 27, 2007),
http://www.npcc.org/documents/regStandards/Directories.aspx. ISO-NE Planning Procedure No. 5-5, Special Protection Systems Application
Guidelines (June 22, 2009), http://www.iso-ne.com/rules_proceds/isone_plan/pp5_5_r3.pdf.
27 NERC defines an SOL as the value (such as MW, MVar, amperes, frequency, or volts) that satisfies the most limiting of the prescribed
operating criteria for a specified system configuration to ensure operation within acceptable reliability criteria. It defines an IROL as a system operating limit that, if violated, could lead to instability, uncontrolled separation, or cascading outages that have an adverse impact on the reliability of the bulk electric system..
2011 ISO/RTO Metrics Report103
NPCC Type II SPSs recognize or anticipate abnormal system conditions resulting from extreme
contingencies or other extreme causes. The misoperation or failure to operate of Type II SPSs also would have a significant adverse impact outside of the local area (i.e., will likely result an IROL violation).
NPCC Type III SPSs are those with the potential to create local impacts only, if they fail to operate or
misoperate, and result in a violation of an SOL only.
Because of the potential impacts of Type I SPSs on the interconnected system, NPCC and ISO-NE criteria require
full redundancy of all components of the SPS (i.e., the SPS shall be designed with sufficient redundancy such that
the SPS can perform its intended function while itself experiencing a single failure). NPCC retains the authority to
review and concur on all new SPS proposals or changes to existing SPSs. There are four categories of SPS
operation:
Normal Operation: the SPS successfully operated as designed for the initiating system event for which it
was intended to provide protection.
Failure to Operate: the SPS did not operate as designed for the initiating system event for which it was
intended to provide protection.
Unintended or Inadvertent Operation: the SPS successfully operated for an unrelated initiating system
event for which it was not intended to take action.
Misoperation: the SPS did not successfully operate as designed (partial operation) for the initiating
system event for which it was intended to take action.
Currently, seven Type I and two Type II SPSs are installed in New England. The following graph summarizes the number of SPSs within New England during 2010.
2011 ISO/RTO Metrics Report104
Number of ISO-NE Type I and Type II Special Protection Schemes, 2011
100
90
80
70
60
50
40
30
20
1072
0
ISO-NE Type 1ISO-NE Type 2
New England had one Type I SPS and no Type II SPS operations during 2010. The Type I SPS operation was the
result of relay maintenance work in New Brunswick. The SPS is designed to trip one generator in New England upon
the loss of any one of the two 345 kV paths between New Brunswick and New England under certain transfer
conditions. In this case, no initiating 345 kV circuit tripped, but the SPS received a trip signal during the relay
maintenance work, resulting in the SPS tripping the generator. This was an unintended operation and did not affect
system reliability.
2011 ISO/RTO Metrics Report105
B. ISO New England Coordinated Wholesale Power Markets
For context, the table below categorizes the $10.7 billion billed by ISO-NE in 2010 into the primary types of charges its members incurred for their market transactions.
ISO-NE Market Transaction Charges, 2010
Energy Markets Capacity
Transmission Tariff
Reserve Markets
Operating Reserves (NCPC)(a) FTR Auction Revenues
Regulation Market
ISO-NE Administrative Expenses
Total
2010 Dollars BilledPercentage of
Millions2010 Dollars Billed
$7,28467.8%
$1,64715.3%
$1,41713.2%
$1301.2%
$890.8%
$300.3%
$140.1%
$1371.3%
$10,748 100.0%
(a) Net Commitment-Period Compensation (NCPC) is a method of providing ―make-whole‖ payments to market
participants with resources dispatched out of economic-merit order for reliability purposes when the costs of providing energy or reserves from the resources would otherwise exceed the revenue paid to the market participant.
ISO-NE focuses on the accuracy of both finalized prices and billing amounts to ensure that participants have
confidence in the bill amounts included in their invoices. From 2008 to 2010, ISO-NE’s posted pricing accuracy was
99.74%, with 99.7% error-free hours during 2010.
ISO-NE’s billing protocols include an initial settlement and a ―data reconciliation process‖ settlement conducted about
90 days after the initial settlement for its billable hourly and monthly market services. Beginning in October 2008,
ISO-NE began deriving a metric that reflects both the number and dollar magnitude of the changes to the initial
settlement. Most changes are attributable to more accurate metering information submitted by market participants.
For each of the 12 months in 2010, the change in billing amounts between the initial settlement and the data
reconciliation settlement, as a percentage of the total market value billed, averaged 0.007%, or about $62,200 per
month.
2011 ISO/RTO Metrics Report106
Market Competitiveness
Two types of measures can be used to assess the competitiveness of electric energy markets: structural measures, which analyze the concentration of generation resource ownership in the New England markets; and price-based
measures, which compare wholesale market prices with the estimated cost of providing electric energy. While not included in this report, structural measures of the New England markets show that they are structurally competitive, with the Herfindahl-Hirschman Indices (HHIs) for the regionwide market well within the Department of Justice
guidelines for a competitive market.28
The competitive benchmark model is a price-based measure of market competitiveness that produces market prices
using participant offers and Internal Market Monitor (IMM) estimates of resource marginal costs. The results of the
competitive benchmark model are used to calculate the Quantity-Weighted Lerner’s Index (QWLI). The QWLI is the
percentage markup of price over marginal cost, but because it is model based, it is subject to estimation error in both
the model and marginal costs. Consequently, its primary diagnostic value is how it changes over time. In assessing
whether changes over time reflect a change in the market’s competitiveness, it is helpful to keep in mind the difficulty
of precisely measuring prices and costs. One measure of this uncertainty is the 10% markup over costs that FERC
has approved for PJM’s market monitor to use in calculating mitigated bids for the PJM energy market. Thus, year-to-
year changes of less than 10%, such as those seen over the past several years, are not likely to reflect changes in
the market’s competitiveness.
Given these modeling and estimation limits, the IMM determined that the recent QWLI results, as shown on the
following table, are consistent with competitive market outcomes. A comparison of the relationship between the price of natural gas (the dominant marginal fuel) and electricity prices further supports this conclusion. The correlation between natural gas and on-peak real-time energy prices (Hub LMPs) is approximately 0.94; the variance in natural gas prices explains about 90% of the variance in on-peak real-time Hub LMPs.
28 See US Department of Justice and the Federal Trade Commission, Horizontal Merger Guidelines (Washington, DC: US Department of
Justice and Federal Trade Commission, August 19, 2010), http://www.justice.gov/atr/public/guidelines/hmg-2010.html.
2011 ISO/RTO Metrics Report107
ISO-NE Quantity-Weighted Lerner Index
15%
10%
5%
0%
-5%
-10%
-15%
20062007200820092010
Note: The QWLI = [(annual market cost based on market prices − annual market cost based on marginal cost estimates)/ annual market cost based on market prices].
The completion of transmission lines in Connecticut and Boston have significantly reduced congestion, thereby
significantly reducing the likelihood that resources in a submarket could benefit from the exercise of market power. This risk is further mitigated by the market-power mitigation rules for constrained areas.
The following table presents yearly estimates of the gross margin (energy revenues minus fuel costs) earned by
typical gas-fired combined-cycle (CC; also CCGT) and combustion turbine (CT) units in New England. The analysis
presents the margin realized in hours when the prevailing real-time locational marginal price (LMP) at the Hub
exceeded the resource’s fuel cost. The analysis assumes that the resources are available in all hours, so it may
overestimate the margins gained by actual units subject to outages. The analysis assumes the regional Algonquin
Citygate natural gas price, a 7,800 Btu/kWh combined-cycle heat rate, and an 11,000 Btu/kWh combustion turbine
heat rate.
ISO-NE Yearly Estimates of the Gross Margin Earned by Typical CT and CCGT Units
in New England, 2006-2010
Natural GasReal-TimeGrossGross Margin
YearIndexLMPMargin CTCCGT
($/MMBtu)(a)($/MWh)($/kW-mo)($/kW-mo)
20067.4059.68$1.67$5.86
20078.1766.72$1.61$6.48
200810.0780.56$2.05$7.58
20094.7942.02$1.50$5.03
20105.2949.56$3.34$7.64
(a) MMBtu stands for millions of British thermal units.
2011 ISO/RTO Metrics Report108
ISO-NE New Entrant Gas-Fired Combustion-Turbine Net Generation Revenues, 2006-2010
($ per installed megawatt year)
$150,000
$100,000
$50,000
$0
20062007200820092010
ISO-NE New Entrant Gas-Fired Combined-Cycle Net Generation Revenues, 2006-2010
($ per installed megawatt year)
$150,000
$100,000
$50,000
$0
20062007200820092010
In addition to energy revenues, many CC resources earn revenues for providing real-time reserve and regulation
service. All resources are eligible to receive capacity revenues, and fast-start resources, such as CT units, may
participate in and receive Forward Reserve Market (FRM) revenues.
2011 ISO/RTO Metrics Report109
The following table presents, for each year, the number and percentage of hours that energy market mitigation in real time was imposed under the thresholds in Market Rule 1, Appendix A, Section 5. The figure below shows the
percentage of real-time energy market unit hours mitigated, 2006 to 2010.
ISO-NE Real-Time Energy Market Mitigation Hours Imposed under Market Rule 1, Appendix A, Section 5,
2006-2010
Total
MitigatedTotal Hours% Mitigated
YearHoursPer YearHours
2006128,7600.14%
2007548,7600.62%
2008438,7840.49%
200908,7600.00%
2010838,7600.95%
Note: 2008 is a leap year.
ISO-NE Percentage of Real-Time Energy Market Unit Hours that Were Offer Capped because of Mitigation
2006-2010
3%
2%
1%
0%
20062007200820092010
2011 ISO/RTO Metrics Report110
Market Pricing
Since March 2003, the wholesale electric energy markets administered by ISO-NE have used LMPs for their
transactions. These values, computed every five minutes at nearly 1,000 nodal locations, are combined using a load-
weighted average to calculate zonal average LMPs for the eight load zones within the New England Balancing
Authority Area. With limited exceptions, load pays the hourly zonal price at its location. For the following figure, the
hourly zonal price for every hour in the year indicated was multiplied by its zonal load obligation in the real-time
market. These load-weighted average hourly prices were computed and then arithmetically averaged over the year,
as shown in the figure.
ISO-NE Average Annual Load-Weighted Wholesale Energy Prices, 2006-2010
($/MWh)
$100
$90
$80
$70
$60
$50
$40
$30
$20
$10
$0
20062007
$49.51
200820092010
The yearly average real-time LMP has trended downward overall in New England in the past five years. Pricing is
influenced by underlying input fuel prices (primarily natural gas), which have driven the historical price trajectory. The
increase in 2008 was caused by increases in natural gas prices during that year. The highest yearly average Hub
LMP was observed during 2008 at $80.79/MWh. The 2009 average dropped by nearly half to $41.99/MWh, and rose
to $49.51/MWh in 2010. The following figure shows nominal fuel costs in the United States from 2006 to 2010.
2011 ISO/RTO Metrics Report111
U.S. Nominal Fuel Costs, 2006-2010
($ per Million Btu)
$25
$20
$16.59
$15
$12.56
$10
$5$5.08
$2.26
$0
20062007200820092010
CoalNatural GasResidual Fuel OilDistillate Fuel Oil
Source: U.S. Energy Information Administration, Independent Statistics and Analysis. ―Table 2. U.S. Energy Prices, EIA/Short-
Term Energy Outlook—June 2011,‖ http://www.eia.gov/emeu/steo/pub/2tab.pdf.
ISO-NE calculates the fuel-adjusted electricity price by adjusting the marginal LMPs by the ratio of the daily fuel
prices to the average monthly fuel prices of the corresponding market intervals and marginal fuel types in the base
year. ISO-NE’s base year for fuel-cost references is 2000. The result of this approach illustrates the impact of fuel
prices on electricity prices. The methodology used provides only a rough estimate because it does not account for
the impact that changes in relative fuel prices, load growth, and resource mix since 2000 have had on system
dispatch and pricing.
After adjusting for changes in fuel prices, average energy prices have remained stable since 2000. The following figure shows the data for 2006 to 2010.
2011 ISO/RTO Metrics Report112
ISO-NE Average Annual Load-Weighted Fuel-Adjusted Wholesale Spot Energy Prices, 2006-2010
($/MWh)
$100
$90
$80
$70
$60
$50
$40$42.53
$30
$20
$10
$0
20062007200820092010
Impacts of Demand-Response Programs on Locational Marginal Prices
Every six months since February 2003, ISO-NE has filed status reports with FERC regarding participation in and
impacts of demand-response programs administered by ISO-NE.29 These status reports include estimates of the
effects of demand-response programs on real-time LMPs. Using the information from the status reports, the following table shows the effects of ISO-NE’s demand-response programs on real-time LMPs for the New England region for January 2008 through December 2010.
29 ISO New England, Inc., et al., Order on Tariff Filing, 102 FERC ¶ 61,202 at P 19 (February 25, 2003). Also see the ISO website, ―DR
Reports‖ at shttp://www.iso-ne.com/genrtion_resrcs/dr/rpts/index.html.
2011 ISO/RTO Metrics Report113
Estimated Effects of All Demand-Response Program Interruptions
on New England’s Real-Time LMPs, 2008-2010
InterruptedObserved AverageAverage Real-Time LMP
Reporting PeriodMWhReal-Time LMP ($/MWh)Decrease ($/MWh)
Jan to Mar 200855,05992.151.43
Apr to Jun 200820,773137.430.31
July to Sep 20089,331125.680.27
Oct to Dec 20086,02372.380.26
Jan to Mar 200910,82375.550.19
Apr to Jun 20095,07643.860.04
Jul to Sep 200913,54057.011.06
Oct to Dec 200912,43571.850.13
Jan to Mar 20102,77376.400.13
Apr to May 2010(a)5,09962.270.61
Jun to Sep 2010(a, b)110,62082.621.72
Oct to Dec 201038,59063.470.51
(a) For the April to September 2010, the price impacts are averaged over time periods of other than three months:
April through May, when the reliability programs (Real-Time 30-Minute Demand-Response Program, Real-Time
Two-Hour Demand-Response Program, and Real-Time Profiled-Response Program) were still active, and June
through September (after the reliability programs ended), representing the impacts of the Real-Time Price-
Response Program and of assets participating in Day-Ahead Load-Response Program. Refer to ISO-NE’s 2010
Annual Markets Report (June 3, 2011) for additional information about these programs, http://www.iso-
ne.com/markets/mkt_anlys_rpts/annl_mkt_rpts/2010/amr10_final_060311.pdf.
(b) The significant increase in interrupted amounts from June to September 2010 corresponds to a substantial
increase in the number of assets participating and clearing in the Day-Ahead Load-Response Program.
The following graph reflects the average annual wholesale power costs for load purchasing from the New England wholesale energy markets. The costs are categorized into the major charge components ISO-NE administers,
converted to $/MWh of load served. Because of the various ways in which participants may transact business within the New England markets, not all load-serving entities are subject to all the charge categories. Of note during 2010 was the slight increase in energy-market-related charges, stemming from increased input fuel prices. Capacity
charges declined during 2010, influenced by the commencement of the Forward Capacity Market on June 1, 2010. This market implementation marked the termination of the FERC-approved transition period for capacity payments that encompassed the period December 2006 through May 2010.
2011 ISO/RTO Metrics Report114
ISO-NE Wholesale Power Cost Breakdown, 2006-2010
($/MWh)
$120
$104.54
$100
$80
$60
$40
$20
$0
$87.73
$72.48
200620072008
$76.02
$67.11
20092010
RTO Cost & Regulatory Fees Operating Reserves
Ancillary Services Transmission
Capacity
Energy
Over the reporting period, ISO/RTO costs and regulatory fees have remained approximately 1% of overall costs, while the costs for ancillary services have declined as part of the total cost. The cost for electric energy increased slightly during 2010 from its 2009 values as a result of fuel price movements. Transmission costs have increased their percentage of the total cost over the same period.
The increase in transmission costs, primarily driven by infrastructure additions made to the New England system
from 2006 to 2010, contributes to the decline in operating-reserve charges over the time period. Before transmission
system improvements were made, the major cause of these operating reserve charges was out-of-market generator
commitments ISO-NE made to support reliability because of deficiencies in transmission infrastructure in certain
areas.
Operating-reserve credits, or Net Commitment-Period Compensation (NCPC), averaged more than $175 million per
year from 2006 to 2010, representing on average approximately 1.8% of the value of the energy market. The overall
effect of transmission improvements in southwestern Connecticut and in southeastern and northeastern
Massachusetts (i.e., SEMA and NEMA upgrades) was realized during 2009 when NCPC payments dropped to $55
million, or less than 1% of the energy market value. The increase in first-contingency NCPC payments during 2010
was caused by a variety of separate, yet sometimes concurrent, operational conditions. The loss of generating
capacity between the day-ahead and real-time markets, low day-ahead market clearing, and fuel availability and
price movements all contributed to these increased payments at various times and in various situations throughout
the year.
One of the most prevalent scenarios experienced during the year was the need to commit relatively high-cost, oil-
fired generators to ensure sufficient generating capacity for the forecasted load and reserve requirements over the
peak hour. Because of their high costs and inflexible intertemporal operating parameters (e.g., notification times, start
times, response rates, and minimum run time), these resources generally do not clear in the day-ahead market.
2011 ISO/RTO Metrics Report115
When committed as part of the resource adequacy assessments leading into the operating day, these resources
generally operate at levels near their economic minimum during most hours of the day. They are only dispatched
above these minimum operating levels for the peak hours of the day. Consequently, the total cost of running these
units exceeded their total revenues collected through the energy market, with the difference being paid as first-
contingency NCPC.
From 2006 to 2010, ISO-NE’s net revenue requirements recovered through the Self-Funding Tariff grew at an
average rate of 6% per year, from $109.4 million to $137.2 million. The ISO-NE net revenue requirements reflect the FERC-approved budgets adjusted for prior-year over- and undercollections. The increases largely reflect expanded levels of service with regard to the Forward Capacity Market, demand-response integration, system planning, and increased compliance-management activities.
System Marginal Cost
In the next graph, the hourly system price (consistent with ISO-NE’s FERC Form 714 filing) for every hour in 2006
through 2010 was averaged over the entire year.30 Pricing in the New England wholesale markets is heavily
influenced by underlying fuel prices. The values in the figure reflect the movements in the underlying increases in fuel prices experienced in 2007 and in 2008.
ISO-NE Annual Average Nonweighted System Marginal Cost,
2006-2010
$100
$90
$80
$70
$60
$50
$40
$30
$20
$10
$0
20062007200820092010
30 Refer to the FERC website, ―Form No. 714 - Annual Electric Balancing Authority Area
and Planning Area Report‖ (June 7, 2011), http://www.ferc.gov/docs-filing/forms/form-714/elec-subm-soft.asp.
2011 ISO/RTO Metrics Report116
Energy Market Price Convergence
Good convergence between day-ahead and real-time prices is a sign of a well-functioning day-ahead market that
helps ensure efficient day-ahead commitments and reflect real-time operating needs. Because the day-ahead market
facilitates most of the energy settlements and generator commitments, in general, good convergence between day-
ahead and real-time electric energy prices is achieved when participants submit price-sensitive bids and offers in the
day-ahead market that accurately forecast next-day real-time conditions. The following two graphs reflect the
absolute value and percentage of the average annual difference between Real-Time Energy Market prices and Day-
Ahead Energy Market prices.
ISO-NE Day-Ahead and Real-Time Energy Market Price Convergence, 2006-2010
$1.40
$1.20
$1.00
$0.80
$0.60
$0.40
$0.20
$0.00
20062007200820092010
ISO-NE Percentage of Day-Ahead and Real-Time Energy Market Price Convergence, 2006-2010
100%
80%
60%
40%
20%
0%
20062007200820092010
2011 ISO/RTO Metrics Report117
ISO-NE’s Day-Ahead Energy Market to Real-Time Energy Market average price convergence remained high over the
five-year period from 2006 to 2010, averaging over 98.6%. Transaction costs associated with virtual trading in the
Day-Ahead Energy Market appear to have had a negative effect on day-ahead to real-time convergence during the
last two years 31
Congestion Management
Transmission congestion occurs when constraints on the transmission system prevent the reliable transfer of lower-
cost energy to serve an area. Quite often, these constraints occur where the transfer capability is limited for supplying
an area that has a potential reliability concern. During the planning process, ISO-NE uses information obtained from
system Needs Assessments, which provide a variety of market signals, to develop possible solutions to transmission
congestion. These solutions can include merchant transmission or market resource alternatives, such as generation,
demand reduction, or other promising technologies, all of which could result in modifying or deferring a proposed
regulated transmission upgrade. If the market does not respond, a regulated, robust transmission solution is
developed to meet existing and future system requirements. As a result, transfer capabilities usually are increased and congestion is eliminated.
The transmission system in New England has evolved significantly over the past several years. From 2002 through 2010, more than 300 transmission projects have been placed in service, with an additional number of projects under construction or well into the siting process. In addition to system reliability improvements, these transmission
upgrades have supported marketplace efficiency by helping reduce congestion costs and other out-of-merit charges, such as second-contingency and voltage-control payments. As noted in the discussion above on market pricing,
during 2009, when NCPC dropped to $55 million (i.e., less than 1% of the value of the energy market), the effects of the 345 kV transmission additions in Southwest Connecticut and the SEMA and NEMA transmission improvements were realized. From 2006 through 2010, NCPC in New England had averaged more than $175 million per year (i.e., an average of 1.8% of the value of the energy market).
Recent experience has demonstrated that the regional transmission system in New England has little congestion.32
The US Department of Energy (DOE) recognized the region’s ―multifaceted approach‖ to investment in new supply-
and demand-side resources, as well as its planning and development of extensive transmission upgrades, and
removed New England as ―an area of concern‖ for the identification of National Interest Electric Transmission
Corridors (NIETC).33
Transmission congestion, when it occurs, is reflected in the congestion component of the LMP. In the New England
system, the overwhelming majority of the congestion that occurs is in the day-ahead market. Because virtual trading
31 For a detailed discussion, see the ISO’s 2010 Annual Markets Report (June 3, 2011), Section 1.3.2.4, at http://www.iso-
ne.com/markets/mkt_anlys_rpts/annl_mkt_rpts/2010/amr10_final_060311.pdf.
32 See ISO-NE’s RSP10, 2009 Historical Market Data: Locational Marginal Prices, Interface MW Flows (January 21, 2010), http://www.iso-
ne.com/committees/comm_wkgrps/prtcpnts_comm/pac/mtrls/2010/jan212010/lmp_and_interface.pdf.
33 National Interest Electric Transmission Corridors and Congestion Study documents are available at http://nietc.anl.gov/documents/index.cfm.
The 2006 Congestion Study of the Eastern Interconnection (August 2006) is available at
http://nietc.anl.gov/documents/docs/Congestion_Study_2006-9MB.pdf.
2011 ISO/RTO Metrics Report118
can have an impact on day-ahead load, the value of the day-ahead Congestion Revenue Fund is divided by the annual real-time load to arrive at the cost of congestion per megawatt-hour of load served.
ISO-NE Annual Congestion Cost per Megawatt-Hour of Load Served,
2006-2010
$10
$8
$6
$4
$2
$0
20062007200820092010
Congestion revenue from the settlement of the Day-Ahead Energy Market and Real-Time Energy Market is
accumulated in the Congestion Revenue Fund. Holders of congestion instruments (in New England, Financial
Transmission Rights, or FTRs) can share in the refund of these collections if their FTR entitles them. These are
called positive target allocations. Conversely, because New England FTRs are obligations, counter-flow congestion (which results in so-called negative target allocations) may require a contract holder to contribute to the Congestion Revenue Fund.
The following graph shows the extent to which the sum of day-ahead and real-time congestion revenue and negative target allocations were sufficient to fund the transmission-hedge instruments each year. Over the five-year period, FTR holders in the New England markets have been able to hedge on average more than 98% of day-ahead market congestion in each year, with FTR congestion-revenue adequacy ranging from just under 95% in 2007 to 100% in 2006, 2008, and 2010. (FTR market congestion-revenue adequacy reflects the relationship of actual FTR congestion revenues to the target allocations for all FTR holders in the aggregate.)
2011 ISO/RTO Metrics Report119
ISO-NE Percentage of Congestion Dollars Hedged through ISO/RTO Congestion Management Markets,
2006-2010
100%
80%
60%
40%
20%
0%
20062007200820092010
Commencing in July 2005, excess congestion revenue has been collected until the end of the year and then
distributed pro rata to any shortfall amounts that occurred during the year. This ensures that all shortfalls have equal opportunity for funding regardless of the month in which the shortfall occurred.
Resources
Balancing consumer demand and available resources can be achieved by a combination of changing generation output and reducing total consumer demand. The charts and discussion below reflect ISO-NE’s history with generation and demand-response resources being available when called on by ISO-NE.
Generator Availability
This ISO/RTO performance metric identifies ISO-NE’s calendar-year generating availability as measured by the
equivalent forced-outage rate demand (EFORd) calculation. Generating availability is defined as one minus EFORd, which is calculated using data on generator supply from the NERC Generating Availability Data System (GADS). The industry has used the EFORd for more than 30 years to describe the probability that a generator will not meet its demand periods for generating requirements. EFORd is shown on an annual basis:
Generating Availability = (1 − EFORd), where:
EFORd is the equivalent forced-outage rate demand calculated for resources that submitted GADS data for the specified period, either calendar year or capability year, based on NERC Appendix F - Performance Indexes and Equations GADS Data Reporting Instruction, January 2008. As shown in the figure below, the performance of New England’s generating units from 2006 through 2010 remained relatively constant, with average generating unit EFORd below 5% for each year of that period.
2011 ISO/RTO Metrics Report120
ISO-NE Annual Generator Availability, 2006-2010
100%
95.85%
95%
90%
85%
80%
20062007200820092010
Availability by generating resource type is shown in the table below. ISO New England has not determined a specific quantitative relationship between generator availability and the wholesale cost of electricity. Trends in out-of-merit
dispatch and progress made toward reducing out-of-merit dispatch and improving market efficiency are discussed
above in the sections on generation must-run contracts, the ISO-NE wholesale power cost breakdown, and
congestion management.
Five-Year Weighted Average Availability by Resource Category (%)(a)
Resource Category20062007200820092010
Combined cycle94.394.895.395.495.8
Fossil92.892.492.392.892.3
Nuclear98.498.498.898.698.2
Hydro (includes
pumped storage)
97.798.498.598.197.0
Combustion turbine92.393.493.393.393.3
Diesel95.793.594.894.393.3
Miscellaneous---94.898.392.585.6
Total system94.794.995.195.194.9
(a) Based on five-year average EFORd values.
2011 ISO/RTO Metrics Report121
Demand-Response Availability
In addition to assessing expected load levels, ISO-NE assesses expected availability of capacity resources as an input in determining the ICR. The expected availability of resources in a future capacity commitment period (e.g., June 1 to May 31 of the following year) is based on the historical performance of capacity resources in response to dispatch instructions. The expected availability of active demand resources, such as real-time demand response and real-time emergency-generation resources, is based on the historical performance of such resources during real-time demand-response event hours and real-time emergency-generation event hours, respectively.
The performance of active demand resources is assessed by dividing the measured curtailed megawatt-hours by the
expected curtailed megawatt-hours. Measured curtailed megawatt-hours is equal to the difference between an active
demand resource’s adjusted customer baseline and its actual metered consumption during event hours. Expected
curtailed megawatt-hours is equal to megawatts dispatched by ISO-NE, which would not exceed the active demand
resource’s enrolled megawatts or its capacity supply obligation (CSO), multiplied by the number of event hours. The
resulting ratio is used to estimate the expected availability of active demand resources. A ratio of 100% means that,
on average, the demand resource provided 100% of the megawatts dispatched by ISO-NE during all event hours.
Because few event hours have occurred since March 2003, when ISO-NE implemented its demand-response
programs, ISO-NE, in cooperation with the New England stakeholders, has estimated active demand-resource
availability for future capacity commitment periods using event statistics from August 1, 2006 through August 25,
2009. Such event statistics included active demand-resource response to both actual events and audits. Further, the only active demand resources assessed were those expected to have a CSO in the relevant capacity commitment period, given that the computed availability is used prospectively to determine the ICR in a future capacity
commitment period. Passive demand resources, such as on-peak demand resources and seasonal peak demand resources (primarily non-weather-sensitive and weather-sensitive energy-efficiency resources, respectively) were assessed an availability factor of 100% when calculating the ICR.
These data show that real-time demand-response resource availability was assessed at 76%, and real-time
emergency-generation resource availability was assessed at 73%. Average active demand-resource availability was 75%. As shown in the following table, with passive demand resources assessed at 100% availability, overall demandresource availability was estimated to be 84%.34
34 The most recent demand-resource availability estimates calculated by ISO-NE are available at http://www.iso-
ne.com/committees/comm_wkgrps/relblty_comm/pwrsuppln_comm/mtrls/2010/feb182010/dr_performance_fca4_2_18_2010.pdf.
2011 ISO/RTO Metrics Report122
Demand-Resource Availability Modeled in the 2014/2015 ICR Calculation;
Availability of Active Demand Response Based on Events from August 1, 2006 through August 25, 2009
On-Peak
Seasonal Peak
Real-Time
Demand Response
Real-Time
Total
Emergency Generation
Load Zone
SummerAvailability
MW (%)
SummerAvailabilitySummerAvailability
MW (%) MW (%)
SummerAvailabilitySummerAvailability
MW (%) MW (%)
Maine112.206100--311.22010035.023100458.449100
New Hampshire
Vermont
Connecticut
Rhode Island
Southeast Mass
West Central Mass
70.963100
94.398100
122.044100
83.349100
130.221100
116.486100
--59.44974
--51.06099
301.055100370.48176
1.72710074.93148
1.727100165.57356
30.420100169.21367
39.13574169.54785
18.24045163.69894
300.301871093.88188
98.47817258.48553
78.63758376.15872
101.19372417.31280
and Boston236.207100--285.86672143.62487665.69785
Total New England965.874100334.9291001487.79376814.631733603.22784
Fuel Diversity
This ISO/RTO performance metric identifies ISO-NE’s fuel diversity with respect to installed capacity. To develop the
information for this metric, ISO-NE compiled the installed summer capacity values for 2006 through 2010 of all
generating units under ISO-NE’s dispatch control and summarized their aggregate capacity (MW) by each unit’s
reported primary fuel type.35 This information, for 2010, was then categorized into the following fuel types:
Natural gas (13,181 MW at 41.2%)
Nuclear (4,629 MW at 14.5%)
Coal (2,756 MW at 8.6%)
Oil, heavy and light (6,866 MW at 21.5%)
Hydroelectric and other renewables (1,712 MW at 5.4% and 1,142 MW at 3.6%, respectively)36 Pumped storage (1,679 MW at 5.2%)
The fuel types themselves are self-explanatory, except for the ―other renewables‖ category, which in New England
includes capacity from landfill gas (LFG), other biomass gas, refuse (municipal solid waste), wood and wood-waste
35 The dual-fuel units in the region are reported under natural gas or oil, depending on what fuel they claim as their primary fuel type within the monthly settlement period.
36 The hydroelectric energy reflects the total annual amount of electric energy claimed from both daily- and weekly-cycle hydroelectric facilities that typically are dispatchable and self-scheduled along with the total annual amount of energy from ―settlement-only‖ hydroelectric facilities that typically are run-of-river and nondispatchable.
2011 ISO/RTO Metrics Report123
solids, wind, solar, black liquor, and tire-derived fuels.37 In addition, this information does not contain, nor has it been adjusted for, historical firm imports or exports of capacity.38 The annual installed summer capacity values by primary fuel type are shown in the following graph.
ISO-NE Fuel Diversity (Summer Capacity MW), 2006-2010
100%
80%
60%
40%
20%
0%
20062007200820092010
CoalGasNuclearOil
Hydro and Other RenewablesPumped Storage
Data observations:
Average annual summer installed capacity (MW) over the five-year period was 31,193 MW.
The lowest amount of installed summer capacity occurred in 2007 at 30,526 MW.
The highest amount of installed summer capacity occurred in 2010 at 31,965 MW.
The difference between the highest and lowest amounts of installed summer capacity is only 1,439 MW.
The top three installed capacity values in the region are natural gas-fired generation, oil-fired generation
(burning both heavy and light end-products), and nuclear generation. Fossil-fueled generating capacity
stayed relatively constant throughout the 2006 to 2010 timeframe, averaging approximately 22,287 MW,
or approximately 71.4% of the entire generation fleet.
The New England generation fleet is predominantly natural gas-fired, with the largest portion of installed
summer capacity in each year ranging from a low of 11,705 MW at 37.6% in 2008 to a high of 13,181 MW
at 41.2% in 2010. More than 50% of the installed capacity within the region can burn natural gas as a
primary, secondary, start-up, or stabilizing fuel source.
The next ISO/RTO performance metric is fuel diversity with respect to historical energy production. To develop the
information for this metric, ISO-NE compiled the 2006 to 2010 historical energy production of all generating units
37 LFG is produced by the decomposition of landfill materials and is collected, cleaned, and used for generation, or it is vented or flared. Black liquor is a by-product (alkaline spent liquor) of the paper-production process and can be used as a source of energy.
38 This statement applies to all ISO-NE metrics that discuss, compare, or reference capacity, either in aggregate or by (primary) fuel type.
2011 ISO/RTO Metrics Report124
under the dispatch control of ISO-NE and summarized their annual energy output by each unit’s reported primary fuel type.39 This information, for 2010, was then categorized into the following fuel types:
Natural gas (57,579 GWh at 45.6%)
Nuclear (38,364 GWh at 30.4%)
Coal (14,131 GWh at 11.2%)
Oil, heavy and light (545 GWh at 0.4%)
Hydroelectric and other renewables (7,226 GWh at 5.7% and 7,683 GWh at 6.1%, respectively)40 Pumped storage (854 GWh at 0.7%)
This information does not contain, nor has it been adjusted for, historical imports or exports of electric energy,
although the production of energy to support exports is reflected within the annual energy production amounts.41 The
diversity of fuels for generating electric energy in New England for 2006 to 2010 is shown in the following graph.
ISO-NE Fuel Diversity (Energy GWh), 2006-2010
100%
90%
80%
70%
60%
50%
40%
30%
20%
10%
0%
20062007200820092010
CoalGasNuclearOil
Hydro and Other RenewablesPumped Storage
Data observations:
Average annual electric energy production over the five-year period was approximately 125,827 GWh. The highest annual energy production occurred in 2006 at 130,721 GWh.
39 The dual-fuel units in the region are reported under natural gas or oil, depending on what fuel they claim as their primary fuel type within the monthly settlement period.
40 The hydroelectric energy reflects the total annual amount of electric energy claimed from both daily- and weekly-cycle hydroelectric facilities that typically are dispatchable and self-scheduled along with total annual amount of energy from ―settlement-only‖ hydroelectric facilities that typically are run-of-river and nondispatchable.
41 This statement applies to all ISO-NE metrics that discuss, compare, or reference historical energy production either in aggregate or by (primary) fuel type.
2011 ISO/RTO Metrics Report125
The lowest annual energy production occurred in 2009 at 119,428 GWh.
Annual energy production in 2009 was down considerably (about 10%) from previous years, primarily
because of the economic impacts of the recession and a relatively cooler, rainy summer season.
The top three fuels to produce electric energy within New England are natural gas, nuclear, and coal.
However, no single fuel had an annual energy contribution greater than 50%.
The New England gas-fired generation fleet had the largest portion of annual energy production in each
year, ranging from a low of 39.7% in 2006 to a high of 45.6% in 2010.
The overall production of electric energy from using both heavy and light oil products declined over the
five-year period, from 3.3% (4,651 GWh) in 2006 to 0.4% (545 GWh) in 2010.
The overall production of electric energy from coal declined over the five-year period, from 15.2% (19,375
GWh) in 2006 to 11.2% (14,131 GWh) in 2010.
The overall production of electric energy from renewables (6.1%) and hydroelectric (5.7%) and pumped
storage (1.2%) stations remained relatively constant over the five-year period.
Renewable Resources
ISO-NE Electric Energy Produced by Renewables
This ISO/RTO performance metric compares ISO-NE’s annual amount of electric energy produced by renewable
resources with the total amount of annual energy produced. To develop the information for this metric, ISO-NE
compiled the historical energy production of all generating units under its dispatch control for 2006 through 2010 and
summarized their annual energy output by each unit’s reported primary fuel type. All the ―other renewables‖ energy
information was then categorized into the annual renewable energy category, shown in the following table, along with
the total annual amount of energy produced and the percentage of total energy produced by renewables for each
assessment year.
ISO-NE Electric Energy Produced by Renewables, 2006-2010
Annual EnergyTotal AnnualPercentage of Total Annual
YearProduced byEnergy ProducedEnergy Produced by
Renewables (GWh)(GWh)Renewables
20066,888127,8515.4%
20077,810130,7216.0%
20087,542124,7506.0%
20097,302119,4286.1%
20107,683126,3836.1%
2011 ISO/RTO Metrics Report126
Although hydroelectric energy generation is shown within previous metrics, it was categorized separately and not
included within the ―other renewables‖ category, primarily because it may not be defined universally as a ―renewable‖ resource across the country. The following graph shows ISO-NE’s annual energy produced by renewables as a
percentage of total energy produced annually for 2006 through 2010, and does not include energy produced from
hydroelectric resources.
Energy Produced by Renewables in ISO-NE as a Percentage of Total Energy Produced, 2006-2010
20%
15%
10%
5%
0%
20062007200820092010
Data observations:
The average annual electric energy produced by renewables over the five-year period was approximately
7,445 GWh.
The highest amount of annual electric energy produced by renewables occurred in 2007 at 7,810 GWh,
6.0% of the total amount of energy produced systemwide, at 130,721 GWh.
The lowest amount of annual electric energy produced by renewables occurred in 2006 at 6,888 GWh,
5.4% of the total amount of energy produced systemwide, at 127,851 GWh.
Five of the New England states have Renewable Portfolio Standards (RPSs), and Vermont has a goal for
increasing energy usage from renewable resources. These RPSs represent state policy targets to be
achieved by retail competitive suppliers. The retail electricity suppliers may choose to meet some or all of
their obligations using renewable resources within the ISO-NE Generator Interconnection Queue,
resources from adjacent balancing authority areas, new resources in New England not yet in the queue,
small ―behind-the-meter‖ projects, and eligible renewable fuels in existing generators. Affected suppliers
also can meet RPS shortfalls by paying an alternative compliance payment (ACP), which acts as an
administrative cap on the cost of renewable sources of electric energy. ACP funds are used for the
development of new renewable resources and energy efficiency in the region.
2011 ISO/RTO Metrics Report127
ISO-NE Hydroelectric Energy Produced
The next performance metric compares ISO-NE’s annual production of hydroelectric energy with the total annual
amount of energy produced. To develop the information for this metric, ISO-NE compiled the historical electric energy
production of all hydroelectric generating units under its dispatch control for 2006 to 2010. The following table shows
the total amount of ―hydroelectric‖ energy produced in 2006 through 2010, the total amount of annual electric energy
produced for those years, and hydroelectric’s percentage of the total amount of energy produced annually for each
year.
ISO-NE Hydroelectric Energy (GWh) Produced, 2006-2010
Annual HydroelectricTotal AnnualPercentage of Total Annual
YearEnergy ProducedEnergy ProducedHydroelectric Energy
(GWh)(GWh)Produced
20068,024127,8516.3%
20076,383130,7214.9%
20088,464124,7506.8%
20098,353119,4287.0%
20107,226126,3835.7%
The following graph shows ISO-NE’s annual hydroelectric energy produced as a percentage of the total energy produced annually for 2006 through 2010.
ISO-NE Hydroelectric Energy Produced as a Percentage of Total Energy Produced, 2006-2010
20%
15%
10%
5%
0%
20062007200820092010
2011 ISO/RTO Metrics Report128
Data observations:
The average amount of hydroelectric energy produced annually over the five-year period was 7,690 GWh. The highest amount of hydroelectric energy produced annually occurred in 2008 at 8,464 GWh, or 6.8% of
the total amount of energy produced systemwide, 124,750 GWh.
The lowest amount of hydroelectric energy produced annually occurred in 2007 at 6,383 GWh, or 4.9% of
the total amount of electric energy produced systemwide, 130,721 GWh.
ISO-NE Summer Capacity Provided by Renewables
The next performance metric compares renewable summer capacity with total summer capacity. All the ―other
renewables‖ capacity information is categorized into the ―renewable‖ capacity category, shown in the following table,
along with total capacity and the percentage of total capacity provided by renewables for each assessment year:42
ISO-NE Summer Capacity (MW) Provided by Renewables, 2006-2010
Summer
Capacity
YearProvided by
Renewables
(MW)
2006922
2007917
2008948
20091,039
20101,142
Total
Summer
Capacity
(MW)
30,931
30,526
31,102
31,443
31,965
Percentage of
Total Summer
Capacity
Provided by
Renewables
3.0%
3.0%
3.1%
3.3%
3.6%
The following graph compares ISO-NE’s summer capacity provided by renewables as a percentage of total summer capacity for 2006 to 2010, not including hydroelectric capacity.
42 The ―other renewables‖ category includes energy from landfill gas, other biomass gas, refuse (municipal solid waste), wood and wood-waste solids, wind, solar, black liquor, and tire-derived fuels.
2011 ISO/RTO Metrics Report129
ISO-NE Summer Capacity Provided by Renewables as a Percentage of Total Summer Capacity, 2006-2010
20%
15%
10%
5%
0%
20062007200820092010
The following metric shows ISO-NE’s estimated (annual average) renewable capacity factors for 2006 to 2010. This estimated capacity factor information is representative of the ―annual average‖ from numerous types of renewable production facilities, which include energy from landfill gas, other biomass gas, refuse (municipal solid waste), wood and wood-waste solids, wind, solar, black liquor, and tire-derived fuels, and does not represent the capacity factor of any single renewable production facility.
ISO-NE Estimated (Annual Average) Renewable Capacity Factors, 2006-2010
Total
YearRenewable
Capacity (MW)
TotalEstimated
Annual(Annual Average)
RenewableRenewable
Energy (GWh) Capacity Factor (%)
20101,1427,68376.8%
Data observations:
The average summer capacity provided by renewables over the five-year period was approximately
944 MW.
2011 ISO/RTO Metrics Report130
The highest amount of summer capacity provided by renewables occurred in 2010 at 1,142 MW, or 3.6%
of the total installed summer capacity of 31,965 MW.
The lowest amount of summer capacity provided by renewables occurred in 2007 at 917 MW, or 3.0% of
the total installed summer capacity of 30,526 MW.
Five of the six New England states classify hydroelectric capacity as some form of renewable resource,
mostly depending on the size of the unit and its compliance with state and federal fish-passage
requirements. Currently, only Maine allows pumped-storage units to be classified as a renewable resource.
The estimated (annual average) renewable capacity factors range from a low of 76.8% in 2010 to a high of
97.2% in 2007. The high capacity factors are representative of the majority of the renewable capacity on the system, which primarily were small, thermal stations fueled by wood, biomass, or refuse, for example.
These renewable power stations typically are baseload, nondispatchable units and were classified as ―mustrun‖ or self-scheduled generation.
ISO-NE Hydroelectric Capacity
The following metric shows ISO-NE’s hydroelectric summer capacity as a percentage of total summer capacity for 2006 to 2010. The following table shows all the ―hydroelectric‖ capacity and total capacity for 2006 to 2010 and hydroelectric’s percentage of total capacity for each assessment year.
ISO-NE Hydroelectric Summer Capacity, 2006-2010
Hydroelectric
YearSummer
Capacity (MW)
20061,691
20071,648
20081,679
20091,694
20101,712
Total Summer
Capacity (MW)
30,931
30,526
31,102
31,443
31,965
Percentage of Hydroelectric
Summer Capacity to Total
Capacity
5.5%
5.4%
5.4%
5.4%
5.4%
The next metric shows ISO-NE’s hydroelectric capacity as a percentage of total capacity for 2006 through 2010.
2011 ISO/RTO Metrics Report131
ISO-NE Hydroelectric Summer Capacity as a Percentage of Total Summer Capacity, 2006-2010
20%
15%
10%
5%
0%
20062007200820092010
The following metric shows ISO-NE’s estimated (annual average) hydroelectric capacity factors for 2006 to 2010. Because some small amount (100 to 200 MW, depending on monthly rating) of regional hydroelectric capacity is claimed as ―settlement-only‖ capacity, these capacity values need to be added to the total hydroelectric capacity (MW) category to obtain a more accurate estimate of the annual average hydroelectric capacity factors. This
estimated capacity factor information is representative of the ―annual average‖ from numerous types of hydroelectric production facilities (i.e., conventional hydroelectric, run-of-river, daily- and weekly-cycle hydroelectric) and does not represent the capacity factor of any single hydroelectric facility.
ISO-NE Estimated (Annual Average) Hydroelectric Capacity Factors, 2006-2010
Total
YearHydroelectric
Capacity (MW)
Total
Settlement-Only
Hydroelectric
Capacity (MW)(a)
Total AnnualEstimated Annual
HydroelectricHydroelectric
Energy (GWh) Capacity Factor (%)
20101,7121357,22644.7%
(a) The majority of this ―settlement-only‖ capacity is small, nondispatchable, run-of-river, weekly- and dailycycle hydroelectric capacity. These values are taken from the settlement-only section of the August version of the applicable yearly Seasonal Claimed Capability Report and vary from a low of 113 MW in August 2006 to a high of 172 MW in August 2008.
2011 ISO/RTO Metrics Report132
Data observations:
The average hydroelectric summer capacity over the five-year period was approximately 1,685 MW.
The highest amount of hydroelectric summer capacity occurred in 2010 at 1,712 MW, or 5.4% of the total
installed summer capacity of 31,965 MW.
The lowest amount of hydroelectric summer capacity occurred in 2007 at 1,648 MW, or 5.4% of the total
installed summer capacity of 30,526 MW.
The estimated (annual average) hydroelectric capacity factors range from a low of 40.5% in 2007 to a high
of 52.2% in 2008. These capacity factors are representative of the majority of the larger types of
hydroelectric capacity on the system, which are river-based hydroelectric stations with significant pondage
or storage capability. These hydroelectric power stations typically are dispatchable or can also be self-
scheduled generation. Because of the prior capacity rating methodology ISO-NE used for these types of
hydro facilities, the capacity values are indicative of the amount of nameplate capacity that can be provided
over a short period, usually a 2- to 4-hour demonstration window, which, combined with a large watershed
behind it, is the primary reason for the relatively high capacity factors for these facilities.
2011 ISO/RTO Metrics Report133


C. ISO New England Organizational Effectiveness
Administrative Costs
The following figures show ISO-NE’s actual annual noncapital costs and capital investment recovery costs as a percentage of budgeted costs for 2006 to 2010, as recommended by NEPOOL and approved by FERC.
Actual Annual ISO-NE Costs as a Percentage of Budgeted Costs, 2006-2010
Noncapital CostsCapital Investment Recovery Costs
Budget$84$88$91$100$106Budget$30$32$32$29$27
Note: Bars represent percentage of actual costs to approved budgets; dollar amounts represent approved budgets in millions.
The metric for noncapital costs identifies ISO-NE’s administrative cost budget performance. The ISO-NE budgets reflect the resource allocations based on the establishment of regional objectives through the stakeholder process. These objectives and priorities, including resource allocations, are discussed with the stakeholders throughout the budget cycle. The main categories of costs include salaries and related overhead and outside consulting support. On average from 2006 to 2010, these costs represent approximately 81% of the total budget. The next-largest categories include computer services and communication costs, which average 7% per year. Dues for regional entities, on
average, make up approximately 3% of the costs each year.
The primary underspend in each year is the underutilization of contingencies contained in each budget. Each of ISONE’s annual budgets contains a board-contingency expense of $1 million. The board contingency is in place to fund unplanned activities and their related expenses. Normally, such expenses would be funded through a company’s equity or reserves. However, ISO-NE has neither. In the years reported here, and in all previous years, ISO-NE has not had to use this contingency fund. Therefore, the variance for each of the years shown also includes a savings against the board’s $1 million contingency budget.
2011 ISO/RTO Metrics Report134
Data on ISO-NE expenses for 2006 through 2010 are as follows:
In 2006, ISO-NE’s actual expenses were 3% lower than budgeted as a result of increased interest income. In 2007, ISO-NE’s expenses were 2% lower than budgeted as a result of a higher staffing vacancy rate
and reduced communication expenses because of contract renegotiations.
In 2008, ISO-NE’s expenses were 3% lower than budgeted because of higher internal capital
development, increased reimbursable transmission study cost work, and lower outside consultant costs. These reductions were partially offset by interest income lower than budgeted.
In 2009, ISO-NE’s expenses were 3% lower than budgeted, primarily because of reduced computer
services resulting from the restructuring of certain licensing arrangements and less reliance on external maintenance support. In addition, certain changes in health care plans also reduced costs, partially offset by increased pension benefit costs.
In 2010, ISO-NE’s expenses were 3% lower than budgeted as a result of a higher staffing vacancy rate
and lower pension and post-retirement benefits costs. The reduced pension and post-retirement benefit
costs were a result of better-than-projected investment returns in the second half of 2009.
ISO-NE capital investment recovery costs include depreciation, amortization, interest expense, and loss on disposal of assets. Data on ISO-NE’s costs for 2006 to 2010 are as follows:
In 2006, actual costs were 2% higher than budgeted primarily because of the abandonment of work done
on the Locational Installed Capacity project, which was replaced with a newly designed Forward Capacity
Market.
In 2007, costs were 8% below budget as a result of lower depreciation costs. The decreased depreciation
expense was because of underspending for capital projects planned and changes in in-service dates for
projects planned for 2007, including the Forward Capacity Market Phase I.
In 2008, 2009, and 2010 capital investment expenses were 7%, 9%, and 8% below budget, respectively.
For all three years, the decrease was because of lower capital project costs and changes in project in-
service dates for various capital projects. In addition, a reduction in interest expense for 2008 and 2009,
primarily because of a drop in interest rates during both years, contributed to the variance.
The administrative costs per megawatt-hour of load served shown in the following graph should be reviewed in the context of the widely varying levels of annual load served by each ISO/RTO, with ISO-NE’s data shown in the table below. Year-to-year changes in load may reflect weather patterns, demand-response penetration, and energy-
efficiency gains. As such, the data are used as a reference point because many of ISO-NE’s costs are fixed and load reductions may reflect regional objectives.
2011 ISO/RTO Metrics Report135
ISO-NE Annual Administrative Charges per Megawatt Hour of Load Served, 2006-2010
($/MWh)
$1.10
$1.04
$1.00
$0.90
$0.80
$0.70
$0.60
$0.50
$0.40
$0.30
$0.20
$0.10
$0.00
2006
ISO/RTO
ISO-NE
2007200820092010
ISO-NE Annual Load Served, 2010
2010 Annual Load Served
(in TWh)
131
Note: Annual load amount is forecast, and administrative charges are budget amounts that include prior year collection true-up.
2011 ISO/RTO Metrics Report136
Customer Satisfaction
This ISO/RTO performance metric identifies customer satisfaction within the ISO-NE footprint. Since 1999, through
an independent third-party administrator, ISO-NE has measured customer satisfaction with respect to its overall
performance, as well as by satisfaction with its performance on service dimensions associated with FERC objectives
for ISOs/RTOs.
The ISO New England customer satisfaction survey measures satisfaction with specific service dimensions, such as the following:
ISO-NE’s operation of the bulk power system consistent with established FERC, NERC, and NPCC
reliability requirements
Dispatch of resources (generators, loads, and tie lines) consistent with the tariff Administration of the wholesale markets consistent with the tariff
Responsiveness to customer inquiries
Implementation of requirements as defined in the tariff
Administration of stakeholder processes to allow for input on matters that affect the efficiency and
competiveness of the wholesale market, as well as issues that have an impact on the reliability of the bulk power system
Regional System Planning
Satisfaction with performance is measured using a six-point scale composed of ―extremely satisfied,‖ ―moderately satisfied,‖ ―marginally satisfied,‖ ―marginally dissatisfied,‖ ―moderately dissatisfied,‖ and ―extremely dissatisfied.‖ For the survey period of 2006 to 2010, for all the service dimensions except the administration of stakeholder processes, ISO-NE achieved net customer satisfaction results of 92% or greater from survey respondents that had an opinion. With respect to the administration of stakeholder processes, ISO-NE achieved a satisfaction rating of 87% or greater during that same five-year period. For overall performance on the six-point scale, ISO-NE achieved a net satisfaction rating of 95% or greater for 2006 to 2010 from survey respondents that had an opinion.
Respondents are also asked to grade their level of satisfaction or dissatisfaction on a scale of zero to 100, with a score of 70 being passing. For 2006 to 2010, the average score from all respondents was 85% or greater. The following graph illustrates the net positive customer satisfaction with ISO-NE’s overall performance for survey respondents that expressed an opinion for 2006 to 2010.
2011 ISO/RTO Metrics Report137
Percentage of ISO-NE Satisfied Members, 2006-2010
100%
95%
80%
60%
40%
20%
0%
20062007200820092010
Billing Controls
This ISO/RTO performance metric identifies some of ISO-NE’s billing controls. Since 2004, ISO-NE has engaged an external audit firm to review the description of controls, evaluate the effectiveness of controls design, and test
operating effectiveness of the controls for the ISO-NE ―bid-to-bill‖ processes. These processes include market
operations, settlements, market services, and finance processes, as well as supporting IT applications and
processes. Overall performance is measured by an external auditor, whose opinion of ―unqualified‖ (i.e., clean) or “qualified” is stated in an SAS 70 Type 2 Audit Report made available to NEPOOL participants. The results of the ISO-NE audits for 2006 to 2010 are shown in the following table.
ISO-NE SAS 70 Type 2 Audit Results, 2006-2010
ISO/RTO20062007200820092010
Unqualified SASUnqualified SASUnqualified SASUnqualified SASUnqualified SAS
ISO-NE70 Type 2 Audit70 Type 2 Audit70 Type 2 Audit70 Type 2 Audit70 Type 2 Audit
OpinionOpinionOpinionOpinionOpinion
2011 ISO/RTO Metrics Report138
In 2008, market participants submitted six billing disputes that resulted in billing adjustments of $68,236. In 2009,
nine billing disputes were submitted to ISO-NE that resulted in billing adjustments of $414,302. In 2010, four billing
disputes were submitted to ISO-NE that resulted in billing adjustments of $65,759. The total value of the wholesale
electricity markets administered by ISO-NE in 2008 was $14.7 billion, the value in 2009 was $7.9 billion, and the
value in 2010 was $9.2 billion. All requests for billing adjustments (RBAs) are reported to stakeholders.
2011 ISO/RTO Metrics Report139
D. ISO New England Specific Initiatives
The New England power system provides electricity to a diverse region, ranging from rural agricultural areas to
densely populated urban areas, using widely dispersed and varied types of power system resources. ISO New
England has a longstanding history of reliably operating the grid on a daily basis, at the same time developing
creative solutions to tackle the challenges of the future, as new technologies emerge and as legislative priorities
evolve.
Outlined in this section is a broad overview of how ISO-NE is working to facilitate the efficient operation of the region’s wholesale markets and ensure a reliable grid that can carry New England into the future.
Strategic Planning Initiative: In 2010, ISO New England embarked on an initiative to identify the biggest risks to electric power reliability on the New England energy horizon. Through examination of industry trends and their
drivers, numerous stakeholder discussions, and analysis of public policy initiatives, the ISO has identified five key risks. To tackle these pending issues—some of which ISO-NE has seen evidence of already—ISO-NE has outlined a strategic planning initiative that addresses the likelihood, timing, and potential consequences of these risks; how the risks are interrelated; and possible mitigating actions.
The five key risks ISO-NE has identified with its stakeholders are as follows:
1. Resource performance and flexibility
2. Increased reliance on natural-gas-fired capacity
3. Retirement of generators
4. Integration of variable resources
5. Alignment of planning and markets
ISO-NE has developed a list of possible solutions to the identified issues and is providing its stakeholders with a proposed sequence of solutions. ISO-NE will continue to work closely with regulators and policymakers, market participants, and other electricity stakeholders to effectively tackle the challenges outlined above.
More detailed information about each of the identified risks can be found in ISO-NE’s 2011 Regional Electricity
Outlook.43
System Planning of Transmission, Market Resources, and Energy Efficiency: Over the past few years, ISO-NE
has completed several major transmission planning studies and others are underway. Some studies have helped to
develop solutions to serve major portions of the system, including Vermont, Maine and New Hampshire; the north
shore of Massachusetts; the Greater Boston area; southeastern Massachusetts; and portions of Connecticut,
western Massachusetts, and Rhode Island that will improve the flow of energy across New England and maintain a
reliable power system overall.
43 ISO-NE, Bringing Possibilities into Focus: 2011-2012 Regional Energy Outlook (June 30, 2011), http://www.iso-
ne.com/aboutiso/fin/annl_reports/2000/2011_reo_2010_financials.pdf.
2011 ISO/RTO Metrics Report140
ISO-NE also is exploring how to evaluate market resource alternatives to transmission upgrades needed for
reliability. In 2011, ISO-NE completed a pilot project begun in 2010 to analyze the megawatts of resources that would
be needed at specific locations in Vermont and New Hampshire to reduce the need for transmission investment in
those areas.
Additionally, ISO-NE is looking at ways to incorporate a greater amount of energy efficiency savings from statesponsored programs into the load forecasting and system planning process. While ISO-NE currently counts future energy efficiency measures that have cleared in the Forward Capacity Market, it currently is developing a
methodology to forecast energy-efficiency savings over a 10-year forecast period. ISO-NE is working with utility program administrators, other ISOs/RTOs, and regional stakeholders to develop this process.
Transmission and Generation Development: Over the past decade, the system planning process and wholesale market design have fostered significant improvements to the region’s generation and transmission system.
On the basis of the results and needs described in ISO-NE’s Regional System Plan, New England’s transmission
owners have constructed transmission projects throughout the region that reinforce transmission facilities serving
areas that have experienced load growth, such as Vermont, southern Maine, and the New Hampshire seacoast area. Projects also have reinforced the system’s critical load pockets, such as Southwest Connecticut and Boston, allowing the import of power from other parts of the system. New interconnections with neighboring power systems also have been placed in service. From 2002 through 2011, 379 projects will have been put into service, totaling approximately $4.6 billion of new infrastructure investment.
As identified through the system planning process and Needs Assessments, two major and several smaller projects
needed for system reliability currently are under construction. The Maine Power Reliability Program (MPRP) will
establish new transmission lines that will provide the infrastructure necessary to increase the ability to move power
into Maine from New Hampshire and increase the ability to move power around Maine. This project is scheduled for
completion by the end of 2014. Another transmission project underway is the New England East-West Solution
(NEEWS). NEEWS consists of a series of projects in Massachusetts, Connecticut, and Rhode Island that will provide
stronger interconnections among those states and allow more power to be moved between eastern and western New
England.
In addition to transmission development, the region has responded to the need for electric energy and capacity
resources. New generating projects totaling 13,177 MW have been interconnected with New England’s power system since generators first submitted requests to ISO-NE to be interconnected in November 1997. Demand resources currently totaling more than 2,000 MW are part of the regional power system, and 3,600 MW have been procured through the Forward Capacity Market for 2014.
Competitive Markets that Have Secured Adequate Resources: In the past decade under ISO-NE administration,
new electric generating resources have increased power grid capacity by more than 30%. The introduction of
cleaner, more efficient power plants and added emission controls to some fossil-fuel-fired plants have decreased
average emission rates between 1999 and 2009 for sulfur dioxide (SO2) by 71%, nitrogen oxide (NOX) by 66%, and
2011 ISO/RTO Metrics Report141
carbon dioxide (CO2) by 18%. Total emissions for SO2 and NOX also have decreased from 2001 levels by 62% and
54%, respectively. In 2010, nearly 500 buyers and sellers traded $9.1 billion in New England’s wholesale electricity
markets.
The results from the first FCM auction in February 2008 were implemented on June 1, 2010, when ISO New England switched to systems that integrated this new market into existing processes. Currently, more than 32,000 MW of
generating resources are available in New England. ISO-NE held its fifth Forward Capacity Market auction in June 2011, successfully securing the projected capacity needed for the 2014/2015 timeframe. Entergy’s Vermont Yankee nuclear plant submitted a delist bid in ISO-NE’s recent auction for the 2014/2015 capacity period, which ISO-NE did not approve, citing a reliability need. Ongoing litigation between Entergy and the State of Vermont over the operation of the Vermont Yankee nuclear plant has made the plant’s operation uncertain past March 2012. Because of this uncertainty, ISO-NE is developing both short- and long-term solutions that could mitigate reliability concerns and other potential impacts to the system if Vermont Yankee is unable to operate.
In February 2011, Dominion’s Salem Harbor coal plant in Massachusetts submitted non-price retirement requests for its four units.44 After studying the impact the closure of these units would have on the power system in Greater
Boston and the north shore of Massachusetts, ISO-NE determined that two of its units were needed for reliability. Dominion recently notified ISO-NE that despite ISO-NE’s reliability determination, it would proceed to retire all four units in 2014. Retirement of these fossil-fuel-fired units exemplify the issue of potential generator retirements as
identified in ISO-NE’s strategic planning initiative.
New England’s Forward Capacity Market has spurred investment in power system resources and encouraged
significant growth of demand resources. All five FCM auctions held have concluded at the floor price, with surplus capacity. In 2011, FERC issued an order outlining how demand resources should be compensated in the U.S. ISO/RTO energy markets.45 ISO-NE has embarked on a stakeholder process to develop market rules that will meet FERC’s requirements and effectively incorporate demand resources into wholesale energy markets.
Investment in the Smart Grid: Smart grid technologies represent the next stage in the evolution of the power
system by improving data acquisition, analysis, control, and efficiency of the electric power grid. In 2010, the US
Department of Energy approved an $8 million grant for ISO-NE and the New England transmission owners to add
more than 35 new phasor measurement units (PMUs). The $18 million project to install these high-speed sensors at different points across the six-state transmission system will help ISO-NE system operators more accurately monitor system conditions by providing information on the system’s status 30 times per second, rather than every four
seconds as in the current configuration.
Integration of Renewable Resources: As the New England energy landscape evolves and states set their goals for
renewable energy, ISO-NE is studying the impact that a potential increase of renewable energy could have on the
grid. Analysis shows that in New England, wind energy has the potential to be the fastest growing renewable
44 A nonprice retirement request is a binding request to retire the entire capacity of a generating resource.
45 FERC Order on Paper Hearing and Order on Rehearing, Docket Nos. ER10-787-000, EL10-50-000, EL10-57-000, ER10-787-004, EL10-50-
002, and EL10-57-002 (April 13, 2011), http://www.iso-ne.com/regulatory/ferc/orders/2011/apr/err10-787-000_4-13-
11_fcm_redesign_order.pdf.
2011 ISO/RTO Metrics Report142
resource; however, its inherent challenges mean that considerable investment will be needed to interconnect and
integrate significant wind resources into the grid. In 2010, ISO-NE completed the New England Wind Integration
Study (NEWIS), launched in 2009 to identify best practices for wind forecasting for the region through the
development of technical requirements as well as the assessment of different wind scenario impacts. NEWIS found that New England has an abundance of wind energy potential, particularly in northern areas and offshore. If certain conditions are met, New England could potentially integrate wind resources to meet up to 24% of the region’s total annual electric energy needs in 2020.
To realize this by 2020, several conditions must be met, including the retention of all the resources secured through 2011/2012 in the Forward Capacity Market, more regulation and reserves, and significant expansion of the region’s high-voltage transmission system. A flexible fleet of resources also is needed to integrate higher levels of wind
energy, so market design may need to evolve to provide incentives for flexible resources to help balance electricity supply with fluctuations in demand. The report also recommends that ISO-NE implement technical interconnection requirements and a centralized wind forecasting system. ISO-NE is actively addressing both these recommendations with New England stakeholders with an expected implementation in 2012.
On a national level, ISO-NE is active in a number of forums and working groups on transmission planning for the North American interconnections to meet economic and environmental policy objectives.
Collaboration: To provide the best possible results for the region, ISO-NE collaborates with stakeholders in all areas of its work—whether coordinating an outage, developing new market rules, or conducting an in-depth planning
analysis. Stakeholders represent a wide variety of constituencies, technologies, and interests. They include New England Power Pool participants; state regulators who form the New England Conference of Public Utilities
Commissioners; state and federal legislators, attorneys general, and environmental regulators; the Consumer Liaison Group, made up of state consumer advocates, consumer representatives, and other end users; and the six
governors, primarily through the New England Governors’ Conference and the New England States Committee on Electricity. This collaboration has been the critical factor driving the region’s success over the past decade in
developing power system infrastructure and a competitive suite of wholesale markets.
2011 ISO/RTO Metrics Report143
Midwest Independent Transmission
System Operator (MISO)
2011 ISO/RTO Metrics Report144
Section 4 - MISO Performance Metrics and Other Information
On December 19, 2001, the Midwest Independent Transmission System Operator, Inc. (MISO) became the nation’s first permanent Regional Transmission Organization to be approved by the Federal Energy Regulatory Commission (FERC). 33 transmission owners with approximately 57,000 miles of transmission lines and generation owners with 148,456 megawatts of electrical generation are currently participating in MISO.
On December 15, 2001, MISO began providing reliability coordination services to the transmission-owning members
of MISO and their customers. On the same date, MISO also began providing operations planning, generation
interconnection, maintenance coordination, long-term regional planning, market monitoring, and dispute resolution
services. On February 1, 2002, MISO began providing regional transmission service under its FERC-accepted Tariff.
On April 1, 2005, MISO began operating a market-based, congestion management system which included a Day-
Ahead and Real-Time energy market and a Financial Transmissions Rights market. On January 6, 2009, MISO
began operating a market for ancillary services and became a NERC-certified Balancing Authority.
MISO’s Value Proposition demonstrates the quantifiable value we deliver to our region through increased efficiencies in market operations, reliability, and planning. Our 2010 Value Proposition shows realized annual benefits ranging from $650 million to $875 million.
Benefit by Value Driver
(in $ millions)
$68-$75
$121-$134 $136-$151
$221-$244
$322-$482
12345
Market - Commitment and Dispatch
2011 ISO/RTO Metrics Report
$54-$68($254)
$259-$323$12-$19
$1,253-
$1,634
$280-$350
$34-$42
$648-$874
Benefits Driven by Load / Supply Balance
67891011
GenerationDemand
Investment DeferralResponse
145


A. MISO Bulk Power System Reliability
As of December 31, 2010, MISO was registered with NERC and three Regional Reliability Organizations (RRO). The table below identifies the NERC Functional Model registrations MISO has submitted as effective as of December 31, 2010. Additionally, the RROs for MISO are noted below the table and links to the specific reliability standards for each RRO as well as NERC are provided.
Violations of the reliability standards linked below are subject to penalty or administrative citation by the RROs, the
FERC, and/or NERC. Violations could be identified via an investigation, self-report, or audit. Each of these
identification methods has a defined process by which NERC or the RRO validates or dismisses a potential violation.
If a potential violation is validated by the RRO or NERC, these entities notify the FERC of the validated violation.
No MISO audit-identified reliability standard violation was published by NERC or FERC during the 2006-2010 time period covered by this report. In 2009, MISO self-reported compliance issues to ReliabilityFirst Corporation that
resulted in a $7,000 penalty. NERC subsequently filed a Notice of Penalty with the FERC in Docket No. NP11-59-000 on December 22, 2010. The penalty went into effect without further action by the FERC.
MISO has had no violations of applicable operating reserve standards nor has MISO shed any load in the MISO region due to a standards violation.
NERC Functional Model RegistrationMISO
Balancing Authority
Interchange Authority
Planning Authority
Reliability Coordinator
Resource Planner
Transmission Operator
Transmission Planner
Transmission Service Provider
Regional EntitiesReliabilityFirst,
MRO and
SERC
Standards that have been approved by the NERC Board of Trustees are available at:
http://www.nerc.com/page.php?cid=2|20
Additional standards approved by the ReliabilityFirst Board are available at:
https://www.rfirst.org/standards/Pages/ApprovedStandards.aspx
2011 ISO/RTO Metrics Report146


Dispatch Operations
MISO CPS-1 Compliance 2009 - 2010
200%
180%
160%
140%
120%
100%
80%
20062007200820092010
Each Balancing Authority is responsible for complying with CPS-1 standards. MISO became a Balancing Authority on
January 6, 2009 with the start of the Ancillary Services Market. As such, MISO’s compliance tracking started in 2009.
Compliance with CPS-1 requires at least 100% throughout a 12-month period. MISO was in compliance with CPS-1
for 2009 and 2010.
MISO CPS-2 Compliance 2009 - 2010
Each Balancing Authority is responsible for complying with CPS-2 standards or alternatively for complying with the
Balance Authority Ace Limit (BAAL) which is currently being evaluated by NERC as a potential replacement for CPS-
2. MISO is participating in the NERC field trial of the BAAL standard and hence monitors against that standard. MISO became a Balancing Authority on January 6, 2009 with the start of the Ancillary Services Market. As such, MISO’s compliance tracking started in 2009. For 2009 and 2010, MISO did not have any violations of the standard.
MISO Transmission Load Relief or Unscheduled Flow Relief Events 2006-2010
2011 ISO/RTO Metrics Report148
MISO’s data reflects the number of Transmission Load Relief (TLR) events. MISO’s TLR events were comprised of primarily level 3, and 4 events with level 5 events of 4%, 5%, 4%, 10% and 13% in 2006 through 2010. The reduction in TLRs for 2008 through 2010 is due to several factors including system reinforcements and market operation.
Primarily non-firm curtailments, the monthly average curtailments in MWh were 151,842; 87,090; 111,550; 76,541
and 67,960 in 2006 through 2010.
MISO Energy Market System Availability 2006-2010
100%
95%
90%
85%
80%
20062007200820092010
Availability of the Energy Management System (EMS) is key to reliable monitoring of the electric transmission system
in the MISO region. For the past five years, MISO’s EMS has been available 99.9% or greater of all hours in each
year.
2011 ISO/RTO Metrics Report149

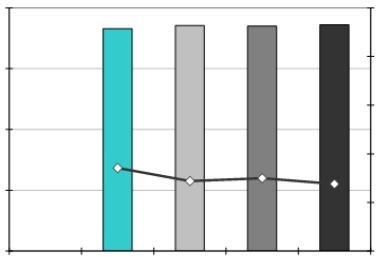
Load Forecast Accuracy
MISO monitors load forecasting accuracy for several different time reference points. MISO’s load forecasting
accuracy has been relatively steady over the last 4 years. The day-ahead load forecasting accuracy for the data
shown below is 4:30 p.m. EST of the prior day for 2007 to 2009. For 2010, the reference point changed to 3:30 p.m. EST of the prior day. The data below reflects this change. Load forecasting data is not available for 2006. In the future, MISO will retain the additional periods requested for this report.
The day-ahead load forecast does not account for the impact of interruptible load and demand response resources. Interruptible loads and DRR have an immaterial effect on the forecast considering the size of MISO’s load.
MISO Average Load Forecasting Accuracy 2007-2010
100%5%
4%
95%
3%
90%
2%
85%
1%
80%0%
20062007200820092010
Forecasting AccuracyMean Absolute Percentage Error
2011 ISO/RTO Metrics Report150

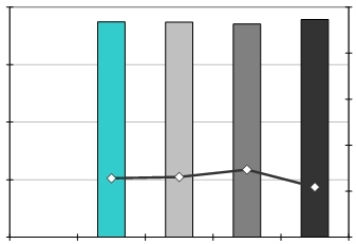

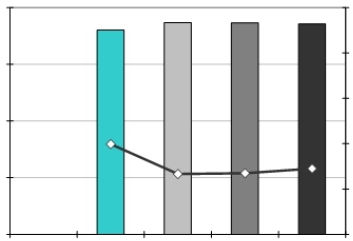
MISO Peak Load Forecasting Accuracy 2007-2010
100%5%
4%
95%
3%
90%
2%
85%
1%
80%0%
20062007200820092010
Forecasting AccuracyMean Absolute Percentage Error
While MISO does not procure capacity on behalf of Load Serving Entities (LSE), the peak demand forecasts created and submitted by each LSE directly determines the amount of capacity that each LSE must designate (potentially procure if short) to meet their planning resource obligations. If a LSE under forecasts its peak demand this would
result in the LSE under designating (or procuring) capacity which could result in potential reliability issue.
Alternatively, when an LSE over forecasts its peak demand, it will over designate (or procure) its capacity. This
results in inefficient capacity procurement.
MISO Valley Load Forecasting Accuracy 2007-2010
100%5%
4%
95%
3%
90%
2%
85%
1%
80%0%
20062007200820092010
Forecasting AccuracyMean Absolute Percentage Error
2011 ISO/RTO Metrics Report151
Wind Forecasting Accuracy
MISO Average Wind Forecasting Accuracy 2009-2010
100%
95%
90%
85%
80%
20062007200820092010
Wind forecasting accuracy is calculated using an industry-wide methodology called Mean Absolute Error (MAE). The
MAE is the average of the absolute value of the difference between forecasted and actual wind power output and is
expressed as a percent of installed wind nameplate capacity. The wind forecasting accuracy is represented as one
minus MAE.
The wind forecasting calculation methodology differs from the calculation methodology used for the load forecasting accuracy metric because the wind forecasting calculation methodology expresses the absolute error value as a
percent of installed wind nameplate capacity whereas the load forecasting calculation methodology expresses the absolute error value as a percent of total forecasted load. The wind forecasting calculation methodology used is a common practice within the industry.
MISO is continuing to explore methods for improving the accuracy of its wind forecasting, but our current accuracy
appears to be consistent with the accuracy obtained in other regions throughout the world. Wind forecasting accuracy data prior to 2009 is not available.
2011 ISO/RTO Metrics Report152
Unscheduled Flows
MISO Absolute Value of Total Unscheduled Flows 2009-2010
(terawatt hours)
120
100
80
60
40
20
0
20062007200820092010
In 2010, MISO had an absolute value of 37 terawatt hours of unscheduled flows. These unscheduled flows occurred
over 21 external interfaces. For 2009, MISO is reporting data starting on January 6, 2009 when its Ancillary Services
Market started and a new scheduling system was introduced. MISO replaced its scheduling system during that
transition. While the data from that system has been retained, access to the data in this type of configuration is not
readily available.
MISO Absolute Value of Unscheduled Flows
as a Percentage of Total Flows 2009-2010
45%
40%
35%
30%
25%
20%
15%
10%
5%
0%
20062007200820092010
2011 ISO/RTO Metrics Report153
MISO’s absolute value of total hours of unscheduled flows as a percentage of total flows was 6.3% in 2010. As
previously mentioned, for 2009, MISO is reporting data starting on January 6, 2009 when its Ancillary Services
Market started and a new scheduling system was introduced. MISO replaced its scheduling system during that
transition. While the data from that system has been retained, access to the data in this type of configuration is not
readily available.
Unscheduled flows for the top five interfaces are shown in the table below:
MISO Unscheduled Flows2010
by Interface(in terawatt hours)
Ohio Valley Electric Cooperative(7)
PJM(5)
Electric Energy, Inc.5
Tennessee Valley Authority4
Entergy(3)
Note: A positive value denotes unscheduled flows into the ISO/RTO; a negative value denotes unscheduled flows out of the ISO/RTO.
Parallel flows are a function of the interconnection’s operating configuration, the resistance and physics. Another
characteristic of parallel flows is that they sum to zero when all interfaces between a BA and all neighboring BAs are considered. While parallel flows from outside entities may create additional transmission system losses on a system, the real concern is the congestion the parallel flows create and the costs that are incurred when parallel flows cause facilities to exceed their limits. Parallel flows from outside entities are not limited to neighboring BAs. MISO
experiences parallel flows from other BAs that do not have an interconnection with MISO.
MISO has two methods to deal with congestion caused by parallel flows. The first method, the Transmission Loading Relief (TLR) approach, was developed by NERC and aims to reduce the harmful impacts of parallel flows by
curtailing transactions between areas. The second method, the Congestion Management Process (CMP) approach, assigns firm flowgate rights among seams entities that are used when congestion occurs and redispatch obligations are made based on flowgate curtailment priorities. For 2010, seams agreements that contain CMPs existed between MISO, PJM, SPP, TVA and Manitoba Hydro. MAPP entities took Part II Seams Service under Module F. MISO is working with IESO, NYISO and PJM to address Lake Erie loop flows through a number of initiatives including the operation of the phase angle regulators (PARs) on the MI-ONT interface.
2011 ISO/RTO Metrics Report154
Transmission Outage Coordination
MISO’s transmission owners are required to request advance approval of transmission outages associated with
scheduled maintenance. MISO is required to study and approve or disapprove those requests within certain time
periods. The following metrics reflect the performance of the parties with respect to this transmission outage
coordination.
MISO Percentage of > 200kV planned outages of 5 days or more that are submitted to ISO/RTO at least 1
month prior to the outage commencement date 2006-2010
100%
80%
60%
40%
20%
0%
20062007200820092010
MISO Percentage of planned outages studied in the respective ISO/RTO Tariff/Manual established
timeframes 2006-2010
100%
80%
60%
40%
20%
0%
20062007200820092010
MISO’s business practices allow for exceptions (i.e. extensions) to its planned outage study timeframe in prescribed
situations. However, MISO does not track those extensions in a centralized location. Therefore, MISO statistics
shown above do not account for these prescribed extensions and represent lower than actual performance.
2011 ISO/RTO Metrics Report155
MISO Percentage of > 200 kV outages cancelled by ISO/RTO after having been previously approved 2006-
2010
2.50%
2.00%
1.50%
1.00%
0.50%
0.00%
20062007200820092010
MISO has the authority to cancel or reschedule previously-approved planned transmission outages if such outages would jeopardize system reliability conditions. However, MISO has only needed to cancel or reschedule a very small percentage of transmission outages that it had previously approved.
MISO Percentage of unplanned > 200kV outages 2006-2010
30%
25%
20%
15%
10%
5%
0%
20062007200820092010
Unplanned transmission outages may occur due to equipment malfunctions on the transmission line or an adjacent substation. They can also occur due to weather conditions that cause a transmission facility to trip out of service. Over the 2006 - 2010 time period, 20 - 24% of the outages of transmission assets in the MISO Region with 200 kV or higher voltages have been unplanned.
2011 ISO/RTO Metrics Report156
The impact of transmission outages on generation availability and on declared emergencies is mitigated by
provisions in the MISO Tariff and Outage Operations Business Practices. All transmission and generation outage requests are submitted and reviewed/approved by MISO prior to implementing. Generally, generation outage
requests are required to be submitted prior to submission of transmission outage requests. Transmission outage requests are then analyzed and approved or rescheduled to maintain transmission system reliability and minimize impact on generation availability. Transmission outage requests are also analyzed, approved or cancelled such that the outage does not result in a declared emergency. The metric indicating percentage of outages cancelled by MISO is very low, averaging less than a tenth of a percent over the last five years, demonstrating appropriate outage
coordination maintains transmission reliability and generation availability.
2011 ISO/RTO Metrics Report157
Transmission Planning
MISO follows a top-down (regional), bottom-up (local) planning process intended to address reliability, economic, and public policy driven transmission issues. The process focuses efforts on identifying issues and opportunities to
strengthen the transmission system, developing alternatives for consideration, and evaluating those options to
determine effective solutions. The goal is to identify transmission projects:
Ensuring the reliability of the transmission system
Providing economic benefit, such as increasing market efficiency
Facilitating public policy objectives, such as the integration of renewable energy
Addressing other issues or goals identified through the stakeholder process
As part of the bottom-up (local) process, Transmission Owners in MISO are responsible for submitting their
transmission construction plans to MISO for evaluation and possible inclusion in Appendix A of the MISO
Transmission Expansion Plan (MTEP). MISO, in conjunction with its Transmission Owners and other stakeholders, also develops plans to address regional transmission issues through the top-down (regional) process.
After thorough analysis, projects identified as the best solution for a particular issue or opportunity are included in Appendix A of the MTEP report and recommended for approval by the MISO Board of Directors (BOD). Once approved by the BOD, the Transmission Owner is required to make a good faith effort to complete the project. The following metrics give insight into the process and its results.
MISO Number of Transmission Projects Approved to be Constructed for Reliability Purposes 2006-2010
550
500
450
400
350
300
250
200
150
100
50
0
20062007200820092010
2011 ISO/RTO Metrics Report158
MISO Percentage of Approved Construction Projects Completed by December 31, 2010
100%
80%
60%
40%
20%
0%
20062007200820092010
Projects that address a transmission issue but require further analysis are assigned to Appendix B until it is
determined that these projects are the best alternative to identified issues. Finally, Appendix C contains projects still in the conceptual stages. Once analyzed and—if justified—projects currently in Appendices B and C move to
Appendix A for approval in current MTEP planning cycle and construction.
Value Based Planning Process
The uncertainties surrounding future policy decisions create challenges for those involved in the planning function and causes hesitancy for those with the resources to undertake transmission expansion projects. To minimize the risk in building a system under such conditions, the planning process must consider transmission projects in the context of all potential outcomes. The goal is to identify plans resulting in the least amount of future regrets in areas such as cost incurred, right of way used, and benefits achieved. This Value Based Planning Process seeks to meet this challenge through the execution of seven steps, including:
Defining potential future energy policy outcomes
Identifying generation capacity expansions that must occur in order to meet the objectives of each future
scenario
Modeling the potential location of generation
Designing a conceptual transmission plan under each future
Robustness testing to identify projects that perform well under most—if not all—future scenarios Testing the transmission plan against reliability criteria
Determining cost allocation
2011 ISO/RTO Metrics Report159
In addition to the seven step process above, which serves to build the business case for new investment, additional conditions need to be met in order to develop transmission investment driven by public policy needs. There needs to be relative consensus around the public policy needs that are being addressed. Broad adoption of renewable
portfolio standards and increased regulation from the Environmental Protection Agency are two examples of this. There also needs to be a cost allocation and recovery mechanism in place that includes investment driven by public policy or other regional economic and reliability needs.
Projects developed through this process are submitted into the MTEP Appendices for further analysis and potential Appendix A inclusion.
Demand response and energy efficiency programs and their impacts are currently reflected in the cumulative
demand and energy growth rates. If a particular combination of Demand Side Management (DSM) programs is found
to be economically viable, then the DSM programs will be included in the transmission planning and economic
models as future generation units, and a lower demand will be reflected due to the energy efficiency programs. This
in turn will have an impact on preliminary transmission portfolio design and affect—to greater or lesser degrees—the
overall robust transmission overlay that will be proposed. The degree of DSM’s impact on the regional plan, although
dependent on many variables, may be substantially lessened if the transfer capability of the system is too low. If the
transfer limits of the system are insufficient, DSM resources that may be the most economic may become trapped
behind a transmission constraint.
Demand response may also be considered as a solution to an identified transmission issue. In order for demand
response to be used as a solution, it must be evaluated in the MISO planning process, found to be the most effective solution and have equivalent certainty to its alternative projects. This equivalent certainty will most likely be in the form of a legally binding contract forcing the demand response solution to be implemented, similar to the conditions required for an MTEP Appendix A transmission project.
With the addition of significant amounts of intermittent resources such as wind turbines to the transmission grid, the
ability to store large amounts of energy for use during high demand times is becoming more important. Energy
storage is becoming economical through the implementation of new technologies such as large-scale battery
systems, flywheels, modifying the dispatch of wind generation to supply ancillary service products, and compressed
air energy storage. MISO is currently investigating the impact of energy storage on its planning models and future-
based scenarios. A full-scale evaluation of energy storage is anticipated for the MTEP 11 planning cycle.
MISO Performance of Order 890 Planning Process
A key element of the Order 890 Planning Requirements is the involvement of transmission customers early and throughout the planning process. Subregional Planning Meetings (SPMs) are held in the West, Central and East planning regions of MISO. These SPMs provide forums for stakeholders to obtain information and to provide feedback on transmission project proposed in the current cycle.
In accordance with Order 890 and NERC standards, MISO completed the following reliability studies in 2010: AC
contingency, dynamic stability, voltage stability, small signal stability, load deliverability, generation deliverability, and
long-term transmission rights. MISO also completed the following economic studies in 2010: Regional Generation
2011 ISO/RTO Metrics Report160
Outlet Study (RGOS), MISO top congested flowgates and cross border top congested flowgates. The results of these studies can be found in the MTEP 2010 report.
The MTEP 2010 report is available at www.misoenergy.org.
2011 ISO/RTO Metrics Report161
Generation Interconnection
MISO Average Generation Interconnection Request Processing Time 2006-2010
(calendar days)
1,000
800
600
400
200
0
20062007200820092010
The metric for processing time for generation interconnection requests was calculated using the date an
interconnection request entered the MISO generator interconnection queue as their start date. The end date was either the date an interconnection (IA) was achieved or the date the interconnection date was withdrawn.
In 2008, MISO moved the focus of its process from ―first in-first out‖ to ―first ready-first served.‖ With that basic
fundamental shift, customers must show progress in non-transmission aspects of their project to proceed into later phases of the process (Definitive Planning). Otherwise, the interconnection requests can elect to either park or be studied in the System Planning & Analysis (SPA) phase. Within 18 months of the reform, over 230 requests received their system impact study report, compared to 40-50 per year prior to the reform.
For this report, MISO observed several main factors attributing to the processing of interconnection requests. Of the
interconnection requests processed in 2010, nearly 40% elected to park rather than proceed into their next eligible
Definitive Planning Phase, thus delaying processing of their interconnection requests by their own decision. Required
upgrades to support the massive integration of renewable resources in highly congested areas increase the
complexity and time required to process requests. Twenty-six of the longest thirty-five requests processed in 2010
were ―Pre-Transition‖ and ―SPA‖ interconnection requests. ―Pre-Transition‖ requests are pre-2008 queue reform
interconnection requests that were not required to conform to the new process. ―SPA‖ projects did not display
adequate generator or system readiness such that they did not qualify for Definitive Planning Phase and thus spent
an extensive time in the SPA phase. Excluding the Pre-Transition and SPA interconnection requests, the processing
averages are approximately 600 days.
2011 ISO/RTO Metrics Report162
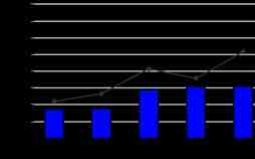
MISO Planned and Actual Reserve Margins 2006 - 2010
Bars Represent Planned Reserve MarginsLines Represent Actual Resources Committed
MISO’s resource adequacy mechanism was established in 2009. Prior to that time reserve margins were set by the Regional Reliability Organizations in the area. MISO does not have a centrally procured capacity market. Load Serving Entities (LSEs) are required to designate specific capacity to meet their individual requirements. They may obtain that capacity via any of several ways including construction, bilateral contracts, existing generation, demand response, behind-the-meter generation (BTMG), or even through MISO’s voluntary capacity auction. Demand
response and BTMG are defined as planning resources in the MISO resource adequacy mechanism and are called Load Modifying Resources (LMR). LMR are required to meet specific criteria established by MISO’s Module E in order to be registered and eligible to be used to meet LSE’s capacity requirements.
Demand response resources can be used to meet the region’s resource adequacy requirements. As shown in the
chart below, demand response capacity as a percentage of total capacity rose from 2.6% in 2006 to 3.2% in 2010. MISO also allows demand response resources that meet specified requirements to participate in the following
markets: energy, regulation, spinning reserves, and non-spinning reserves. Demand response resources are actively participating in each of these areas.
2011 ISO/RTO Metrics Report163
MISO Demand Response Capacity as Percentage of Total Installed Capacity 2006-2010
7%
6%
5%
4%
3.21%
3%
2%
1%
0%
20062007200820092010
MISO fosters demand response in the region through dynamic pricing and direct load control/interruptibles. As a
result, generation infrastructure investment is deferred by reducing load during times of system peaks. MISO has
over 12,500 MW of total demand response capability. The deferral of generation infrastructure investment represents theoretical savings of $87 million in 2010 with the anticipation that savings will increase in future years.
Forecasted peak demands are submitted by LSE’s using a 50%-50% forecast (50% probability the forecast will be
over, and 50% probability the forecast will be under the actual peak demand) using CPNode granularity and including all losses downstream from the generator bus (transmission and distribution).
LSEs must report their non-coincident peak forecasted demand to MISO at each CPNode for each month of the next
two planning years and also for each summer period (May- October) and winter period (November - April) for an
additional eight planning years. The forecasts shall be based upon considerations including, but not limited to,
average historical weather conditions and expected load changes (addition or subtraction of demand). LSEs will
separately register demand resources that qualify under Module E in order to have them subtracted from their
forecasted demand.
MISO will calculate the forecast LSE requirement as the forecasted demand for an LSE (adjusted by DR that are registered to net) for each month of the next planning year.
2011 ISO/RTO Metrics Report164
Forecasts of demand are subject to after-the-fact assessments using standard deviation bandwidths and normalization factors provided by LSEs to identify potentially improper forecasting.
Within Module E, individual LSEs maintain reserves based on their monthly peak load forecasts. These peak
forecasts do not sum to the system coincident peak because they are reported based solely on the entity’s own peak,
which could occur at a different time than the system peak. To account for this diversity within the system, a reserve
margin was calculated for application to individual LSE peaks utilizing a diversity factor. This resulted in an individual
LSE reserve level that is reduced from what would otherwise be a higher reserve without accounting for diversity.
The reduced reserve level delays the need for new capacity. For the most of MISO’s membership, the recent
economic downturn resulted in load reductions, and thus excess generation capacity to the point that under the
present conditions this benefit will not rematerialize for the next few years. The MISO 2010 Value Proposition
calculates a theoretical benefit of $280 million to $350 million assuming no excess capacity based on the cost of
building new combustion turbine capacity. The benefit is the avoided annual revenue requirement of that avoided
capacity.
There are numerous factors that impact the adequacy of the actual reserve margin vis-à-vis the projected reserve margin, including load forecasts and energy efficiency trends. When MISO calculates the Planning Reserve Margin (PRM), there are a number of key factors that impact the results:
Congestion: Changes in the amount of transmission congestion on the MISO system. Congestion
incorporates the notion of aggregate deliverability impact and a quantifiable MW capacity impact upon Loss of Load Expectation (LOLE) achieved.
Load Forecast Uncertainty: MISO utilizes the summation of the NERC Variances method to calculate the
load forecast uncertainty value. This method produces a sigma value. The summation of the NERC
Variances method has a solid methodology and the NERC Load Forecasting Working Group has consistent
input from MISO membership. More forecast error is introduced for example due to the recent economic
downturn.
Forced Outage Rates: Forced outage rates are adjusted to exclude certain outage types, deemed as
outside of management control, and account for the time when a unit was in demand. These adjustments to the forced outage rates yielded an Effective Forced Outage Rate Demand (EFORd) that excluded certain outages which is known as XEFORd.
External Support: MISO determines the level of support the external systems can provide based on
historical total transmission flows and contractual flows. That applicable external support level is held to the same reliability level as the internal system.
Membership Changes: The impact of the entrance and departure of members from MISO market and
reliability systems are factored into the PRM determination. For example, for the 2011-2012 planning year,
the entrance of Dairyland Power Cooperative and Big Rivers Electric Cooperative and the departure of
FirstEnergy resulted in changes to the PRM.
2011 ISO/RTO Metrics Report165
Modeling Improvements: As MISO compiles more accurate and comprehensive data on modeling factors
such as generator performance, outages, and load shapes, the data improves the accuracy of the results.
MISO Percentage of Generation Outages Cancelled by ISO/RTO 2006-2010
1.00%
0.50%
0.00%
20062007200820092010
The chart above includes cancelled generation outages that were denied or revoked by MISO. Percentage of generation outages cancelled was 0.0% for 2006 and 2007.
MISO Generation Reliability Must Run Contracts 2006-2010
When a generating unit that wishes to retire or be mothballed is required to continue to operate for reliability
purposes, it is known in MISO as a System Support Resource. MISO had no units under these types of contracts from 2006 through 2010.
2011 ISO/RTO Metrics Report166
Interconnection / Transmission Service Requests
MISO continues to see a decrease in interconnection requests entering the generation interconnection process each year since the 2008 queue reform. There has been a general reluctance from some customers to withdraw from the process at the end of their studies insisting on restudies or choosing to park instead of demonstrating the readiness required to progress through the interconnection process.
The 2008 queue reform appears to be working as designed by increasing the studies completed and shortening the
study timeframes for completed studies. For example, Feasibility Studies have been reduced to an average of 12
days, Definitive Planning Phase System Impact Studies to an average of 200 days, and Facilities Studies are
averaging around 150 days over the past 3 years. This is an accomplishment considering the complexities of
required upgrades that surround the interconnection’s massive amounts of renewables in highly congested areas.
Of the interconnection requests completing the process in 2010, whether by achieving an interconnection agreement or withdrawing, nearly 40% elected to park rather than proceed into their next eligible Definitive Planning Phase. This delayed processing of their interconnection requests by their own decision. Twenty-six of the oldest thirty-five
requests processed in 2010 were ―Pre-Transition‖ and ―SPA‖ interconnection requests. ―Pre-Transition‖ requests are pre-2008 queue reform interconnection requests that were not required to conform to the new process. ―SPA‖
projects did not display adequate generator or system readiness such that they did not qualify for Definitive Planning Phase and thus spent an extensive time in the SPA phase. Excluding the Pre-Transition and SPA interconnection requests, the processing averages are approximately 600 days.
Restudies of older interconnection requests continue to dampen the reform effects by increasing processing times and aging for incomplete requests. This results in higher average age of incomplete studies and study costs for interconnection requests located in the general vicinity. By removing data from one particular significant older group restudy and requests located in the same regional wind rich vicinity, MISO observes an improvement in those
metrics. For example, the average age of incomplete studies drop by 259 days.
Cost allocation enhancements, including the introduction of Multi-Value Projects (MVP) and Shared Network
Upgrades (SNU), are expected to remove some of the surrounding uncertainty in the past that have incentivized interconnection requests to delay completing the interconnection process.
MISO continues to focus on process improvements to increase efficiencies and to work with stakeholders on the generation interconnection process to improve certainty and value.
2011 ISO/RTO Metrics Report167
MISO Number of Study Requests 2006-2010
500
450
400
350
300
250
200
150
100
50
0
20062007200820092010
This metric calculates the number of interconnection requests MISO received each year. Each interconnection request may have several studies performed (Feasibility, System Impact Study, Facilities Study).
MISO Number of Studies Completed 2006-2010
700
600
500
400
300
200
100
0
20062007200820092010
MISO’s generation interconnection process includes three potential types of studies - Feasibility Studies, System
Impact Studies (SPA or DPP), and Facilities Studies. For this report, MISO has included each of these studies in the
total, which is a more accurate account of study work MISO performs. Whereas in the previous report, MISO only
counted the number of interconnection requests that progressed all the way through the process or withdrew, thus
not counting all studies completed for each interconnection request. This revised calculation reaffirms the process
efficiency improvement gained from past queue reforms (that includes allowing for group studies and a reformed
process that places priority on project and system readiness) which result in more studies completed.
2011 ISO/RTO Metrics Report168
MISO Average Aging of Incomplete Studies 2006 - 2010
(calendar days)
800
700
600
500
400
300
200
100
0
20062007200820092010
This metric averages the age of each incomplete or active study, which includes Feasibility Studies, System Impact Studies, and Facilities Studies. Average aging of incomplete studies is calculated differently than average aging of incomplete interconnection requests. The average age of incomplete or active requests is not reflected in the graph above. The average age of incomplete or active requests is calculated as the date of interconnection agreement or withdrawal minus the queued date. The average age of incomplete or active requests has increased to 876 days. Excluding a restudy for a significant group study and subsequent cycles effected by the group re-study, the average age of incomplete requests decrease to 617 days.
MISO Average Time to Complete Studies 2006-2010
(calendar days)
800
700
600
500
400
300
200
100
0
20062007200820092010
2011 ISO/RTO Metrics Report169
This metric is calculated by taking the study end date minus the study start dates for each year and averaging it. It calculates the average days for all types of studies completed for each year, which include Feasibility Studies,
System Impact Studies, and Facilities Studies. For the year 2010, Feasibility Studies averaged 12 days, SPA System Impact Studies averaged 454 days, DPP System Impact Studies averaged 203 days, and Facilities Studies averaged 165 days. The combined average for all studies is 217 days.
MISO Average Cost of Studies Completed 2006-2010
$200,000
$150,000
$100,000
$50,000
$0
20062007200820092010
This year’s report captures total study costs (Feasibility, System Impact, Optional, and Facilities) for completed
interconnection requests. MISO study costs captured in the previous year’s report included only System Impact
Study costs.
2011 ISO/RTO Metrics Report170
Special Protection Schemes
MISO Number of Special Protection Schemes 2010
MISO had 50 special protection schemes in 2010. Of the 50 SPSs, MISO’s West Region had 33 SPSs, the Central
Region had 6 and the East Region had 11. In 2010, there were no intentional misoperations of SPSs in MISO.
2011 ISO/RTO Metrics Report171
B. MISO Coordinated Wholesale Power Markets
For context, the table below represents the split of the $29.1 billion dollars billed by MISO in 2010 into the primary types of charges its members incurred for their transactions.
(dollars in millions)2010 Dollars Billed
Energy$ 25,643.4
Transmission Service1,520.3
FTR1,405.2
Administrative Costs255.6
Contingency Reserves116.0
Regulation Market115.1
Resource Adequacy0.1
Other 47.9
Percentage of 2010
Dollars Billed
88.1%
5.2%
4.8%
0.9%
0.4%
0.4%
0.0%
0.2%
Total$ 29,103.6100.0%
MISO Demand Response as a Percentage of Synchronized Reserve Market 2009-2010(1)
12%
10%
8%7.79%
6%
4%
2%
0%
20062007200820092010
(1)M ISO 2009 data begins January 6, 2009 reflecting the start of the MISO‟s Ancillary Services Markets
2011 ISO/RTO Metrics Report172
MISO Demand Response as a Percentage of Regulation Market 2009-2010(1)
12%
10%
8%
6%
4%
2.38%
2%
0%
20062007200820092010
(1) M ISO 2009 data begins January 6, 2009 reflecting the start of the MISO‟s Ancillary Services Markets
2011 ISO/RTO Metrics Report173
Market Competitiveness
MISO Energy Market Price Cost Markup 2007-2010
15%
10%
5%
0%
-5%
-10%
-15%
20062007200820092010
MISO calculates price cost markup by comparing the system marginal price based on actual offers to a simulated
system marginal price based on assuming suppliers had all submitted offers at their estimated marginal costs.
The overall price cost markup percentages over the past four years support the conclusion that prices in MISO are set, on average, by marginal units operating at or close to their marginal costs. MISO does not have data for this
metric for 2006.
MISO New Entrant Gas-Fired Combustion Turbine (CT) Net Generation Revenues 2006-2010
(dollars per installed megawatt year)
$150,000
$100,000
$50,000
$0
20062007200820092010
2011 ISO/RTO Metrics Report174
MISO New Entrant Gas-Fired Combined Cycle (CC) Net Generation Revenues 2006-2010
(dollars per installed megawatt year)
$150,000
$100,000
$50,000
$0
20062007200820092010
In 2010, MISO markets would not have supported investment in either gas CT or CC generation units based on their annualized costs of new investment. The MISO footprint has a sizable capacity surplus that precluded significant periods of shortage, particularly at reduced load levels.
MISO Real-Time Energy Market Percentage of Unit Hours Offer Capped due to Mitigation 2006-2010
3%
2%
1%
0%
20062007200820092010
MISO’s mitigation measures are intended to preclude abuses of locational market power while minimizing
interference with the market when the market is workably competitive. MISO only imposes mitigation measures when
suppliers’ conduct exceeds well-defined conduct thresholds and when the effect of that conduct on market outcomes
exceeds well-defined market impact thresholds. By applying these conduct and impact tests, the mitigation measures
are designed to allow prices to rise efficiently to reflect legitimate supply shortages, while effectively mitigating
2011 ISO/RTO Metrics Report175
inflated prices associated with artificial shortages that result from physical or economic withholding in transmissionconstrained areas.
In the years 2006 to 2010, total unit hours mitigated in a year ranged from 19 hours to 498 hours. Consequently, the
unit hours offer capped due to mitigation is extremely small when calculated as a percentage of total unit hours.
Potomac Economics, MISO’s Independent Market Monitor, provides a competitive assessment of MISO markets in its 2010 State of the Market Presentation that includes a review of potential market power indicators, an evaluation of participants’ conduct, and a summary of the imposition of mitigation measures in 2010.
Regarding market concentration as measured by the Herfindahl-Hirschman Index (HHI), Potomac Economics states the market concentration of the entire MISO region is relatively low although they are considerably higher in the
individual regions. The HHIs in MISO are higher than in some other markets because the vertically-integrated utilities in the Midwest have not divested substantial amounts of generation. Potomac Economics continues by pointing out
that the HHI measure is only a general indication of market conditions. HHI does not consider demand, network
constraints, or load obligations.
Potomac Economic states that a better metric for evaluating competitive issues in electricity markets is the Residual
Demand Index (RDI) which indicates the portion of the load in an area that can be satisfied without the largest
supplier. The index attempts to measure whether a supplier is ―pivotal‖ - i.e., it has monopolist power over a portion
of the load.
Due to more high load periods, Potomac Economic’s analysis revealed that the share of all hours with pivotal
suppliers for 2010 increased in all MISO regions, except the West. In hours with loads greater than 90 GW, the pivotal supplier share in WUMS decreased from over 90% in 2009 to nearly 30% in 2010; however, there were 8 times more high-load hours in 2010. The frequency of pivotal suppliers in the West declined as a result of new wind capacity built by relatively small-scale generation owners and the entry of Mid-American. Potomac Economic states that pivotal suppliers in the Central region continue to be less of a concern.
Potomac Economics also conducted a pivotal supplier analysis for individual transmission constraints in periods
during which the constraints were active. The analysis showed that 76% of those into WUMS had a pivotal supplier in
2010, up from 69% in 2009. In addition, 60% of those into Minnesota had a pivotal supplier in 2010, down from 75%
in 2009. 56% of all BCA constraints had a pivotal supplier in 2010, down from 64% in 2009. The results indicate that
while local market power is most commonly associated with the Narrow Constrained Areas (NCA) constraints, a large
share of Broad Constrained Areas (BCA) constraints in 2010 created significant potential for local market power,
particularly during the summer months. BCA and NCA mitigation continues to be essential. However, Potomac
Economics states, ―While substantial local market power exists, there was little evidence of attempts to exercise
market power in 2010.‖
MISO’S 2010 State of the Market Presentation states that market power mitigation in the MISO’s energy and ancillary
services market occurs pursuant to automated conduct and impact tests that utilize clearly-specified criteria. Because
conduct has largely been competitive, market power mitigation has been rare. However, Potomac Economics
2011 ISO/RTO Metrics Report176
identified a competitive concern associated with commitments to satisfy local reliability needs that warrant an expansion in the mitigation measures.
With respect to price volatility, MISO’s 2010 State of the Market Presentation states:
―The introduction of ASM in 2009 resulted in improved supply flexibility that allows the real-time market to satisfy the system’s demands with less price volatility. Nonetheless, volatility in MISO remained higher than in neighboring RTOs because MISO runs a true five-minute real-time market (producing a new dispatch every 5 minutes rather than every 15 minutes as do most other RTOs). Since the real-time market software is limited in its ability to look ahead, the system is frequently ―ramp-constrained‖ (i.e., generators are moving as quickly as they can up or down). This results in transitory spikes in prices up or down.‖
2011 ISO/RTO Metrics Report177
Market Pricing
MISO Average Annual Load-Weighted Wholesale Energy Prices 2006-2010
($/megawatt-hour)
$100
$90
$80
$70
$60
$50
$40
$34.17
$30
$20
$10
$0
20062007200820092010
The average annual load-weighted wholesale energy prices substantially reflect the changes in fuel costs. These
trends are supported by the chart below that shows the trends in the costs of key fuel sources for generation units in the U.S. electricity industry.
Peak Price Trends
Time
7/31/2006 16:00
8/8/2007 15:00
7/29/2008 15:00
6/25/2009 14:00
8/10/2010 16:00
MISO Real-TimeDay-AheadReal-Time
Load (MW)LMP ($/MWh)LMP ($/MWh)
109,065$222.72$268.21
103,997$148.08$225.64
98,263$157.92$182.77
96,334$63.32$46.69
108,121 $83.76 $68.75
Day-ahead and real-time LMPs at the annual MISO system peak load hour show the strong correlation between the
load and prices. The LMPs from 2006 to 2007 moved in the same direction as the changes in real-time load.
However, in 2008 increased fuel prices across all fuel types may have caused the LMPs to be higher than 2007 even
2011 ISO/RTO Metrics Report178
though the peak load actually declined. The 2008 and 2009 LMPs are influenced by the broad economic slowdown and decline in weather induced electric demand due to relatively milder weather in those years. In addition to the lower demand in 2009, fuel prices declined, causing a significant drop in LMPs compared to 2008. In 2010, the peak load increased by 12.2% compared to the peak in 2009. Day-ahead and real-time LMPs at the peak load hour
increased by 32.3% and 47.3% respectively. The higher percentage increase in peak LMPs is partly due to the
significant increase in natural gas prices from 2009 to 2010.
U.S. Nominal Fuel Costs 2006-2010
($ per million Btu)
$25
$20
$16.59
$15
$12.56
$10
$5$5.08
$2.26
$0
20062007200820092010
CoalNatural GasResiduel Fuel OilDistillate Fuel Oil
Source: U.S. Energy Information Administration, Independent Statistics and Analysis. ―Table 2. U.S. Energy Prices, EIA/Short-
Term Energy Outlook—June 2011,‖ http://www.eia.gov/emeu/steo/pub/2tab.pdf.
2011 ISO/RTO Metrics Report179
MISO Average Annual Load-Weighted
Fuel-Adjusted Wholesale Spot Energy Prices 2006-2010(1)
($/megawatt-hour)
$100
$90
$80
$70
$60
$50
$44.95
$40
$30
$20
$10
$0
20062007200820092010
(1) MISO‟s base year for fuel-cost references is 2004.
2011 ISO/RTO Metrics Report180
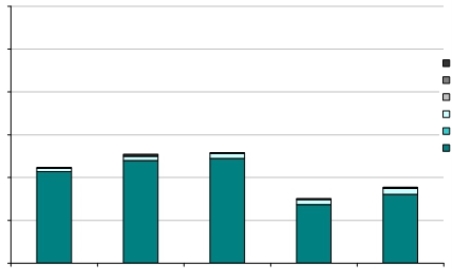
MISO Wholesale Power Cost Breakdown 2006-2010
($/megawatt hour)
$120
$100
RTO Cost & Regulatory Fees Operating Reserves
$80
$60
$44.77
$40
$20
$0
2006
$50.90$51.59
$30.20
200720082009
Ancillary Services Transmission
Capacity
Energy
$35.46
2010
On an annual basis, energy costs have comprised 91% - 95% of MISO’s total wholesale power costs for the past five years. All other components of MISO’s wholesale power cost per megawatt hour account for less than 5% - 9% of the total costs per megawatt hour. In particular, the operating reserve costs (sometime referred to as uplift) vary from year to year, but represent on average $0.33 per megawatt hour of the total wholesale power cost in the MISO
Region. In 2006 through 2010, such uplift costs represented 0.3% - 1.7% of the total wholesale power cost per
megawatt hour during that five-year period.
Impacts of Demand Response on Market Prices
MISO continues to enhance the ability of demand response to participate in its markets, including energy, ancillary
services, and capacity. Efforts are ongoing to identify potential barriers and to provide solutions that encourage
Market Participants to include demand response in their market portfolios. While the footprint has been long in
capacity for some time, demand response has demonstrated its long-term potential during certain periods. For
example, during the August 1, 2006 event, approximately 3,000 MW’s of demand response responded for ten hours.
Corresponding clearing prices during this window declined by $100/MWh - $200/MWh for gross participant savings of
over $3 million. Market participants benefitted from the reduction in energy prices as well as from the reliability
assistance provided to the system.
2011 ISO/RTO Metrics Report181
Unconstrained Energy Portion of System Marginal Cost
MISO Annual Average Non-Weighted, Unconstrained
Energy Portion of the System Marginal Cost 2006-2010(1)
$100
$90
$80
$70
$60
$50
$40
$30
$20
$10
$0
20062007200820092010
(1)These values were calculated based on the annual average non-weighted Real-Time marginal energy component of LMP at the
Cinergy Hub. Using the marginal energy component of LMP is consistent with how MISO publishes System Lambda in FERC Form
No. 714.
Pricing in the MISO wholesale markets is heavily influenced by underlying fuel prices. The values in the table above
reflect the fuel price increases experienced from 2006 to 2008 as well as the fuel price decrease in 2009.
2011 ISO/RTO Metrics Report182
Energy Market Price Convergence
MISO Day-Ahead and Real-Time Energy Market Price Convergence 2006-2010
$3.50
$3.00
$2.50
$2.00
$1.50
$1.00
$0.50
$0.00
20062007200820092010
The data in the chart above reflects significant convergence between day-ahead and real-time prices since MISO’s day-ahead and real-time markets started in 2005.
MISO Percentage of Day-Ahead and Real-Time Energy Market Price Convergence
2006-2010
100%
80%
60%
40%
20%
0%
20062007200820092010
2011 ISO/RTO Metrics Report183
Congestion Management
MISO Annual Congestion Costs per Megawatt Hour of Load Served 2006-2010
$10
$8
$6
$4
$2
$0
20062007200820092010
Congestion costs have been declining due to two primary factors, the addition of transmission to relieve congestion in
certain key areas of the MISO footprint and a significant decrease in load within the footprint due to the economic
environment. These factors have resulted in the decreased average congestion costs shown from 2006 to 2010.
In 2010, MISO continued its evaluation of market-based congestion through analyzing the top 44 flowgates which
have been congested more than 1% of the time since market launch. These flowgates were analyzed for trends and potential mitigation. It was determined that, of the top 44 congested flowgates, 34.1% had their congestion eliminated or relieved by transmission solutions proposed through the long-term, reliability based planning process. An
additional 22.7% of the flowgates were analyzed, and solutions were identified through congestion-specific targeted studies (such as the MISO Top Congested Flowgate Study or the Cross Border Congested Flowgate Study) in
MTEP09 and MTEP10. The remaining 29.5% and 13.6% of these congested flowgates were coordinated and MISO flowgates, respectively, that did not have solutions identified. Continuing to address congestion is a critical
component to the maintenance of a low reserve margin. For example, it is estimated by 2020 that congestion will
require an incremental contribution to the reserve margin of 1.5%.
It should be stressed that not all of the proposed mitigation identified in the congestion-specific studies was
implemented. A majority of the mitigation identified did not meet the cost-benefit requirements or voltage standards of MISO or cross border cost allocation methodology. This mitigation was still eligible for construction, if a MISO
stakeholder or market participant deemed it economically feasible to sponsor the mitigation.
When engaging in expansion planning, careful consideration is necessary to identify transmission investments
required to address chronic congestion as opposed to impulsively reacting to acute but short lived congestion. It is
also important to note congestion on a particular flowgate may have only taken place part of the time in the relatively
2011 ISO/RTO Metrics Report184
short five-year span of the market; thus, discretion should be taken before regarding historical congestion information as the sole consideration driving long-term expansion.
MISO Percentage of Congestion Dollars Hedged Through ISO/RTO Congestion Management Markets
100%
80%
60%
40%
20%
0%
20062007200820092010
The relationship between congestion revenues collected by MISO and congestion payments to FTR holders is
correlated with, but not equal to, congestion cost incurred by Load Serving Entities (LSE). FTR value is paid to FTR
holders whether or not the generator source used to serve LSE load matches an FTR source. Under least-cost
regional dispatch, generation from sources other than the FTR source will be utilized when it is cost effective. As a
result, FTR value may exceed congestion costs incurred for a particular FTR source and sink path. In addition, FTR
holders receive revenues to offset congestion costs from sources other than FTRs. Specifically, in addition to FTR
revenues realized from the Day-Ahead market, LSEs receive an allocation of FTR/ARR auction revenue.
2011 ISO/RTO Metrics Report185
Resources
MISO Annual Generator Availability 2006 - 2010
100%
95%
92.35%
90%
85%
80%
20062007200820092010
For MISO, the most significant driver of generation availability is the availability of actual generator performance data.
In previous years leading up to the implementation of MISO’s capacity construct launched beginning June 2009,
MISO received Generator Availability Data System (GADS) data for approximately 70% of the units operating in the
MISO footprint. The balance of the units received a NERC class average. As we began replacing the class average
values with actual GADS data the average Forced Outage Rates (FOR) improved in both their accuracy and
capability for MISO to calculate Unforced Capacity (UCAP) ratings used for Resource Adequacy. MISO believes that
meaningful tracking of the generator availability begins with the June 2009-May 2010 Resource Planning Year for
Resource Adequacy.
MISO’s 2010 Value Proposition quantifies the benefit of improved generator availability using the Equivalent
Availability Factor. MISO’s wholesale power market has resulted in power plant availability improvements of 3.2% delaying the need to construct generation infrastructure. The deferral of generation infrastructure investment represents theoretical savings of $259 million to $323 million in 2010.
2011 ISO/RTO Metrics Report186
Out-of-merit dispatch
The frequency of out-of-merit dispatch within the MISO market is captured by transmission constraint binding hours.
MISO has seen an increase in the number of hours that constraints are bound since 2009. During 2009 there were a
total of 9,745 binding hours while there was 12,187 binding hours in 2010. A summer that included extremely hot
conditions contributed significantly to the increase in binding hours. The tools that MISO uses to manage constraints
allow for more economical and efficient solutions that more directly impact the source of congestion. The use of a
market-based Security Constrained Economic Dispatch (SCED) allows constraints to be managed in the most
economical manner while allowing for maximum use of the transmission system.
Reduction of market constraints / market efficiency analysis
MISO planning looks at historical binding constraints as part of the annual Midwest Transmission Expansion Planning
(MTEP) report. For example, in the MTEP 2010 process, Section 8 (Market Efficiency Analysis) is devoted to
analysis of historical congestion, a top congested flowgate study, and project-specific evaluations to mitigate top
constraints. Refer to the Congestion Management section of this metrics report for additional details or a detailed
report can be found at www.misoenergy.org.
Improving market efficiency
Through collaborative effort via the MISO stakeholder process, MISO is always seeking ways to improve overall
market efficiency. One of the recent initiatives launched on June 1, 2011 is Dispatchable Intermittent Resources
(DIR). Under this new resource designation, renewable energy resources can participate fully in MISO’s economic
dispatch. MISO’s FERC-approved DIR initiative allows renewable generation to be treated like any other generation
resource in the market and, for the first time, participate in the region’s real-time energy market. DIRs are expected to allow improved constraint control, reduced manual resource curtailments, greater market transparency, and improved price signals to intermittent resources.
Demand Response Availability
MISO has not experienced the need to deploy Load Modifying Resources (LMR) in an emergency (such as via
Emergency Operating Procedures [EOP-002]) and thus does not have a record of LMR performance since the
launch of the new Resource Adequacy construct in 2009. Despite this, MISO continues to work with stakeholders
and industry organizations on a number of key areas of Demand Response Availability, such as NAESB to finalize
and put into practice testing, measurement and verification (M&V) standards for Demand Response. All efforts being
developed by MISO and its stakeholders shall take into account any applicable state regulatory, Reliability Entities
(RE), or other non-jurisdictional entities requirements regarding duration, frequency, and notification processes for
the candidate Demand Resources.
MISO Demand Response Future Enhancements
MISO is pursuing many improvements to evolve demand response resource participation in the region. These enhancements include:
2011 ISO/RTO Metrics Report187
Extended Locational Marginal Pricing (E-LMP): The development of a new methodology for determining
energy prices will allow, among other market benefits, demand response resources to be able to set the market price when called upon to reduce demand.
Price Responsive Demand (PRD): MISO is currently working to develop, with stakeholder participation,
appropriate methods to allow for PRD in its real-time energy markets. Already able to participate in the dayahead markets, PRD’s inclusion in real-time markets could significantly impact the amount of other reserves required to reliably operate the system.
Aggregators of Retail Customers (ARC): In a filing before the FERC, MISO has requested the ability to allow
for the aggregation of demand response resources. Internal systems are already in-place for this new service, once the FERC makes its ruling.
―Batch-load‖ demand response: Large-scale industrial processes are sometimes forced to interrupt their use
of electricity for very brief time spans (less than 10 minutes). These industrial processes normally use large amounts of electricity and are able to reduce their use (from normal levels) for several hours at a time, but have been reluctant to register their resources because of measurement and verification (M&V) issues related to the brief interruptions that could significantly impact the calculation of the benefit of such
reduction. MISO is currently investigating the clarification of the M&V that would enable the economically efficient incorporation of these demand response resources.
Demand Response Availability Data System (DADS): MISO is working to incorporate DADS into the formal
reliability processes, similar to the way in which GADS works for generation resources.
Demand Response / Energy Efficiency (DR/EE): MISO is working to analyze and even incorporate DR/EE in
both its enhanced resource adequacy construct and long-term planning process (MTEP). With regard to MTEP, MISO has conducted a major independent study to project DR/EE across the MISO footprint at a detailed and local level.
Phase II NAESB Standards: MISO is working to incorporate the developing Phase II NAESB standards for
demand response M&V into its business practices.
Load Modifying Resources (LMR) deliverability: The deliverability of LMR may have long-term implications
for reserves, as potential LMR providers weigh the benefits and restrictions of providing LMR services to the
wholesale market. MISO is looking to address this issue in its enhanced resource adequacy filing in 2011.
Barriers to Demand Response: MISO continues to seek ways in which to reduce and eliminate barriers to
demand response participation in all of its markets. Barriers to demand response take a variety of forms,
often related to the historical precedence of generation. That is, current wholesale markets are based on the
primacy of generation, with rules and procedures that were designed to fit generation resources. Demand
resources are often required to meet requirements that, were it not for generation, would be less onerous.
Examples include:
o Definitions of contractual relationships between ARCS, LSEs, and EDCs
o Definitions of physical/economic withholding, as it applies to ARCs
2011 ISO/RTO Metrics Report188
o Metering and forecasting standards and requirements
o Energy market issues involving day-ahead and real-time requirements for reserve offers
o Inability of demand response resources (DRR) to control the amount of its offer in energy and
ancillary services markets
o Modeling restrictions related to generation construction schedules
DRR Tool: The efficient use of demand response resources requires a support system that enables
participants and administrators to input, track, and report on those resources. The DRR Tool, developed by
MISO specifically for demand response, provides a state-of-the-art, web-enabled system to accomplish both
basic and advanced tasks including registration, double-counting avoidance, automatic reporting and alert
features, and measurement and verification reports. Initially implemented this year, the DRR Tool was
designed to tackle the more difficult challenges that will be faced when the FERC ultimately rules on ARCs.
DRR Spin Services: Widespread agreement is being reached that the most efficient (and economic) use of
demand response resources lies in the provision of reserve services. MISO has consistently pursued the
goal of allowing DRRs to participate in any and all markets based not on a programmatic approach -
susceptible to prevailing political winds - but rather based on the physical capabilities of the resources.
Market design and existing software capabilities often combine to discourage or prohibit DRRs from
participation in reserve markets despite their physical ability to provide such services. MISO was able to add
spinning reserve service to those available to DRR during 2009, albeit with a 10% cap on the total MW
allowed. And although that 10% value has not been binding to this point, MISO looks forward to relaxing the
cap in the near future.
Compliance with FERC Order 745: MISO is currently working to comply with FERC Order 745. This Order
dictates that when a DRR has the capability to balance supply and demand as an alternative to a generation resource, and when dispatching and paying LMP to that DRR is shown to be cost-effective as determined by the net benefits test, payment by an RTO or ISO of LMP to these resources will result in just and
reasonable rates for ratepayers. The Commission emphasized that these findings reflect a recognition that it is appropriate to require compensation at the LMP for the service provided by DRRs participating in the organized wholesale energy markets only when two conditions are met:
o DRR has the capability to provide the service, i.e., the DRR must be able to displace a generation
resource in a manner that serves the RTO or ISO in balancing supply and demand.
o Payment of LMP for the provision of the service by the DRR must be cost-effective, as determined
by the net benefits test.
2011 ISO/RTO Metrics Report189
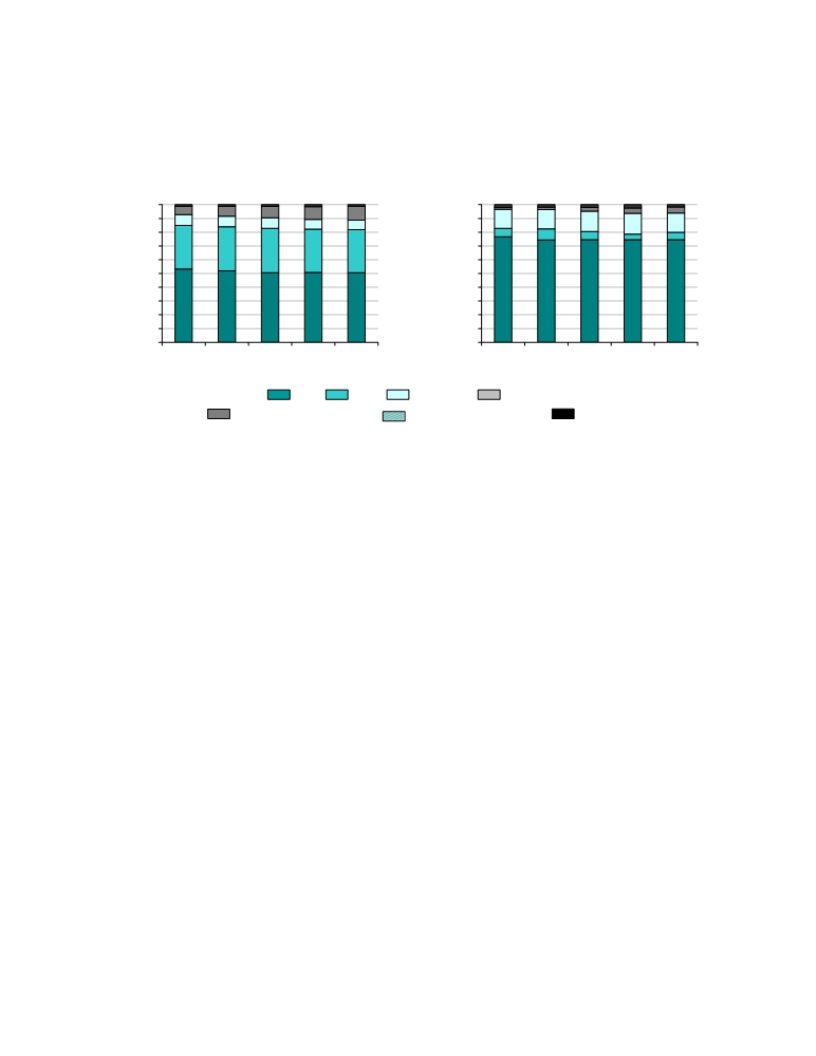
Fuel Diversity
MISO Fuel Diversity 2006-2010(1)
Installed CapacityGeneration Output
100%100%
90%90%
80%80%
70%70%
60%60%
50%50%
40%40%
30%30%
20%20%
10%10%
0%0%
2006200720082009201020062007200820092010
CoalGasNuclearOil
Hydro and RenewablesGas/Oil Combined CycleOther
(1)“Hydro and Renewables” includes pumped storage.
In the MISO region, installed generation capacity is approximately 50% coal, 30% gas, 10% nuclear, 10%
renewables. However, based on production costs in the region, security-constrained economic dispatch actually
results in energy being produced approximately 75% from coal, 15% from nuclear, and 10% from other sources.
Wind production is the fastest growing segment of energy production in the region growing from 0.5% in 2006 to
3.6% in 2010.
2011 ISO/RTO Metrics Report190
Renewable Resources
MISO Renewable Megawatt Hours as a Percentage of Total Energy 2006-2010(1)
20%
15%
10%
5%
0%
20062007200820092010
(1) Renewables exclude hydroelectric capacity.
MISO’s renewable energy produced as a percentage of total energy rose from 0.65% in 2006 to 3.8% in 2010. In
2010, there were 2,117 curtailments of wind that were backed down due to local congestion issues. This included the curtailment of an estimated 824,000 MWh of energy and spanned over 19,951 duration hours.
MISO Hydroelectric Megawatt Hours as a Percentage of Total Energy 2006-2010(1)
20%
15%
10%
5%
0%
20062007200820092010
(1)Hydroelectric energy includes pumped storage.
Hydroelectric’s contribution to total energy remained relatively steady at 1% from 2006 to 2010.
2011 ISO/RTO Metrics Report191
MISO Renewable Megawatts as a Percentage of Total Capacity 2006-2010(1)
20%
15%
10%
5%
0%
20062007200820092010
(1)Renewable capacity excludes hydroelectric capacity.
MISO’s renewable energy capacity as a percentage of total capacity rose from 1.2% in 2006 to 6.2% in 2010. The
average annual capacity factor of those wind units from 2006 to 2010 ranged from a low of 23.6% in 2007 to a high of
31.3% in 2009.
MISO Hydroelectric Megawatts as a Percentage of Total Capacity 2006-2010(1)
20%
15%
10%
5%
0%
20062007200820092010
(1)Hydroelectric capacity includes pumped storage.
Hydroelectric’s contribution to total capacity remained relatively steady at 4%-5% from 2006 to 2010.
2011 ISO/RTO Metrics Report192


C. MISO Organizational Effectiveness
MISO Annual Actual Costs as a Percentage of Budgeted Costs 2006-2010
Non-Capital CostsCapital Recovery Costs
Budget$146$135$124$153$167Budget$103$108$112$99$94
Bars Represent % of Actual Costs to Approved Budgets; Dollar Amounts Represent Approved Budgets (in millions)
The MISO budget and forecasting process is designed as an integrated portion of the overall Corporate Planning Process. Operational planning and forecasting occur simultaneously in coordination with the quarterly business review process. These activities occur quarterly and review prior quarter’s performance against planned activities over the next six quarters.
The plans and forecasts are discussed during the Quarterly Business Review (QBR). The QBRs are one-day senior
management meetings to discuss business results and plans including planned vs. actual operating results,
budget/forecast vs. actual financial performance, and their forward looking six-quarter rolling operation plan and
associated forecast. The expected outcome of each QBR is a corporate plan and forecast that has been discussed
and accepted by senior management. This corporate plan and forecast then guides the company forward.
Quarterly, the six-quarter rolling forecast from the QBR is presented to the Audit and Finance Committee of the
Board. In establishing the budget for each calendar year, the Committee considers the last four quarters of the rolling forecast submitted to them at the August meeting as the preliminary budget for the following year. At the November meeting, the Committee will consider next calendar year’s portion of the six-quarter rolling forecast as management’s recommendation for budget for the following year and consider that budget for approval. The Board of Directors also reviews budget and forecast variances at each board meeting.
Stakeholder involvement is also a part of the budget and planning process. Stakeholder input is sought on the
strategic plan as well as the annual budget. The Finance Subcommittee of the Advisory Committee (FSC) reviews
and provides comments to the Advisory Committee. Review of the budget with the FSC begins in August and
periodic meetings are held until the FSC provides its report to the Advisory Committee and the Board of Directors.
2011 ISO/RTO Metrics Report193
The Board of Directors reviews the preliminary budget again in November and provides its feedback. The final budget gets voted on during the December board meeting.
Base operating costs, net of miscellaneous income, for MISO were under budget from 2006 to 2007 as a result of two primary drivers. In each year, MISO was consistently below budget on headcount related costs (salaries and benefits) and computer maintenance driven from the start up nature of the organization. Over the same time period, MISO was over budget on miscellaneous revenue, which is used to offset Operating Costs.
MISO’s capital investment expenses associated with financing and recovery of capital costs include interest expense,
as well as depreciation and amortization expense. The variances within capital investment expenses relative to
budget from 2006 to 2009 are a function of interest expense. The increase in interest expense relative to budget in
2006 and 2007 is directly related to the amount of collateral held pursuant to the Credit Policy in the Tariff following
the start of market operations in April 2005. The dollar volume of transactions subject to the credit policy
requirements increased from approximately $100 million per year prior to energy market operations to over $40
billion per year post-market start. The increase in dollar volume settled led to an increase in cash collateral required
from Transmission Customers. While the budget anticipated most of the impact of the energy market start, it did not
anticipate the entire impact. The decline in interest expense, relative to budget, in 2008, 2009 and 2010 is partially
related to changes in market rules that accelerated the payment of market charges as well as the significant
decrease in interest earned on funds held as collateral. A small adjustment of no more than $1.4 million was made to
the budgeted capital recovery costs for the years 2006 to 2009 to exclude capitalized interest that was inadvertently
included in the 2010 ISO/RTO Metrics Report.
2011 ISO/RTO Metrics Report194
MISO Annual Administrative Charges per Megawatt Hour of Load Served 2006-2010
($/megawatt-hour)
$1.10
$1.00
$0.90
$0.80
$0.70
$0.60
$0.50
$0.40
$0.30
$0.20
$0.10
$0.00
200620072008
$0.38
20092010
The administrative costs per MWhr of load served data in the chart above should be reviewed in the context of the widely-varying levels of annual load served by each ISO/RTO as noted in the table below.
ISO/RTO
MISO
2010 Annual Load Served
(in terawatt hours)
563
Prospectively, MISO forecasts its annual administration rates will approximate $0.390, $0.368, and $0.374 per MWh
of load in 2012, 2013, and 2014, respectively. These administration rates reflect the ending of amortization of startup
costs associated with the energy market. In addition, load reductions due to demand response have an immaterial
effect on annual administration rates. The projected cost per MWh varies with the amount of load served.
2011 ISO/RTO Metrics Report195
Customer Satisfaction
MISO Percentage of Satisfied Members 2006-2010
100%
80%
72%
60%
40%
20%
0%
20062007200820092010
MISO’s current survey asks 116 questions on a wide variety of subjects ranging from transmission planning to market
operations to control room operations. An average score from a subset of that question set, covering key business
areas, is used to determine the MISO’s overall customer satisfaction rating. The metric shown above reflects a
percentage of respondents’ answers that rated 5 or better on a 7 point scale. The respondents to the survey include
transmission owners, market participants, regulators, and other MISO stakeholders. The survey is administered by
an independent firm.
MISO utilizes the results of its Annual Customer Survey to enhance products and services, and respond to key customer themes that are identified within the survey’s results.
Business area representatives have addressed our stakeholders in robust discussions surrounding MISO processes, procedures, and constraints related to the Annual Customer Survey results. Additionally, enhancements to internal practices have resulted from the feedback received via the Annual Customer Survey mechanism.
2011 ISO/RTO Metrics Report196
Billing Controls
ISO/RTO20062007200820092010
Qualification for
Unqualified SASOne ControlUnqualified SAS 70Unqualified SASUnqualified SAS
MISO70 Type 2 AuditObjective inType 2 Audit70 Type 2 Audit70 Type 2 Audit
OpinionSAS 70 Type 2OpinionOpinionOpinion
Audit
In 2007, two control objectives were qualified, one related to transmission settlement charges for curtailment of transactions and one related to the process for managing changes to information systems.
MISO focuses on the accuracy of both prices posted and amounts billed to ensure members can rely on prices for transacting and have confidence in the amounts included in their MISO invoices.
From 2006 to 2010, MISO had four Market Implementation Errors (MIE). The average dollar impact of these
MIEs was $345.
For 2010, MISO made seven adjustments because of settlement errors. The total net amount adjusted for
2010 was $5,002,043. The largest adjustment of $5,023,383 related to an amount paid to PJM as a result of
a modeling problem on PJM’s system that caused an initial market-to-market settlement with a flowgate that
was not being constrained. Without this adjustment, the total net amount adjusted for 2010 would have been
-$21,340.
2011 ISO/RTO Metrics Report197
D. MISO Specific Initiatives
As MISO views its contributions to the region, our commitment to operational excellence is evidenced by its
continued effort to develop and refine our own Value Proposition metrics. MISO has collaborated with its
stakeholders since implementing its energy market in 2005 to create and enhance this meaningful and effective set of tools to measure the value that MISO provides. The Value Proposition metrics, which are available to the public on MISO’s website, are updated regularly to provide feedback on the effectiveness of MISO operations.
The Value Proposition breaks MISO’s business model into certain recognized categories of benefits to the footprint as a whole and calculates a range of dollar values for each defined category. The benefits studied are: reliability, energy dispatch, unloaded capacity, regulation, spinning reserves, wind integration, diversity of resources in the footprint, generator availability, and two categories of demand response (dynamic pricing and interruptibles). Our 2010 Value Proposition shows realized annual benefits between $650 million to $875 million in annual net economic benefits to our region. These benefits are illustrated and described below:
Benefit by Value Driver
(in $ millions)
$68-$75
$121-$134 $136-$151
$221-$244
$322-$482
12345
Market - Commitment and Dispatch
2011 ISO/RTO Metrics Report
$54-$68($254)
$259-$323$12-$19
$1,253-
$1,634
$280-$350
$34-$42
$648-$874
Benefits Driven by Load / Supply Balance
67891011
GenerationDemand
Investment DeferralResponse
198
Quantitative Benefits
1. Improved Reliability: $322 million to $482 million in annual benefits
MISO’s broad regional view and state-of-the-art reliability tool set enables improved reliability for the region as measured by transmission system availability.
2. Dispatch of Energy: $221 million to $244 million
MISO’s real-time and day-ahead energy markets use security constrained unit commitment and centralized
economic dispatch to optimize the use of all resources within the region based on bids and offers by market
participants.
3. Unloaded Capacity: $136 million to $151 million
With the start of the Ancillary Services Market and the functional consolidation of the region’s Balancing
Authorities, responsibility to respond to operating issues was consolidated in MISO eliminating the need for multiple Balancing Authorities to hold unloaded capacity.
4. Regulation: $121 million to $134 million
With the start of the MISO Regulation Market, the amount of regulation required within the MISO footprint has dropped significantly. This is the outcome of the region moving to a centralized common footprint regulation target rather than a number of non-coordinated regulation targets within the footprint.
5. Spinning Reserves: $68 million to $75 million
Starting with the formation of the Contingency Reserve Sharing Group and continuing with the implementation of the Spinning Reserves Market, the total spinning reserve requirement has been reduced freeing low-cost
capacity to meet energy requirements.
6. Wind Integration: $34 million to $42 million
MISO’s regional planning enables more economic placement of wind resources in the region. The economic placement of wind resources defers new capacity construction.
7. Footprint Diversity: $280 million to $350 million
MISO’s large footprint increases the load diversity factor allowing for a decrease in regional planning reserve margins from 15.40% to 11.94%. This decrease delays the need to construct new capacity.
8. Generator Availability Improvement: $259 million to $323 million
MISO’s wholesale power market has resulted in power plant availability improvements of 3.2% delaying the need to construct new capacity.
2011 ISO/RTO Metrics Report199
9. Dynamic Pricing: $12 million to $19 million
MISO enables dynamic pricing which provides customers with a rate signal that reflects the higher cost of providing electricity during peak times than off-peak times. Dynamic pricing allows additional generation investment deferral.
10. Direct Load Control and Interruptibles: $54 million to $68 million
MISO enables direct load control and interruptible contracts which provide load serving entities the ability to curtail load. This allows the load serving entities to defer generation investment by lowering demand.
11. MISO Cost Structure: $254 million in annual costs
Administrative costs are expected to remain relatively flat into the future and represent a small percentage of the
benefits.
Qualitative Benefits
In addition to the quantitative benefits, MISO also demonstrates significant qualitative benefits that wholesale market participants derive from the operation of MISO, including:
1. Price/Informational Transparency
2. Planning Coordination
3. Seams Management
4. Regulatory Compliance
2011 ISO/RTO Metrics Report200
New York Independent System
Operator (NYISO)
2011 ISO/RTO Metrics Report201
Section 5 - NYISO Performance Metrics and Other Information
The New York Independent System Operator (―NYISO‖) is a not-for-profit corporation responsible for operating the state’s bulk electricity grid, administering New York’s competitive wholesale electricity markets, conducting
comprehensive long-term planning for the state’s electric power system, and advancing the technological
infrastructure of the electric system serving the Empire State.
The creation of the NYISO was authorized by the Federal Energy Regulatory Commission (―FERC‖) in 1998. In
November 1999, New York State’s competitive wholesale electricity markets were opened to utility and non-utility
suppliers and consumers as the NYISO began its management of the bulk electricity grid. The formal transfer of the
grid operation responsibilities from the New York Power Pool to the NYISO took place on December 1, 1999.
The NYISO monitors a network of 10,877 miles of high-voltage transmission lines and serves approximately 425 market participants. Through the end of 2010, NYISO market transactions totaled more than $82 billion.
In 2010, installed capacity in the NYISO control area totaled 37,416 megawatts (MW). The NYISO’s record peak load of 33,939 MW was recorded in August 2006.
The NYISO is governed by an independent Board of Directors and a committee structure comprised of a diverse
array of stakeholder representatives. The members of the NYISO’s 10-member Board of Directors have backgrounds
in electricity systems, finance, academia, information technology, communications, and public service. The members
of the Board, as well as all employees, have no business, financial, operating, or other direct relationship to any
market participant or stakeholder. NYISO stakeholder committees are comprised of representatives of market sectors
that include transmission owners, generation owners, other suppliers, end-use consumers, public power, and
environmental parties.
The value of shared governance was noted by FERC in a January 2008 order that stated, ―The Commission commends NYISO & the stakeholders for working together to resolve many issues …‖
The mission of the New York Independent System Operator, in collaboration with its stakeholders, is to serve the public interest and provide benefit to consumers by:
Maintaining and enhancing regional reliability;
Operating open, fair and competitive wholesale electricity markets; Planning the power system for the future; and
Providing factual information to policy makers, stakeholders and investors in the power system.
2011 ISO/RTO Metrics Report202


A. NYISO Bulk Power System Reliability
The table below identifies which NERC Functional Model registrations the NYISO has submitted effective as of the end of 2010. In addition, the Regional Reliability Organization (RRO) for the NYISO is noted at the end of the table with a web site link to the specific reliability standards.
The NYISO has had no self-reported or audit-identified violations of NERC or applicable RRO operating
reserve standards.
The NYISO has not shed any load in the New York Control Area (―NYCA‖) due to a standards violation. .
NERC Functional Model RegistrationNYISO
Balancing Authority
Interchange Authority
Planning Authority
Reliability Coordinator
Resource Planner
Transmission Operator
Transmission Planner
Transmission Service Provider
Regional EntityNPCC
Standards that have been approved by the NERC Board of Trustees are available at:
http://www.nerc.com/page.php?cid=2|20
Additional standards approved by the NPCC Board are available at:
http://www.npcc.org/regStandards/Approved.aspx
In addition, section 215 of the Federal Power Act, as amended by the Energy Policy Act of 2005, authorizes the State of New York to ―establish rules that result in greater reliability within that state as long as such action does not result in lesser reliability outside the state.‖ The New York State Reliability Council, L.L.C ("NYSRC"), promotes and
preserves the reliability of electric service on the New York power system by developing, maintaining, and updating the Reliability Rules specific to the New York State power system that are more stringent or more specific than the rules of the NERC and the NPCC. Those rules, which are adopted by the New York State Public Service
Commission as state rules, are complied with by the NYISO and all entities engaging in electric transmission,
ancillary services, energy and power transactions on the New York power system.
The New York State Reliability Council and the Reliability Rules they administer are available at:
http://www.nysrc.org/
2011 ISO/RTO Metrics Report203
Dispatch Operations
In addition to the on-going review of control performance by NYISO System Operations, a daily review of
performance occurs by NYISO Operations staff each business day. The NYISO incorporates Control Performance Standards (CPS) compliance in its analysis and establishment of regulation requirements, which are specified by
season and hour. The NYISO recently updated regulation requirements for the New York Control Area to reflect
findings of the NYISO’s 2010 Wind Study, which analyzed the net variability of load and wind. Regulation is co-
optimized along with energy and reserves within the NYISO's Day-Ahead and Real-Time markets, allowing the most efficient resources to provide the regulation needed to maintain Control Performance. The NYISO's current regulation requirements can be found at the following location:
http://www.nyiso.com/public/webdocs/market_data/reports_info/nyiso_regulation_req.pdf
NYISO CPS-1 Compliance 2006-2010
200%
180%
160%
140%
120%
100%
80%
20062007200820092010
Compliance with CPS-1 requires at least 100 percent throughout a 12-month period. The NYISO was in compliance
with CPS-1 for each of the calendar years from 2006 through 2010.
2011 ISO/RTO Metrics Report204
NYISO CPS-2 Compliance 2006-2010
100%
95%
90%
85%
80%
20062007200820092010
Compliance with CPS-2 requires 90 percent for each month in a 12-month period. The NYISO was in compliance with CPS-2 from 2006 through 2010.
NYISO Transmission Load Relief or Unscheduled Flow Relief Events 2006-2010
2,000
1,500
1,000
500
0
20062007200820092010
* NYISO did not initiate TLR requests prior to 2009
Prior to March 2009, NYISO did not request Transmission Load Relief (TLR) curtailments and addressed all New
York transmission constraints through internal New York generation redispatch, regardless of whether the
transmission constraints were aggravated by unscheduled loop flows. Since March 2009, in order to address the high levels of clockwise Lake Erie loop flows that significantly impacted New York transmission reliability constraints, the NYISO began to request TLR curtailments. All TLR curtailments requested by NYISO, as reported in the graph
above, were Level 3 TLR curtailments.
2011 ISO/RTO Metrics Report205
Future NYISO Enhancements:
The NYISO would prefer to use market mechanisms rather than requesting TLR curtailments to address the impact of unscheduled loop flows on New York transmission constraints. In order to improve coordination of interregional power transactions, the NYISO, in conjunction with grid operators serving the Mid-Atlantic, Midwest, and New
England regions of the United States and the Canadian province of Ontario, proposed a Broader Regional Markets plan, which is discussed in the ―Unscheduled Flows‖ section of this report. In particular, the initiatives on market-to-
market coordination are aimed at reducing the need for requesting TLR curtailments.
NYISO Energy Management System Availability 2006-2010
100%
95%
90%
85%
80%
20062007200820092010
Availability of the Energy Management System (―EMS‖) is an important factor that enables reliable monitoring of the electric transmission system in the NYCA. Given that a State Estimator solution is required for the EMS applications, the NYISO availability statistics are based on the number of solved State Estimator (―SE‖) cases as compared to the total number of SE runs. For the past five years, NYISO’s EMS has shown excellent performance and has been available more than 99 percent of all hours in each year.
2011 ISO/RTO Metrics Report206
Load Forecast Accuracy
The NYISO's load forecasting model is a unified system that uses a series of equations, drivers, and historical
information specific to each of the eleven LBMP zones in New York. It uses a combination of Advanced Neural
Network ("ANN") and regression models to generate its forecasts. The ANN analysis takes a non-linear approach to
the estimation of the model's parameters. The regression models are linear models estimated using ordinary least
squares.
The load forecasting model uses historical load and weather data information for each of the NYISO's eleven zones
to develop zonal load forecast models. These models are then used together with zonal weather forecasts to develop
an independent load forecast for each zone. The zonal forecasts are summed to produce a forecast for the NYCA as
a whole. The model develops the hourly load forecasts for the current day and the next six days, a total of up to 168
hours. The NYISO reviews and re-estimates its day-ahead forecasting models prior to June of each year to keep
them up to date.
The load forecasting model uses proprietary weather data and forecasts from the NYISO's weather information
vendor. The hourly weather data provided by the vendor include dry bulb temperature, wind speed, cloud cover, dew
point, and wet bulb temperature. The data from the stations is aggregated in a manner that best represents each
zone.
The day-ahead load-forecasting model does not currently incorporate economic assumptions or economic forecast data since these variables are virtually constant from one day to the next.
Load Forecasting Accuracy
ISO/RTOReference Point
NYISO5:00 a.m. prior day
2011 ISO/RTO Metrics Report207
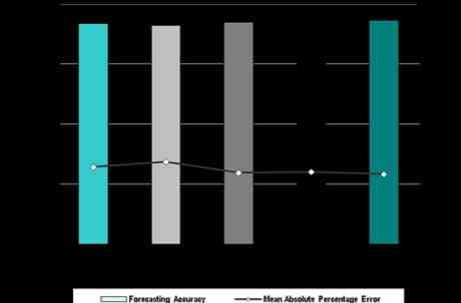
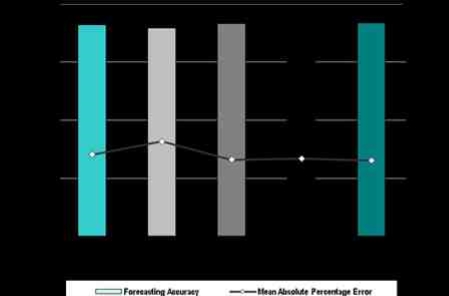
NYISO Average Load Forecasting Accuracy 2006-2010
NYISO Peak Load Forecasting Accuracy 2006-2010
2011 ISO/RTO Metrics Report208

NYISO Valley Load Forecasting Accuracy 2006-2010
The three charts above show the percentage accuracy and the Mean Absolute Percentage Error (―MAPE‖) of NYISO load forecasting for average daily load, peak load, and valley load from 2006 to 2010. The decrease in the MAPE
indicates an increase in accuracy, since the error has been reduced. The NYISO's unified load forecasting approach is applied to each of the LBMP zones in the New York Control Area. Continuous forecasting system process
improvements have increased forecasting accuracy and a commensurate decrease in the MAPE. The high level of
accuracy contributes to efficient operation of the bulk power system and wholesale electricity markets, which
provides economic benefit to consumers.
The FERC has requested that Day-Ahead forecast accuracy reflect the impact of demand response. The exclusion of the impact of demand response on the metric is negligible because during the 2006-2010 period, the NYISO
activated its demand response program on only a small number of days to address system operating conditions that occurred during some peak demand periods.
2011 ISO/RTO Metrics Report209
Wind Forecasting Accuracy
NYISO Day-Ahead Average Wind Forecasting Accuracy 2006-2010
100%
95%
90%
85%
80%
20062007200820092010
In mid-2008, the NYISO instituted one of the first state-of-the-art wind forecasting systems in the United States that incorporates wind power forecasts into Day-Ahead and Real-Time Market tools to improve commitment and
scheduling of resources. The centralized system enables the NYISO to better utilize and accommodate wind energy by forecasting the availability and timing of wind-powered generation. The real-time forecasts are updated every 15-
minutes and integrated into the NYISO’s real-time Security Constrained Dispatch. Day-Ahead forecasts are updated twice daily and are integrated into the Day-Ahead Market during the reliability evaluation. In 2009, the NYISO
became the first grid operator to dispatch wind power fully balancing the reliability requirements of the power system with the use of the least costly power available via an economic dispatch.
The Mean Absolute Error (MAE) on a Day-Ahead basis was approximately 12% for the second half of 2008, 8% in
2009 and 9% in 2010 (the values presented in the graph above are 1-MAE, which represents the statistic in terms of
accuracy rather than error). The improvement in accuracy from 2008 to 2009 is associated with having a more robust
data set available to train and improve the forecast models. The day-ahead wind forecast statistics are based on the
forecast updated at 4AM the day prior to the operating day and are used in the Day-Ahead Market evaluation. The
MAE in real-time on an hour-ahead basis was approximately 5% in 2008, 4% in 2009 and 4% in 2010.
The NYISO develops forecasts for variable energy resources when there is an operational need for the information. Due to the limited amount of non-wind variable energy resources, the NYISO does not currently require forecast data for these resources.
2011 ISO/RTO Metrics Report210
Unscheduled Flows
NYISO Absolute Value of Total Unscheduled Flows 2006-2010 (terawatt hours)
120
100
80
60
40
20
0
20062007200820092010
* Data not available prior to 2007
For context, the table below notes the number of NYISO’s external interfaces. The NYISO has free flowing interfaces
with PJM, Ontario, and ISO-NE and six other interfaces that are controllable lines. Unscheduled flows vary in both
magnitude and direction and occur primarily on the Ontario and PJM interfaces. These two interfaces reflect the
same flows (the numerical conventions are such that a negative flow on the PJM interface corresponds to a positive
flow on the Ontario flow).
ISO/RTONumber of External Interfaces
NYISO9
2011 ISO/RTO Metrics Report211
NYISO Absolute Value of Unscheduled Flows as a Percentage
of Total Flows 2006-2010
45%
40%
35%
30%
25%
20%
15%
10%
5%
0%
* Data not available prior to 2007
NYISO Unscheduled Flows
by Interface
Ontario Independent Electricity System Operator (1)
PJM (1)
ISO-NE (1)
(1) Data unavailable prior to 2007
20062007200820092010
(in terawatt hours)
20062007200820092010
--3.34.73.83.2
--3.24.83.93.4
--0001.1
The NYISO experiences a larger percentage of unscheduled flows than some of its neighboring control areas due to
the direct impact from Lake Erie loop flows, as well as the lower volume of total scheduled flows and limited number
of interfaces. Lake Erie loop flow is currently an uncontrolled, unscheduled quantity that directly impacts two of the
NYISO interfaces, with flows impacts observed on both the IESO and PJM interfaces. Due to the limited number of
other interfaces and the smaller volume of power trading that can be managed on these interfaces, the impact from
these unscheduled flows represents a significant portion of the total flows scheduled. The chart above shows that, at
times, unscheduled flows account for a large proportion of flows over the collective interfaces. As discussed below,
the NYISO is pursuing with all of its neighboring market areas the Broader Regional Markets initiatives, in part to
address the impact produced by the Lake Erie Loop Flow unscheduled impacts and to remove barriers to more efficient interregional trading to improve the volume of trading.
2011 ISO/RTO Metrics Report212
Future NYISO Enhancements:
Collaborating extensively with IESO, MISO, PJM, and ISO-NE, the NYISO proposed the Broader Regional Markets
plan to the FERC in January 2010. In a July 15, 2010 Order, the FERC conditionally approved the proposal, saying,
―…these planned regional initiatives will be designed to reduce uplift costs and lower total system operating costs…‖
A September 2010 analysis of the benefits of various components of the Broader Regional Markets plan conducted
by Potomac Economics estimates regional annual production cost savings of approximately $362 million, on a fuel-
adjusted basis. The coordination of flows around Lake Erie is expected to result in an estimated $53 million in annual
savings to the region.
The Broader Regional Market proposals include both market based and physical solutions. The market solutions
include:
Inter-regional transaction coordination, which would lower total system operating costs as transaction schedules
more quickly adjust to market-to-market pricing patterns. Implementation of inter-regional transaction
coordination with Hydro Quebec (HQ) began in July 2011 and will continue with other neighboring areas in
subsequent years.
Interface pricing revisions, which would improve the pricing at the points at which energy moves between
individual grid operators to allow for more efficient regional power transfers. Implementation of interface pricing revisions is planned for the end of 2011.
Market-to-market coordination, which would increase the level of collaboration in congestion management
between system operators in the region. Implementation of market-to-market coordination is planned for the end
of 2012.
Buy-through of congestion, which would require that the congestion cost of a transaction be charged based on
the physical flow of power, unlike the current settlement determination that is based only on the contract path.
FERC ordered the deferral of the implementation of the buy-through of congestion until the other Broader
Regional Markets measures are implemented.
In addition, the proposal includes the development of a parallel flow visualization tool designed to enhance the exchange of transmission system information and to assemble the necessary real-time data to perform the generation-to-load calculations, facilitate the calculation of impacts, and make available common and consistent information regarding the sources of power flows and their impacts to all regions.
2011 ISO/RTO Metrics Report213
Transmission Outage Coordination
The NYISO coordinates all requests for transmission outages based on their potential impact on system reliability and is not aware of any unexpected generator availability impacts or declared emergencies associated with
uncoordinated transmission outages.
NYISO Percentage of > 200kV planned outages of 5 days or more that are submitted to ISO/RTO
at least 1 month prior to the outage commencement date 2006 - 2010
100%
80%
60%
40%
20%
0%
20062007200820092010
* Data unavailable prior to 2009
NYISO data for the metric, ―Percentage of > 200 kV planned outages of 5 days or more that are submitted to
ISO/RTO at least 1 month prior to the outage commencement date,‖ draw on outage data that includes inter-control area tie lines and internal NYCA lines and transformers greater than 200 kV.
The NYISO requires that Transmission Owners submit outage requests for facilities expected to impact system
transfer capability of the NYISO secured system "no later than 30 days prior to first of the operative TCC month," with
a few exceptions allowed to address reliability needs or outages with limited impact. This requirement results in
advanced notification of at least one month prior to outage commencement for 91 percent of transmission outages in
2010. Data are not available prior to 2009 due to the format of historic records. In 2009, the NYISO integrated a new
outage scheduler application to enable more efficient reporting of outage statistics on a going-forward basis.
The metric, ―Percentage of planned outages studied in the respective ISO/RTO Tariff/Manual established
timeframes,‖ is not applicable to NYISO. The NYISO does not have established timeframes to study planned outages in its Services Tariff. All outages are included as part of the Day-Ahead Market evaluation for consideration prior to
the operating day.
2011 ISO/RTO Metrics Report214
NYISO Percentage of > 200 kV outages cancelled by ISO/RTO after having been previously
approved 2006 - 2010
2.50%
2.00%
1.50%
1.00%
0.50%
0.00%
20062007200820092010
* Data unavailable prior to 2009
NYISO data for the metric, ―Percentage of > 200 kV outages cancelled by ISO/RTO after having been previously
approved,‖ demonstrates that less than one percent of outages were cancelled in 2010. Data are not available prior to 2009 due to the format of historic records. In 2009, the NYISO integrated a new outage scheduler application to enable more efficient reporting of outage statistics on a going-forward basis.
NYISO Percentage of unplanned > 200kV outages 2006-2010
30%
25%
20%
15%
10%
5%
0%
20062007200820092010
* Data unavailable prior to 2009
2011 ISO/RTO Metrics Report215
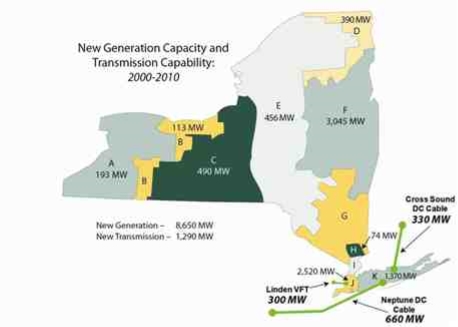
In order to be considered planned by the NYISO, outages must be submitted and verified in advance of the Day-
Ahead Market evaluation. The NYISO classifies outages with less than two days notice as unplanned. As a result,
the NYISO statistics for "Percentage of unplanned > 200kV outages" may appear higher compared to other areas.
The NYISO data are also based on the following criteria: unplanned outages of at least one hour duration including
inter-control area tie lines, internal New York Control Area lines, and transformers > 200kV. NYISO data for the
metric, ―Percentage of unplanned > 200kV outages,‖ are not available prior to 2009. In 2009, the NYISO integrated a
new outage scheduler application to enable more efficient reporting of outage statistics on a going-forward basis
Transmission Planning
Markets and Investment Enhance Reliability
The NYISO’s market-based approach to the transmission planning process is significantly different from other
regions’ transmission planning processes. The NYISO process looks first to market-based solutions to meet identified reliability needs, but should they fail to materialize on a timely basis, the NYISO may direct the responsible
Transmission Owners to seek regulatory approval and build the reliability backstop solution(s). All types of resources are eligible for participation in meeting a reliability need, whether to provide a market based or regulatory solution, including demand response, generation and transmission.
Through this market-based approach, New York has attracted significant private and public investment in
transmission and generation. This approach serves to protect consumers when investors - rather than rate-paying consumers - assume the financial risk for merchant projects.
Since 2000, over 8,600 MW of new generation has been built by public power authorities and private developers,
with 80 percent of that capacity sited in the southeastern region of the state where electricity demand is greatest.
This pattern of development has mitigated the need for transmission solutions to the reliability needs of the New York electric system.
Nearly 1,300 MW of new
interstate transmission
capability has been added
to meet the needs of the
metropolitan New York
region. These additions are
the Cross Sound Cable, an
HVDC line from Long Island
to Connecticut (2005), the
Neptune Cable between
Long Island and New
Jersey (2007), and the
Linden Variable Frequency
Transformer project
2011 ISO/RTO Metrics Report216
connecting PJM and New York City (2009). Several other intrastate transmission projects either have come in to
service or are in the construction phase. Such additions enhance the reliability of New York’s bulk power system and mitigate reliability needs.
NYISO Comprehensive System Planning Process
The NYISO’s Comprehensive System Planning Process (CSPP) is an ongoing market-based process that evaluates resource adequacy and transmission system security of the state’s bulk electricity grid over a 10-year period and
evaluates solutions to meet reliability and congestion relief needs. The CSPP contains three major components -
local transmission planning, reliability planning, and economic planning. Each two-year planning cycle begins with the local transmission plans of the New York transmission owners, followed by NYISO’s Reliability Needs Assessment (RNA) and Comprehensive Reliability Plan (CRP). Finally, economic planning is conducted through the Congestion Analysis and Resource Integration Study (CARIS).
Reliability Studies
Consistent with Order 890, the NYISO’s Comprehensive System Planning Process (CSPP) begins with the
Transmission Owner’s Local Transmission Plans (LTP). Upon review and discussion of these plans through the
NYISO stakeholder process the LTP’s are included in the base case of the Reliability Needs Assessment (RNA). The RNA evaluates the future reliability of the New York bulk power system through a ten-year planning horizon. In this step, the NYISO, in conjunction with Market Participants, evaluates the adequacy (Loss of Load Expectation (LOLE)) and security (unanticipated loss of system elements or contingencies) throughout the entire bulk power system
against mandatory national standards, regional reliability standards, and additional standards specific to New York State to identify any reliability needs, or potential reliability needs, over the planning period and issues its findings in a report that is approved by the NYISO Board of Directors.
This assessment serves many purposes, including but not limited to:
Supporting the efficient and reliable operation of the New York bulk power system;
Evaluating the reliability needs of the local and system-wide resource adequacy, and transmission security
and transfer capability; and
Identifying the location and nature of any potential factors and/or issues that could adversely impact system
reliability throughout the ten year planning horizons.
The second step is the creation of the CRP that consists of proposed solutions to address the needs identified in the
RNA, if any. Generation, transmission, and demand side programs are considered on a comparable basis as
potential reliability solutions. A request for solutions to identified reliability needs is issued with the expectation that
Market-Based Solutions will come forward to meet the identified needs. In the event that Market-Based Solutions are
not sufficient, the process provides for the identification of Regulated Backstop Solutions proposed by designated
transmission owners, and Alternative Regulated Solutions proposed by any market participant. The NYISO then
evaluates all proposed solutions to determine whether they will meet the identified reliability needs. From this
2011 ISO/RTO Metrics Report217
evaluation the CRP is developed, setting forth the plans and schedules that are expected to be implemented to meet the reliability needs.
The objective of this comprehensive approach is to:
Provide a process whereby solutions to identified needs are proposed, evaluated, and enacted in a timely
manner to maintain the reliability of the system;
Provide for the development of market-based solutions, regulated backstop solutions, and alternative
regulated solutions the opportunity to respond to NYISO’s reliability needs signals; and
Coordinate the NYISO’s reliability assessments with neighboring ISO/RTOs.
The 2010 RNA and CRP did not identify reliability needs on the New York bulk power system from 2011 through
2020. Accordingly, no market based or regulatory backstop solutions were solicited by the NYISO. Scenario
evaluations indicated that reliability needs could arise during this period if unexpected generation plant retirements
were to occur.
NYISO Economic Studies
The 2009 CRP was the starting point for a new economic planning process called the Congestion Assessment and
Resource Integration Study (CARIS). The CARIS evaluates transmission constraints and potential economic
solutions to the congestion identified. Generation, transmission, and demand side programs are considered on a
comparable basis as potential economic solutions for alleviating the identified congestion. The CARIS is a biennial
two-step process, (1) the study phase; and (2) the project phase. The first CARIS study phase was concluded in
early 2010. One developer responded with a request for the NYISO to evaluate its proposed congestion relief project. The next CARIS study cycle is underway.
NYISO Integration of Innovative Technologies
The NYISO has moved to take advantage of advanced grid-scale energy storage facilities with new market rules and
associated software and control systems. In May 2009, the FERC approved tariff revisions making the NYISO the
first grid operator in the nation to establish provisions for limited energy storage resources (LESRs) to provide
regulation services in the NYISO market. LESRs include technologies such as flywheels and advanced battery
systems that store electricity, but are limited in the amount of time they can sustain electric output. A 20 MW flywheel
system and a 20 MW advanced battery system began testing in late 2010 and became operational in early 2011.
Another 20 MW flywheel project is in the NYISO interconnection queue, along with two battery projects totaling 40
MW.
2011 ISO/RTO Metrics Report218
NYISO Number of Transmission Projects Approved to be Constructed for Reliability Purposes 2006-2010
5 50
5 00
4 50
4 00
3 50
3 00
2 50
2 00
1 50
1 00
50
0
20062007200820092 010
The transmission projects in this chart include projects developed by New York Transmission Owners through their
local transmission planning processes, these projects have been included in NYISO’s reliability planning base cases.
The NYISO reliability planning process, discussed above, did not evaluate any transmission projects as no
transmission project was submitted to meet reliability needs identified in the 2005 Reliability Needs Assessment
(RNA). In 2007, three transmission projects were identified as viable to meet an identified reliability need, and
another project was also identified in 2008. In 2009 and 2010, there were no reliability needs identified due to a lower
load forecast, an increase in available resources and the expansion of energy efficiency programs in the state.
NYISO Percentage of Approved Construction Projects Completed by December 31, 2010
1 00%
80%
60%
40%
20%
0%
2 0062007200820092010
* Data for completed construction projects approved in 2010 is not yet available.
2011 ISO/RTO Metrics Report219
For the period 2006-2010, a significant number of transmission projects that were approved have been constructed. The majority of them have been built in response to economic opportunities identified through market signals, and
serve to essentially negate the need for ―reliability‖ transmission projects. One transmission project built in 2009 had previously been identified as a viable reliability solution by the NYISO CSPP. This was the 300 MW Linden Variable Frequency Transformer project, identified in the 2007 Comprehensive Reliability Plan (CRP). Recently, Hudson
Transmission Partners (HTP) received approvals to proceed with construction of a 660 MW HVDC cable between
Bayonne, New Jersey and Manhattan.
Future NYISO Enhancements:
Maintaining the integrity of New York’s high-voltage transmission network is a primary focus of efforts to sustain and enhance overall power grid reliability. New and upgraded high-voltage transmission facilities are expected to be needed to strengthen the state’s bulk power grid and facilitate the integration of more renewable resources. Future enhancements are focused on easing transmission system bottlenecks, permitting wider access to lower-cost
wholesale electricity while reducing the overall cost of power.
The New York TOs have initiated a State Transmission Assessment and Reliability Study (―STARS‖) project that is designed to assess the condition of the state’s electric transmission infrastructure and identify needed improvements to sustain a robust and reliable electric supply system for the future. The objectives of the STARS study are a
valuable complement to the NYISO long-term planning process.
It is important to note that several previously proposed transmission projects have met with strong opposition based on environmental, health, aesthetic, and community concerns. The NYISO is actively participating in collaborative planning efforts among New York stakeholders to explore innovative solutions, such as replacing older, low capacity transmission lines with new higher capacity lines within existing rights-of-way.
Generation Interconnection
Overview
Since 2000, over 8,600 megawatts (MW) of new generation have been built by public and private suppliers, with 80
percent sited in New York City, on Long Island and in the Hudson Valley, the regions where demand is greatest. In
addition, 1,290 MW of transmission capability have been added to bring power to the downstate region from out of
state.
The NYISO’s role in the interrconnection process is that of process administrator, project and system evaluator, and arbiter to ensure that the Project Developer and Transmission Owner collaborate in good faith to keep the project
moving forward in a non-discriminatory manner. The process includes the identification and cost allocation of system upgrades necessary for the safe and reliable interconnection to the bulk power system. This thorough and
comprehensive process includes:
Interconnection Request submission, review, validation and approval;
Scoping of project, including NYISO receipt of necessary technical data for each;
2011 ISO/RTO Metrics Report220
Scoping of Feasibility Study(ies), including execution of study agreement and NYISO receipt of necessary
technical data;
Conduct Feasibility Study(ies) with final report meeting with Developer and TO;
Scoping of System Reliability Impact Study(ies), including execution of study agreement and NYISO receipt
of necessary technical data;
Conduct System Reliability Impact Study(ies) with final report meeting with Developer and TO;
Scoping of Facilities Study(ies), including execution of study agreement and NYISO receipt of necessary
technical data;
Conduct Class Year Facilities Study(ies) with system facilities upgrades and capacity deliverability cost
allocation, with final report meeting with Developer and TO;
Submission and approval of Class Year Facilities Study(ies) to NYISO Market Participant governance
working groups, sub-committees and Operating Committee;
Decisions of Project Developers to accept or not accept their Project Cost Allocations for system upgrades;
and
Interconnection Agreements provided to Developer, including proof of continued site control and the
achievement of development milestones, to be filed with FERC.
Interconnection Process Evolution and Responsiveness
The NYISO interconnection process has evolved and adapted to meet the expansion of new entrants in New York’s wholesale electricity markets. The combination of open access, market opportunities, and public policy initiatives has significantly expanded the scope and array of projects pending in the NYISO Interconnection Queue.
In 2004, the adoption of the Standard Large Facility Study Procedures (―LFIP‖) resulted in the initiation of many new
studies, but few were completed during that year. In 2005, there was a significant influx of wind projects, creating a
backlog of studies that carried over to 2006. During 2006, the NYISO implemented a number of changes in the study
process to address the expanding number of projects and studies. The impact of the 2006 process changes resulted
in the completion of then-pending projects. However, hundreds of additional projects, particularly wind projects, were
submitted for study. As a result of continued enhancement of the interconnection process and the similarity of the
project types, completion times for studies improved. As the diversity of project types submitted in 2008 expanded,
including new energy storage projects, the study times also expanded to reflect the uniqueness of each project. Also
in 2008, the NYISO began implementation of the FERC required capacity deliverability studies, which significantly
increased the Interconnection Request Processing Time for years 2008 - 2010 (see chart below). Also, since late
2008 economic conditions caused developers to slow the pace of proposed projects, resulting in lengthened study
times, and in some cases withdrawal of several projects. The NYISO has worked with developers desiring to keep
their queue position, but also to moderate the pace of studies until economic conditions improve. This
accommodation to developers appears to have increased interconnection study times, and slowed completion of studies in 2008, 2009 and 2010.
2011 ISO/RTO Metrics Report221
As shown in graphs throughout this section, no Interconnection Facilities/Class Year Studies were completed in
2010. With FERC’s approval, the NYISO performed both the 2009 and 2010 Facilities/Class Year studies in parallel
during 2010, with the objective of completing both Class Years in 2011. The 2009 Class Year included four
generation interconnection projects and the 2010 Class Year included eight generation interconnection projects.
Integrating Innovative New Technologies
The integration of new technologies into the grid presents unique challenges in performing interconnection and
system planning studies. In many cases, models for these new technologies submitted to the NYISO Interconnection Queue are not readily available and are under various stages of development. This means that project developers often do not have adequate and documented models from the equipment manufacturers or engineering consultants to validate the operation of the proposed equipment. In some cases, model developers claim confidentiality of their models and don't provide adequate documentation for the study analysts to verify that the models provided
reasonably represent the actual characteristics of the proposed equipment. As for integrating new technologies into system planning studies, standard assumptions used to study conventional facilities do not necessarily apply. For example, energy storage and regulation facilities are not proposed for the purpose of providing peak load capacity, but rather to provide short-term power to shave peaks and fill valleys during the day.
NYISO Average Generation Interconnection Request Processing Time 2006-2010
(calendar days)
1,000
800
600
400
200
0
20062007200820092010
For 2010 there are no data due to the FERC approved combining of the 2009 and 2010 Facilities/Class Year Studies.
The ―Average Generation Interconnection Request Processing Time‖ is calculated by adding the total number of days
it takes for the Feasibility, System Reliability Impact and Facilities/Class Year studies to be performed. Because all of
the 2009 and 2010 Facilities/Class Year studies were completed in 2011, there is no data to be reported for 2010.
2011 ISO/RTO Metrics Report222
NYISO Planned and Actual Reserve Margins 2006 - 2010
40%
35%
30%
25%
20%
15%
10%
5%
0%
20062007200820092010
Bars Represent Planned Reserve MarginsLines Represent Actual Reserves Procured
The Installed Reserve Margin (―IRM‖), is determined annually by the New York State Reliability Council (―NYSRC‖)
with technical study assistance provided by the NYISO, and is subject to final regulatory approval by the Federal
Energy Regulatory Commission and the New York State Public Service Commission. The statewide IRM for the
2010/2011 capability year is 18 percent. Based on the IRM, the NYISO has determined the installed capacity
requirements total 38,970 MW. The total capacity available to the state is expected to be roughly 43,000 MW, which
includes 37,416 MW of in-state resources, an additional 2,251 MW Special Case Resources (a NYISO Demand
Response program) and 2,645 MW of import capability that could be used to supply capacity from neighboring
regions to New York.
Increased availability of the NYCA power plants with both internal and external transmission upgrades have
contributed to a downward trend in the reserve margin. Reserve margins are beginning to trend upwards, reflecting the ability of the markets to incent the active participation of all generation and demand-side resources. The efficient operation of the NYCA bulk electric system and wholesale electricity markets have sustained and enhanced system reliability and successfully focused resource development in regions where demand is greatest.
Consumers benefit from these system improvements along with the continual improvement in accuracy as a result of modeling enhancements. Examples of these enhancements are; a better understanding of load behavior at extreme temperatures, a more precise modeling of gas turbine output at temperatures above design, and the ability to
change interface limits under differing system conditions. This increased accuracy in establishing the IRM ensures that capacity is not over or under procured.
2011 ISO/RTO Metrics Report223

NYISO Demand Response Capacity as Percentage of Total Installed Capacity 2006-2010
Regarding the metric, Demand Response Capacity as Percentage of Total Installed Capacity, the graph includes the sum of the following: ICAP Special Case Resources, Emergency Demand Response Program, and Day-Ahead
Demand Response MWs. Load relief expected from demand response resources is not necessarily the sum of all the programs, due to rules that allow participation in multiple programs.
In August 2010, two of the NYISO’s major demand response programs, the Emergency Demand Response Program and the ICAP Special Case Resources program, had 4,386 end-use locations enrolled providing 2,498 MW of
demand response capability, a 4.5 percent increase over the 2009 enrollment level. The demand response resources in NYISO reliability programs represent 7.5 percent of the 2010 Summer Capability Period peak demand of 33,452 MW, a nominal change from 2009.
When New York experienced its record peak load in August 2006, NYISO demand response programs shaved the peak by an average of 865 MW, providing estimated savings of $91 Million.*
* The savings produced by the peak shaving can be quantified as the cost of providing a similar amount of capacity from peaking units. Assuming that the peaking unit is a nominal 195 MW Frame 7FA located in the Capital Zone, the estimate installed cost of such a facility (based upon the current S&L calculations for the demand curve reset) is $840/kW, with a combined fixed O&M plus insurance costs of 0.84%. Using annual fixed charge rate of 13% (assumed 20-yr amortization period), one unit would cost approximately $23M/year; four would be $91M/year.
2011 ISO/RTO Metrics Report224
NYISO Percentage of Generation Outages Cancelled by ISO/RTO 2006-2010
The NYISO does have the authority to approve planned generation outages with approval also required from the
Transmission Owners. The NYISO posts the approved generator outage schedules for the upcoming calendar year
by October 1 of the prior year. Provisions allow outage scheduling on a shorter timeframe only if it is mutually
acceptable to all involved parties. In 2010 two planned or maintenance generator outages of short duration were
cancelled in advance of the outage start. NYISO data for the metric, ―NYISO Percentage of Generation Outages
Cancelled by the ISO/RTO,‖ are not available prior to 2009 due to the format of historic records. In 2009, the NYISO
integrated a new outage scheduler application that will enable more efficient reporting of outage statistics on a going-
forward basis.
NYISO Generation Reliability Must Run Contracts 2006-2010
The NYISO did not have any generating units under Reliability Must Run (―RMR‖) contracts from 2006 through 2010. However, out of merit generation was dispatched as needed to comply with reliability criteria.
Interconnection / Transmission Service Requests
All data represented in this section include all generation, transmission, and transmission-connected load received in each designated year.
NYISO Number of Study Requests 2006-2010
500
450
400
350
300
250
200
150
100
50
0
20062007200820092010
* The NYISO does not use Transmission Service Requests to determine whether or not the existing transmission system
can accommodate a new project, as do most other ISO/RTO areas. Transmission service in New York is not limited by
the physical capacity of interfaces within New York but by the willingness of market participants to pay the costs of
congestion across interfaces. As a result, a very limited number of such requests are reported in the data presented
above. The NYISO Interconnection process assumes that proposed projects can be accommodated on the NYCA bulk
power system. NYISO interconnection studies focus on the potential need for upgrades to allow for the safe and reliable
interconnection of a proposed project and the cost allocation of any necessary facilities upgrades.
2011 ISO/RTO Metrics Report225
Since the national economic downturn in late 2008, fewer projects have been submitted to the NYISO Interconnection Queue for study.
NYISO Number of Studies Completed 2006-2010
700
600
500
400
300
200
100
0
20062007200820092 010
The number of studies completed for 2009 and 2010 declined because no Facilities/Class Year cost allocations were completed in those years. The FERC approved combining of the 2009 and 2010 Facilities/Class Year Studies, which were all completed in 2011.
NYISO Average Aging of Incomplete Studies 2006-2010
(calendar days)
800
700
600
500
400
300
200
100
0
20062007200820092010
2011 ISO/RTO Metrics Report226
NYISO Average Time to Complete Studies 2006-2010
(calendar days)
8 00
7 00
6 00
5 00
4 00
3 00
2 00
1 00
0
20062007200820092010
For the above charts on ―Average Aging of Incomplete Studies‖ and ―Average Time to Complete Studies‖, as stated
previously, the increased diversity of project types, the addition of FERC required capacity deliverability studies, and
the national economic downturn have all contributed to lengthened study times, slowed the completion of studies,
and in some cases, resulted in the withdrawal of several projects from the NYISO Interconnection Queue. The
NYISO has worked with developers desiring to keep their queue position , but moderate the pace of studies until
economic conditions improve. These factors appear to have increased interconnection study times for 2009 and
2010.
Average Cost of Each Type of Study Completed
20062007200820092010
Feasibility Study
$45,805$27,573
$24,217$25,457$33,016
Reliability$54,213$50,834$38,990$40,686$58,337
Facilities Study (Class Year)
$113,090$124,326
Data Not YetData Not Yet $125,119
AvailableAvailable
2011 ISO/RTO Metrics Report227
Special Protection Schemes
NYISO Number of Special Protection Schemes 2010
100
90
80
70
60
50
40
30
20
12
10
0
There were twelve Special Protection Schemes (SPS) in place within NYISO in 2010.
2011 ISO/RTO Metrics Report228
B. NYISO Coordinated Wholesale Power Markets
In April 2011, Potomac Economics, the NYISO’s Independent Market Monitor, issued the 2010 State of the Markets
Report: New York ISO. That report concludes that the NYISO operates ―a complete set of electricity markets,‖
including:
Day-ahead and real-time markets that simultaneously optimize energy, operating reserves, and regulation.
These markets lead to:
o Prices that reflect the value of energy at each location on the network;
o The lowest cost resources being started each day to meet demand;
o Delivery of the lowest cost energy to New York‟s consumers to the maximum extent allowed by the
transmission network; and
o Efficient prices when the system is in shortage.
Capacity markets that ensure that the NYISO markets produce efficient long-term economic signals to govern
decisions to:
o Invest in new generation, transmission, and demand response; and
o Maintain existing resources.
A market for transmission rights that allows participants to hedge the congestion costs associated with using the
transmission network.
In addition, the report says:
The performance of the New York markets is enhanced by a number of attributes that are unique to the NYISO:
o A real-time dispatch system that is able to optimize over multiple periods (up to 1 hour), which allows
the market to anticipate upcoming needs and move resources to efficiently satisfy the needs.
o An optimized real-time commitment system that starts gas turbines, flexible hydroelectric generators,
and some combined cycles and schedules external transactions economically - most other RTOs rely
on their operators to determine when to start gas turbines and other generators with short start-up
times.
o A mechanism that allows gas turbines to set energy prices when they are economic - gas turbines
frequently do not set prices in other areas because they are inflexible, which distorts prices.
o A mechanism that allows demand response resources to set energy prices when they are needed - this
is essential for ensuring that price signals are efficient during shortages. DR in other RTOs has
distorted real-time signals by undermining the shortage pricing.
2011 ISO/RTO Metrics Report229
For more information, please see:
http://www.nyiso.com/public/webdocs/documents/market_advisor_reports/2010/2010_NYISO_SOM_-_Final_4-22-11.pdf
According to the 2009 State Energy Plan, approved by the New York State Energy Planning Board and the Governor in December 2009, “New York„s competitive electricity market structure, established in 1999 and administered by the NYISO, provides an economic incentive to power plant operators to run as efficiently as possible…More efficient, i.e., lower heat rate, resources are attracted to competitive markets where they can profit by competing against less
efficient producers, an incentive that does not exist in non-market regions…”
For more information about the State Energy Plan‟s assessment of NYISO-administered markets, please see:
http://www.nysenergyplan.com/final/Electricity_Assessment_Resource_and_Markets.pdf
NYISO Market Volumes Transacted in 2010
For context, the table below represents the split of the $7.68 billion billed by the NYISO in 2010 into the primary types of charges its market participants incurred for their transactions:
(dollars in millions)
Energy Markets
Installed Capacity
Transmission Congestion Transmission Losses
TCC - Billed Fiscal Year Market-wide charges Administrative Costs
Transmission Service Ancillary Services
Other *
2010 Dollars Billed
$ 3,990
1,649
869
424
231
109
150
133
119
3
Percentage of 2010
Dollars Billed
52%
21%
11%
6%
3%
1%
2%
2%
2%
0%
Total$ 7,677100%
* The ―Other‖ category are contractual costs associated with operating two facilities and is based on agreements that predate the formation of the NYISO.
Demand response programs, cultivated in the competitive market environment, have grown significantly in the New
York wholesale electricity markets, and provide savings. From 2006 to 2010, NYISO Day-Ahead Demand Response
program provided energy savings averaging $8.5 Million annually, for a total of $42.7 Million. (Data on the
Location Based Marginal Price impact of demand response resources participating in the NYISO's Day-Ahead
Demand Response Program can be found in the NYISO’s annual compliance file to the FERC, Docket No. ER01-
3001.)
2011 ISO/RTO Metrics Report230
Market Competitiveness
NYISO Energy Market Price Cost Markup 2006-2010
15%
10%
5%
0%
-5%
-10%
-15%
20062007200820092010
The Energy Market Price Cost Markup is useful in evaluating the competitive performance of the market. A
competitive market should produce a small mark-up because suppliers should have incentives to offer at close to
their marginal cost. The NYISO’s Market Monitoring Unit (MMU) estimates the average annual markup was -2
percent in 2010 continuing the trend of low markups. Many factors can cause reference levels to vary slightly from
suppliers’ true marginal costs, so it is not expected to see a markup exactly equal to zero. Relatively low markups (-5
to 5 percent) indicate that the markets have performed competitively. The NYISO does not have data on the Price
Cost Markup prior to 2009.
NYISO New Entrant Gas-Fired Combustion Turbine (CT)
Net Generation Revenues 2006-2010
(dollars per installed megawatt year)
$150,000
$100,000
$50,000
$0
20062007200820092010
2011 ISO/RTO Metrics Report231
NYISO New Entrant Gas-Fired Combined Cycle (CC)
Net Generation Revenues 2006-2010
(dollars per installed megawatt year)
$150,000
$100,000
$50,000
$0
20062007200820092010
The above charts report the calculated net revenues for a unit located in New York’s Capital Zone. However, over
this time period, there is great variation throughout the state with New York City having the highest Net Generation
Revenues (ranging from an average of $12,339 for a CT and $118,216 for a CC over the past four years), and the
West Zone having the lowest Net Generation Revenues (an average of $5,403 for a CT and $28,878 for a CC over
the past four years). (Note that CT revenue estimates use a 100MW unit downstate and a 165MW unit upstate). Over
the 2006-2008 period, net revenue levels rose moderately in the Capital zones due to increased congestion across
the Central East interface and increase in capacity prices due to increased exports to ISO-NE with the introduction of
their new capacity market in 2006. In 2009, the net revenues decreased driven in part by lower loads due to the
combined effects of the economic contraction and a cool summer and in 2010, the net revenues increased in areas of the state with increased congestion.
2011 ISO/RTO Metrics Report232
NYISO Real-Time Energy Market Percentage of Unit Hours Offer Capped
due to Mitigation 2006-2010
3%
2%
1%
0%
20062007200820092010
The New York markets include market power mitigation measures that are intended to mitigate abuses of market
power while minimizing interference with the market when the market is workably competitive. In certain constrained areas, most of which are in New York City, some suppliers have local market power because their resources are needed to manage congestion or satisfy local reliability requirements. In these cases, however, the market power mitigation measures effectively limit their ability to exercise market power or impact prices. (See the NYISO Market Monitor’s 2010 State of the Market Report presentation for more information:
http://www.nyiso.com/public/webdocs/documents/market_advisor_reports/2010/2010_NYISO_SOM_-_Final_4-22-11.pdf)
The Automated Mitigation Program (AMP) mitigation measure applies to the Day-Ahead and Real-Time energy,
startup, and minimum generation in New York City zone. The preceding chart shows the Real-Time Market
mitigation. In most years, there was more mitigation in the Day-Ahead Market than in Real-Time. This trend
continued in 2010. The decline in mitigation over time reflects both the trends in day-ahead mitigation and a decline in congestion in New York City due to system changes such as, new units in New York City, and new transmission capacity from New Jersey to Long Island.
Market Pricing
Similarly to the other ISOs/RTOs, the annual variability in the load-weighted wholesale energy prices is accounted for by the variability of natural gas and this can be seen throughout the next five charts. Adjusted for the variation in natural gas prices, the annual average real-time wholesale energy prices have remained essentially flat over the past five years. This same variability can be seen in the breakdown of annual wholesale power costs. Since energy
comprises the largest component of wholesale power costs, the effect of fuel variability can be seen in the wholesale cost decrease from 2008 to 2010. The final chart isolates the unconstrained energy portion of the system marginal cost also shows the same effects of fuel price volatility, unadjusted for fuel price volatility.
2011 ISO/RTO Metrics Report233
The NYISO offers two demand response programs that support reliability: the Emergency Demand Response
Program (―EDRP‖) and the Installed Capacity-Special Case Resource Program (―ICAP/SCR‖). In addition, demand
response resources may participate in the NYISO’s energy market through the Day-Ahead Demand Response
Program (―DADRP‖), or the Ancillary Services market through the Demand-Side Ancillary Services Program
(―DSASP‖).
EDRP provides demand resources with the opportunity to earn the greater of $500/MWh or the prevailing locationalbased marginal price (―LBMP‖) for energy consumption curtailments provided when the NYISO calls on the resource. There are no consequences for enrolled EDRP resources that fail to curtail. Resources participate in EDRP through Curtailment Service Providers (―CSPs‖), which serve as the interface between the NYISO and resources.
The NYISO has calculated the overall average hourly wholesale LBMP reduction from scheduled DADRP load
reductions since 2001 and has found the hourly wholesale LBMP reduction to vary from a low of $0.04 in 2007 to a
high of $2.05 in 2008. No price impact calculations were performed for 2009 or 2010 because there were few hours
of DADRP resources scheduled during the summer months (28 hours in 2009 and 20 hours in 2010). The NYISO
provides semi-annual informational reports on Demand Response (Dockets ER01-3001 and ER03-647) in January
and June.
NYISO Average Annual Real Time Load-Weighted Wholesale Energy Prices 2006-2010
($/megawatt-hour)
$100
$90
$80
$70
$60
$50
$40
$30
$20
$10
$0
2006
2011 ISO/RTO Metrics Report
20072008
234
$54.83
20092010
In 2010, real-time prices in 99.8% of total hours were accurately set based on the NYISO's tariffs, with price
corrections required in only 18 out of 8,760 hours. NYISO's focus on price certainty has resulted in significant
improvements since 2006. The primary driver for the improvements made and the high level of price accuracy
achieved is due to the integration of Intelligent Source Selection (―ISS‖). ISS allows for improved data integrity by
identifying and removing metering errors that otherwise would have impacted the real-time markets. The percentage
of hours in which there were no corrections in the real-time energy or ancillary services prices at any active nodal or
zonal price location in the NYISO administered markets are as follows: 2006: 96.9%, 2007: 99.0%, 2008: 99.3%,
2009: 99.7% and 2010: 99.8%.
U.S. Nominal Fuel Costs 2006-2010 ($ per million Btu)
$25
$20
$16.59
$15
$12.56
$10
$5$5.08
$2.26
$0
20062007200820092010
CoalNatural GasResiduel Fuel OilDistillate Fuel Oil
Source: U.S. Energy Information Administration, Independent Statistics and Analysis. ―Table 2. U.S. Energy Prices, EIA/Short-
Term Energy Outlook—June 2011,‖ http://www.eia.gov/emeu/steo/pub/2tab.pdf.
2011 ISO/RTO Metrics Report235
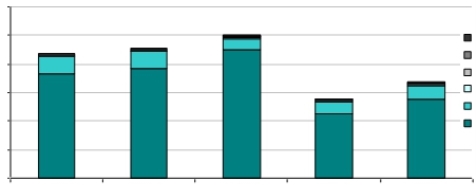
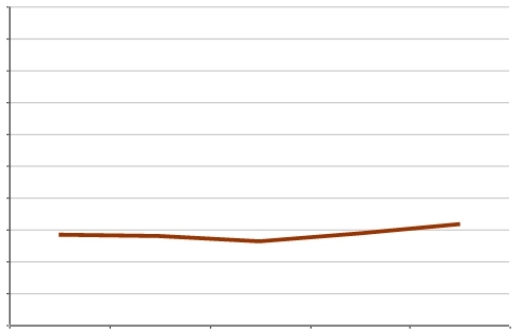
NYISO Average Annual Load-Weighted
Fuel-Adjusted Wholesale Spot Energy Prices 2006-2010
($/megawatt-hour)
$100
$90
$80
$70
$60
$50
$40
$ 31.60
$30
$20
$10
$0
20062007200820092010
NYISO’s base day for fuel-cost references is January 1, 2000.
NYISO Wholesale Power Cost Breakdown
($/megawatt hour)
$120
$100.26
$100$91.20RTO Cos t & Regulatory Fees
$87.70
$80
$60
$40
$20
$0
20062007
Operating Res er ves
$67.61Ancillar y Services
$55.84Transmission
Capacity
Energy
200820092010
The ―Transmission‖ charge in the above figure represents the NYPA Transmission Adjustment Charge (―NTAC‖),
which is a surcharge on all Energy Transactions assessed to all statewide load as well as Wheel Through and Export transactions. The NTAC recovers any residual NYPA transmission revenue requirements and is billed and collected by the NYISO. Additional transmission charges, not included in the above figure, are billed and collected by each transmission owner from both wholesale and retail customers. The capacity component is based on spot capacity prices times the capacity obligations in each area, divided by the real-time energy consumption.
2011 ISO/RTO Metrics Report236
Unconstrained Energy Portion of System Marginal Cost
NYISO Annual Average Non-Weighted, Unconstrained Energy Portion
of the System Marginal Cost 2006-2010
$100
$90
$80
$70
$60
$50
$40
$30
$20
$10
$0
20062007200820092010
Similar to the other ISOs/RTOs, the annual variability in the load-weighted wholesale energy prices is accounted for
by the variability of natural gas. Adjusted for the variation in natural gas prices, the annual average wholesale energy
prices have remained essentially flat over the past five years. This same variability can be seen in the breakdown of
annual wholesale power costs. Since energy comprises the largest component of wholesale power costs, the effect
of fuel variability can be seen in the wholesale cost decrease from 2008 to 2009 and the subsequent increase from
2009 to 2010.
2011 ISO/RTO Metrics Report237
Energy Market Price Convergence
NYISO Day-Ahead and Real-Time Energy Market Price Convergence 2006-2010
$3.50
$3.00
$2.50
$2.00
$1.50
$1.00
$0.50
$0.00
-$0.50
-$1.00
20062007200820092010
NYISO Percentage of Day-Ahead and Real-Time Energy Market Price Convergence
2006-2010
100%
80%
60%
40%
20%
0%
20062007200820092010
Convergence between day-ahead and real-time has varied between 96 to 99 percent while convergence measured in dollars has been more variable. This annual variation is driven by both real-time events and the cost of natural gas. The metric is impacted in 2006 and 2010 by high Real-Time price outliers in the summer. The 2008 data reflects high natural gas prices (see the chart of ―U.S. Nominal Fuel Costs 2006-2010‖). In 2010, there were many more days than in prior years (primarily during the summer) when Real-Time prices were substantially above the Day-Ahead prices and that caused the negative Energy Market Price Convergence metric.
2011 ISO/RTO Metrics Report238
Congestion Management
NYISO Annual Congestion Costs per Megawatt Hour of Load Served 2006-2010
$10
$8
$6
$4
$2
$0
20062007200820092010
NYISO Percentage of Congestion Dollars Hedged Through ISO/RTO Congestion
Management Markets 2006-2010
100%
80%
60%
40%
20%
0%
20062007200820092010
The annual congestion costs per MWh of load served vary with fuel costs. The increase in the annual congestion
costs in 2008 is partially accounted for by the increased cost of fossil fuel that year. The percent of congestion dollars
hedged through the NYISO markets has varied over time. Congestion hedges are generally used when loads,
located in high congestion areas, are using generation located in less congested parts of the state to meet their
loads. New York City and Long Island both have reliability based local generation installed capacity requirements
2011 ISO/RTO Metrics Report239
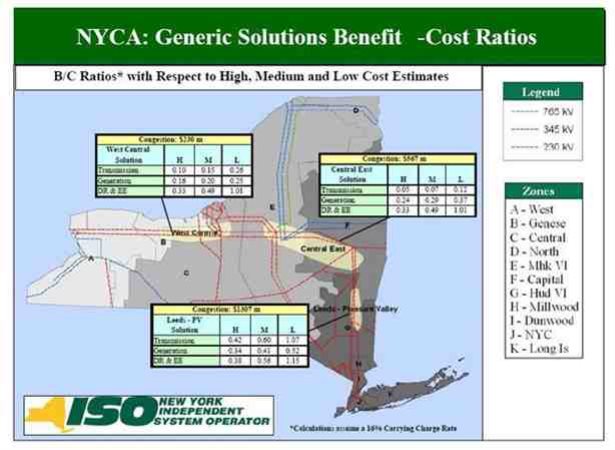
(80% and 104.5% in New York City and Long Island respectively for the capability year starting in May 2010) and so may have less of a need for a congestion hedge. In addition, there is also an active market in over-the-counter
contracts-for-differences, which provide a different instrument to hedge congestion.
The NYISO Congestion Assessment and Resource Integration Study (CARIS) issued January 12, 2010 provided an analysis of the types of projects (e.g. transmission, generation, or demand response) and costs of relieving
constraints. The full report is available at the following link:
http://www.nyiso.com/public/markets_operations/services/planning/planning_studies/index.jsp
For each of the three most congested interfaces in New York, the report showed the costs and benefits of relieving congestion using high, medium, and low cost estimates for each type of project. Based on the generic project sizes and costs, a benefit/cost ratio was calculated and reported. The graphic below presents the benefit costs ratio for the three types of solutions studied for the three most congested interfaces in New York.
January 12, 2010 CARIS Results
2011 ISO/RTO Metrics Report240
Resources
NYISO Annual Generator Availability 2006 - 2010
100%
95%95.96%
90%
85%
80%
20062007200820092010
The decline in generator availability in 2007 can be attributed to a number of factors including two large units having
long outages and a number of gas turbines undergoing maintenance. In subsequent years, the addition of generation
in New York City combined with lower loads led to less use of gas turbines improving overall generator availability.
It is noteworthy that, with the creation of the NYISO’s competitive wholesale electricity markets, the availability of generating units in New York increased as power projects reduced the length of planned and unplanned outages. Average plant availability increased from 87.5 percent (1992-1999) to 96.0 percent in 2010.
The NYISO has taken several steps to minimize the market inefficiencies and associated costs caused by out-of-
merit dispatch.
Since 2005, the Day-Ahead and Real-Time Markets have jointly optimized energy, operating reserves and regulation to efficiently select the most economic resources to meet reliability needs. In real-time, the dispatch is optimized for multiple periods that span an hour, setting resource schedules to meet current and anticipated system conditions. In addition, an optimized real-time commitment starts gas turbines and allows these resources to set energy prices
when they are economic, providing more accurate energy prices that minimize the need for out-of-merit actions.
External transactions are also scheduled economically, allowing the real-time scheduling systems to select the most efficient set of resources to meet real-time conditions.
2011 ISO/RTO Metrics Report241
More recently, in order to improve the efficiency of reliability commitments and minimize uplift charges, the NYISO made two significant enhancements to the Day-Ahead Market in February of 2009 as follows:
Transmission owners may commit units for a reliability need prior to the economic commitment of SCUC,
allowing the commitment in the Day-Ahead Market to better reflect the anticipated Real-Time Commitment
needs; and
Local reliability rule requirements for New York City are included in the economic commitment of SCUC to
minimize the need for supplemental commitments.
The Independent Market Monitor for the NYISO has found that these enhancements have led to a more efficient commitment overall, resulting in less uplift charges.
Since Fall 2008, a cross-functional group at the NYISO has been reviewing market outcomes on a daily basis to
identify root-cause sources of uplift and other marketplace costs. As part of the root-cause analysis, a review of the prior day's operational actions, as well as the expected intent of the market settlement rules, is considered in order to maintain or improve the efficiency of market outcomes. In addition, enhanced reporting to stakeholders of daily and monthly trends in marketplace costs was implemented.
Actual Response Levels of Committed Demand Response from 2006 - 2010
Over the past decade, a new category of power resource - demand response programs - was developed to offer an alternative to traditional generation supplies. Demand response can serve as an important resource to meet system loads during extreme summer weather conditions. It is common for New York State’s summer peak demand to spike nearly forty percent above the average level of electricity use.
New York’s demand response resources have grown more than ten-fold since the programs began in the early years
of New York’s wholesale marketplace for electricity. Their value was most notably demonstrated when New York
State experienced its all-time record peak demand of 33,939 MW on August 2, 2006 when demand response
programs provided an average of 865 MW of relief per hour for the six hours in which the program was activated.
During the period of 2006 through 2010, the NYISO deployed demand response resources for five events in 2006
and two events in 2010. In 2006, demand resources were deployed on July 18, July 19, August 1, August 2, and
August 3. Average hourly response of 485 MW was achieved for nine hours on July 18 and 327 MW for seven hours
on July 19. In August, average hourly response of 314 MW was achieved for five hours on August 1, 865 MW for six
hours on August 2, and 398 MW for five hours on August 3. In 2010, demand resources were deployed on July 6 and
July 7. The NYISO deployed the ICAP/SCR and EDRP resources for two events in Load Zone J. Average hourly
response of 386.50 MW was achieved for six hours on July 6 and 409.38 MW was achieved for six hours on July 7.
There were no NYISO deployments of demand response in 2007, 2008, or 2009.
Details on hours and zones included in each deployment are reported in the semi-annual demand response reports submitted by NYISO.
2011 ISO/RTO Metrics Report242
NYISO Demand Response Future Enhancements:
The NYISO, in collaboration with its stakeholders, is continuing to evolve and enhance the administration of its demand response programs and address regulatory directives to facilitate market participation.
The Demand Response Information System (DRIS) continues to be developed by NYISO to automate program processing and enhance event performance, management, and settlement.
Telemetry requirements for the NYISO’s Demand Side Ancillary Services Program (DSASP) to permit direct communication between the NYISO and demand response providers are under development.
Direct communication for DSASP will facilitate the potential for aggregations of small demand resources to participate in NYISO’s ancillary services markets. A market design concept approved by stakeholders is providing a roadmap for implementation.
The NYISO will incorporate the provisions of Order 745 on demand response resource compensation into the market rules under development to integrate demand response participation in its Real-Time energy market.
At the state level, the NYISO is participating in proceeding of the New York State Public Service Commission (PSC) on advanced metering infrastructure. Detailed information is available from the NYISO filings on:
Advanced metering
(http://www.nyiso.com/public/webdocs/documents/regulatory/nypsc_filings/2009/NYISO_Comments_Staff_BC_Framework_6_15_09.pdf);
Dynamic pricing (http://www.nyiso.com/public/webdocs/newsroom/white_papers/Dynamic_Pricing_NYISO_White_Paper_102709.pdf);
and
Smart grid
(http://www.nyiso.com/public/webdocs/newsroom/white_papers/Envisioning_A_Smarter_Grid_NYISO_White_Paper_091710.pdf).
Fuel Diversity
Competitive markets have resulted in a more efficient, environmentally sound bulk electric power system for New York. The NYISO’s ability to optimize all system resources, the addition of cleaner, more efficient power plants, aggressive energy efficiency programs, the development of renewable energy, and improved demand-side
management have combined to ―green the grid.‖
Since 2000, power plants with generating capacity totaling 2,239 MW have retired. Of that total, 2,230 MW were
powered by fossil fuels, including 987 MW of coal-fired generation. The new power plants built since the inception of
electricity markets in New York run primarily on cleaner-burning natural gas, which is helping to reduce emissions
that contribute to global climate change. In addition, New York has seen an increase in output from nuclear plants,
which do not emit Nitrogen Oxides (NOx), Sulfur Dioxide (SO2) or Carbon Dioxide (CO2). The production of cleaner
power is an important component in the state’s efforts to meet newly enacted environmental standards.
2011 ISO/RTO Metrics Report243
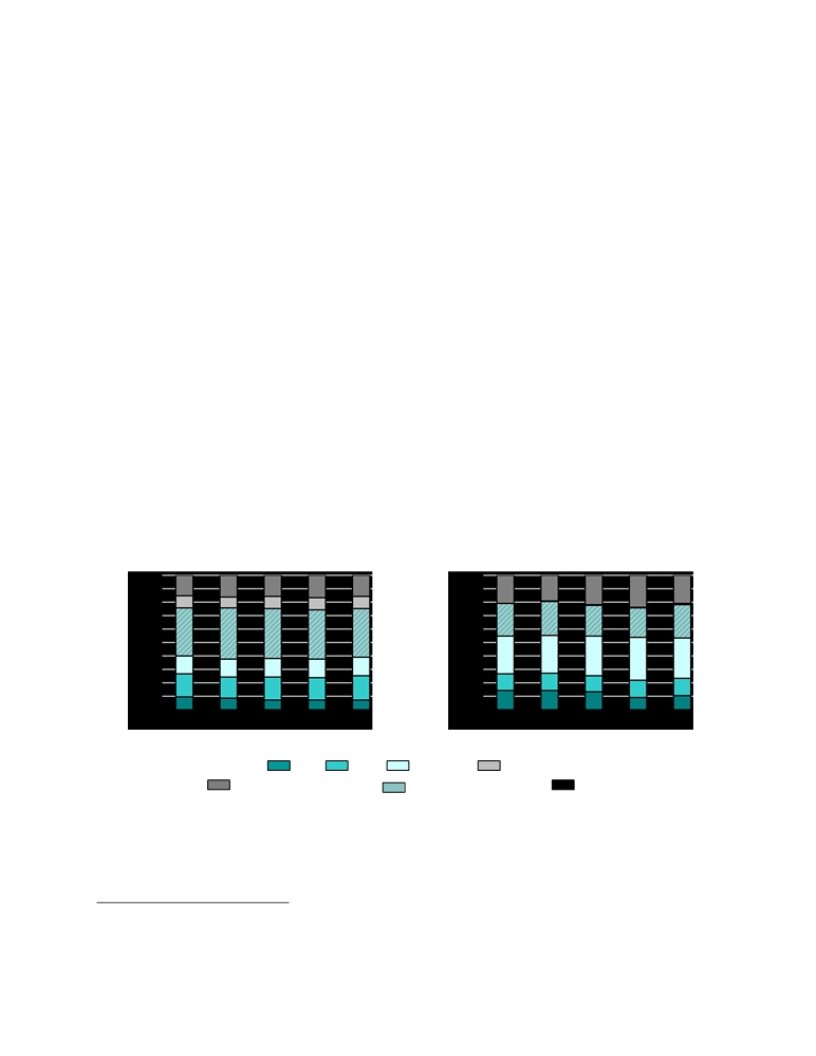
Based on data from the United States Environmental Protection Agency, the rate of power plant emissions of SO2,
NOx, and CO2 sharply declined between 1999 and 2010 in New York State. The SO2 rates have seen the most
dramatic decline by dropping more than 80% since 1999, CO2 rates dropped by 25%, while NOx rates dropped by
more than 60%. The emission rates of New York State’s electricity generation rank among the lowest in the
continental United States. New York’s CO2 emissions rate ranks 10th, its NOx emission and SO2 emission rates
ranks 12th lowest.
Open access to the state’s electricity grid has also increased the number of existing and planned projects powered by renewable resources, which are more protective of the environment than are traditional fossil-fueled plants.
Commercial power capacity from renewable resources, predominantly hydroelectric power projects, currently totals almost 5,850 MW of electricity.46 More than 1,300 MW of wind power has been added in recent years and over 6,000 MW of additional wind power projects are proposed for development in the state.
The NYISO has taken steps that, according to FERC, ―will benefit, and encourage, wind and other intermittent
generators.‖ Those steps include a centralized wind-forecasting initiative, unique market rules for wind projects, and proposals to enhance the dispatch of wind power on New York’s bulk electricity grid.
Recent New York State government policies are pursuing conservation and energy efficiency programs to control the growth in power consumption. These programs contribute to better power management, particularly during extreme weather conditions when electricity use is highest and lower costs to program participants.
NYISO Fuel Diversity 2006-2010
Installed CapacityGeneration Output
CoalGasNuclearOil
Hydro and RenewablesGas/Oil Combined CycleOther
The New York Control Area’s electric generation has become increasingly dependent on natural gas and dual-fuel
(seen above as ―Gas/Oil Combined Cycle‖) generating units. High efficiency and low emissions make them especially
attractive to being located in densely populated areas such as New York City and Long Island. The potential for
disruption of supply to and within the natural gas distribution system in New York City has resulted in the adoption of
46 New York has an additional 1,377 MW of hydro pumped storage. Pumped storage is not defined in New York State as a renewable energy resource for the purposes of the Renewable Portfolio Standard (RPS).
2011 ISO/RTO Metrics Report244
a local reliability rule often requiring the use of oil as the fuel source during peak load periods to avoid an electric outage being caused by a gas system contingency.
Renewable Resources
Open access to the grid and competitive wholesale electric markets have facilitated the increased development of
renewable energy projects. New York has been a leader in the integration of renewables, pioneering key policies and programs that have encouraged a significant growth in renewable sources of energy helping to meet environmental goals, and diversifying the array of fuels used to generate electricity. In 2010, electricity produced by hydropower, wind power, and other renewable resources totaled 21 percent of New York’s generation.
In 2008, the NYISO instituted one of the first state-of-the-art wind forecasting systems in the United States. The
centralized system enables the NYISO to better utilize and accommodate wind energy by forecasting the availability
and timing of wind-powered generation. In 2009, the NYISO became the first grid operator to dispatch wind power
fully balancing the reliability requirements of the power system with the use of the least costly power available.
Including wind power in the economic dispatch allows more efficient management of the resources and minimizes the
duration of wind-power curtailments. By the end of 2010 1,274 MW of wind power was in operation in New York
State, with average monthly capacity factors that ranged from a low of 10.2 percent in June 2009 to a high of slightly
over 35 percent. In 2010 there were more than 7,000 MW of wind power proposed for interconnection with the New
York electric grid. Generating facilities using renewable resources, such as wind, tend to be sited in locations distant
from population centers. As a consequence, transmission upgrades or expansion may be required to effectively
supply the power demands of New York State with this renewable power. A 2004 study of wind power in New York
State determined that New York could reliably manage 3,300 MW of interconnected wind generation. In the
intervening years, it became apparent that more than 3,300 MW of wind might be interconnecting to New York bulk
electricity system in the future and the impacts of this increased amount of wind generation required evaluation. In
order to more thoroughly assess the impacts of wind power integration, the NYISO has completed an extensive study
of the impact of up to 8,000 MW of wind resource integration on system variability and operations, installed capacity
requirements, transmission infrastructure, production costs, and emissions.
The findings of the NYISO wind study conclude that wind generation can supply clean energy at a very low cost of
production. This energy can result in significant savings in overall system production costs, yield reductions in
―greenhouse‖ gases and other emissions, as well as result in an overall reduction in wholesale electricity prices.
However, wind plants as variable resources present challenges to power system operation. The wind study finds that
NYISO systems and procedures (which include economic dispatch and the other operational practices available to
accommodate wind resources) should allow for the integration of as much as 8,000 MW of wind generation without
adverse reliability impacts.
The study determined that almost 9 percent of the potential upstate wind energy production would be ―bottled‖ or not
deliverable because of local transmission limitations. The study identified feasible sets of transmission facility
upgrades to eliminate the transmission limitations. These upgrades were evaluated to determine how much of the
wind energy that was undeliverable would be deliverable if the transmission limitations were removed. Additional
alternatives were suggested and evaluated to address the significant levels of resource bottling that occurs in the
2011 ISO/RTO Metrics Report245
Watertown vicinity. The suggested transmission upgrades and alternatives require detailed physical review and
economic evaluation before recommendations can be made on a project specific basis. The full study is available at:
http://www.nyiso.com/public/webdocs/newsroom/press_releases/2010/GROWING_WIND_-_Final_Report_of_the_NYISO_2010_Wind_Generation_Study.pdf
New York State Renewable Portfolio Standard
The New York State Public Service Commission (PSC), in September 2004, issued its ―Order Approving Renewable
Portfolio Standard Policy‖ that calls for an increase in renewable energy used in New York State from the then
current level of approximately 19 percent to 25 percent by the year 2013. In December 2009, the NYS PSC
increased the RPS goal to 30 percent and extended the target date to 2015. The definition of ―renewable‖ included
existing large-scale hydropower, but limited the inclusion of hydroelectric power going forward to new run of river
(non-storage) hydroelectric facilities of 30 MW or less. The information presented here is consistent with New York’s
RPS definition.
NYISO Non-Hydroelectric Renewable Megawatt Hours as a Percentage of Total Energy 2006-2010
20%
15%
10%
5%
0%
20062007200820092010
Energy from non-hydroelectric renewables has more than doubled since 2005. This may be attributable to the
combined impact of NYISO markets providing economic incentives and public policy encouraging the development of renewable generation in New York State.
Under the definition of the NYS RPS the calculated Total Energy (all renewable resources, including qualified
hydropower) for this report period is: 2006 - 20.04%; 2007 - 18.25%; 2008 - 20.85%; 2009 - 23.02%; and for 2010
- 21.29%.
2011 ISO/RTO Metrics Report246
NYISO Hydroelectric Renewables Megawatt Hours as a Percentage of Total Energy 2006-2010
20%
15%
10%
5%
0%
20062007200820092010
Currently, hydropower is the largest renewable resource (as defined by the NYS Renewable Portfolio Standard) in the state’s energy mix.
NYISO Non-Hydroelectric Renewable Megawatts as a Percentage of Total Capacity 2006-2010
20%
15%
10%
5%
0%
20062007200820092010
Capacity of wind resources rose from 245 MW in 2005 to 1,274 MW at the end of 2010.
Under the definition of the NYS RPS the calculated Total Capacity (all renewable resources, including qualified
hydropower) for this report period is: 2006 - 13.44%; 2007 - 13.05%; 2008 - 14.18%; 2009 - 15.60%; and for 2010
- 15.79%.
2011 ISO/RTO Metrics Report247
NYISO Hydroelectric Renewables Megawatts as a Percentage of Total Capacity 2006-2010
20%
15%
10%
5%
0%
20062007200820092010
Future NYISO Enhancements:
Moving the electricity produced by wind generation to areas of high consumer demand will require substantial
investment in the state’s transmission infrastructure. Decisions on location and financing of new transmission
facilities will be crucial to New York State’s ability to meet renewable power policy goals. The NYISO is working to support the integration of renewable resources and complementary energy storage with innovative grid operation, market design, planning initiatives and technological advances.
2011 ISO/RTO Metrics Report248
C. NYISO Organizational Effectiveness
Administrative Costs
NYISO Annual Actual Costs as a Percentage of Budgeted Costs 2006-2010
Non-Capital CostsCapital Recovery Costs
210%210%
190%190%
170%170%
150%150%
130%130%
110%110%
90%90%
70%70%
2006200720082009201020062007200820092010
Budget$107$111$117$129$129Budget$17$20$11$6$9
Bars Represent % of Actual Costs to Approved Budgets; Dollar Amounts Represent Approved Budgets (in millions)
* NYISO’s budget includes the annual assessment of fees from the Federal Energy Regulatory Commission (FERC). In contrast, other ISOs and RTOs invoice such FERC fees within their market settlement charges and do not include FERC fees within their approved budgets. In order to ensure comparability of NYISO’s budget with other ISOs and RTOs, the charts reflecting ―NYISO Annual Actual Costs as a Percentage of Budgeted Costs‖ and ―NYISO Annual Administrative Charges per Megawatt Hour of Load Served‖ exclude FERC Fees.
The NYISO develops its annual budget through its shared governance process in consultation with the Budget and
Priorities Working Group, which is open to participation by all NYISO Market Participants. The Budget and Priorities
Working Group is responsible for developing and monitoring NYISO’s budgetary spending and providing guidance
regarding prioritization and funding of strategic initiatives. Annually, the Budget and Priorities Working Group
presents a recommended budget to the NYISO Management Committee, consisting of Market Participant
membership from transmission owner, generation owner, other suppliers, end-use consumers, and public
power/environmental sectors. The Management Committee votes on whether to recommend the proposed budget to
the NYISO Board of Directors for approval. During the period 2006-2010, the NYISO’s proposed budgets were
consistently supported by the Management Committee and approved by the NYISO Board of Directors.
In addition to the review and recommendations for NYISO’s annual budget, the Budget and Priorities Working Group meets approximately ten times per year to review budget vs. actual results for all NYISO line items and to monitor progress on projects’ scope, cost and schedules.
NYISO’s budget consists of Capital investments, Operating Expenses (excluding depreciation expense), FERC fees,
Debt Service Costs (net of current year debt proceeds), offset by miscellaneous sources of income. NYISO’s budget
2011 ISO/RTO Metrics Report249
is approved and spending is managed based on the totality of that respective year’s budget. In a given year, NYISO
could overspend Capital while underspending Non-Capital (or underspend Capital while overspending Non-Capital),
budget total spend is ultimately managed within the total overall NYISO budget. An example of this occurred during
2010 when NYISO’s Capital Recovery costs exceeded budget because anticipated long-term financing to proceed
with infrastructure modifications was not approved during the calendar year of 2010. NYISO funded the cost of these
Capital improvements with spending under-runs on the Non-Capital Costs portion of its annual budget recoveries.
The Non-Capital costs metric identifies NYISO’s administrative and operational budget performance against the
planned resource allocations to meet the NYISO’s objectives as discussed and vetted during the stakeholder process described above. The main categories of costs included in the noncapital costs metric include salaries & benefits, external professional fees, and computer services (hardware/software maintenance and licenses to support the
NYISO operations and markets). Collectively, these largest components of the noncapital costs metric approximate over 80 percent of the total NYISO annual cash budget.
During 2006-2010, NYISO’s actual spending was less than the approved budget in each respective year with minor
variances from budget generally noted (budget under-runs of 3% in 2006, 1% in 2007, 2% in 2008, and 1% in 2010).
NYISO’s most significant variance from budget occurred during 2009, as New York and the nation endured a historic economic downturn, the NYISO worked to achieve its essential responsibilities with efficiency and financial prudence. NYISO reduced planned spending by $12 million to account for reductions in revenues from declining power
demands. NYISO cost-cutting measures included cutting Capital expenditures, renegotiating vendor contracts, and constraining compensation costs.
2011 ISO/RTO Metrics Report250
NYISO Annual Administrative Charges per Megawatt Hour of Load Served 2006-2010
($/megawatt-hour)
$1.10
$1.00
$0.90
$0.83
$0.80
$0.70
$0.60
$0.50
$0.40
$0.30
$0.20
$0.10
$0.00
2006
ISO/RTO
NYISO
2011 ISO/RTO Metrics Report
2007
2010 Annual Load Served
(in terawatt hours)
169
200820092010
251
Customer Satisfaction
NYISO Percentage of Satisfied Members 2006-2010
100%
80%
76%
60%
40%
20%
0%
20062007200820092010
The NYISO is committed to transparency in how it carries out its duties, in the information it provides, and in its roles
as the impartial administrator of the state’s wholesale electricity markets, operator of the high-voltage transmission
system, and provider of comprehensive electric system planning. The NYISO actively involves stakeholders,
regulators, public officials, consumer representatives, environmentalists, and energy experts who provide vital input
from a variety of viewpoints. The NYISO’s shared governance process actively builds consensus for changes in
market rules and operating procedures. Since the inception of the NYISO, almost all of its tariff revisions have been
developed through consensus among NYISO stakeholders. The value of shared governance was noted by the FERC
in a January 2008 order that stated: ―The Commission commends NYISO & the stakeholders for working together to
resolve many issues …‖
As part of these efforts, the NYISO conducts an annual survey that solicits stakeholder feedback to further enhance its shared governance process. In response to past surveys, the NYISO has implemented transparency measures including a redesign of its website for greater ease in obtaining market and operational data. Market training
resources were expanded, with instructional hours doubled and web-based training options added. The NYISO
restructured its Customer Relations department to better serve stakeholders and reduce the time required to resolve customer inquiries. In 2010, 93 percent of general inquiries were resolved within 24 hours, which bettered the 89
percent level achieved in 2009. Overall, the average number of working days required to address all customer
inquiries dropped from 5.5 days in 2009 to 4.4 days in 2010.
2011 ISO/RTO Metrics Report252
NYISO’s annual survey of stakeholders measures satisfaction using a seven-point scale. NYISO considers
responses within the top three categories of this scale to be ―satisfied‖ stakeholders. As such, stakeholders who
provide a neutral response are not considered ―satisfied‖. The data shown above under Percentage of Satisfied
Members reflects only those responses in the top three categories of satisfaction. For comparative purposes, the
trends of NYISO’s Percentage of Satisfied Members, shown with and without incorporating ―neutral‖ responses is as
follows:
% of Satisfied Members% of Satisfied Members
Including Neutral ResponsesExcluding Neutral Responses
(as shown above)
200687%71%
200787%70%
200892%81%
200991%80%
201092%76%
Billing Controls
ISO/RTO20062007200820092010
Unqualified SASUnqualified SASUnqualified SASUnqualified SASUnqualified SAS
NYISO70 Type 2 Audit70 Type 2 Audit70 Type 2 Audit70 Type 2 Audit70 Type 2 Audit
OpinionOpinionOpinionOpinionOpinion
In 2010, the NYISO received an unqualified SAS (Statement on Auditing Standards) 70 Type II audit opinion for the ninth consecutive year. The SAS 70 report is solely for the information and use of management of the NYISO, its Market Participants, and the independent auditors of the NYISO’s Market Participants, and is not intended to be used by and should not be used by anyone other than these specified parties..
Pricing Accuracy
The Pricing Accuracy performance metric identifies NYISO's level of real-time pricing accuracy. NYISO follows a
rigorous price validation process for ensuring timeliness and accuracy in pricing outcomes. The results from 288 five-
minute real-time dispatch cases with approximately 500 pricing points are posted in real-time through an automated
system. Each day the prices are reviewed for accuracy and corrected, if necessary, within three calendar days as per
tariff.
In 2010, real-time prices in 99.8 percent of total hours were accurately set based on the NYISO's tariffs, with price
corrections required in only 18 out of 8,760 hours. NYISO's focus on price certainty has resulted in improvements
since 2006. The primary driver for the improvements made and the high level of price accuracy achieved is due to
2011 ISO/RTO Metrics Report253
the integration of Intelligent Source Selection (―ISS‖). ISS allows for improved data integrity by identifying and
removing metering errors that otherwise would have impacted the real-time markets. The following table shows the percentage of hours in which there were no corrections in the real-time energy or ancillary services prices at any active nodal or zonal price location in the NYISO administered markets.
NYISOError-Free Hours
200696.9%
200799.0%
200899.3%
200999.7%
201099.8%
Billing Accuracy
Market Settlement Billing Accuracy: This metric includes all settlements on NYISO Invoices from the Initial Bill through Final Bill Closeout (FBC). The values represent the percentage of the total Final Bill Settlement that was invoiced, on average, at the various invoice intervals until the requisite billing month was closed out. The primary driver of differences between the initial bill and Four Month True-up is metering updates that occur throughout the true-up process in accordance with the NYISO tariff.
Billing Accuracy
% of dollars settled during billing cycles 2006-2010
YearInvoice
4 MonthTrue-ups &
Rebill Close Out
Five-Year Average95.46%3.96%0.58%
* Through October 2010
NYISO Market Participants are engaged in the billing issues process on a regular basis through the Billing and Accounting Working Group (BAWG). The working group meetings include standing agenda items that cover
highlights of the most recently issued invoices, as well as information on any open billing issue and the planned resolution strategy and timeline. In addition to this information, the Billing Issues Report includes information on upcoming code deployments, bill challenges, and pertinent FERC filings that may impact the invoice process or individual invoices in the future.
2011 ISO/RTO Metrics Report254
D. New York ISO Specific Initiatives
When the NYISO began operating in 1999, New York State faced a widening generation gap, with projections that
available generation would be incapable of reliably serving increasing levels of electricity use, particularly in the
downstate Metropolitan New York region. In 2010, the NYISO’s assessment of the electric system’s reliability needs
had concluded that New York has sufficient installed generation to reliably serve load through the next ten years.
Since the inception of New York’s wholesale electricity markets, new generation and interstate transmission have been built where most needed. By 2010, more than 8,600 MW of new generating capacity had been added
throughout New York, with 80 percent sited where demand for power is greatest (New York City, Long Island, and the Hudson Valley) and nearly 1,300 MW of transmission capability had been added to bring more power to the downstate region from out of state.
In the market environment, power producers have invested heavily in new generation and upgrades to existing facilities. Consumers have benefited through prices that are lower than they might have been otherwise.
Environmental quality has been enhanced by the addition of more emission-free, renewable power resources and enhanced power plant efficiencies that have contributed to reduced emission rates.
NYISO Market Benefits - Wholesale Electricity Prices
In New York State, wholesale electric energy prices reached historic lows in 2009 - 50 percent lower than in 2008 --
driven by lower electricity use and drops in the prices of natural gas (one of New York’s primary generating fuels). As
economic activity expanded in 2010, natural gas prices increased, as did wholesale electric energy prices. The
average cost of wholesale electricity in New York increased over 2009’s historic lows; however, it remained well
below 2008 prices. Energy prices in 2010 reflected increased demand due to both weather conditions and improving
economic conditions. Heat waves led to more electricity being consumed by New Yorkers in July 2010 than any
previous month on record.
NYISO Market Benefits - Improved Unit Availability
In the competitive market environment, generating units in New York improved their operations with increased
availability as they reduced the length of planned and unplanned outages. Average plant availability increased from
87.5 percent (1992-1999) to 96.0 percent in 2010.
2011 ISO/RTO Metrics Report255
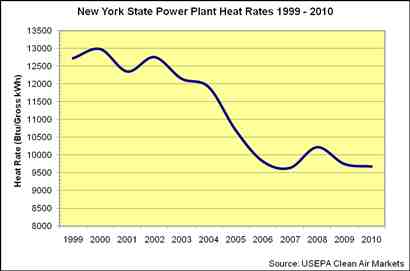
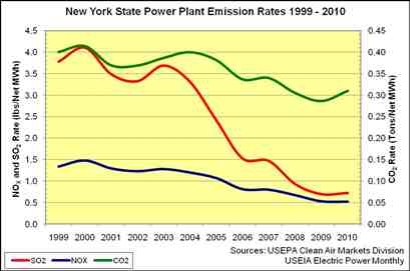
NYISO Market Benefits - Heat Rate Improvements
In New York’s competitive market environment,
power plant owners have invested in generating
units with better heat rates, which are able to
compete and produce infra-marginal revenue. The
uniform clearing price drives the selection of units
with the lowest marginal cost. Units that are not
selected to run do not earn energy market
revenues. From 2000 to 2010, there was a 25
percent overall improvement in system wide
heat rates of New York State power plants. The
heat rate improvements contribute to the energy
related savings by driving efficiency improvements
in existing units and attracting new units with
superior heat rates. Demand-side resources also
contribute to the overall improvements in fleet heat
rate as units with inferior heat rates are no longer
dispatched when the load levels are curtailed
through demand response programs.
In New York State, from 1999 to 2010, the rate of
power plant emissions of Sulfur Dioxide (SO2),
Nitrogen Oxides (NOx), and Carbon Dioxide (CO2)
sharply declined. The SO2 rates have seen the
most dramatic decline by dropping more than 80
percent. NOx rates dropped more than 60 percent
and CO2 rates dropped by 25 percent. The
emission rates of New York State’s electricity
generation - measured in tons per megawatt-hour
- rank among the lowest in the continental United
States. New York’s CO2 emissions rate ranks 10th
lowest; its NOx and SO2 emission rates rank 12th
lowest.
NYISO Market Benefits - Demand Response
Demand response programs, cultivated in the competitive market environment, have grown significantly in the New
York wholesale electricity markets, with resources totaling nearly 2,500 MW in 2010. From 2006 to 2010, NYISO Day
Ahead Demand Response program provided energy savings averaging $8.5 million annually, for a total of $42.7
million. (Data on the Location Based Marginal Price impact of demand response resources participating in the
2011 ISO/RTO Metrics Report256
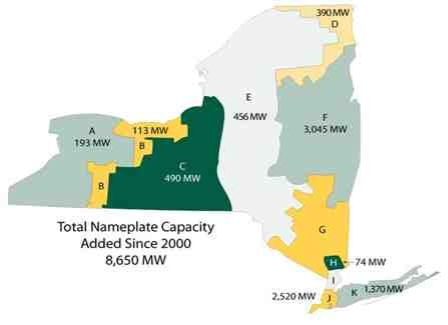
NYISO's Day-Ahead Demand Response Program can be found in the NYISO’s annual compliance file to the FERC, Docket No. ER01-3001.)
When New York experienced its record peak load in August 2006, NYISO demand response programs shaved the peak by an average of 865 MW, providing estimated savings of $91 million.*
* The savings produced by the peak shaving can be quantified as the cost of providing a similar amount of capacity from peaking units. Assuming that the peaking unit is a nominal 195 MW Frame 7FA located in the Capital Zone, the estimate installed cost of such a facility (based upon the current S&L calculations for the demand curve reset) is $840/kW, with a combined fixed O&M plus insurance costs of 0.84%. Using an annual fixed charge rate of 13% (assumed 20-yr amortization period), one unit would cost approximately $23M/year; four would be $91M/year.
NYISO Market Benefits - Locational Price Signals
Locational price signals in the NYISO
energy and capacity markets have driven
investments in areas where the demand
for electricity and, consequently, the
prices are the highest. Investments in
generation and demand side resources
followed the price signals, resulting in the
development of cleaner, more efficient
resources in the downstate New York
City area. These investments have
enabled New York to reliably serve its
demand within a competitive market with
limited investment in transmission. The savings associated with location of generation and demand response resources are estimated at $500 million annually. This estimate is based on the transmission congestion costs that would have been incurred to transport power from other regions and the costs that would have been incurred to add new transmission capacity.
2011 ISO/RTO Metrics Report257
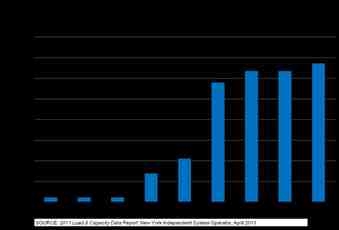
NYISO Market Benefits - Renewable Resources
Open, non-discriminatory access to the grid and
wholesale electricity market incentives have
helped to cultivate the development of
renewable sources of electricity in New York.
The Empire State’s first major wind farm, with a
generating capacity of 300 MW, went into
operation during 2006. By the end of 2010 there
were 1,274 MW of wind generation in operation
with an additional 7,000 MW proposed for grid
connection.
The NYISO continues to evolve its market design and grid operations, especially with regard to renewable resources.
With the approval of the Federal Energy Regulatory Commission (FERC), the NYISO successfully implemented a
state-of-the-art centralized wind forecasting system in 2008 and, in 2009 became the first ISO/RTO to integrate wind
into its economic dispatch system to effectively manage wind generation while maximizing transmission capability
and maintaining reliability. FERC also approved another market first, authorizing the NYISO to create a pioneering
regulation-only energy storage product, an innovation that will enhance system reliability and strengthen regulation
market competition.
NYISO Market Benefits - Credit Management
During the period 2006-2010, the NYISO's proactive approach toward credit management prevented significant
Market Participant defaults. In this time period, the NYISO allocated $0.8 million in bad debt losses to its Market
Participants, 0.002 percent of the $42 billion total value of market transactions clearing through the NYISO markets.
The NYISO's credit management efforts include proactively removing the unsecured credit privileges of Lehman
Brothers prior to that entity's bankruptcy filing, thereby avoiding a potential bad debt loss of at least $4 million;
implementing a series of credit policy enhancements in 2008 to minimize the risk of potential socialized bad debt
losses; developing an automated Credit Management System to permit flexibility to update credit requirements to
match evolving market design and revising existing credit requirements for each NYISO market to more appropriately match credit requirements to market risk.
NYISO Market Benefits - Technology
The NYISO assumed control of New York’s grid on the verge of the Y2K transition. Its initial investments in advanced
information technology immediately advanced the technological infrastructure of grid operations and provided a
foundation for sustained progress. NYISO technology continues to advance with the evolution of market design. In
2005, the NYISO performed a comprehensive system overhaul with the implementation of its Standard Market
Design 2 (―SMD2‖), which has served as a model for other markets. The NYISO has continued to advance its
2011 ISO/RTO Metrics Report258
technology with deployments relating to innovative demand response programs and pioneering wind power integration.
NYISO information technology initiatives not only serve the evolution of grid operation and market design; they also produce efficiencies in the operation of the NYISO. A data center ―virtualization‖ project partitioned hardware into virtual systems to provide a more robust, responsive, and reconfigurable system. It reduced the number of servers required, cut energy use, and reduced licensing and maintenance costs, producing a savings of almost $20 million over the four-year time frame of the project.
NYISO Market Benefits - Smart Grid
Consistent with its commitment to advance the technological infrastructure serving the electricity system, the NYISO worked with the owners of New York’s high-voltage transmission facilities in 2009 to earn a $37.4 million Federal Stimulus Smart Grid Investment Grant to install Phasor Measurement Units (PMUs) and shunt capacitors across New York State. PMUs transmit power system data up to 60 times each second, enabling faster responses to grid events and facilitating more effective mitigation of potential outages. Current monitoring systems sample conditions every two to six seconds. The NYISO estimates that the capacitor project will reduce line losses by 48.7 gigawatthours of electricity annually, with a yearly savings of approximately $9.7 million.
NYISO Market Benefits - Addressing Market Issues
The transparency of the NYISO wholesale electricity markets facilitates effective monitoring and identification
complex transactions. Loop flows, for example, occur in every power system due to the laws of physics that govern
the actual flow of electricity. When loop flows are exacerbated by certain transactions, however, their impact
becomes apparent in the marketplace. Market transparency enables grid operators to effectively identify and address
such problems.
The NYISO, in addition to halting the transactions that exacerbated Lake Erie loop flow in the first part of 2008,
established a monitoring and analysis group to provide enhanced daily scrutiny of the markets, developed a daily
post-operations review that provides more detailed, transparent views of certain wholesale electricity costs. In the
2010 State of the Markets Report: New York ISO, Potomac Economics, the NYISO’s Independent Market Monitor,
reported that uplift charges decreased 21 percent from $287 million in 2009 to $228 million in 2010.
NYISO Market Benefits - Broader Regional Markets
Pursuing market solutions to the Lake Erie loop flow issue, the NYISO coordinated the development of a ―Broader Regional Markets‖ initiative, which proposes a comprehensive set of ―Seams Reduction‖ projects developed with ISO-NE, PJM, IESO, HQ, and MISO. In a July 15, 2010 Order, the FERC conditionally approved the proposals, saying, ―…these planned regional initiatives will be designed to reduce uplift costs and lower total system operating costs…‖ A September 2010 analysis by Potomac Economics estimated regional savings at $362 million a year and savings associated with New York to be $193 million annually.
2011 ISO/RTO Metrics Report259
NYISO Market Benefits - Expanded Interregional Planning
Working with the two dozen other Eastern Interconnection planning authorities, the NYISO helped to form and
develop the Eastern Interconnection Planning Collaborative (EIPC). The EIPC focus is on a ―bottom-up‖ approach to planning which starts with a roll-up of the existing grid expansion plans of electric system planning authorities such as ISOs, RTOs and utilities, in the Eastern Interconnection. In 2009, the U.S. Department of Energy awarded $16
million to the EIPC for a three-year study that includes the identification and analysis of a large number of
resource expansion scenarios selected through a transparent stakeholder process involving representatives of
various interest sectors across the entire interconnection. In November 2010, the EIPC released a draft report
summarizing the transmission and generation forecasted to be developed across the entire Eastern Interconnection
over the next decade in accordance with the regional plans of the participating planning authorities. The draft report
indicates that approximately 1,000 new and upgraded transmission facilities and some 750 new and upgraded
generation resources will be serving the region by 2020.
Phase I of the study will conclude with the selection of three resource expansion scenarios for detailed transmission build out and economic analysis during Phase II. EIPC plans to submit an interim Report to the DOE describing the
results of the Phase I activities by the end of 2011. The Final Report is scheduled for the end of 2012. It is anticipated that the results of this analysis will be utilized by federal and state regulators and policy makers as they discuss
important public policy issues.
2011 ISO/RTO Metrics Report260
PJM Interconnection (PJM)
2011 ISO/RTO Metrics Report261
Section 6 - PJM Performance Metrics and Other Information
PJM Interconnection is a regional transmission organization (RTO) that coordinates the movement of wholesale electricity in all or parts of Delaware, Illinois, Indiana, Kentucky, Maryland, Michigan, New Jersey, North Carolina, Ohio, Pennsylvania, Tennessee, Virginia, West Virginia and the District of Columbia.
Acting as a neutral, independent entity, PJM operates a competitive wholesale electricity market and
manages the high-voltage electricity grid to ensure reliability for more than 58 million people.
PJM’s long-term regional planning process provides a broad, interstate perspective over a 15-year horizon
that identifies the most effective and cost-efficient improvements to the grid to ensure reliability and
economic benefits on a system-wide basis.
An independent board, varying knowledge and experience backgrounds, provides oversight on behalf of
PJM’s 700+ members. Through effective governance and a collaborative stakeholder process, PJM is
guided by its vision: ―To be the electric industry leader - today and tomorrow - in reliable operations,
efficient wholesale markets and infrastructure planning.‖
Founded in 1927 as a power pool, PJM opened its first bid-based energy market on April 1, 1997. Later that year, the
Federal Energy Regulatory Commission (FERC) approved PJM as an independent system operator (ISO). ISOs
operate, but do not own, transmission systems in order to provide open access to the grid for non-utility users.
PJM became a regional transmission organization (RTO) in 2001, as FERC encouraged the formation of RTOs to operate the transmission system in multi-state areas as a means to advance the development of competitive
wholesale power markets.
From 2002 through 2005, PJM integrated a number of utility transmission systems into its operations. They included:
Allegheny Power in 2002; Commonwealth Edison, American Electric Power and Dayton Power & Light in 2004; and
Duquesne Light and Dominion in 2005. These integrations expanded the number and diversity of resources available
to meet consumer demand for electricity and increased the benefits of PJM’s wholesale electricity market.
Currently, PJM administers a day-ahead energy market, real-time energy market, capacity market, financial
transmission right congestion hedging market, day-ahead scheduling reserve market, synchronized reserve market
and regulation market. PJM ensures sufficient black start service to supply electricity for system restoration in the
unlikely event that the entire grid would lose power. PJM also administers demand response programs that help
increase operational efficiency and improve resource diversity, which in turn can reduce customer costs and reduce
wholesale prices.
2011 ISO/RTO Metrics Report262
Dispatch Operations
PJM CPS-1 Compliance 2006-2010
200%
180%
160%
140%
120%
100%
80%
20062007200820092010
Compliance with CPS-1 requires a performance level of at least 100 percent throughout a 12-month period. PJM was
in compliance with CPS-1 for each of the calendar years from 2006 through 2010. PJM began participating in a field
trial to replace CPS-2 as a performance measure in August 2005 and was granted a waiver from the CPS-2 measure
at that time. This new control performance measure is the Balancing Authority ACE Limit (BAAL). The BAAL
performance measure combines the CPS-1 performance measure with a specific limit known as a Frequency Trigger
Limit (FTL). In order to be compliant with the BAAL standard, a Balancing Authority must recover from a FTL
excursion within a 30-minute period of time. PJM was in compliance with the BAAL performance standard for each
calendar year from 2006 to 2010.
Transmission Load Relief or Unscheduled Flow Relief Events 2006-2010
2,000
1,500
1,000
500
0
20062007200820092010
2011 ISO/RTO Metrics Report264
PJM data reflects the number of Transmission Load Relief (TLR) events. PJM’s TLRs are almost exclusively level 3
and level 4 TLRs with level 5 TLRs representing less than one percent of the TLRs called from 2006 through 2010..
The number of TLRs in the PJM region has decreased since the integration of several transmission zones in 2003 -
2005. The levels of TLRs are also impacted by lower overall congestion levels in the past few years. The fact that
PJM issued only 110 TLRs in 2010, compared to 129 in 2009, reflects the ability to successfully control congestion
through redispatch of generation, including redispatch under the Joint Operating Agreement with MISO. PJM’s
operating rules allow PJM to reconfigure the transmission system prior to reaching system operating limits that would require the need for higher level TLRs.
Transaction curtailments implemented under the TLR process are an extremely costly mechanism for reducing the
flow on constrained transmission elements when compared to much more specifically targeted security constrained
economic dispatch procedures. The TLR process relies on the administrative curtailment of wide-area, control area-
to-control area transactions to maintain flow within established ratings on transmission system elements. These
transaction curtailments do not in any way reflect the economic desires of the market participants by which they are
scheduled, but rather are conducted in a priority order determined by the length and firmness of the transmission
service on which they are tagged. Because of the nature of this priority order, the curtailed transactions may have a
five percent or smaller flow impact on the transmission constraint being controlled, and transmission system
operators may therefore be required to implement thousands of MW of curtailments to achieve the necessary relief
on constrained facilities. On the other hand, PJM relies on security constrained unit commitment and economic
dispatch to maintain transmission system reliability. This mechanism minimizes out-of-merit dispatch by first
economically redispatching resources that have the greatest impact on a constrained facility, which significantly
reduced the transaction curtailments PJM has been required to implement to maintain transmission facilities within
limits. From 2004 to 2007, PJM transaction curtailment requests were reduced in excess of 4,000,000 megawatt
hours. PJM production cost simulation results conservative estimates of the savings realized from the reduction in
these inefficient transaction curtailments between $78 million and $98 million per year.
There are additional reliability benefits to the reduced reliance on the TLR procedure that are less quantifiable as a
dollar value. Because TLR relies on curtailments of interchange transactions, relief from implementation of that
process on a transmission facility cannot begin to be realized until at least 30 minutes after the constraint is
recognized. This is because an inherent time delay exists between when a constraint is recognized, applicable
transaction curtailments can be determined by the Reliability Coordinator, and those transaction curtailments can
actually be implemented via the NERC electronic transaction tagging system. Additionally, because the transactions
being curtailed under the TLR process are scheduled from control area to control area, it is impossible for the
Reliability Coordinator to know specifically which generation resources will respond to accomplish the curtailments.
Security constrained economic dispatch, on the other hand, sends electronic dispatch signals to individual generators
within minutes of a constraint being identified. Within a few additional minutes, individual generators can respond to
those signals and begin to provide relief on the constrained facility. While a monetary quantification is difficult, the
reliability benefit of providing much more timely and targeted relief on transmission constraints is undeniable.
2011 ISO/RTO Metrics Report265
PJM Energy Market System Availability 2006-2010
100%
95%
90%
85%
80%
20062007200820092010
Availability of the Energy Management System (EMS) is key to reliable monitoring of the electric system in the PJM region. For the past five years, PJM’s EMS has been available 99.5 percent of all hours in each year. The majority of the time PJM’s EMS system was unavailable to operators reflects challenges with data communications links, not EMS software or hardware issues. With the implementation of PJM’s second control center during 2011, PJM will have dual, independent data communication links to the EMS systems at each control center to reduce the EMS availability impact of potential data communication link lapses.
2011 ISO/RTO Metrics Report266

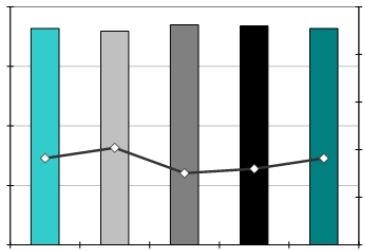

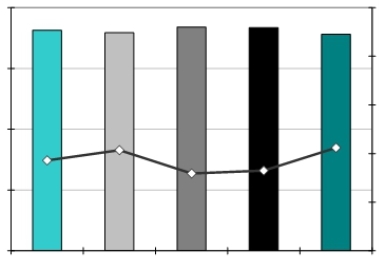

Load Forecast Accuracy
Load Forecasting Accuracy
ISO/RTOReference Point
PJMNoon prior day
PJM Average Load Forecasting Accuracy 2006-2010
100%5%
4%
95%
3%
90%
2%
85%
1%
80%0%
20062007200820092010
Forecasting AccuracyMean Absolute Percentage Error
PJM Peak Load Forecasting Accuracy 2006-2010
100%5%
4%
95%
3%
90%
2%
85%
1%
80%0%
20062007200820092010
Forecasting AccuracyMean Absolute Percentage Error
2011 ISO/RTO Metrics Report267

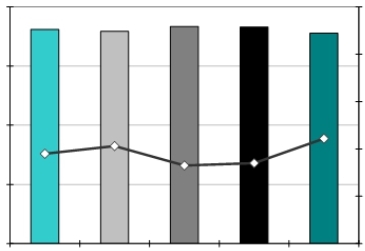
PJM Valley Load Forecasting Accuracy 2006-2010
100%5%
4%
95%
3%
90%
2%
85%
1%
80%0%
20062007200820092010
Forecasting AccuracyMean Absolute Percentage Error
PJM has maintained its approximate 98 percent load forecasting accuracy for the aggregate PJM region for the years 2006 - 2010. This accuracy level is consistent for the average, peak and valley load forecasting during those years. This means that PJM is forecasting the total generation needs, as well as the daily maximum and minimum
generation requirements, for the PJM region within a two percent variance to the actual needs.
2011 ISO/RTO Metrics Report268
Wind Forecasting Accuracy
PJM Average Wind Forecasting Accuracy 2006-2010 (1)
100%
95%
90%
85%
80%
75%
70%
65%
60%
55%
50%
20062007200820092010
(1) 2009 PJM data represents the month of December, 2009 when PJM began tracking this data.
PJM began tracking wind forecasting accuracy during December 2009. The data in this report for includes the results of thirteen months and does not yet support any trend analysis. The potential output from a wind generation resource can be impacted by its geographic location, hub height, turbine type, turbine capacity, manufacturer’s power curve and ambient temperature operating limits.
PJM’s approach to wind forecasting focuses on gathering the operating and historical data for each wind generation resource and incorporating that information in a model that forecasts anticipated generation output based on
predicted future operational and weather conditions. PJM’s objective is to improve its wind forecasting accuracy as it gathers more historical data and experience with the current wind generators in the PJM region.
Hydroelectric and pump storage resources are scheduled in PJM’s day-ahead energy market and as such do not impact forecast variability. Penetration of variable energy resources aside from wind generation are not significant enough at this time to impact the accuracy of the PJM load forecast.
PJM Wind Forecasting Future Enhancement:
During the remainder of 2011, PJM plans to continue to focus on improving wind forecasting accuracy by working with wind farms to provide more complete meteorological data and accurate turbine outage data. Other wind farm operational enhancements include:
Continuing to integrate PJM’s wind power forecast application with PJM’s real time dispatch tools, such as
security constrained economic dispatch.
2011 ISO/RTO Metrics Report269
Developing an automated curtailment notification mechanism for members to be notified when their wind
farms are being curtailed.
Regular tracking of PJM wind power statistics and providing to stakeholders.
Unscheduled Flows
PJM Absolute Value of Total Unscheduled Flows 2006-2010
(terawatt hours)
120
100
80
60
40
20
0
20062007200820092010
For context, the table below notes the number of external interfaces in 2010 over which PJM may have experienced
unscheduled flows.
ISO/RTONumber of External Interfaces
PJM22
2011 ISO/RTO Metrics Report270
PJM Absolute Value of Unscheduled Flows
as a Percentage of Total Flows 2006-2010
45%
40%
35%
30%
25%
20%
15%
10%
5%
0%
20062007200820092010
PJM’s unscheduled flows in both absolute terms and as a percentage of total flows have decreased over the past few
years. This downward trend is primarily a function of a slower economy and milder weather in both 2008 and 2009
that resulted in lower transaction volumes into, out of, and through the PJM transmission system. Also, PJM has
been actively engaged in the Broader Regional Markets effort with the NYISO, the Independent Electric System
Operator of Ontario, and the MISO to develop effective solutions to continue to reduce unscheduled flows around
Lake Erie.
(in terawatt hours)
PJM Unscheduled Flows
by Interface
Progress Energy Carolinas
MISO
Ohio Valley Electric Cooperative Tennessee Valley Authority
20062007200820092010
(3)(5)(6)(7)(7)
(10)(14)(3)75
(1)(1)244
(10)(6)(4)(4)(4)
Duke Energy Carolinas56433
PJM’s list of the highest magnitude unscheduled flows by interface demonstrates the primary unscheduled flow
patterns involving the PJM region - flows from west of PJM through PJM and then out to the regions south of PJM.
PJM is working on joint operating agreements with its neighboring balancing authorities to identify means to minimize such unscheduled flows. For example, PJM has been working actively with Progress Energy and Duke Energy on
enhancements to the current Joint Operating Agreement to provide for enhanced congestion management between the respective organizations.
2011 ISO/RTO Metrics Report271
Transmission Outage Coordination
PJM Percentage of > 200kV Planned Outages of 5 Days or More that are Submitted to ISO/RTO
at least 1 Month Prior to the Outage Commencement Date 2006-2010
100%
80%
60%
40%
20%
0%
20062007200820092010
PJM’s Tariff requires transmission owners to provide PJM at least five days notice of a planned transmission outage
for 200 kV or higher transmission facilities. Longer term outages should be reported to PJM at least one month prior
to the target outage commencement date. As noted in the preceding chart, a significant portion of the planned
outages in the PJM region have been reported to PJM well before the minimum reporting requirements in the PJM
Tariff.
PJM Percentage of Planned Outages Studied in the PJM Tariff/Manual established timeframes 2006-2010
100%
80%
60%
40%
20%
0%
20062007200820092010
The data in the preceding chart indicates its members’ substantial compliance with the PJM Tariff minimum
transmission outage five-day reporting requirement. These five days allow PJM to study the proposed transmission
facility outage for potential reliability implications before the transmission outage commences. The very small
percentage of outages not reported to PJM at least five days prior to the target outage commencement date will only
be approved by PJM if that requested outage does not cause increased congestion or have any adverse reliability
impacts.
2011 ISO/RTO Metrics Report272
PJM Percentage of > 200 kV Outages Cancelled by PJM After Having Been Previously Approved 2006-2010
2.50%
2.00%
1.50%
1.00%
0.50%
0.00%
20062007200820092010
PJM has the authority to cancel or reschedule previously-approved planned transmission outages if such outages
would jeopardize system reliability conditions at the time the outage is ready to commence. As such, an outage that
would require an emergency procedure will be cancelled and rescheduled. When a transmission outage would
impact generation availability, PJM endeavors to schedule the transmission outage at a time where the impact is
mitigated (such as when the generation would be on a maintenance outage). Historically, PJM has only needed to
cancel or reschedule a very small percentage of transmission outages that it had previously approved.
PJM Percentage of Unplanned > 200kV Outages 2006-2010
30%
25%
20%
15%
10%
5%
0%
20062007200820092010
Unplanned transmission outages may occur due to equipment malfunctions on the transmission line or an adjacent substation. They can also occur due to weather conditions that cause a transmission facility to trip out of service.
Historically, 22 - 24 percent of the outages of transmission assets in the PJM region with 200 kV or higher voltages have been unplanned.
2011 ISO/RTO Metrics Report273
Transmission Planning
PJM Number of Transmission Projects Approved to be Constructed for Reliability Purposes 2006-2010
550
500
450
400
350
300
250
200
150
100
50
0
20062007200820092010
PJM Percentage of Approved Construction Projects In-Service by December 31, 2010
100%
80%
60%
40%
20%
0%
20062007200820092010
PJM’s Regional Transmission Expansion Plan (RTEP) identifies transmission system additions and improvements
needed to keep electricity flowing to 51 million people throughout 13 states and the District of Columbia. Studies are
conducted that test the transmission system against mandatory national standards and PJM regional standards.
These studies look 15 years into the future to identify transmission overloads, voltage limitations and other reliability
standards violations. PJM then develops transmission plans in collaboration with the stakeholders’ Transmission
Expansion Advisory Committee (TEAC) which provides advice and recommendations in developing the RTEP to
2011 ISO/RTO Metrics Report274
resolve violations that could otherwise lead to overloads and black-outs. The resulting RTEP for the entire PJM region is submitted to PJM’s independent governing Board for consideration and approval.
PJM’s RTEP process includes both five-year and 15-year dimensions. Five-year-out planning enables PJM to assess
and recommend transmission upgrades to meet forecasted near-term load growth and to ensure the safe and reliable
interconnection of new generation and merchant transmission projects. PJM’s 15-year planning horizon permits
consideration of many long-lead-time transmission options. These options often comprise larger magnitude
transmission facilities that more efficiently and globally address reliability issues. Typically, these are higher voltage
upgrades that simultaneously address multiple NERC reliability criteria violations at all voltage levels. A 15-year
horizon also allows PJM to consider the aggregate effects of many system trends including long-term load growth,
impacts of generation deactivation, and broader generation development patterns, including renewable resources
and storage technologies.
PJM’s RTEP process throughout 2010 culminated in a series of upgrades approved by the PJM Board. PJM
identified and recommended these upgrades to resolve reliability criteria violations identified through 2025. Now part of PJM’s RTEP, 2010 upgrade plans have been integrated with those RTEP upgrades that were approved by PJM’s Board between 1999 and December 31, 2009. Consistent with findings in prior years, 2009 RTEP transmission upgrades and enhancements cover a range of power system elements: circuit breaker replacements to
accommodate increased current interrupting duty cycles, new capacitors to increase reactive power support, new lines, line reconductoring, new transformers to accommodate increased power flows and other circuit
reconfigurations and upgrades to accommodate power system changes.
Load growth remains a fundamental driver of transmission expansion plans. Over time, experience has demonstrated
that load growth in eastern PJM load centers, if not coupled with increases in new generation and demand response,
leads to increased west-to-east flows on transmission facilities, potentially aggravating an already heavily loaded
system. The impacts of the economic downturn in the US since the fall of 2008 has resulted in lower load growth and
a revision in the dates when certain extra high-voltage (EHV) transmission lines are projected to be needed to avoid
reliability standard violations.
Various state renewable portfolio standard initiatives promote demand response and energy efficiency programs.
Such programs can have the effect of moderating peak demand and energy growth. PJM supports these programs
and is closely monitoring developments. Currently, PJM factors demand response and energy efficiency indicators
into its RTEP process that have cleared in Reliability Pricing Model capacity auctions. They also are factored into
reliability analyses based on the circumstances under which the programs are expected to be implemented in actual
operations.
Within PJM, demand response participation may be price responsive, contractually obligated, or directly controlled.
As more experience with these programs is gained, PJM will be better able to assess their impact on energy usage
and peak load. PJM sensitivity studies attempt to provide an assessment of the potential effect of states’ demand
response and energy efficiency programs on reliability criteria violations which drive the need for new transmission.
2011 ISO/RTO Metrics Report275
The PJM Board has approved more than $19 billion of BES transmission enhancements since the inception of PJM’s RTEP process in 1997, through December 31, 2010, ensuring that PJM is compliant with NERC reliability criteria.
This includes over $15.6 billion of baseline transmission upgrades across PJM and nearly $3.4 billion of additional
BES transmission upgrades to enable the interconnection of over 56,000 MW of new generating resources and
merchant transmission projects.
Backbone Transmission Facilities
Since 2006, the PJM Board has approved six new major 500 kV and 765 kV backbone upgrades:
502 Junction - Loudoun 500 kV line, also known as Trans-Allegheny Line or TrAIL (2006 RTEP): PJM
expects this project to meet a required June 1, 2011 in-service date specified by PJM to solve identified NERC reliability criteria violations.
Carson - Suffolk 500 kV line (2006 RTEP): PJM expects this project to meet a required June 1, 2011 in-
service date specified by PJM to solve identified NERC reliability criteria violations.
Susquehanna - Roseland 500 kV line (2007 RTEP): PJM has developed an operational solution to address
the criteria violations that would otherwise be expected to occur in 2012 absent the line. Transmission
owners have indicated that the line will not be in service until June 1, 2014 or later, primarily due to delays in obtaining a permit from the National Park Service for the segment of the line that crosses the Delaware Water Gap National Recreation Area, the Appalachian National Scenic Trail and the Middle Delaware
National Scenic and Recreational River.
Amos - Kemptown 765 kV line, also known as the Potomac-Appalachian Transmission Highline or PATH
line (2007 RTEP): As part of the RTEP 2010 process, analysis, and review of proposed alternatives, the
PJM Board reaffirmed the need for the PATH project as the most robust solution to identified reliability
criteria violations and given the need for a solution to be in place by June 1, 2015. However, downward
revisions to the U.S. economic outlook for the PJM area has yielded lower peak summer demand than last
year, as reported in PJM’s January 2011 Load Forecast. Based on this most recent load forecast and initial
power flow assessments of the earliest need for PATH, the PJM Board announced on February 28, 2011 its
decision to suspend the PATH project, pending additional analysis as part of PJM’s 2011 RTEP process.
Upon completion of this analysis in 2011, PJM will then make a recommendation to the PJM Board
regarding RTEP PATH retention.
Possum Point - Indian River 500 kV line, also known as the Mid-Atlantic Power Pathway or MAPP line (2007
RTEP): Based on 2010 RTEP baseline analysis, PJM confirmed the need in 2015 for the MAPP Project.
The MAPP project was confirmed by the PJM Board with a required in-service date of June 1, 2015. Here
also, downward revisions to the U.S. economic outlook for the PJM area has yielded lower peak summer
demand than last year, as reported in PJM’s January 2011 Load Forecast. PJM's 2011 RTEP process will
address the impact of the lower load forecast and all other factors on all approved RTEP upgrades,
including the MAPP project.
2011 ISO/RTO Metrics Report276
Branchburg - Roseland - Hudson (B-R-H) 500 kV line (2008 RTEP): PJM 2010 RTEP analysis also revealed
fewer and less severe NERC criteria violations in northern New Jersey. Consequently, PJM and PSEG
revisited the scope of the approved B-R-H solution and recommended removing it and, in its place,
implementing an alternative solution comprised of 230 kV local upgrades.
Fundamentally, PJM’s planning process identifies future system transmission needs based on power flow studies
that reveal NERC criteria violations. These power flow models incorporate the effect of many system expansion
drivers. Load growth remains a fundamental driver of transmission expansion plans. Load forecasts are a key
component of power flow modeling in transmission expansion studies. Current, comprehensive zonal load forecasts
are essential if transmission expansion studies are to yield plans that will continue to ensure reliable and economic
system operations. The PJM Load Forecast Model incorporates the three classes of variables: (1) Calendar effects
such as day of the week, month and holidays; (2) U.S. economic conditions; and, (3) weather conditions across the
RTO.
Given that load is a primary driver of reliability criteria violations, lower load forecasts are deferring the need for some RTEP upgrades. For example, PJM’s 2010 RTEP process analysis of expected 2015 system conditions identified
NERC reliability criteria violations that have shifted, indicating that need for approved transmission lines can be
deferred by a year or more.
Over the past several years, an increasing focus by federal and state governments on climate change, energy
independence and other policy areas continues to make clear the critical role of the transmission system. And, while the existence of violations of NERC Reliability Standards is the basis for PJM’s determination of need, construction of major transmission infrastructure will likely be necessary to support the achievement of public policy goals.
The impact of these changing assumptions has the potential to threaten reliability if previously unexamined changes
are not evaluated. To that end, the PJM Board has directed that a broader range of sensitivity analyses be performed
and that changes to the planning process be examined that would facilitate PJM’s ability to manage more effectively
the recent ―whip-sawing‖ of project in-service dates, the result of periodic changes to modeling assumptions.
In 2010, PJM complemented its traditional bright-line tests with sensitivity analyses that incorporate a number of factors not typically taken into account under those tests, including the potential impact of state renewable portfolio standards, demand response/energy efficiency efforts, and ―at-risk‖ generation.
From a reliability perspective, taken together, sensitivity studies completed by PJM at the direction of the PJM Board demonstrate that a significant reliability need will continue to exist for backbone transmission facilities over a range of resource assumptions driven by changing public policy. More importantly, these sensitivity analyses indicate that federal and state public policy initiatives have the real possibility of accelerating the occurrence of reliability criteria violations earlier - some many years earlier - than identified in PJM’s 2010 baseline analysis.
PJM’s 2010 market efficiency analysis assessed the economic impact of all upgrades identified as part of PJM’s
RTEP process up through and including those identified as part of the 2009 RTEP cycle. While estimates of future congestion costs vary with changes in assumptions regarding key input parameters, 2010 market efficiency
2011 ISO/RTO Metrics Report277
simulations show that the addition of new transmission RTEP upgrades consistently reduces congestion costs by approximately 40 percent.
In compliance with FERC’s Order 890, PJM expanded its stakeholder process in 2008 to enhance coordinated, open
and transparent planning at both the regional and local level. PJM and stakeholders already conduct a compliant
planning process filed with the Commission and incorporated in Schedule 6 of the PJM Operating Agreement.
Valuable stakeholder discussions culminated in the establishment of three Sub-Regional RTEP Committees - Mid-
Atlantic, Western and Southern - commissioned to review proposed local upgrades. Each Sub-Regional RTEP
Committee increases the opportunity for direct stakeholder participation in the planning process from initial
assumption setting stages through review of the planning analyses, violations and alternative transmission
expansions.
Interregional planning is not new to PJM, having engaged in successful, collaborative interregional studies for
decades, many under the auspices of NERC. In recent years, PJM’s interregional planning responsibilities have
grown in parallel with the evolution of broader organized markets and interest at the state and federal level in favor of increased interregional coordination. Specifically, FERC Order No. 890 included transmission planning requirements to strengthen transparency, openness and interregional coordination.
Interregional electricity markets and system inter-operability require coordinated planning among PJM and its
neighbors. PJM does so under contractual arrangements with the Midwest Independent System Operator (MISO), ISO-New England, New York Independent System Operator, the Tennessee Valley Authority, Progress Energy and Duke Energy. These coordinated planning efforts also help to facilitate PJM’s ability to address national and state public policy objectives for additional generating resources based on renewable fuels such as wind.
State programs to encourage energy efficiency and renewable energy - especially wind-powered resources - have greatly expanded the scope of interregional planning initiatives. These include the recently completed Eastern Wind Integration Transmission Study (EWITS) and the Joint Coordinated System Planning Study (JCSP). Others, such as the Eastern Interconnection Planning Collaborative (EIPC) are currently under way.
PJM 2010 interregional planning efforts were conducted under the auspices of the following initiatives:
PJM / NYISO / ISO-NE Focused Study
PJM / MISO Cross-Border Congested Flowgate Study PJM - Duke - TVA Interface Analysis
NC Planning Collaborative Coordination
Each interregional study is prepared in accordance with a specifically defined scope and may include reliability
analysis, stability analysis, transfer analysis, market efficiency analysis and interconnection analysis. PJM performs these studies in collaboration with the planning staffs of adjoining systems and includes the formation of updated joint planning models for areas under study.
2011 ISO/RTO Metrics Report278
Generation Interconnection
PJM Average Generation Interconnection Request Processing Time 2006-2010
(calendar days)
1,000
800
600
400
200
0
20062007200820092010
PJM has made timely processing of generation interconnection study requests a high priority for the past few years with additional engineering staff and contractors engaged to complete these studies and the implementation of clustering of geographically similar studies to expedite study completion.
PJM Planned and Actual Reserve Margins 2006 - 2010
40%
35%
30%
25%
20%
15%
10%
5%
0%
20062007200820092010
Bars Represent Planned Reserve MarginsLines Represent Actual Reserves Procured
In 2007, PJM implemented a forward capacity market, the Reliability Pricing Model (RPM), which provides incentive
for forward investment in generation and demand response by requiring capacity contracts to be procured three
years prior to the delivery year. The RPM utilizes variable resource requirement curves to optimize the amount of
installed capacity procured to minimize costs while satisfying the capacity requirements of the region. Assuming
sufficient capacity resources are available, the variable resource requirement curve will allow the market to clear at
quantities between the regional planned installed reserve margin (IRM) and the IRM plus five percent. Quantities
2011 ISO/RTO Metrics Report279
above the IRM will only clear if the total procurement cost is reduced when compared to clearing at the reserve margin. Therefore, in PJM, the actual reserve margins resulting from RPM are expected to be and have been between the IRM and the IRM plus 5 percent.
One of the parameters of each RPM auction is the annual load forecast for the planning year for which the RPM
auction is procuring capacity resources. Given RPM auctions occur three years prior to the planning year for which
capacity is being procured, the planning year load forecasts will vary from the date of the initial RPM base residual
auction and the actual planning year. To be able to adapt to future load fluctuations, PJM’s RPM auction incorporates
two features - short-term resource procurement targets and incremental auctions. In each RPM auction, the capacity
that clears will reflect 2.5 percent less than the forecasted resource requirement. This will avoid over-procurement of
capacity due to potential variability in the short-term resource procurement target and the uncertainty of the economic
recovery. To address the risk of under-procurement, PJM also has the ability to hold incremental RPM auctions to
procure additional capacity if forecasts project greater capacity needs than procured in the RPM base residual
auction.
PJM’s analysis shows that since the first auction in 2007, RPM has retained and attracted 33,090 megawatts of
power capacity resources compared to the result absent RPM. Since the implementation of the RPM auctions in 2007, approximately 13,200 MWs of incremental capacity resources have offered into PJM’s RPM auctions. This incremental capacity includes 7,500 MWs of new capacity, 5,200 MWs of uprates to existing capacity resources, and 500 MWs of capacity from reactivated units.
With the 2007 implementation of PJM’s forward capacity market, demand resources can offer demand response as a forward capacity resource. Under this model, demand response providers can submit offers to provide a demand reduction as a capacity resource in the forward RPM auctions. If these demand response offers are cleared in the RPM auction, the demand response provider will be committed to provide the cleared demand response amount as capacity during the delivery year and will receive the capacity resource clearing price for this service.
2011 ISO/RTO Metrics Report280
PJM Demand Response Capacity as Percentage of Total Installed Capacity 2006-2010
12%
10%
8%
6%
4%
2%
0%
5.50%
20062007200820092010
Additional generation infrastructure investment savings is realized through the commitment of demand response
resources to provide reliability assurance. If reliability can be maintained through the commitment of demand
resources to reduce load during times of system peaks, the cost of building generation facilities to provide the
additional required capacity is avoided. The PJM RPM provides a mechanism by which generation, demand
response and transmission can compete on equal footing, thereby providing a transparent mechanism by which
demand response can participate in the capacity market. Through this mechanism, the quantity of demand response
that is providing capacity in the PJM footprint has increased by over 1,800 MW. The resulting avoidance of
infrastructure development represents savings to the region of approximately $275 million per year.
Percentage of Generation Outages Cancelled by PJM 2006-2010
1.00%
0.50%
0.00%
20062007200820092010
2011 ISO/RTO Metrics Report281
Less than one percent of planned generation outages were cancelled by PJM from 2006 through 2010. This low cancellation rate allows generation owners to complete maintenance as they have planned without incurring rescheduling costs or delays due to PJM cancellation.
PJM Generation Reliability Must Run Contracts 2006-2010
PJM did not have any generating units under Reliability Must Run (RMR) contracts from 2006 through 2008. During 2009, PJM placed one 383 MW nameplate capacity generation station under an RMR that is scheduled to expire during 2012. No additional units were placed under RMR contracts in 2010.
2011 ISO/RTO Metrics Report282
Interconnection / Transmission Service Requests
PJM Number of Study Requests 2006-2010
500
450
400
350
300
250
200
150
100
50
0
20062007200820092010
PJM Number of Studies Completed 2006-2010
700
600
500
400
300
200
100
0
20062007200820092010
2011 ISO/RTO Metrics Report283
PJM Average Aging of Incomplete Studies 2006-2010
(calendar days)
800
700
600
500
400
300
200
100
0
20062007200820092010
PJM Average Time to Complete Studies 2006-2010
(calendar days)
800
700
600
500
400
300
200
100
0
20062007200820092010
From 2006 through 2010, PJM received approximately 1,400 study requests from companies interested in adding new generation or upgrading current generation output in the PJM region. On average, approximately 12percent -
15percent of megawatts from potential projects result in the execution of an interconnection service agreements for new generating capacity. So, over 80 percent of the studies completed by PJM relate to potential projects that
withdraw from the generation interconnection queue.
2011 ISO/RTO Metrics Report284
A large number of those study requests were geographically concentrated in the western part of the PJM region with
an increasing number of the potential developers investigating the use of storage technologies such as batteries,
flywheels and compressed air, as well as wind and solar fuel sources. In terms of megawatts of potential new
generating capacity, more than 40 percent of PJM’s year-end 2010 interconnection queues relates to potential wind
or solar plants. It is significant to note that the total potential new generating capacity active in PJM’s year-end 2010
interconnection queues represents nearly 40 percent of the year-end 2010 generating capacity installed in the PJM
region.
PJM improved the time to complete studies from 2006 through 2010, as represented by the more than 45 percent reduction in average time to complete studies during that period. Further, the 2009 and 2010 study times have
average four months from study request to delivery of completed studies. At the same time, the average age of incomplete studies has actually increased. The decreasing number of incomplete studies represents older study requests that are concentrated in areas of the PJM region where transmission system complexity and study data availability have delayed completion of the feasibility portion of the study process. PJM has reduced the number of incomplete studies significantly in the past few years.
PJM’s generation interconnection process includes three potential types of studies - feasibility studies, system
impact studies and facility studies. Feasibility studies assess the practicality and cost of transmission system
additions or upgrades required to accommodate the interconnection of the generating unit or increased generating capacity with the transmission system. System impact studies provide refined and comprehensive estimates of cost responsibility and construction lead times for new transmission facilities and system upgrades that would be required to allow the new or increased generating capacity to be connected to the transmission system in the PJM region. Facility studies develop the transmission facilities designs for any required transmission system additions or
upgrades due to the interconnection of the generating unit or increased generating capacity. PJM has had no formal complaints regarding the interconnection processes in recent years.
The table below reflects the average costs incurred by PJM for each type of generation interconnection study. These costs are billed to and collected from the entities requesting each type of study, not from PJM’s administrative costs charged to its members.
Average Cost of Each Type of Study
20062007200820092010
Feasibility Studies$4,121$4,538$3,514$4,057$3,728
System Impact Studies$10,537$11,224$10,263$14,406$10,841
Facility Studies$29,458$28,635$66,648$54,380$44,829
PJM’s average costs incurred for feasibility and system impact studies have not varied materially in the past five
years. The complexity of each proposed generation project impacts primarily the costs of completing facility studies,
the average cost of which has varied accordingly in the past five years.
2011 ISO/RTO Metrics Report285
PJM Interconnection / Transmission Service Request Future Enhancement:
During 2011, PJM plans to continue its focus on process improvements to reduce both the number of
incomplete generation interconnection studies and the average aging of such incomplete studies.
Special Protection Schemes
PJM Number of Special Protection Schemes 2010
100
90
80
70
60
5045
40
30
20
10
0
There are 45 Special Protection Schemes (SPSs) in place in the PJM region. These SPSs are automatic protection
systems designed to maintain system reliability by detecting abnormal or predetermined system conditions and
isolating selected equipment. All SPSs in the PJM region must be reviewed and approved by PJM to ensure they
support all applicable reliability standards. Those SPSs are established throughout the PJM region as a source of
automatic system protection that is in addition to the manual system adjustments available to PJM system operators.
In PJM, there were no misoperations of SPSs during 2010. There were no intended or unintended activations of SPSs during 2010.
2011 ISO/RTO Metrics Report286
B. PJM Coordinated Wholesale Power Markets
For context, the table below represents the split of the $34.8 billion dollars billed by PJM in 2010 into the primary types of charges its members incurred for their transactions.
(dollars in millions)2010 Dollars Billed
Energy Markets$ 17,319
Capacity9,626
Transmission Losses1,635
Transmission Congestion1,502
Transmission Service1,485
FTR Auction Revenues1,312
Operating Reserves622
Transmission Enhancement284
Regulation Market250
Reactive Supply241
PJM Administrative Expenses186
Other 308
Percentage of 2010
Dollars Billed
50%
28%
5%
4%
4%
4%
2%
1%
1%
1%
1%
1%
Total$ 34,770100%
PJM has conducted an annualized, production cost analysis of the savings attributable to operating a single footprint compared to operation of the previously independently operated control areas. As is typical in such analyses, hurdle rates were utilized to simulate the ability of these independent control areas to transact with the remainder of the footprint without the benefit of a centrally operated dispatch. Based on this analysis, the energy production cost impact of the expanded PJM RTO operation is between $240 million and $345 million per year. PJM also has
enhanced the efficiency of its dispatch since these integrations. The benefits of this enhanced efficiency are realized in reduced make-whole payments to generators known as Balancing Operating Reserve costs. Reduction in these costs has resulted in additional savings exceeding $100 million per year.
In addition to the production cost benefit of operating the larger footprint, the transparent price signals produced by
the operation of the LMP energy market enable demand response to actively participate and compete directly with
generation. Because the value of energy is made transparent in real time, demand responders that otherwise would
have no incentive to reduce demand can do so in response to real time prices, thereby competing directly with
generation resources. This ability, although difficult to quantify as an annual average value, has the effect of reducing
the cost to all load by reducing real-time prices, most particularly during times of high system demand.
2011 ISO/RTO Metrics Report287
PJM maintains synchronized reserve in the amount of the largest single contingency in the entire RTO footprint and procures regulation from the most cost-efficient resources across the entire footprint. The savings attributable to the procurement of these services utilizing a market mechanism that spans the RTO footprint is between $80 million and $105 million per year.
Demand response resources are eligible to participate in PJM’s Regulation and Synchronized Reserve Markets.
Through the end of 2010, demand response resources have not yet participated in the PJM regulation market. During
2010, demand side responders earned more than $530 million through PJM energy, capacity and ancillary services
markets.
PJM Demand Response as a Percentage of Synchronized Reserve Market 2006-2010
12%
10%
8%
6%
4%
2%
0%
2006
2011 ISO/RTO Metrics Report
5.69%
2007200820092010
288
Market Competitiveness
Note: The data in this Market Competitiveness section was obtained from the 2006 - 2010 State of the Market Reports issued by PJM‟s independent market monitor.
PJM Energy Market Price Cost Markup 2006-2010
15%
10%
5%
0%
-5%
-10%
-15%
20062007200820092010
The overall results support the conclusion that prices in PJM are set, on average, by marginal units operating at or
close to their marginal costs. This is strong evidence of competitive behavior and competitive market performance.
The markup component of the overall PJM real-time, load-weighted, average LMP in 2010 was $0.31 per MWh, or
0.6 percent. Coal steam units contributed -$0.99 to the total markup component of LMP. Combustion turbine units
that use natural gas as their primary fuel source contributed $0.34 to the total markup component of LMP. Combined cycle units that use gas as their primary fuel source contributed $0.77 to the total markup component of LMP. The markup was $1.63 per MWh during peak hours and -$1.11 per MWh during off-peak hours.
A substantial portion of the 2007 markup occurred on high-load days during the summer of 2007. Markup on highload days is likely to be the result of appropriate scarcity pricing rather than market power. For reference, PJM’s annual 2007 load was 763 terawatt hours, which is the highest annual load ever served in the PJM region. These high usage volumes drove higher locational marginal prices (LMPs) and contributed to the higher 2007 energy
market price cost markup percentage.
2011 ISO/RTO Metrics Report289
PJM New Entrant Gas-Fired Combustion Turbine (CT) Net Generation Revenues 2006-2010
(dollars per installed megawatt year)
$150,000
$100,000
$50,000
$0
20062007200820092010
PJM New Entrant Gas-Fired Combined Cycle (CC) Net Generation Revenues 2006-2010
(dollars per installed megawatt year)
$150,000
$100,000
$50,000
$0
20062007200820092010
In 2010, energy market revenues were generally higher for new entrant combustion turbines and combined cycles, both using natural gas, as energy market prices increased more than the average delivered price of natural gas in most zones. Energy market net revenues for new entrant coal plants were substantially higher in all zones as energy market prices increased more than the average delivered price of low sulfur coal.
The net revenue results illustrate some fundamentals of the PJM wholesale power market. CTs are generally the
highest incremental cost units and therefore tend to be marginal in the energy market and set prices, when they run.
2011 ISO/RTO Metrics Report290
When this occurs, CT energy market net revenues tend to be low and there is little contribution to fixed costs. High demand hours result in less efficient CTs setting prices, which results in higher net revenues for more efficient CTs and other inframarginal units. All zones had more high demand days in 2010 than in 2009 and all zones showed a higher frequency of hours of real-time LMP greater than $200.
Market Concentration
Concentration ratios are a summary measure of market share, a key element of market structure. High concentration ratios indicate comparatively smaller numbers of sellers dominating a market, while low concentration ratios mean larger numbers of sellers splitting market sales more equally. High concentration ratios indicate an increased
potential for participants to exercise market power, although low concentration ratios do not necessarily mean that a market is competitive or that participants cannot exercise market power. Analysis of the PJM Energy Market indicates moderate market concentration overall. Analyses of supply curve segments indicate moderate concentration in the baseload segment, but high concentration in the intermediate and peaking segments.
Despite their significant limitations, concentration ratios provide useful information on market structure. The
concentration ratio used here is the Herfindahl-Hirschman Index (HHI), calculated by summing the squares of the market shares of all firms in a market. Hourly PJM Energy Market HHIs were calculated based on the real-time energy output of generators, adjusted for hourly net imports by owner.
Actual net imports and import capability were incorporated in the hourly Energy Market HHI calculations because
imports are a source of competition for generation located in PJM. Energy can be imported into PJM under most
conditions. The hourly HHI was calculated by combining all export and import transactions from each market
participant with its generation output from each hour. A market participant’s market share increases with imports and decreases with exports. Hourly HHIs were also calculated for baseload, intermediate and peaking segments of
generation supply. Hourly Energy Market HHIs by supply curve segment were calculated based on hourly Energy
Market shares, unadjusted for imports.
2011 ISO/RTO Metrics Report291
PJM Average Hourly Energy Market HHI 2006-2010
3,000
2,500
2,000
1,500
1,000
500
0
20062007200820092010
The ―Merger Policy Statement‖ of the Federal Energy Regulatory Commission states that a market can be broadly
characterized as:
•Unconcentrated. Market HHI below 1000, equivalent to 10 firms with equal market shares;
•Moderately Concentrated. Market HHI between 1000 and 1800; and
Highly Concentrated. Market HHI greater than 1800, equivalent to between five and six firms with equal
market shares.
The aggregate market structure was evaluated as competitive because the calculations for hourly HHI (HerfindahlHirschman Index) indicate that by the FERC standards, the PJM Energy Market during 2010 was moderately
concentrated. Based on the hourly Energy Market measure, average HHI was 1185 with a minimum of 942 and a maximum of 1599 in 2010.
2011 ISO/RTO Metrics Report292
PJM Real-Time Energy Market Percentage of Unit Hours Offer Capped due to Mitigation 2006-2010
3%
2%
1%
0%
20062007200820092010
Noncompetitive local market structure is the trigger for offer capping. PJM applied a flexible, targeted, real-time
approach to offer capping (the three pivotal supplier test) as the trigger for offer capping in 2010. PJM offer caps units only when the local market structure is noncompetitive. Offer capping is an effective means of addressing local
market power. Levels of offer capping for local market power remained low. In 2010, 1.2 percent of unit hours and 0.4 percent of MW were offer capped in the Real-Time Energy Market and 0.2 percent of unit hours and 0.1 percent of MW were offer capped in the Day-Ahead Energy Market.
The three pivotal supplier test is applied whenever incremental relief is needed to solve a transmission constraint, but not all tested providers of effective supply are eligible for capping. Only uncommitted resources, which would be started to solve the constraint, are eligible to be offer capped. Only a small portion of the three pivotal supplier tests resulted in offer capping. For example, of all the tests applied to the regional 500 kV constraints, no more than seven percent of the tests for any constraint resulted in offer capping.
The analysis of the application of the three pivotal supplier test to local markets demonstrates that it is working
successfully to offer cap pivotal owners when the market structure is noncompetitive and to ensure that owners are not subject to offer capping when the market structure is competitive.
2011 ISO/RTO Metrics Report293
Market Pricing
PJM Average Annual Load-Weighted Wholesale Energy Prices 2006-2010
($/megawatt-hour)
$100
$90
$80
$70
$60
$50
$48.34
$40
$30
$20
$10
$0
20062007200820092010
The PJM average load-weighted wholesale energy prices varied during the 2006 - 2010 period due in part to
variances in underlying fuel costs and also due to a 4.7 percent increase in usage in 2010 compared with 4.6 percent lower customer demand in 2009.
The summer of 2010 was one of record heat. While no individual day marked a new electricity demand peak, the
aggregate impact was significant. Records were set for overall energy usage in the PJM region during June and July. There were 38 days with Hot Weather Alerts issued in 2010 for some or all of the RTO, compared with 15 in 2009 and 16 in 2008. These weather conditions contributed to significantly higher loads in 2010. The corresponding
change in the 2010 average annual load-weighted wholesale energy price exemplifies the strong correlation between locational marginal prices and market fundamentals such as fuel prices and demand.
For example, approximately 72 percent of the 2008 to 2009 reduction in wholesale electricity prices in the PJM region was due to fuel cost decreases, while the remaining 28% of the reduction was due to lower customer demand. In
nominal terms, that means the fuel cost reductions from 2008 to 2009 led to a 32 percent decrease in wholesale
electricity prices in the PJM region, while lower demand contributed an additional 13 percent reduction in wholesale electricity prices in the PJM region.
2011 ISO/RTO Metrics Report294
Conservation during heat waves not only stretches power supplies, it saves money. PJM estimates that total power
costs were $175 million less during summer 2010 due to demand response. Reductions in electricity use during the
early August 2006 heat wave produced price reductions estimated to be equivalent to more than $650 million in
payments for energy for the week. Customers in the 13-state PJM region set a new record for power consumption of
144,796 megawatts on August 2, 2006. On that day alone, voluntary reductions in electricity use through demand
response resulted in price reductions estimated to be equivalent to more than $230 million in payments for energy.
Voluntary curtailments through PJM’s Demand Response program reduced wholesale energy prices by
approximately $12 per megawatt hour during the highest usage hours in summer 2010 and by more than $300 per megawatt hour during the highest usage hours in early August 2006. While many wholesale customers, such as utilities, were hedged against high real-time spot-market prices, all customers benefit from the dramatic price
reductions because future longer-term electricity sales are based on prices set in the real-time market, where prices were lower as a result of demand response.
The chart below from the U.S. Energy Information Administration is a visual representation of the fuel cost inputs from 2006 - 2010 that influenced the energy prices in the PJM region. The consistency in the trends between the preceding chart and several of the fuel cost trends on the chart on the following page are significant, because they illustrate the high correlation between wholesale energy prices and underlying fuel costs.
U.S. Nominal Fuel Costs 2006-2010
($ per million Btu)
$25
$20
$16.59
$15
$12.56
$10
$5$5.08
$2.26
$0
20062007200820092010
CoalNatural GasResiduel Fuel OilDistillate Fuel Oil
Source: U.S. Energy Information Administration, Independent Statistics and Analysis. ―Table 2. U.S. Energy Prices, EIA/Short-
Term Energy Outlook—June 2011,‖ http://www.eia.gov/emeu/steo/pub/2tab.pdf.
2011 ISO/RTO Metrics Report295
PJM Average Annual Load-Weighted
Fuel-Adjusted Wholesale Spot Energy Prices 2006-2010
($/megawatt-hour)
$100
$90
$80
$70
$60
$50
$40
$30
$23.87
$20
$10
$0
20062007200820092010
For the five-year period ended December 31, 2010, the load-weighted fuel-adjusted wholesale spot energy prices in the PJM region have decreased 17 percent from $28.82 to $23.87. The trend in these fuel-adjusted prices reflects the shifts in demand - increases in 2010 driven primarily by weather and lower demand in 2008 and 2009 that
resulted from both the economic downturn and mild weather patterns those two years.
Fuel prices and demand are the primary drivers of electricity prices. Fuel prices in 2010 were generally slightly higher for the marginal fuels in the PJM footprint. This rise in fuel prices has a corresponding impact on prices.
PJM’s base year for fuel cost references is 1999 as this is the first full year that PJM administered both spot and dayahead energy prices.
2011 ISO/RTO Metrics Report296
PJM Wholesale Power Cost Breakdown
($/megawatt hour)
$120
RTO Cost & Regulatory Fees
$100
$80
$58.37
$60
$40
$20
$0
2006
$84.66
$70.98
$55.31
200720082009
Operating Reserves Ancillary Services Transmission
$66.15Capacity
Energy
2010
The 2010 wholesale power costs of $66.15/MWh are slightly below the 2005 costs of $68.78/MWh. This observation
is remarkable for two reasons: 1) in 2005 there was essentially no capacity market component to wholesale costs;
and 2) electricity demand was higher in 2010 than in 2005 even in spite of the deep recession. While wholesale
market costs were higher during the 2007-2008 period - leading up to and during the first part of the recent recession
- the increase in wholesale power cost was due to increasing energy market prices driven by growing demand and increasing natural gas prices.
On an annual basis, energy costs have comprised 70 - 90 percent of PJM’s total wholesale power costs for the past five years. PJM implemented its three-year forward capacity market, the Reliability Pricing Model (RPM), in 2007. Capacity revenues earned through RPM are netted against the energy cost component of total power costs per megawatt hour. If combined, the energy plus capacity components represent more than 90 percent of total power costs per megawatt hour for each of the five years in the period 2006 - 2010.
And, as noted previously, fuel costs drive approximately 70 percent of wholesale electricity price changes in the PJM region. So, it is again logical that the trends in total wholesale power costs in the PJM region have moved
consistently with fuel cost trends.
All other components of PJM’s wholesale power cost per megawatt hour, exclusive energy and capacity, account for less than 10 percent of the total costs per megawatt hour. In particular, the operating reserve costs (sometimes
referred to as uplift) have been less than $1.00 per megawatt hour of the total wholesale power cost in the PJM
region. In 2006 through 2010, such uplift costs averaged less than one percent of the total wholesale power cost per megawatt hour during that five-year period.
2011 ISO/RTO Metrics Report297
Unconstrained Energy Portion of System Marginal Cost
PJM Annual Average Non-Weighted, Unconstrained
Energy Portion of the System Marginal Cost 2006-2010
$100
$90
$80
$70
$60
$50
$40
$30
$20
$10
$0
20062007200820092010
The unconstrained energy portion of system marginal cost is the marginal price of maintaining power balance in the
economic dispatch in the PJM region ignoring transmission limitations. This trend chart reflects the annual average
marginal price of energy across the PJM region over all hours. The trend closely follows the trend of aggregate fuel
prices from 2006 through 2010, which illustrates the fact that marginal energy price fluctuations are primarily driven
by fuel prices.
2011 ISO/RTO Metrics Report298
Energy Market Price Convergence
PJM Day-Ahead and Real-Time Energy Market Price Convergence 2006-2010
$3.50
$3.00
$2.50
$2.00
$1.50
$1.00
$0.50
$0.00
20062007200820092010
PJM Percentage of Day-Ahead and Real-Time Energy Market Price Convergence
2006-2010
100%
80%
60%
40%
20%
0%
20062007200820092010
PJM’s nominal difference between day-ahead and real-time prices was highest in 2007 when there was greater
volatility in real-time prices, reflecting high constraint levels in fall 2007 when weather remained hot in the PJM region as the fall transmission maintenance season commenced. However, the percentage of day-ahead and real-time price convergence in the PJM electricity markets averaged over 98 percent from 2006 through 2010.
To improve reliability and reduce potential competitive seams issues, PJM and its neighbors have developed, and
continue to work on, joint operating agreements. These agreements are in various stages of development and
include a reliability agreement with the NYISO and an implemented operating agreement with the MISO. One
objective of such interregional coordination agreements is the harmonization of border prices. Price convergence
2011 ISO/RTO Metrics Report299
between PJM’s and bordering region’s wholesale competitive market prices is one data point to assess the effectiveness of these agreements.
In 2010, the average price difference between the PJM/MISO Interface and the MISO/PJM Interface was consistent
with the direction of the average flow. In 2010, the PJM average hourly Locational Marginal Price (LMP) at the
PJM/MISO border was $33.33 while the MISO LMP at the border was $33.90, a difference of $0.57, while the
average hourly flow in 2010 was -918 MW. (The negative sign means that the flow was an export from PJM to MISO,
which is consistent with the fact that the average MISO price was higher than the average PJM price.) However, the
direction of flows was consistent with price differentials in only 42 percent of hours of 2010. While the average hourly
LMP difference at the PJM/MISO border was only $0.57, the average of the absolute value of the hourly difference
was $11.64.
In 2010, the relationship between prices at the PJM/NYIS Interface and at the NYISO/PJM proxy bus and the
relationship between interface price differentials and power flows continued to be affected by differences in
institutional and operating practices between PJM and the NYISO. In 2010, the average price difference between
PJM/NYIS Interface and at the NYISO/PJM proxy bus was not consistent with the direction of the average flow. In
2010, the PJM average hourly LMP at the PJM/NYISO border was $47.64 while the NYISO LMP at the border was
$44.69, a difference of $2.95, while the average hourly flow was -722 MW. (The negative sign means that the flow
was an export from PJM to NYISO, which is not consistent with the fact that the average PJM price was higher than
the average NYISO price.) The direction of flows was consistent with price differentials in only 49 percent of the
hours. While the average hourly LMP difference at the PJM/NYISO border was only $2.95, the average of the absolute value of the hourly difference was $14.74.
2011 ISO/RTO Metrics Report300
Congestion Management
PJM Annual Congestion Costs per Megawatt Hour of Load Served 2006-2010
$10
$8
$6
$4
$2
$0
20062007200820092010
Congestion costs in the PJM region are influenced by weather, energy prices and available transmission system capacity. Increased demand from warmer weather and a combination of planned and unplanned transmission outages led to higher congestion costs per megawatt hour of load served during 2010.
PJM’s Regional Transmission Expansion Plan (RTEP) includes several extra high voltage transmission lines that will increase the available transmission system capacity in the PJM region. In the aggregate, those transmission lines could alleviate 90% of the current congestion costs in the PJM region.
To address the need for long-term transmission rights, PJM added a stage to its FTR market. In stage 1A of the allocation process, each network service user may request auction revenue rights (ARRs) for a term covering 10 consecutive PJM planning periods. ARRs allocated in stage 1A will be modeled in a 10-year analysis in which a zonal growth rate will be applied and anticipated ARR allocation increases will be determined. If during any year of this 10-year analysis it is determined that the anticipated ARRs will not be feasible, then PJM will recommend transmission upgrades into the PJM RTEP to ensure the 10-year feasibility of stage 1A ARRs.
2011 ISO/RTO Metrics Report301
PJM Percentage of Congestion Dollars Hedged Through PJM’s Congestion Management Markets 2006-2010
100%
80%
60%
40%
20%
0%
20062007200820092010
PJM’s financial transmission rights (FTR) are financial instruments that entitle the holder to a stream of revenues (or charges) based on the hourly congestion price differences across a transmission path in the Day-Ahead Energy Market. FTRs provide a hedging mechanism that can be traded separately from transmission service. Market
participants are able to hedge against their congestion costs by acquiring FTRs that are consistent with their energy deliveries. Participants use PJM’s FTR market tool to post their FTRs for bilateral trading as well as to participate in the scheduled monthly, annual and long-term (three-year) FTR auctions.
During the calendar year 2010, FTR revenue adequacy was 88 percent. These 2010 FTR market results differ significantly from the historical norm; the four-year period 2006-2009 attained average FTR revenue adequacy at more than 99.5 percent. Analysis undertaken by PJM showed several elements that contributed to the recent FTR revenue inadequacy. The leading causes of 2010 FTR revenue inadequacy are both from planned and unplanned transmission outages which account for almost 70 percent of the revenue inadequacy in total. Breaking down the outages, construction outages in excess of two months account for only 17 percent of the revenue shortfall while construction and maintenance outages less than two months account for 40 percent of the revenue shortfall, and unplanned de-ratings or outages account for 12 percent of the shortfall.
2011 ISO/RTO Metrics Report302
Resources
Balancing customer demand and available resources can be achieved by a combination of changing generation
output and/or reducing the total customer demand. The charts and discussion below reflect PJM’s history with the
availability of generation and demand response resources when called upon by PJM to revise output or usage levels.
PJM Annual Generator Availability 2006 - 2010
100%
95%
92.80%
90%
85%
80%
20062007200820092010
Generator availability in the PJM region has been strong during the last five years. Older coal-fired generating units in the PJM region have had decreased availability approximately one percent in the past few years. These units have
run less frequently based on their costs, and investments in upgrades to those units have become challenging
financial decisions for their owners in light of the uncertainty over the impact on those units of future state and federal environmental legislation.
The incentives provided by PJM’s transparent, single clearing price energy market have directly resulted in improved generator performance and reduced outage rates, further decreasing the required reserve margin. The PJM average forced outage rate has decreased over two percent since the initiation of the PJM locational marginal pricing (LMP) energy market in 1998. Multiplying the megawatts of reduced reserve margin times the cost of installing the
additional capacity that would be required absent centralized dispatch and the improved generator availability yields a savings of between $366 million and $900 million each year.
2011 ISO/RTO Metrics Report303
PJM Annual Demand Response Availability 2006 - 2010
125%
100%
75%
50%
25%
0%
121%
20062007
2008 2009
118%
99%
2010
Historically, load serving entities in PJM have had the ability to meet their capacity requirements through the
commitment of demand side resources. With the advent of the Reliability Pricing Model, demand side resources are
able to participate in the capacity procurement process as either demand resources or interruptible load for reliability.
The 2010 availability percentage reflects the aggregate actual demand response providers’ performance for the six load management events during 2010. The aggregate load reductions of 4,652 MWs during these 2010 load
management events resulted in approximately $175 million of savings in the energy costs that would have occurred absent the demand response providers’ load reductions.
PJM was awarded the 2010 ―Project of the Year‖ from POWERGRID International Magazine in conjunction with software vendor UISOL for the demand response integration solution, eLoadResponse. This application allows standardization of data interface across the industry
The 2009/2010 delivery year marked the first time PJM required demand side providers to test their capability to
deliver the reductions committed to meet capacity requirements. The test results for the 2009/2010 deliver year
demonstrate that in aggregate, committed demand side resources performed at 118 percent of their committed
capacity values.
The 2006 Demand Response Availability represents the actual response PJM received when PJM called on demand resources in August 2006.
2011 ISO/RTO Metrics Report304
PJM Demand Response Future Enhancements:
In 2007 and 2008, PJM worked collaboratively with its members and regulators to identify a Demand Response (DR) Roadmap of the opportunities for the evolution of DR resource participation in PJM. The DR Roadmap for the PJM region includes potential improvements in the following areas: dispatch, data management, settlement , incorporation in the planning process, and forward price signals.. The next steps in PJM DR Roadmap include:
Shortage Pricing: In June 2010, PJM filed with the FERC its proposal for a new shortage pricing method for
reserve shortages to meet the FERC’s Order 719 requirements for competitive wholesale markets. The
filing, authorized by the PJM Board, came after a lengthy stakeholder process could not reach a consensus.
The goal of shortage pricing is to have prices that reflect actual system conditions when operating reserves
are short in order to balance supply and demand, while keeping needed reserves available to ensure
reliability.
The proposal includes the creation of a new 10-minute nonsynchronized reserve market and real-time joint optimization of energy and reserves. PJM would simultaneously price energy and reserves every five
minutes, instead of only energy.
Reserve shortages are rare in PJM; shortage pricing under the PJM proposal would have applied in only 28 hours during the past five years.
Price Responsive Demand: In the case of price responsive demand (PRD), which PJM views as the next
phase in demand response’s evolution, PJM and its stakeholders have been working through the complexities of designing business rules to help make price responsive demand a reality.
Price responsive demand would enable load-serving entities and state regulators to develop innovative retail
electric rates so that consumers at the retail level − homeowners and small businesses − will be able to
―see‖ varying wholesale price impacts in their retail rates. And they will be able to respond if the price is high
by cutting their usage to reduce their energy costs or shifting usage to times when prices are low.
By connecting wholesale prices to the retail electricity rates consumers pay, there will be a direct incentive -
saving money on their electric bills - for them to act, helping PJM and its members control peak demand and also fill the valley periods to enhance system utilization. This ability to respond will be even more
valuable as new wind energy projects and plug-in hybrid electric vehicles connect to the grid.
In addition to the wholesale market issues PJM is addressing, PRD requires action in the states to
implement so-called dynamic retail rates, which will vary with the time of use. The other essential element to
the implementation of PRD is the widespread installation of smart meters by member utilities. These
intelligent meters record usage hourly instead of monthly and, with their two-way communication capability
and real-time price signals, can be programmed with automatic usage reductions based on the price signals
they receive.
2011 ISO/RTO Metrics Report305
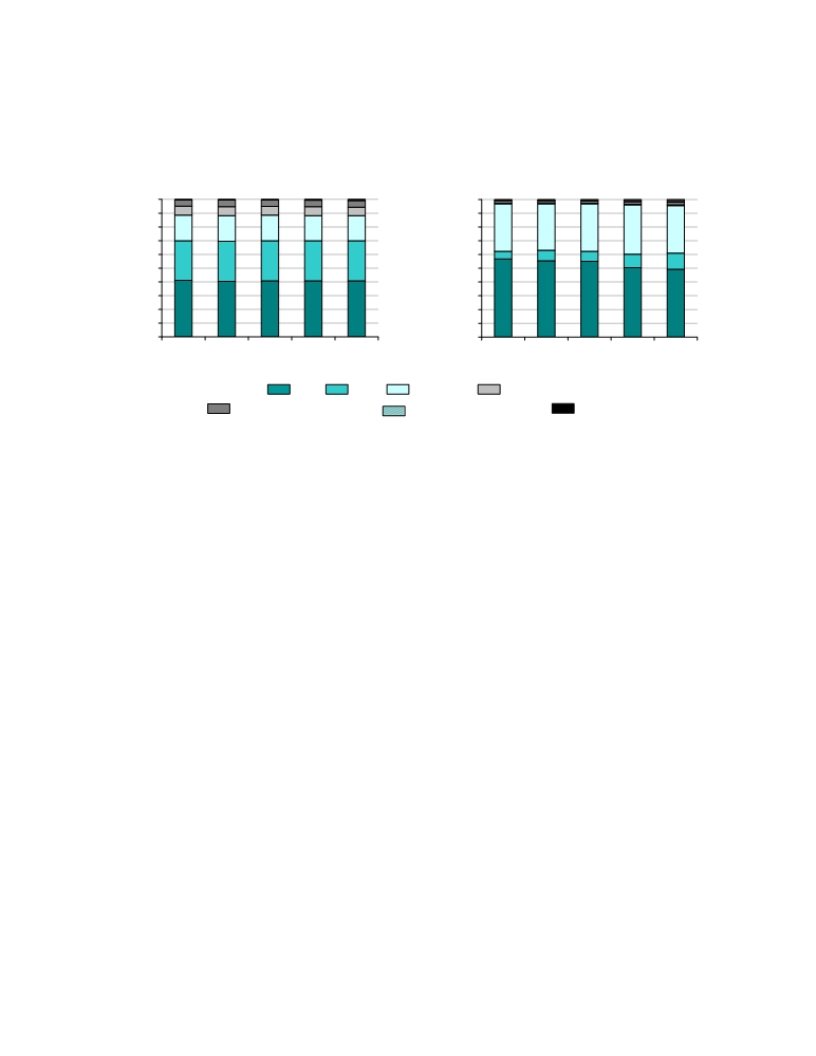
Fuel Diversity
PJM Fuel Diversity 2006-2010
Installed CapacityGeneration Output
100%100%
90%90%
80%80%
70%70%
60%60%
50%50%
40%40%
30%30%
20%20%
10%10%
0%0%
2006200720082009201020062007200820092010
CoalGasNuclearOil
Hydro and RenewablesGas/Oil Combined CycleOther
The installed generating capacity in the PJM region is roughly 40 percent coal, 30 percent gas and 20 percent
nuclear. However, based on the costs of running the generators in the PJM region, security-constrained economic dispatch actually results in the energy for the PJM region being comprised of 50 - 65 percent coal, 20 - 35 percent nuclear, 5 - 10 percent gas and less than 10 percent from all other fuel sources.
Generation in the PJM footprint does not typically encounter issues around fuel availability or deliverability. PJM has identified approximately 12,000 to 19,000 MW of coal-fired generation that may be at risk of retirement due to
potential environmental policy considerations. This range of potential generation at risk represents 7 - 12 percent of the installed generation capacity in the PJM region. PJM is examining the issue so that reliability may continue to be maintained at the lowest possible cost.
PJM’s RTEP process continues to address the need to strengthen the nation’s electrical grid to accommodate the retirement of generating resources not able to meet environmental regulations, including those regarding NOX, SOX, CO2 emissions and water quality. Whether taken individually, or addressing their collective impact all such policy decisions necessarily impact transmission planning decisions.
At-risk generators face the real possibility of deactivation given the economic impacts of such factors as increasing operating costs associated with unit age (some more than 40 years old) and changing environmental public policy, particularly with regard to carbon emissions and water quality.
Costs related to a range of factors drive the ability of a plant to reap consistent revenue streams from PJM’s energy, capacity and ancillary service markets. In addition to the issues raised by public policy and aging units, a potential atrisk indicator is a plant’s inability to clear an RPM capacity auction given its costs compared to other resources
offered into the auction, such as:
2011 ISO/RTO Metrics Report306
other more efficient plants renewable energy resources demand resources
energy efficiency programs
Even with the additional revenue stream provided by RPM, generating resources may still be revenue-deficient given higher capital costs or operating and maintenance costs.
2011 ISO/RTO Metrics Report307
Renewable Resources
PJM Renewable Megawatt Hours as a Percentage of Total Energy 2006-2010
20%
15%
10%
5%
0%
20062007200820092010
PJM Renewable Megawatts as a Percentage of Total Capacity 2006-2010
20%
15%
10%
5%
0%
20062007200820092010
2011 ISO/RTO Metrics Report308
PJM Hydroelectric Megawatt Hours as a Percentage of Total Energy 2006-2010
20%
15%
10%
5%
0%
20062007200820092010
PJM Hydroelectric Megawatts as a Percentage of Total Capacity 2006-2010
20%
15%
10%
5%
0%
20062007200820092010
Energy and installed capacity contributions from renewable fuel has been growing in the PJM region in the past few years, with tens of thousands of megawatts of potential renewable capacity currently being studied for potential future construction. Installed hydroelectric capacity in the PJM region has not changed materially in the past few years and there are few hydroelectric plants under consideration by generation developers.
During 2010, PJM’s commitment to enabling renewable resources was demonstrated by:
•Successfully integrating 1,507 megawatts (MWs) of new generation, including 1,032 MWs of new wind
generation and 21 MWs of solar generation;
2011 ISO/RTO Metrics Report309
•The continued trend of increasing renewable and demand resources in competitive wholesale markets,
with Reliability Pricing Model (RPM) auction procuring 9,282 MWs of demand response, 679 MWs of
energy efficiency and 590 MWs of wind and solar energy for 2013 - 2014;
•Issuing a white paper on Wind Farm Communications; and
•Approving a communications data standard for wind farms.
Further, during 2010, PJM modified the PJM Tariff to require all resources that are physically capable, to be
dispatchable between their Capacity Interconnection Rights (CIR) and Maximum Facility Output (MFO). This provides PJM Dispatch the flexibility to maintain transmission and balancing authority system control via electronic dispatch as opposed to manual dispatch instructions. This flexibility is especially important when there is an increase in
intermittent resources, such as wind, and the transmission system is only reinforced to a generator’s Capacity
Interconnection Rights, which may be a small portion of the generator’s overall Maximum Facility Output. This PJM Tariff change enhances system reliability and market efficiency by better utilizing PJM automated systems to
electronically dispatch resources while ensuring proper price signals.
PJM’s operating, planning and market rules enable the incorporation of renewable resources into the electric system
in the PJM region and into the markets administered by PJM. As of December 31, 2010, PJM had over 64,000 MWs
of proposed new generation under consideration in its interconnection queues, including nearly 42,000 MWs of wind
generation. At the same time, there were 4,491 MWs of nameplate wind generation in operation at 43 facilities, and
2,909 MWs under construction. In addition, there are 67 MW of solar on line at eight facilities in the PJM region.
Renewable resources offer into the PJM markets and are subject to security constrained economic dispatch, just as
any other generating resource. Renewable resources like wind tend to bid in at zero cost or a negative cost, and this
value is considered when economically dispatching units for reliability reasons. In the aggregate, wind resources in
the PJM region have a 13 percent capacity factor, and solar resources in the PJM region have a 38 percent capacity
factor.
The Renewable Energy Dashboard at www.green.pjm.com illustrates a user-friendly snapshot of the amount and
type of generation that currently provides power to the 58 million people in the PJM region. The dashboard also features a map indicating where proposed renewable energy projects are planned and a summary of how much electricity has been produced by renewable sources since 2005.
The amount of renewable energy proposed changes throughout the year as new projects are added and some are
withdrawn from the process. The dashboard reflects PJM’s on-going commitment to examine energy-related issues
and provide information as it relates to the power grid and wholesale power market to help inform public policy
discussions.
2011 ISO/RTO Metrics Report310
C. PJM Organizational Effectiveness
Administrative Costs
PJM Annual Actual ISO/RTO Costs as a Percentage of Budgeted Costs 2006-2010
Non-Capital CostsCapital Recovery Costs
140%140%
120%120%
100%100%
80%80%
60%60%
40%40%
2006200720082009201020062007200820092010
Budget$175$178$177$172$185Budget$55$34$17$19$43
Bars Represent % of Actual Costs to Approved Budgets; Dollar Amounts Represent Approved Budgets (in millions)
PJM’s actual total costs for 2006 through 2010 averaged 90 percent of the approved budgets, without exceeding the total approved budget in any of those years. As represented in the chart below, PJM’s 2006 through 2010 costs were primarily comprised of compensation, non-employee labor and technology expenses. These cost components are
consistent with a service organization that utilizes significant people, hardware, software and telecommunications
resources to serve its customers.
9%
3%
10%
53%
11%
14%
CompensationNon-Employee Labor Technology
OtherIncome TaxesDepreciation/Interest
2011 ISO/RTO Metrics Report311
PJM develops its annual expense and capital budget in consultation with the PJM Finance Committee. The PJM
Finance Committee is comprised of two member representatives elected by each of the five member voting sectors plus two members of the PJM Board of Managers. PJM’s Chief Financial Officer acts as the non-voting chair of the PJM Finance Committee. PJM’s Finance Committee reviews and provides feedback on PJM’s preliminary expense and capital budgets during August each year. Then, after PJM management incorporates feedback, the sector-
elected representatives to PJM’s Finance Committee issue a written recommendation letter to the PJM Board of
Managers on the subsequent year’s proposed expense and capital budgets. The PJM Board of Managers includes these recommendations in their consideration of the proposed expense and capital budgets no later than October 31 of the year prior to which the proposed budgets apply.
PJM’s annual expense and capital resource allocations are based on its service obligations to its members and new initiatives, regulatory directives, industry standards and market rules to be implemented. Prior to the PJM Board of Managers considering the proposed expense and capital budgets, the proposed initiatives and projects are reviewed with several stakeholder committees to ensure the alignment of priorities between the proposed budget resource allocations and the annual plans for those stakeholder committees.
In addition to the recurring review and recommendations on the annual proposed expense and capital budgets, the
PJM Finance Committee meets at least quarterly to discuss actual costs compared with approved budgets and the
most recent forecast of expenses and capital expenditures for the current year. The PJM Finance Committee is also
consulted and asked to provide recommendations regarding (a) proposed multi-year capital projects estimated to
cost $25 million or more, and (b) any potential changes to PJM’s administrative cost recovery and rates in its Tariff.
PJM recovers its administrative expenses through stated rates applicable to market participants’ transaction volumes, such as megawatt hours of load served, generation sold and FTRs held. PJM is not authorized to charge its
members rates higher than these stated rates without a FERC-approved rate filing. So, the stated rates act has longterm ceilings to how much PJM can charge members for the administrative costs of their transactions. If PJM’s actual costs are less than the revenues resulting from the application of the stated rates, then PJM refunds the difference to members on a quarterly basis.
PJM’s 2006, 2007and 2010 actual non-capital expenses did not vary materially from the approved non-capital budget for those years. PJM’s 2008 actual non-capital expenses were 17 percent lower than budget primarily due to lower consulting and contracting costs required during the development of PJM’s second control center and lower income tax expenses. In June 2009, PJM’s Board of Managers approved revisions to PJM’s postretirement medical plan resulting in a non-recurring $26 million income tax benefit which was the primary driver of the 20 percent variance in PJM’s actual and budgeted non-capital expenses. The variances in 2008 and 2009 lowered PJM’s administrative rate per MWhr of load served by about $0.04 compared with each year’s forecasted rates.
PJM’s capital recovery costs in the previous chart reflect depreciation and interest expense in each year, as PJM’s
Tariff stipulates that capital investments are recovered from PJM’s members after the related assets are placed in
service. PJM’s 2006 actual capital recovery costs were lower than budgeted for a few reasons - the lower 2005
actual capital spending, lower interest expense on lower than budgeted borrowing levels, and the shift of a few
2011 ISO/RTO Metrics Report312
capital projects from 2006 to 2007. PJM’s 2007 actual capital recovery costs were lower than budgeted due to lower interest expense due to lower borrowings required to fund PJM’s capital expenditures.
PJM’s 2008 actual capital recovery costs were 28 percent lower than budget due to the impact on depreciation and interest expense of the revised completion dates of certain projects such as the market settlement system
replacement and lower interest expense from lower borrowings than budgeted. PJM’s 2009 actual capital recovery costs did not vary significantly from its budgeted capital recovery costs.
The majority of the 2010 variance in capital recovery costs was due to a change in the go-live date of PJM’s second
control center. The 2010 budget had assumed those assets would go into service in latter 2010, but, during 2010, the
second control go-live date was revised to 2011 thus decreasing 2010 depreciation and interest expense. With the
completion of PJM’s second control center in 2011, PJM’s capital recovery costs are projected to increase from 2011
forward to reflect the depreciation and interest expenses associated with that approximate $165 million capital
investment.
PJM Annual Administrative Charges per Megawatt Hour of Load Served 2006-2010
($/megawatt-hour)
$1.10
$1.00
$0.90
$0.80
$0.70
$0.60
$0.50
$0.40
$0.30$0.26
$0.20
$0.10
$0.00
20062007200820092010
The administrative costs per MWh of load served data in the chart above should be reviewed in the context of the PJM annual load served noted in the table below.
ISO/RTO
PJM
2011 ISO/RTO Metrics Report
2010 Annual Load Served
(in terawatt hours)
745
313
PJM’s actual to budget variances in 2008 and 2009 lowered PJM’s administrative rate per MWh of load served by
about $0.04 compared with each year’s forecasted rates. Prospectively, PJM forecasts its annual administrative rates will be approximately $0.31 per MWh of load served as recovery of the investments in (1) a second control center and (2) new reliability and markets software and hardware commence in 2011.
Customer Satisfaction
PJM Percentage of Satisfied Members 2006-2010
100%
92%
80%
60%
40%
20%
0%
20062007200820092010
PJM’s stakeholder survey requests anonymous feedback to an independent firm on levels of satisfaction and
stakeholder value derived from numerous PJM functions. Based on survey takers’ self-selected description, PJM’s 2006 through 2010 satisfaction percentages have not differed significantly among member sectors, e.g. electric
distributors, end-use customers, generation owners, other suppliers and transmission owners. In the 2009 survey, the reliability management and billing functions received the highest satisfaction ratings with the communications and system planning areas demonstrating opportunities for improvement.
PJM implements action plans to address areas for which there are opportunities for improvement. In the past few
years, PJM has focused on feedback to improve stakeholder access to PJM information and stakeholder
communications with the PJM Board of Managers. For example, PJM and its members established the Liaison
Committee in 2007 to provide greater opportunities for direct communications between stakeholders and the PJM
2011 ISO/RTO Metrics Report314
Board of Managers. Also, in 2008, PJM redesigned its website to facilitate stakeholder access to information on operations, markets and stakeholder committee activity. In 2009 and 2010, PJM’s members responded with the highest value rating in PJM’s ten-year history of surveying its members.
PJM Customer Satisfaction Future Enhancements:
Based on feedback received during PJM’s 2010 customer satisfaction survey, PJM will implement the following improvements during 2011:
Long-Term System Planning:
- Regional Planning Process Task Force established as a member forum to address transmission
planning concerns, including impact of assumptions on outcomes
Communications with PJM Members:
- eCredit self-service module
- Reduce complexity and improve data and information grouping on PJM’s website and in emails
Billing Controls
ISO/RTO20062007200820092010
Unqualified SASUnqualified SASUnqualified SASUnqualified SASUnqualified SAS
PJM70 Type 2 Audit70 Type 2 Audit70 Type 2 Audit70 Type 2 Audit70 Type 2 Audit
OpinionOpinionOpinionOpinionOpinion
In 2010, PJM’s market settlement billing controls passed the stringent SAS (Statement on Auditing Standards) 70
Type 2 audit for the tenth consecutive year. In keeping with governance rules, such as those in the Sarbanes‐Oxley
Act of 2002, PJM’s SAS 70 report is designed to provide an understanding of its internal controls to the auditors of
the companies that use the organization’s services, i.e. PJM’s members. PJM’s internal controls and processes
related to all billing line items are included in the scope of testing completed during each twelve-month SAS 70 audit
period.
PJM focuses on the accuracy of both prices posted and amounts billed to ensure members can rely on prices for transacting and have confidence in the amounts included in their PJM invoices.
In the five years ended December 31, 2010, PJM reposted hourly energy prices once in 2006, twice in 2007
and five times each in 2008 and 2010. There were no energy price corrections in 2009. The energy price
corrections applied to either three or fewer pricing points or nine or fewer hours’ prices for each of the
affected days and prices were revised from 0.0001 percent to 6.43 percent for these hours. For the five-year
period ended December 31, 2010, PJM achieved 99.99996 percent energy price posting accuracy.
For the five-year period 2006 through 2010, PJM’s billing accuracy based on dollars of billing adjustments
divided by total dollars billed averaged 99.8 percent.
2011 ISO/RTO Metrics Report315
D. PJM Interconnection Specific Initiatives
Perfect Dispatch: PJM’s Perfect Dispatch metric provides a measure of PJM's performance in dispatching the
system in the most efficient manner possible and optimizing locational pricing as a reflection of the dispatch solution.
The objective of the Perfect Dispatch measure is to compare PJM's actual dispatch solution against the ideal case if
all system conditions, including actual electricity usage, had been known before the dispatch signals were sent to the
generators in the PJM region. From 2008 through 2010, PJM improved its generation dispatch sufficiently to reduce
cumulative generation production costs by $256 million, an amount that exceeds PJM’s annual administrative costs.
Credit Risk Management: During 2010, PJM asked its members and the Federal Energy Regulatory Commission
(FERC) to support revisions to PJM’s Operating Agreement and Tariff to clarify PJM’s legal capacity as the central
counterparty for members’ non-bilateral transactions billed by a new subsidiary, PJM Settlement. As the single
counterparty, PJM Settlement has clarified its collection rights in the event a market participant declares bankruptcy;
the structure also reinforces PJM Settlement’s right to net members’ transactions for credit and billing purposes. PJM
Settlement does not hold any positions in the market. Such proposal was approved by FERC and effective January
1, 2011. PJM’s extensive efforts to strengthen its credit policies were recognized with a Platts Global Energy Award
for Industry Leadership, which also noted PJM’s commitment to defending its markets against manipulation and to
ethical behavior by market participants.
Demand Response Capacity Market Participation: With demand response playing a larger role in PJM’s markets
as a capacity resource and as a tool to help operators manage peak demand, stakeholders considered changes
during 2010 aimed at further expanding the use of demand response in the capacity market while meeting reliability
needs. Though a proposal to add two new options for demand resources for the 2014-2015 RPM auction failed to
gain stakeholder consensus, PJM Board sought and received FERC approval for a modified proposal. The tariff
changes establish two new options for demand resources seeking to participate in the capacity market - an annual
resource product that would be available year-round and an extended summer product from May through October.
These products are available in addition to the existing limited product, which is a summer-only, limited-duration
option that can be called on only 10 times per summer. Total revenues earned by demand response resources in
2010 from energy, capacity and ancillary service market participation exceeded $530 million, more than a 75 percent
increase from 2009.
Industry Innovation / Collaboration: Following 2009’s successful electric vehicle summits, which examined the
impacts of transportation electrification, PJM joined with the Electric Power Research Institute to sponsor Energy
Storage Summit 2010 to explore the potential role of energy storage on the grid. Represented at the summit was a
broad cross-section of industry stakeholders and experts, including federal and state regulators, utilities, grid
operators, storage developers, Congressional staff and academia. Examined were current storage technologies and
those in the research and development stages, as well as regulatory hurdles that need to be addressed to help
expand opportunities for energy storage and its benefits in supporting renewable energy, reducing emissions and
enhancing reliability.
2011 ISO/RTO Metrics Report316


PJM’s support for advanced technologies like energy storage goes beyond the discussion stage. PJM has partnered
with storage projects to gain direct experience as they participate in the Regulation Market. The University of
Delaware and the State of Delaware have a total of five modified Toyota Scion plug-in hybrid electric vehicles that
charge and discharge their batteries at PJM’s direction. They receive payments depending on the hours they are
plugged in and the hourly price paid for regulation service. In a larger test, member AES Corp.’s one-megawatt
battery trailer has been providing regulation service to the PJM grid since 2009. New to storage testing on PJM’s
campus is a pilot to demonstrate how thermal storage can participate in PJM’s Energy and Regulation markets. A
105-gallon electric water heater installed in the Technology Center on the PJM campus is providing hot water to the
building. Simultaneously, the water heater responds instantly to changes in grid needs when its controller receives a
pricing and regulation signal from PJM dispatch. The device began communicating with the grid and responding to
the PJM frequency signal in December.
PJM Value Proposition: The following summarizes the impact of specific elements of PJM’s role that produce benefits and economic value for the region it serves. Annual savings: as much as $2.2 billion
Reliability -
resolving constraints and
economic efficiency - from $470
million to $490 million in annual
savings
Generation investment -
decreased need for infrastructure
investment - from $640 million
to $1.2 billion in annual savings
A. Reliability Savings
Energy production cost -
efficiency of centralized
dispatch over a large region -
from $340 million to $445
million in annual savings
Grid services -
cost-effective procurement of synchronized reserve, regulation - from $80
million to $105 million in annual savings
PJM’s ability to direct changes in the output of generating resources (redispatch) rather than curtail power-sales transactions to deal with transmission congestion enables it to deal with transmission constraints more effectively. By reducing the need for curtailments over a wide area - transmission loading relief procedures, or TLRs - PJM’s narrowly targeted redispatch procedures resolve
transmission constraints more quickly. This approach has significantly reduced the need for transaction curtailments to maintain transmission system reliability.
Annual savings: $78 million to $98 million
By planning for future reliability needs on a region-wide rather than a utility-by-utility or state-by-state basis, PJM’s Regional Transmission Expansion Planning (RTEP) process helps focus on transmission upgrades that meet reliability criteria and increase economic efficiency.
Annual savings: $390 million
2011 ISO/RTO Metrics Report317
B.Generation Investment Savings
The large size of the PJM market area, combined with its diversity of demand and resources, reduces
the overall level of capacity needed to ensure adequate reserves of electricity to meet peak demand or
emergency situations. This capacity buffer, known as the reserve margin, would need to be higher
without PJM. Consumers avoid the costs of additional generation to meet higher levels of reserves.
Annual savings: $366 million to $900 million
The commitment of demand-response resources to reduce load during system peaks also forestalls the cost of building additional generating facilities. Through the Reliability Pricing Model (RPM), demand response competes on an equal footing with generation and transmission in the capacity market.
Through RPM, the quantity of demand response that is providing capacity in the PJM footprint has
increased by more than 1,800 megawatts.
Annual savings: $275 million
C. Energy Production Cost Savings
PJM’s centralized dispatch of the numerous resources over its expanded territory produces significant
efficiencies and cost savings compared with the previous operation of independent control areas across
the region. The increasing effectiveness of PJM’s dispatch operations also has reduced operating
reserve costs.
Annual savings: $340 million to $445 million
D. Grid Services Savings
By operating markets for grid services, also known as ancillary services, across its footprint, PJM
achieves economies in providing services that are essential to the reliability of the electric system.
Synchronized reserve service supplies electricity if the grid has an unexpected need for more power on short notice, while regulation helps match generation and load by correcting for short-term changes in electricity use that might affect system stability.
Annual savings: $80 million to $105 million
2011 ISO/RTO Metrics Report318
Southwest Power Pool (SPP)
2011 ISO/RTO Metrics Report319
Section 7 - SPP Performance Metrics and Other Information
Southwest Power Pool, Inc. (SPP) is a regional transmission organization (RTO) that coordinates the movement of electricity in a nine state region - Arkansas, Kansas, Louisiana, Mississippi, Missouri, Nebraska, New Mexico,
Oklahoma and Texas.
Services provided by SPP include:
Compliance - The SPP Regional Entity enforces compliance with federal and regional reliability standards
for users, owners, and operators of the region's bulk power grid.
Market Operations - In the Energy Imbalance Service (EIS) market (implemented February 1, 2007),
participants buy and sell wholesale electricity in real-time. If a utility requires more energy than it scheduled, the market provides the utility another option to buy the "extra" energy at real-time prices to make up the difference and meet its demand. Participants can use the EIS market to get the least expensive available energy from other utilities. SPP's 2009 wholesale market transactions totaled $1.14 billion. SPP is currently planning for future energy markets.
Regional Scheduling - SPP ensures that the amount of power sent is coordinated and matched with power
received.
Reliability Coordination - SPP monitors power flow throughout our footprint and coordinates regional
response in emergency situations or blackouts.
Tariff Administration - SPP provides "one stop shopping" for use of the region's transmission lines and
independently administers an Open Access Transmission Tariff with consistent rates and terms. SPP's 2009 transmission market transactions totaled $486 million.
Training - SPP offers continuing education for operations personnel at SPP and throughout the region. In
2009, the SPP training program awarded ~17,000 continuing education hours to 444 operators from 30 member organizations.
Transmission Expansion Planning - SPP's planning processes seek to identify system limitations,
develop transmission upgrade plans, and track project progress to ensure timely completion of system reinforcements.
Contract Services - SPP provides reliability, tariff administration, and scheduling for non-members on a
contract basis.
Southwest Power Pool dates to 1941, when 11 regional power companies joined to keep an Arkansas aluminum
factory powered around the clock to meet critical defense needs. After the war, SPP's Executive Committee decided the organization should be retained to maintain electric reliability and coordination.
SPP incorporated as an Arkansas not-profit organization in January 1994. The Federal Energy Regulatory
Commission (FERC) approved SPP as a Regional Transmission Organization in 2004 and a Regional Entity in 2007.
2011 ISO/RTO Metrics Report320
Dispatch Operations
SPP CPS-1 Compliance 2006-2010
200%
180%
160%
140%
120%
100%
80%
20062007200820092010
Compliance with CPS-1 requires at least 100% throughout a 12-month period. SPP was in compliance with CPS-1 for each of the calendar years from 2006 through 2010.
SPP CPS-2 Compliance 2006-2010
100%
95%
90%
85%
80%
20062007200820092010
Compliance with CPS-2 requires 90% for each month in a 12 month period. SPP was in compliance with CPS-2 for
each of the calendar years from 2006 to 2010.
2011 ISO/RTO Metrics Report322
SPP Transmission Load Relief or Unscheduled Flow Relief Events 2006-2010
3,000
2,500
2,000
1,500
1,000
500
0
20062007200820092010
SPP data reflects number of Transmission Load Relief (TLR) events. SPP’s TLR events were comprised of primarily level 3 and 4 TLRs with level 5 TLRs accounting for around 5% of all TLRs annually from 2006 through 20010. The increase in SPP TLRs reflects an aspect of the Energy Imbalance Services (EIS) Market design. One of the
objectives of the EIS Market is to utilize the existing transmission system by providing the most economical energy
through the Tariff’s Schedule 4 Energy Imbalance Service. The Market System Scheduling & Pricing Dispatch engine increases flow on flowgate interfaces by dispatching more efficient resources up and reducing others down. The SPP Tariff and Market protocols currently require SPP issue a TLR in parallel with congestion management in the Market System. Loading flowgate interfaces provides more economical energy, however when the loading approaches the constraint operating limitation, a TLR must be issued, regardless if schedules/tags/external are in IDC impact the
constraint being controlled. The increase in TLRs is a direct correlation to having issued TLR in order to begin the
process of having the Market System redispatch around a constraint.
SPP Energy Market System Availability 2006-2010 (1)
100%
95%
90%
85%
80%
20062007200820092010
(1)SPP began operation of an Energy Imbalance Service market on February 1, 2007.
2011 ISO/RTO Metrics Report323

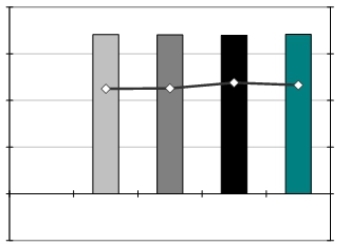

Availability of the Energy Management System (EMS) is key to reliable monitoring of the electric transmission system in SPP. Since the implementation of the Energy Imbalance Service market in February 2007, the SPP EMS has been unavailable less than 0.5% of all hours in each year.
Load Forecast Accuracy
ISO/RTOLoad Forecasting Accuracy
Reference Point
SPP6:00 a.m. prior day
SPP Average Load Forecasting Accuracy 2006-2010 (1)
100%5%
95%4%
90%3%
85%2%
80%1%
20062007200820092010
75%0%
Forecasting AccuracyMean Absolute Percentage Error
(1)SPP began operation of an Energy Imbalance Service market on February 1, 2007.
2011 ISO/RTO Metrics Report324

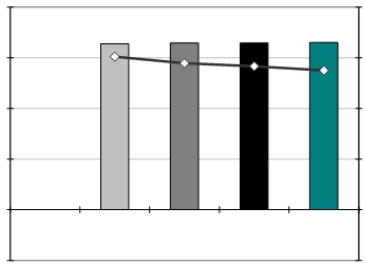

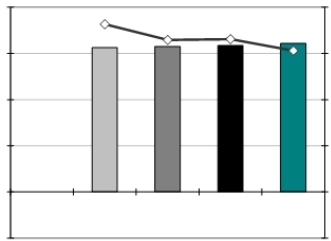
SPP Peak Load Forecasting Accuracy 2006-2010 (1)
100%5%
95%4%
90%3%
85%2%
80%1%
20062007200820092010
75%0%
Forecasting AccuracyMean Absolute Percentage Error
(1)SPP began operation of an Energy Imbalance Service market on February 1, 2007.
SPP Valley Load Forecasting Accuracy 2006-2010 (1)
100%5%
95%4%
90%3%
85%2%
80%1%
20062007200820092010
75%0%
Forecasting AccuracyMean Absolute Percentage Error
(1)SPP began operation of an Energy Imbalance Service market on February 1, 2007.
2011 ISO/RTO Metrics Report325
As stated in the introduction, since SPP does not currently have a day-ahead market, the prior day’s medium term
load forecast (MTLF) is used as the load forecast accuracy reference point. Since SPP does not have a consolidated Balancing Authority, a forecast is calculated for each of the SPP BAs (15 at the end of 2010). Overall, the average load forecasting accuracy for SPP has been right around 97% for each of the past four years that data is available. Peak and valley forecasts see slightly higher error, which can be attributed to the number of forecasts that are
required due to having multiple BAs.
Wind Forecasting Accuracy
SPP does not forecast wind. That function is completed by each Balancing Authority in the SPP Region. SPP is currently developing a system for RTO-wide wind forecasts.
Unscheduled Flows
Since SPP does not have a consolidated Balancing Authority and is currently (end of 2010) made up of 15 distinct Balancing Authorities, volume of unscheduled flows for SPP system-wide is unavailable.
2011 ISO/RTO Metrics Report326
Transmission Outage Coordination
The SPP OATT does not outline specific timeframes and guidelines for Transmission Outages and Coordination. The
OATT states that ―the Transmission Provider will provide the projected status of transmission outage schedules
above 230 kV over the next twelve (12) months or more if available. This data shall be updated no less than once
daily for the full posting horizon and more often as required by system conditions. The data will include current,
accurate and complete transmission facility maintenance schedules, including the ―outage date‖ and ―return date‖ of
a transmission facility from a scheduled or forced outage. If the status of a particular transmission facility operating at
voltages less than 230 kV is critical to the determination of TTC and ATC/AFC of the neighboring transmission
provider, the status of this facility will also be provided,‖ and ―consistent with the SPP Membership Agreement,
Transmission Owners are required to coordinate with the Transmission Provider for all planned maintenance of Tariff
Facilities. The Transmission Provider shall notify a Transmission Owner of the need to change previously reviewed
planned maintenance outages.‖
SPP Percentage of > 200kV planned outages of 5 days or more that are submitted to ISO/RTO at least 1
month prior to the outage commencement date 2006-2010
100%
80%
60%
40%
20%
0%
20062007200820092010
SPP Percentage of planned outages studied in the respective ISO/RTO Tariff/Manual established timeframes
2006-2010
SPP does not have established timeframes in which planned outages must be studied.
Percentage of > 200 kV outages cancelled by ISO/RTO after having been previously approved 2006-2010
Data for this metric is not available for SPP.
2011 ISO/RTO Metrics Report327
SPP Percentage of unplanned > 200kV outages 2006-2010
30%
25%
20%
15%
10%
5%
0%
20062007200820092010
In the 2009 Annual State of the Market Report, the SPP Market Monitoring Unit indicated that ―SPP should move to standardize categories accounting for transmission outages which would allow for the easy reporting of extent, causes, and location of such outages. At a minimum, this type of reporting alleviates concerns of market power abuses and can enhance SPP’s transmission planning and real-time operations.‖ This recommendation has been adopted and its implementation is part of the 2010 Southwest Power Pool Strategic Plan, which was adopted by the SPP Board of Directors on July 27, 2010. The outage tracking project will be completed in 2011.
2011 ISO/RTO Metrics Report328
Transmission Planning
SPP Number of Transmission Projects Approved to be Constructed for Reliability Purposes 2006-2010
550
500
450
400
350
300
250
200
150
100
50
0
20062007200820092010
SPP Percentage of Approved Construction Projects Completed by December 31, 2010
100%
80%
60%
40%
20%
0%
SPP
20062007200820092010
2011 ISO/RTO Metrics Report329
SPP’s transmission planning process was a bottom-up, top-down approach, enabling SPP to provide efficient,
reliable, and competitive generation market Transmission Services on a non-discriminatory basis. The SPP planning
processes took into account its stakeholder’s requirements, while coordinating with applicable federal, state and local
regulatory authorities and also considering potential public policy. The SPP Transmission Expansion Plan (STEP)
promotes the efficient expansion of the transmission system under SPP’s control and enables competitive generation
markets. The STEP identifies potential expansion projects needed to meet reliability standards and to interconnect
new generation, with consideration for load growth, competitive generation market, stakeholder input, and
transmission service commitments. In addition, the STEP considers plans for addressing transmission congestion and the benefits associated with development of new generation as alternatives to transmission expansion.
Reliability Planning
As part of the bottom-up approach, one component of the STEP is the reliability assessment. This process requires
that Transmission Owners continue to develop expansion plans to meet the local needs of their systems and to help
the RTO develop the expansion plan for reliability needs. Transmission Owners develop their system specific local
plans, which SPP consolidates into the integrated STEP. At the same time, SPP assesses its system for the ability to
meet applicable reliability standards. This process allows for projects with regional and inter-regional impact to be
analyzed for their combined effects. It allows the exploration of modifications and alternatives to proposed plans,
which may provide more cost effective solutions for regional and as well as local needs.
Economic Planning
As part of SPP’s top-down approach transmission improvements are considered that provide economic benefit. One
specific process is called the Balanced Portfolio. The Balanced Portfolio is one SPP strategic initiative to develop a
cohesive grouping of economic upgrades that benefit the SPP region and allocates the cost of those upgrades
regionally. Projects in the Balanced Portfolio include transmission upgrades of 345 kV projects that will provide
customers with potential savings that exceed project costs. These economic upgrades are intended to reduce
congestion on the SPP transmission system, resulting in savings in generation production costs. With a goal to
identify upgrades for inclusion in a portfolio that will provide a balanced benefit to customers over a specified ten-year
payback period. ―Balanced‖ is defined by the SPP Regional Tariff, such that for each Zone, the sum of the benefits of
the potential Balanced Portfolio must equal or exceed the sum of the costs. Economic upgrades may provide other
benefits to the power grid; i.e. increasing reliability and lowering reserve margins, deferring reliability upgrades, and
providing environmental benefits due to more efficient operation of assets and greater utilization of renewable
resources.
Another example of an economic study is the Priority Projects study. This was a one-time analysis conducted in 2009 as a result of the SPP Synergistic Planning Process Team recommendations and is considered a high priority
studies. Study assumptions include fuel and emissions costs, load and generation forecasts, types and locations of new generation, generation retirements, market structures, and wind profiles. Analysis also encompasses a plausible collection of assumptions for each specific model run, including varying levels of Renewable Electricity Standards, demand response, energy efficiency, fuel prices, and governmental regulations. Metrics were developed for
qualifying and quantifying the projects for the studies, including Adjusted Production Cost, impact on losses, reliability and environmental impacts, capacity margins, and operating reserves.
2011 ISO/RTO Metrics Report330
Stakeholders
There are opportunities for stakeholder involvement throughout the SPP planning processes. All planning processes are open and transparent assessments of study assumptions, upgrade recommendations and applicable cost
allocation impacts. Its implementation is only successful through the commitment of SPP members, regulators, and other stakeholders. Input from the regulators assists SPP in the development of realistic transmission expansion projects and alternatives to meet rate payer needs, as well as those of neighboring regions.
Approval
After each analysis, the SPP Board of Directors can approve proposed upgrades to begin construction. For the
approved upgrades, SPP issues Notification To Construct letters to incumbent Transmission Owners notifying them to build the upgrades. SPP then tracks the progress of the upgrades through a quarterly project tracking process monitoring project schedules and costs and also tracking necessary mitigation plans if project construction schedules are unable to meet system in-service needs.
As part of the 2009 transmission planning efforts, SPP completed the following studies: reliability - AC contingency,
dynamic stability, and voltage stability studies; economic - Balanced Portfolio and Priority Projects studies. The
results of these studies can be found in the 2009 STEP report, available at: http://www.spp.org/publications/2009-STEP-Report.pdf.
2011 ISO/RTO Metrics Report331
Generation Interconnection
SPP Average Generation Interconnection Request Processing Time 2006-2010
(calendar days)
1,000
800
600
400
200
0
20062007200820092010
In 2009, SPP began placing a higher emphasis on the timely processing of Generation Interconnection studies, as
evidenced by a reduction of more than one-third the number of days required from 2008 (685 days) to 2009 and 2010 (213 & 216 days).
SPP Planned and Actual Reserve Margins 2006 - 2010
40%
35%
30%
25%
20%
15%
10%
5%
0%
20062007200820092010
Bars Represent Planned Reserve MarginsLines Represent Actual Reserves Procured
2011 ISO/RTO Metrics Report332
Interconnection / Transmission Service Requests
SPP Number of Study Requests 2006-2010
500
450
400
350
300
250
200
150
100
50
0
20062007200820092010
SPP Number of Studies Completed 2006-2010
700
600
500
400
300
200
100
0
20062007200820092010
2011 ISO/RTO Metrics Report333
SPP Average Aging of Incomplete Studies 2006-2010
(calendar days)
800
700
600
500
400
300
200
100
0
20062007200820092010
SPP Average Time to Complete Studies 2006-2010
(calendar days)
800
700
600
500
400
300
200
100
0
20062007200820092010
The generation interconnection process includes three potential types of studies - feasibility studies, system impact
studies and facility studies. Feasibility studies assess the practicality and cost transmission system additions or
2011 ISO/RTO Metrics Report334
upgrades required to accommodate the interconnection of the generating unit or increased generating capacity with the transmission system. System impact studies provide refined and comprehensive estimates of cost responsibility and construction lead times for new transmission facilities and system upgrades that would be required to allow the new or increased generating capacity to be connected to the transmission system in SPP. Facility studies develop the transmission facilities designs for any required transmission system additions or upgrades due to the
interconnection of the generating unit and/or increased generating capacity.
Average Cost of Each Type of Study
20062007200820092010
Feasibility Studies$2,491$6,495$3,270$2,888$2,976
System Impact Studies$16,280$17,694$14,942$14,050$15,655
Facility Studies$7,290$12,495$16,960(Note 1)$14,998
Note 1 - No facility studies were posted in 2009.
Special Protection Schemes
SPP Number of Special Protection Schemes 2010
100
90
80
70
60
50
40
30
20
105
0
The SPSs in the SPP Region represent four long-term schemes and one temporary scheme. A Special Protection
Systems (SPS) or Remedial Action Scheme (RAS) is designed to detect abnormal system conditions and take
automatic pre-planned, coordinated, corrective action (other than the isolation of faulted elements) to provide
acceptable system performance. SPS actions include among others, changes in demand (e.g., load shedding),
generation, or system configuration to maintain system stability, acceptable voltages, or acceptable facility loadings.
All reviews of facilities shall be for those used to monitor and control transmission facilities operated at 100kV or
above.
There were no misoperations of SPSs in 2010 in SPP.
2011 ISO/RTO Metrics Report335
B. SPP Coordinated Wholesale Power Markets
The table below shows the split of the nearly $2 billion that was invoiced by SPP in 2010.
Percentage of
(dollars in millions)
Energy Imbalance Market Transmission
SPP Admin Fee
Total
2011 ISO/RTO Metrics Report
2010
2010 Dollars BilledDollars Billed
$1,28264.7%
$62831.7%
$713.6%
$1,981100.0%
336
Market Competitiveness
SPP New Entrant Gas-Fired Combustion Turbine (CT) Net Generation Revenues 2006-2010
$150,000
$100,000
$50,000
$0
20062007200820092010
SPP New Entrant Gas-Fired Combined Cycle (CC) Net Generation Revenues 2006-2010
$150,000
$100,000
$50,000
$0
20062007200820092010
Net revenues in 2010 were not adequate to cover the fixed costs of either a combined cycle or a combustion turbine power plant in SPP. Net Revenue has dropped by about half from 2008 in large part because of the lower electricity prices making the margins tighter when the plants were run. So, while a combined cycle would still have run around 55% it no longer covered 60% of the fixed cost as it did in 2008, but rather less than 30%.
2011 ISO/RTO Metrics Report337
From the SPP 2010 State of the Market Report:
For all fuel types, the actual return from investment in new generation is not sufficient for full cost
recovery. This does not mean that there is no rationale for investment in new generation.
Regulatory requirements, reliability demands, shifts in generation technology emphasis, and
loading patterns may require new generation construction. What may be inferred is that generation
additions from independent entrants based on purely economic incentives may not be warranted at
this time.
SPP Real-Time Energy Market Percentage of Unit Hours Offer Capped due to Mitigation 2006-2010
5%
4%
3%
2%
1%
0%
20062007200820092010
From the SPP 2010 State of the Market Report:
The system marginal price and corresponding Locational Imbalance Prices are derived from the offer curves
submitted by Market Participants. Because these offer curves are the principal driver of overall system
prices, it is necessary to carefully monitor participant offers to mitigate improper offer submissions. The
MMU’s principal concern is that a Market Participant may submit offers that are substantially higher than
what is appropriate, causing the market clearing price to increase above what is warranted. A Market
Participant raising its generators’ offer curves above their actual marginal cost is an example of Economic
Withholding.
The SPP Market Monitoring Unit is directly charged by FERC with mitigating instances of Economic
Withholding. Consequently, the MMU has developed screens and market behavior analysis tools that look
for this type of activity. One tool is the SPP offer cap, a methodology in which offers are automatically
2011 ISO/RTO Metrics Report338
capped given the following conditions: (a) congestion is present in the system, (b) resources are in a
position to wield potential market power and their Generator to Load Distribution Factors are greater in
magnitude than -5%, and (c) affiliate resources of any capped resource are also capped. The SPP offer cap comes into play only during times of congestion. Without congestion, competition between Market
Participants eliminates potential market power abuse.
An additional capping tool is the FERC offer cap, which limits the total magnitude of submitted offers. The
current value of this cap is $1,000; no participant may submit an offer exceeding this value. The FERC offer
cap applies to all resources at all times. Neither the FERC nor SPP offer caps are price caps. Prices are set
through the use of the System Pricing and Dispatch model, which may yield prices greater than any
individual capped offer.
In addition, Market Competitiveness as measured by the Herfindahl-Hirschmann Index (HHI) is discussed in the 2010 Annual State of the Market Report:
The Herfindahl-Hirschman Index (HHI) is a common measure of competitiveness used to identify relative
levels of market concentration. The U.S. Department of Justice is a predominant user of the HHI as part of
its approval process for mergers or acquisitions. A HHI at or under 1,000 is traditionally considered to be
competitive and/or un-concentrated. A HHI between 1,000 and 1,800 indicates moderate concentration,
and/or a workably competitive solution. A HHI over 1,800 is said to indicate a highly concentrated market,
and is unlikely to be competitive. In the case of electric markets, a higher level of 2500 is accepted as an
upper threshold level.
Herfindahl - Hirschman Index
20071190
20081276
2009970
2010954
The HHI has declined as more Market Participants have been added to the EIS Market footprint. HHI values
at this level indicate that no individual Market Participant can dominate the market and that the overall
market is very competitive. This does not preclude the possibility of localized market power concerns, but
does indicate that an individual participant is unlikely to successfully manipulate the system by withholding
capacity.
2011 ISO/RTO Metrics Report339
Market Pricing
SPP Average Annual Load-Weighted Wholesale Energy Prices 2006-2010 (1)
($/megawatt-hour)
$100
$90
$80
$70
$60
$50
$40
$30$31.36
$20
$10
$0
20062007200820092010
(1) SPP began operation of an Energy Imbalance Service market on February 1, 2007.
The SPP average load-weighted energy prices from 2007 - 2010 varied, due in most part to variances in fuel costs.
The chart on the following page from the U.S. Energy Information Administration is a visual representation of the fuel cost inputs from 2005 - 2009 that influenced the energy prices in SPP. The consistency in the trends between the preceding chart and several of the fuel cost trends on the chart on the following page are significant, because they illustrate the high correlation between wholesale energy prices and underlying fuel costs.
2011 ISO/RTO Metrics Report340
U.S. Nominal Fuel Costs 2006-2010
($ per million Btu)
$25
$20
$16.59
$15
$12.56
$10
$5$5.08
$2.26
$0
20062007200820092010
CoalNatural GasResiduel Fuel OilDistillate Fuel Oil
Source: U.S. Energy Information Administration, Independent Statistics and Analysis. ―Table 2. U.S. Energy Prices, EIA/Short-
Term Energy Outlook—June 2011,‖ http://www.eia.gov/emeu/steo/pub/2tab.pdf.
2011 ISO/RTO Metrics Report341
SPP Average Annual Load-Weighted
Fuel-Adjusted Wholesale Spot Energy Prices 2006-2010
($/megawatt-hour)
$100
$90
$80
$70
$60
(1)
$50
$40
$30
$20
$10
$0
200620072008
SPP began operation of an Energy Imbalance Service market on February 1, 2007.
$49.49
20092010
SPP’s base year for fuel-cost references is 2007 as the SPP EIS Market launched on February 1, 2007.
SPP Wholesale Power Cost Breakdown
($/megawatt hour)
SPP only has a real-time energy imbalance service market.
2011 ISO/RTO Metrics Report342
Unconstrained Energy Portion of System Marginal Cost
SPP Annual Average Non-Weighted, Unconstrained
Energy Portion of the System Marginal Cost 2006-2010 (1)
$100
$90
$80
$70
$60
$50
$40
$30
$20
$10
$0
20062007200820092010
(1)SPP began operation of an Energy Imbalance Service market on February 1, 2007.
The unconstrained energy portion of system marginal cost is the marginal price of maintaining balance in the
economic dispatch ignoring transmission limitations. This trend chart shows the annual average marginal price of energy across SPP over all hours. The trend closely follows the trend of aggregate fuel prices from 2006 through 2010 which illustrates the fact that marginal energy price fluctuations are primarily driven by fuel prices.
2011 ISO/RTO Metrics Report343
Energy Market Price Convergence
Data on price convergence in this section does not include SPP as SPP does not operate a day-ahead energy
market.
Congestion Management
SPP does not operate a congestion hedging market.
Resources
SPP Annual Generator Availability 2006 - 2010
100%
95%94.30%
90%
85%
80%
20062007200820092010
Since the implementation of the Energy Imbalance Service market in February 2007, SPP generator availability
continues to be strong, hovering right around 95%. More in-depth tracking of generator availability is expected to be
implemented in 2011 as part of the SPP Strategic Plan.
2011 ISO/RTO Metrics Report344
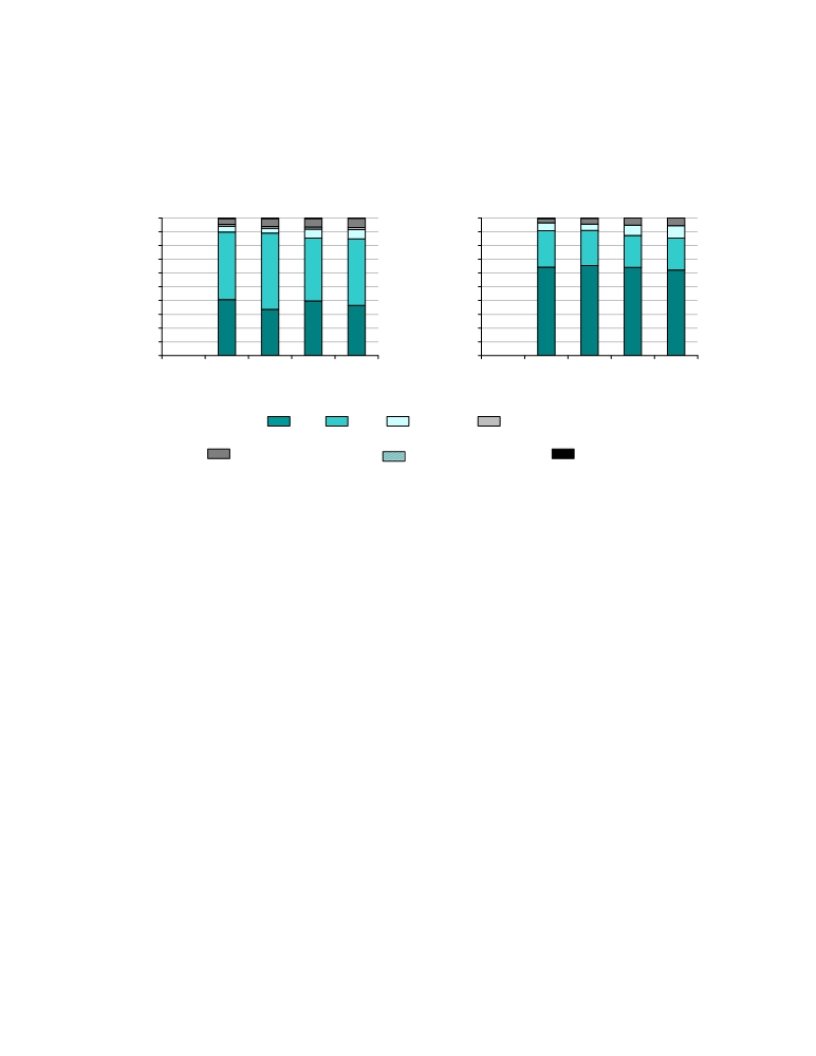
Fuel Diversity
SPP Fuel Diversity 2006-2010
Installed CapacityGeneration Output
100%100%
90%90%
80%80%
70%70%
60%60%
50%50%
40%40%
30%30%
20%20%
10%10%
0%0%
2006200720082009201020062007200820092010
CoalGasNuclearOil
Hydro and RenewablesGas/Oil Combined CycleOther
Installed generation capacity in SPP is approximately 38% coal, 50% gas, 4% nuclear, 7% wind, hydro and other renewables, and less than 1% from all other fuel sources. Actual generation output from baseload units (generally coal or nuclear) totals just over 71%, gas accounts for 23%, wind, hydro and renewables for approximately 5%, and less than 1% for other sources of fuel.
2011 ISO/RTO Metrics Report345
Demand Response
SPP Demand Response Capacity as Percentage of Total Installed Capacity 2006-2010
12%
10%
8%
6%
4%
2%
1.64%
0%
20062007200820092010
SPP Demand Response as a Percentage of Synchronized Reserve Market 2006-2010
SPP does not operate a synchronized reserve market.
2011 ISO/RTO Metrics Report346
Renewable Resources
SPP Renewable Megawatt Hours as a Percentage of Total Energy 2006-2010
20%
15%
10%
5%
0%
20062007200820092010
SPP Hydroelectric Megawatt Hours as a Percentage of Total Energy 2006-2010
10%
5%
0%
20062007200820092010
2011 ISO/RTO Metrics Report347
SPP Renewable Megawatts as a Percentage of Total Capacity 2006-2010
20%
15%
10%
5%
0%
20062007200820092010
SPP Hydroelectric Megawatts as a Percentage of Total Capacity 2006-2010
20%
15%
10%
5%
0%
20062007200820092010
Energy capacity and production from renewable sources has been growing in SPP over the last several years,
especially in wind renewables. Wind capacity has more than doubled since the implementation of the EIS market in
February 2007, growing from 1,515 MW to 3,836 MW of nameplate capacity at the end of 2010.
2011 ISO/RTO Metrics Report348
C. SPP Organizational Effectiveness
Administrative Costs
SPP Annual Actual Costs as a Percentage of Budgeted Costs 2006-2010
Non-Capital CostsCapital Cost Recovery
140%140%
130%130%
120%120%
110%110%
100%100%
90%90%
80%80%
70%70%
2006200720082009201020062007200820092010
Budget$46$53$61$56$68Budget$7$12$15$12$13
Bars Represent % of Actual Costs to Approved Budgets; Dollar Amounts Represent Approved Budgets (in millions)
SPP is a strong proponent of stakeholder involvement in the establishment and monitoring of its operating and capital budgets and the monitoring of its financial affairs. This level of involvement dates back to the start as a tight power pool and continues through today as a member-driven Regional Transmission Organization.
SPP’s annual budget process culminates with the presentation of the budget to the Board of Directors. Providing
some background, the SPP Board of Directors meets and acts in public, open sessions for all items except personnel issues and legal issues. Additionally, the SPP Board of Directors always meets in the presence of the Members
Committee which is comprised of 15 representatives from SPP’s membership. Finally, prior to all votes, the Members Committee is asked to indicate their position on each issue through a non-binding straw vote. This vote provides the Board with direct insights as to the positions of the membership on any issue.
The chair of the SPP Finance Committee presents the budget to the SPP Board of Directors in open session at the Board’s October meeting. Following the presentation of the budget, the Board of Directors solicits comments
regarding the budget from all in attendance (even those who are not members of SPP have the ability to share their position on the budget). Following the dialogue, and assuming there is a motion to approve the budget and a second of that motion, the Board will ask the Members Committee representatives to vote through a show of hands either
―yes‖, ―no‖, or ―abstain‖. Then, the Board members will enter their votes (the votes of the individual board members are via secret ballot and not shared individually).
2011 ISO/RTO Metrics Report349
SPP’s budget has a long history prior to arriving at the SPP Board of Directors for action. The budget starts informally at the grassroots of the organization through the work of numerous stakeholder groups that define the products and
services they desire SPP to perform. Major changes to SPP’s products and services and business practices are
approved at the Markets and Operations Policy Committee (―MOPC‖). The MOPC is a full representation committee
comprised of one representative from each member of SPP. The MOPC meets in open session and reports directly
to the SPP Board of Directors.
Coincident with the grassroots efforts of SPP’s Working Groups and MOPC, SPP’s Strategic Planning Committee
meets to determine the strategic direction of SPP. The Strategic Planning Committee is comprised of three members of the SPP Board of Directors and eight representatives from SPP’s membership. The Strategic Planning Committee meets in open session and reports directly to the SPP Board of Directors.
SPP staff compiles the directions from the MOPC, Strategic Planning Committee, Board of Directors, and other
groups to determine the direction of the company during the next fiscal year and the two years beyond. SPP staff
determines the resources required to meet the goals of the organization and ultimately prepares a budget designed to meet those needs. This budget is formally presented to the SPP Finance Committee. The SPP Finance Committee is comprised of two members of the SPP Board of Directors and four representatives from the SPP membership. The Finance Committee meets in open sessions and actively seeks input from the stakeholder representatives on the
Committee as well as from other interested parties. The Finance Committee diligently reviews the budget proposed by staff to ensure the resources identified are consistent with the goals and objectives of the organization and also
are prudent and just. Once satisfied that the budget meets the needs of the organization the Finance Committee
presents the budget to the SPP Board of Directors for approval.
2011 ISO/RTO Metrics Report350
SPP Annual Administrative Charges per Megawatt Hour of Load Served 2006-2010
($/megawatt-hour)
$1.00
$0.90
$0.80
$0.70
$0.60
$0.50
$0.40
$0.30
$0.20
$0.18
$0.10
$0.00
20062007200820092010
The administrative costs per MWhr of load served data in the chart above should be reviewed in the context of the SPP annual load served as noted in the table below.
2010 Annual Load Served
ISO/RTO
(in terawatt hours)
SPP328
2011 ISO/RTO Metrics Report351
Customer Satisfaction
SPP Percentage of Satisfied Members 2006-2010
100%
92%
80%
60%
40%
20%
0%
20062007200820092010
No data is available for 2009, as the stakeholder satisfaction survey was an open-ended survey seeking comments on areas of satisfaction, dissatisfaction, and general comments. No numeric or scoring data was collected.
The percentage of satisfied members in SPP remains strong and continues to increase. The lowest year for member satisfaction was 2007, which is the year the Energy Imbalance Market was launched. The percentage has increased from 84% in 2007 to nearly 92% in 2010.
2011 ISO/RTO Metrics Report352
Billing Controls
ISO/RTO20062007200820092010
Qualification forQualification forQualification forQualification for
Six ControlSix ControlTwo ControlTwo ControlUnqualified SAS
SPPObjectives inObjectives inObjectives inObjectives in70 Type 2 Audit
SAS 70 Type 2SAS 70 Type 2SAS 70 Type 2SAS 70 Type 2Opinion
AuditAuditAuditAudit
From the SPP 2010 Annual Report:
In December [2010] SPP received an unqualified Statement on Auditing Standards (SAS 70) Type II audit opinion, providing a high level of assurance that the organization is providing a secure, reliable, effective operating environment. The SAS 70 Type II audit, conducted by PricewaterhouseCoopers (PwC) scrutinized controls related to SPP’s transmission and energy market business processes and related information technology systems and processes.
PwC found that SPP’s controls were suitably designed and operating effectively to meet its control objectives from November 1, 2009 to October 31, 2010.
2011 ISO/RTO Metrics Report353
D. Southwest Power Pool Specific Initiatives
SPP Member Value Statement
SPP has developed an estimate of the annualized value that is created and will be created as future developments
are implemented through the collaboration of SPP members and the SPP staff and pooled investments. The
analytical framework for this estimation of value attempts to compare the current state versus the hypothetical state
that would exist if SPP members operated on a standalone basis without collaboration of any sort. There are two
fundamental sources of value created by the collaboration of members coordinated and administered by SPP.
Region-wide optimization - operating a power generation, transmission and market system for the Region
produces greater resource optimization for the whole.
Economies of scale - SPP can provide centralized services to all at a lower unit cost than members (or
Balancing Authorities) can on an isolated basis.
There are four categories of value produced by the collaboration between SPP and the membership.
Reliability Services
Reliability Coordination - SPP has an operations center that monitors all activity on the bulk electrical
energy grid 24 hours a day, 7 days per week. In addition to responding to outages and coordinating the
response, SPP administers a planning function that assures that the grid is highly reliable - minimizing
disturbances, outages, duration of outages and congestion. NERC statistics show that RTO members have
a higher average system availability than standalone utilities. Based on estimates of the average cost of an
outage times the total annual SPP load, the SPP reliability services helps its members avoid from $185 -
$280 million per year of outage costs.
Reserve Sharing - SPP administers a Reserve sharing program for a group of utilities having generation
capability. SPP provides a reserve requirement that is 150% larger than the single greatest reserve in the
group. Members share on a pro-rata basis in the cost of this reserve. Half of the reserve is required to be a
spinning reserve and the other half, a supplemental reserve. The total annual reserve requirement cost
avoidance for the Reserve Sharing group is estimated to be from $280 - $590 million per year.
Region-Wide Transmission Planning
SPP’s Engineering function develops transmission plans for the SPP region that will optimize the
effectiveness and efficiency of the transmission grid to enable access to the lowest cost sources of power generation for all members. SPP identifies transmission expansion projects that benefit the region and a regional cost sharing methodology helps to build out the needed incremental transmission capacity. Projects already built have created $5 million per year of benefits. The Balance Portfolio Projects and the Priority Projects are in the process of engineering and construction. When implemented over the next decade, the total value to the SPP region is estimated to be $480 million per year.
2011 ISO/RTO Metrics Report354
In addition to the above studies, SPP conducts studies for generation interconnection and transmission
upgrades upon request and also conducts integrated planning studies over 10 and 20 year planning
horizons. SPP serves as an unbiased, objective expert witness to testify at regulatory commissions on the
impact on proposed projects to the integrity of the power grid. The cost to procure similar unbiased expert
testimony backed by objective studies would conservatively cost $20 million per year.
Operation of Open, Transparent Energy Markets
SPP operates an Energy Imbalance Service (EIS) market. This market produces net trade benefits to the
region. These benefits are defined as the amount that the short-term costs of producing electricity within the market footprint were reduced as a result of the regional security-constrained economic dispatch (SCED) implemented for the EIS market. A study of the benefits in the first 12 months of the operation of the EIS market estimated the benefits to the SPP region to be $100 million per year.
SPP is in the process of implementing a highly liquid and efficient Day Ahead and Real Time Balancing
market. The market will allow unit commitment to be performed on a region-wide basis. A consulting study
by Ventyx has estimated the average gross annual benefits of the Integrated Marketplace to be
approximately $150 million per year beginning in 2014. The implementation of the Consolidated Balancing
Authority should centralize Balancing Authority resources and avoid approximately $10 - $15 million per
year for SPP members.
Leveraged Centralized Services -- SPP provides a series of centralized services to members and member
Balancing Authorities. Due to the economies of scale involved, SPP can provide these services at a higher quality and lower unit cost to members than they could provide them for themselves. These centralized functions include: Training, Tariff Administration and Scheduling, Regulatory, Compliance, Settlements and Contract Services. The annual value of these services to the SPP region is estimated at $100 - $125 million per year.
Summary
Value of services currently provided
Value of future services (transmission, markets)
Grand Total - Gross Benefits
2011 ISO/RTO Metrics Report355
Annual Value

$ 690 - $ 1,120 million
$ 640 -$ 645 million
$1,330 -$ 1,765 million