
10 Krey Boulevard Rensselaer, NY 12144
October 14, 2010
ELECTRONICALLY SUBMITTED
Kimberly D. Bose
Secretary
Federal Energy Regulatory Commission 888 First Street, N.E.
Washington, D.C. 20426
Re: New York Independent System Operator, Inc.’s Supplemental Submission of Analysis of
the Expected Impact of Buy-Through of Congestion Charges;
Docket Nos. ER08-1281-004 and ER08-1281-005.
Dear Secretary Bose:
In its August 16, 2010 response to a question posed by the Federal Energy Regulatory
Commission (“Commission”), the New York Independent System Operator, Inc. (“NYISO”) committed
to supplement its response to the Commission’s second question by providing an additional analysis
prepared by Dr. David Patton of Potomac Economics. Consistent with that commitment, the NYISO
submits herewith the presentation that Dr. Patton gave at the September 27, 2010 Broader Regional
Markets technical conference that PJM Interconnection, LLC hosted in Philadelphia. Pennsylvania. The
attached analysis includes a discussion of the impact to the economic viability and risk exposure of
historic Ontario-Midwest ISO-PJM transactions with the application of a NYISO Buy-Through of
Congestion charge.
Respectfully submitted,
/s/ Alex M. Schnell
Alex M. Schnell
New York Independent System Operator, Inc.


Analysis of the Broader Regional
Markets Initiatives
Presented to:
Joint NYISO-IESO-MISO-PJM Stakeholder
Technical Conference on Broader Regional Markets
David B. Patton, Ph.D.
Potomac Economics
September 27, 2010
1

Introduction
• This presentation summarizes our assessment of the potential benefits of some
of the Broader Regional Market (“BRM”) initiatives.
•In particular, we estimate the production cost savings that may be achieved by:
Coordinating flows around Lake Erie through:
-Coordinated congestion management between RTOs; and
–The “buy-through congestion”initiative for transaction scheduling); and
Improving the utilization of interfaces between MISO, PJM, NYISO, Ontario,
and New England.
•We report production cost savings because it is the most accurate measure of
the improvement in economic efficiency.
In most cases, the short-term consumer savings would be substantially higher
(which is based on the price effects of the initiatives).
Inefficient Pricing of Loop Flows
•To estimate the benefits of better coordination of flows around Lake Erie, we first
estimate:
The quantity of loop flows across each of the ISOs’ flowgates; and
The inefficient pricing of the estimated loop flows;
-The inefficiency is reflected in the difference between the value of the flowgate
capability and the charges to transactions that cause the loop flows.
-This difference provides insight about the potential efficiencies from
coordinated congestion management and buy-through congestion provisions.
•For this analysis, we analyzed November 2008 through October 2009.
•The value of flowgate capability used by the loop flows depends on the marginal cost
of re-dispatch for the monitoring ISO (the ISO on whose system the flowgate is on).
For example, if a flowgate is constrained with a $200/MWh shadow price and 150
MW of flowgate capability is used by loop flows in the forward direction, the
economic value of capability used by the loop flows is $30,000/hour.
This is equal to the congestion charges that would be collected if the 150 MW of flow
resulted from transactions scheduled internally.
Inefficient Pricing of Loop Flows
• Transmission Line Loading Relief (“TLR”) is often called when loop flows
are contributing to congestion on the flowgate.
However, inefficiencies exist whether or not a TLR is called and the broader
regional market initiatives will address these inefficiencies.
• When no TLR is called, loop flows are not charged (or paid) for their use of
the flowgate. In this case, the BRM initiatives will enhance efficiency by:
Providing efficient scheduling incentives for transactions by charging
transactions that cause forward loop flows (contribute to congestion), and by paying transactions that cause negative loop flows (relieve congestion).
Reducing re-dispatch costs in the monitoring ISO.
• When a TLR is called, the costs incurred by transactions and the non-
monitoring ISOs may be substantially higher (or lower) than the marginal redispatch cost in the monitoring ISO. In this case, the BRM will:
Ensure that transactions that cause loop flows are charged (or paid) consistent
with the cost of re-dispatch in the monitoring ISO.
Minimize the redispatch costs of the monitoring and non-monitoring ISOs.
Estimating the Quantity of Loop Flows
•We estimated forward and reverse loop flows resulting from:
Inter-control area transactions where the monitoring ISO is not on the contract
path; and
Native generation-to-load impacts from the other three ISOs.
•We first used Powerworldsoftware to estimate distribution factors relative to
the key flowgateson each ISO’s system based on NERC planning cases.
•Loop flow impacts were calculated for each inter-control area transaction:
For each transaction, the Transmission Distribution Factor (“TDF”) was
calculated based on the source and sink of the transaction.
• Native generation-to-load impacts were calculated for each generator:
For each generator, the Generation-to-Load Distribution Factor (“GLDF”) was
calculated as the difference between the generator’s Generation Shift Factor
(“GSF”) and the ISO’s load-weighted average Load Shift Factor (“LSF”).
These GLDFs were used to calculated the market flows across each flowgate.
Estimating the Pricing Inefficiencies
•To identify pricing inefficiencies for the loop flows, the difference between the value
of the flowgate and the costs incurred by the source of the loopflows is estimated.
•The value of flowgate depends on the marginal redispatchcost to manage the
congestion on the flowgate by the monitoring ISO.
For the MISO, NYISO, and PJM, this is the flowgate’s real-time shadow price.
For IESO, this is implied by the real-time nodal prices that are produced by its real-
time security-constrained dispatch software.
•The pricing inefficiencies can be placed in two categories:
1.Under-priced Congestion: this occurs when transactions are not charged for their
loop flows, or where the value of the flowgate exceeds the costsincurred by non-
monitoring ISOsto help manage it.
2.Over-priced Congestion: this occurs when transactions that are more valuable than
the flowgate capability are curtailed (not estimated due to lackof data), or when non-
monitoring ISOsincur higher redispatchcosts to help manage the congestion than
the value of the flowgate.
• The following tables show these pricing inefficiencies. They report the difference
between the value of flowgate capability in the monitoring ISO and the charges (or payments) to sources of the loop flows.
-6-
Under-Priced Loop Flows
Monitoring ISO (in $millions):
Direction/Source of Loop FlowsNYISOONTMISOPJM
ForwardNYISO GTL$3$1$17
ONT GTL$7$16$16
MISO GTL$7$10
PJM GTL$57$15
ONT - NYISO$1$4
MISO - ONT$6
PJM - MISO$2$1
NYISO - PJM$2
Total$79$30$19$37
ReverseNYISO GTL$2$2$15
ONT GTL$9$16$14
MISO GTL$9$10
PJM GTL$40$16
ONT - NYISO$1$3
MISO - ONT$1
PJM - MISO$2$1
NYISO - PJM$3
Total$61$32$19$33
Over-Priced Loop Flows
Monitoring ISO:
Direction/Source of Loop FlowsONT
Forward MISO GTL$25
PJM GTL$27
PJM - MISO$1
NYISO - PJM$6
Reverse MISO GTL$29
PJM GTL$23
PJM - MISO$5
NYISO - PJM$1
Conclusions of Loop Flow Analysis
• Forward and reverse loop flows are significant through each of the four ISOs.
The total gross value of the over-priced and under-priced loop flows is almost
$430 million.
The BRM initiatives would capture some portion of this value by providing efficient
incentives to schedule transactions and dispatch resources internally to minimize
costs throughout the four ISOs’ systems.
-The portion of the value that would be captured by the BRM is very difficult to
estimate. It is based on the ability of other ISOsor schedulers to relieve the
monitoring ISO’s constraints at a lower cost than the ISO’s real-time dispatch.
-We believe a reasonable range for this portion is 10 to 20 percent.
•These result may be understated for the following reasons:
Fuel prices were very low during the period studied, which reduces the value of
congestion.
We did not have data on TLR-based curtailments and, therefore, have not
identified cases where transactions were curtailed whose value exceed the value of the flowgate.
It does not identify the potential efficiency gains of scheduling transactions to
relieve a constraint that was not scheduled under current rules.
-9-
Analysis of External Interface Utilization
• In addition to the benefits of better coordination of transactions and internal
dispatch to lower the costs of managing congestion in the region, the BRM addresses improving scheduling between ISO markets.
• Improved scheduling would more fully utilize the transmission interfaces
between the markets and generate significant benefits.
These benefits are best measured as reduced production costs.
Production costs are reduced as lower-cost resources in one market displace
higher-cost resources in the adjacent market.
The result of this process is improved price convergence between the markets. • We performed an econometric analysis estimate the benefits that are available
from optimal scheduling of the interfaces between the markets.
• The portion of the savings that are ultimately realized depend on the actions
taken by the ISOs.
Real-time coordination of the net scheduled interchange (“NSI”) (or intra-hour
scheduling) would likely capture most of the savings.
Simply shortening the scheduling timeframes for participants would capture a
much smaller share of the potential benefits.
-10-
Analysis of External Interface Utilization
• The largest source of benefits we estimated derives from improving the utilization of the
interfaces between markets. The analysis is described below.
Ontario, MISO, and PJM Interfaces
• We first estimated how prices in each ISO respond to changes in the scheduled
interchange (“NSI”) over the interface, recognizing that this price response varies as prices increase or when there is congestion leading to the interface.
Our model also controls for changes in the NSI over other interfaces.
We used the estimates to simultaneously optimize the interchange over each of the
four inter-ISO interfaces around Lake Erie each 5 minutes, given the interface limits.
New England Interface
• To estimate the optimal NSI each 5-minutes for the NE interface, our analysis uses the
generator offers in both markets and recognizes congestion leading to the interface.
Long Island Ties to CT and NJ
• Benefits for these ties were only calculated when congestion separated LI, CT or NJ from
the broader RTO markets to avoid double-counting benefits from the primary interfaces.
• In these intervals, we estimate the optimal NSI adjustment, given transmission limits and
scheduling restrictions.
HQ-NY Interface
•We have not estimated the benefits from dynamic dispatching the HQ interface, but
estimated the reduction in uplift costs and balancing congestion costs that BRM could
achieve.
Summary of Estimated BRM
Production Cost Savings
•The potential savings we estimate address two aspects of the BRMinitiations.
•Both show significant potential economic efficiencies, although the benefits of
improved utilization of the external interfaces is larger.
•The following table summarizes the estimated annual benefits in the two areas,
which totals:
$160 million in savings for the NYISO interfaces and constraints; and
$297 million in savings on all interfaces and constraints.
•In total, the benefits may be understated due to:
The low load and high surplus capacity that prevailed in 2009; and
The relatively low fuel prices in 2009.
• The low fuel prices in 2009 can be addressed by adjusting the benefits to
correspond to a more typical natural gas price.
The benefits should be highly correlated to natural gas prices because gas-fired
units are on the margin in most periods in New York and the adjacent markets.
The table shows that at a $6 per MMBTU gas price, the benefits would rise to:
-$193 million on the NYISO interfaces and constraints;
– $362 million for all interfaces and constraints.
Summary of Estimated BRM
Production Cost Savings
EstimatedFuel-Price
Coordination of Scheduled InterchangeBenefitsAdj. Benefits*
New York - Ontario$66$81
New York - PJM$46$57
New York - New England$10$12
Ontario - MISO$61$75
MISO - PJM$48$59
New York - HQ (Balancing Congestion Reduction)$8$8
New York - HQ (Uplift Reduction)$11$11
Long Island Ties to CT and NJ$5$6
$255$309
AssumedEstimatedFuel-Price
Coordinated Congestion ManagementTotalSavingsBenefitsAdj. Benefits*
Under-priced Congestion
NYISO Forward Loop Flows$7910%$8$10
NYISO Reverse Loop Flows$6110%$6$8
PJM Forward Loop Flows$3710%$4$5
PJM Reverse Loop Flows$3310%$3$4
MISO Forward Loop Flows$1910%$2$2
MISO Reverse Loop Flows$1910%$2$2
Ontario Forward Loop Flows$3010%$3$4
Ontario Reverse Loop Flows$3210%$3$4
Over-Priced Congestion
Ontario Forward Loop Flows$5910%$6$7
Ontario Reverse Loop Flows$5810%$6$7
$427$43$53
Total Estimated Savings - All Interfaces/Constraints$297$362
* Adjusted to a $6 per MMBTU Natural Gas Price-13-
BTC Charges and Transaction Scheduling
• Some object to Buy Through Congestion (“BTC”) charges because they believe BTC
charges would shut-down inter-control area transaction scheduling.
• We evaluate this concern by quantifying the effects of BTC charges on the
profitability of schedules around Lake Erie.
• We evaluate the IESO → MISO → PJM path from Nov 2008 to Oct 2009. This is a
common path that would likely be subject to higher BTC charges than other paths.
The first analysis examines how BTC charges might affect the profitability of
transaction scheduling.
The second analysis discusses the risks posed by BTC charges relative to the risks
posed by the TLR process.
• Based on the results of the analyses, we find that:
BTC charges would generally reduce but not eliminate the incentives to schedule.
BTC charges would not significantly increase the volatility of profits from
scheduling. Rather, it would add one additional factor to the set of uncertainties that participants currently face when forecasting the profitability of a schedule.
The BTC proposal may reduce physical uncertainty because participants that elect to
pay BTC charges are less likely to be curtailed by a TLR.
Finally, participants always have the option to not pay the BTC charges and be
curtailed as they are today.
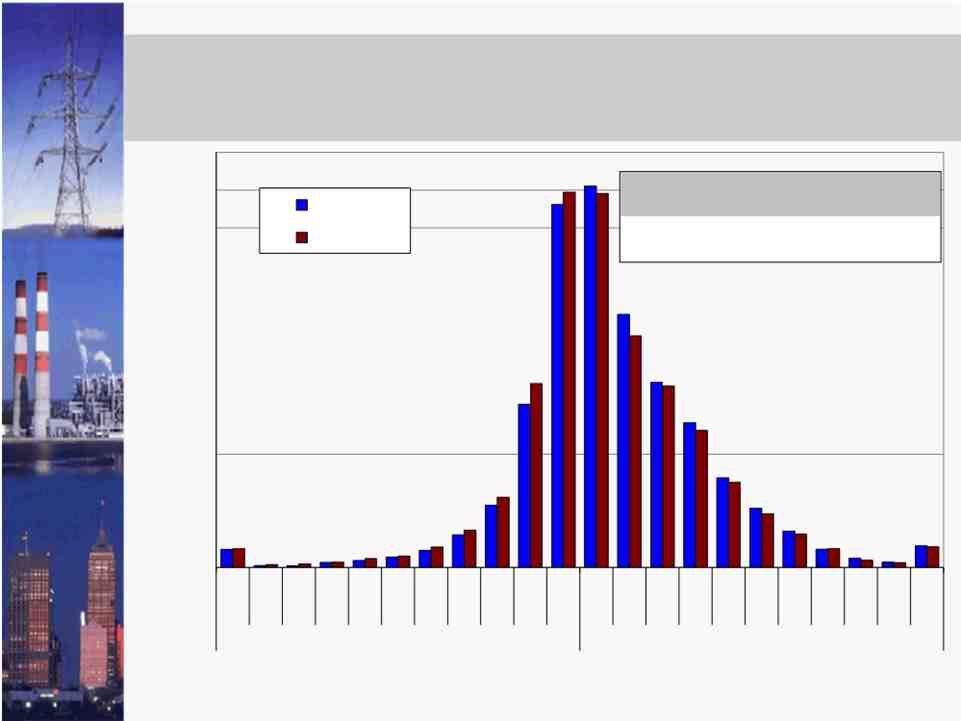
Transaction Profitability -
With and Without BTC Charges
• The following figure summarizes the profitability of scheduling on the IESO to PJM
path during the study period. We assume $5/MWh of scheduling charges.
The blue bars show the share of transaction MWs in each range of profitability
excluding BTC charges for NYISO flowgates.
The maroon bars show the share of transaction MWs in each range of profitability
including BTC charges for NYISO flowgates.
The table summarizes the transaction MW-weighted profitability as well as the
share of transaction MWs that would be profitable with and without BTC charges.
• The figure illustrates that although the BTC charges would reduce the profitability
of these schedules, they would remain profitable. During the study period,
Transactions earned an average of $2.89/MWh if BTC charges are included and
$3.73/MWh if BTC charges are excluded.
The share of transaction MWs that are profitable was 61 percent if BTC charges are
included and 64 percent if BTC charges are excluded.
• The small difference in the two profitability distributions implies that including
BTC charges would not significantly change the overall variability of payoffs.
Hence, participants would not face substantially higher uncertainty about the
profitability of scheduling in a particular hour than they do currently.
-15-
Transaction Profitability -
With and Without BTC Charges
22%
20%
18%
16%
14%
12%
10%
8%
6%
4%
2%
0%
w/o BTC
w/ BTC
Unprofitable
w/o BTC
w/ BTC
Profitability ($/MWh)
Profitability % of Profitable
($/MWh) Transactions
$3.7364%
$2.8961%
Profitable
Note: The figure assumes a transaction fee of $5/MWh
-16-
Transaction Profitability and TLR Events
• The next figure illustrates the how profitability of scheduling was related to the
frequency of TLRs (level 3A and above) called by the NYISO.
The TLR frequencies are shown according to the profitability of transaction
scheduling on the path during the study period.
-For example, a TLR was called in 21 percent of the hours when the profit from
scheduling would have been between $0 and $10/MWh.
The table in the chart reports: (i) the share of hours when a TLR was called, (ii) the
share of profitable hours when a TLR was called, and (iii) the share of unprofitable
hours when a TLR was called.
•TLRswere called more frequently in the hours when transactions would have been
profitable than when they would have been unprofitable.
TLRs were called in 25 percent of the profitable hours and 18 percent of the
unprofitable hours.
This implies that the TLR process is not just a source of uncertainty, but also
reduces the overall profitability of scheduling this path.
The current TLR process may generate greater than the risk and uncertainty than
would result from BTC charges.
Transaction Profitability and TLR Events
35%
% of Hrs
30%
25%
20%
15%
10%
5%
0%
TLR 3A+ in All Hrs
TLR 3A+ in Profitable Hrs
TLR 3A+ in Unprofitable Hrs
>$40-$30-$20-
$50$50$40$30
Unprofitable
23%
25%
18%
$10-$0-$0-$10-
$20$10$10$20
Profitablity ($/MWh)
$20-$30-$40->
$30$40$50$50
Profitable
Note: The figure assumes a transaction fee of $5/MWh, excludes BTC charges, and excludes hours before March 15, 2009 when NYISO did not actively use the TLR process.
Conclusions and Recommendations
•The BRM initiates promise substantial efficiency benefits to themarkets in the
eastern interconnect.
• The congestion coordination proposals will likely achieve efficiency benefits and
should not be a significant barrier to scheduling between and through the RTOs.
• However, the largest source of benefits are the efficiency savings achievable by fully
utilizing the inter-RTO interfaces.
We would recommend this element of the BRM be the highest priority.
Simply shortening the scheduling timeframes would not likely capture a large share
of the potential benefits.
Real-time coordination of the net scheduled interchange (“NSI”) (or intra-hour
scheduling) would likely capture most of the savings.
-This does notconstitute the ISOs participating in the market, just usingbids and
offers in each market to establish the optimal NSIin the same way RTOsestablish
optimal power flows across each transmission interface inside themarkets.
Alternatively, participants could submit “spread bids and offers” indicating their
willingness to import or export power for 15-minutes based on the RTOs’ short-term
forecast of the real-time price difference between the RTOs.
-If the RTOs’forecasts are accurate, participants’bids and offers should approach
zero, allowingprices to converge almost completely.
-19-
CERTIFICATE OF SERVICE
I hereby certify that I have this day served the foregoing document upon each person designated on the official service lists compiled by the Secretary in this proceeding in accordance with the
requirements of Rule 2010 of the Rules of Practice and Procedure, 18 C.F.R. § 385.2010.
Dated at Rensselaer, New York this 14th day of October, 2010.
/s/ Alex M. Schnell
Alex M. Schnell
New York Independent System Operator, Inc.
10 Krey Boulevard

Rensselaer, New York 12144 518-356-8707