
10 Krey Boulevard Rensselaer, NY 12144
January 25, 2012
Kimberly D. Bose, Secretary
Federal Energy Regulatory Commission 888 First Street, N.E.
Washington, D.C. 20426
Re: Errata to Annual Report in Docket No. ER01-3001-000 Dear Ms. Bose:
Enclosed for filing in the above-referenced docket is an errata to the New York
Independent System Operator’s (“NYISO”) annual report to the Federal Energy Regulatory
Commission (“Commission”) on the NYISO’s Demand Side Management programs. By Order
dated February 19, 2010, the Commission directed the NYISO to file this report for
informational purposes only.1 On January 17, 2012, the NYISO filed its annual report (“2011
Demand Response Annual Report”). Subsequently the NYISO identified a reference error in the
source references for Table 22 that caused the hourly SCR response reported in the table to be
overstated. Only the hourly values were incorrect. These data errors have been corrected with
this errata filing.
I.List of Documents Submitted
The NYISO submits:
1.This transmittal letter;
2.Clean version of the revised 2011 Annual Report on Demand Response Programs
(Attachment I); and
3. Blackline version of the 2011 Annual Report on Demand Response Programs marking
the change made to the report submitted on January 17, 2012 (Attachment II).
II.Correspondence
Copies of correspondence concerning this filing should be addressed to:
Robert E. Fernandez, General Counsel
Raymond Stalter, Director of Regulatory Affairs *David Allen, Senior Attorney
New York Independent System Operator, Inc.
1
New York Independent System Operator, Inc., Order, Docket Nos. ER01-3001 and ER03-647 (Feb. 19, 2010).
Kimberley D. Bose, Secretary January 25, 2012
Page 2
10 Krey Boulevard
Rensselaer, N.Y. 12144
Tel: (518) 356-6000
Fax: (518) 356-4702
rfernandez@nyiso.com
rstalter@nyiso.com
dallen@nyiso.com
* persons designated to receive service.
III.Service
This filing will be posted on the NYISO’s website at www.nyiso.com. In addition, the
NYISO will e-mail an electronic link to this filing to the official representative of each party to
this proceeding, to each of its customers, to each participant on its stakeholder committees, to the
New York Public Service Commission, and to the New Jersey Board of Public Utilities.
Respectfully submitted,
/s/ David Allen
Senior Attorney
New York Independent System Operator, Inc.
10 Krey Boulevard
Rensselaer, New York 12144 (518) 356-7656
cc:Michael A. Bardee
Gregory Berson
Connie Caldwell
Anna Cochrane
Jignasa Gadani
Lance Hinrichs
Jeffrey Honeycutt
Michael Mc Laughlin
Kathleen E. Nieman
Daniel Nowak
Rachel Spiker
CERTIFICATE OF SERVICE
I hereby certify that I have this day served the foregoing document upon each person
designated on the official service list compiled by the Secretary in this proceeding in accordance with the requirements of Rule 2010 of the Rules of Practice and Procedure, 18 C.F.R. §385.2010.
Dated at Rensselaer, NY this 25th day of January, 2012.
/s/ Joy A. Zimberlin
Joy A. Zimberlin
New York Independent System Operator, Inc
10 Krey Blvd.
Rensselaer, NY 12114 (518) 356-6207
NYISO 2011 Annual Report on Demand Response Programs
Program Descriptions
The New York Independent System Operator, Inc. (“NYISO”) offers two demand
response programs that support reliability: the Emergency Demand Response Program1
(“EDRP”) and the Installed Capacity-Special Case Resource Program (“ICAP/SCR”). In
addition, demand response resources may participate in the NYISO’s energy market through the Day-Ahead Demand Response Program (“DADRP”), or the Ancillary Services market through the Demand-Side Ancillary Services Program (“DSASP”).
EDRP provides demand resources with the opportunity to earn the greater of $500/MWh or the prevailing locational-based marginal price (“LBMP”) for energy consumption curtailments provided when the NYISO calls on the resource. There are no consequences for enrolled EDRP resources that fail to curtail. Resources participate in EDRP through Curtailment Service
Providers (“CSPs”), which serve as the interface between the NYISO and resources.
The ICAP/SCR program allows demand resources that meet certification requirements to
offer Unforced Capacity (“UCAP’) to Load Serving Entities (“LSEs”). Special Case Resources
can participate in the Installed Capacity (“ICAP”) Market just like any other ICAP Resource;
however, Special Case Resources participate through Responsible Interface Parties, which serve
as the interface between the NYISO and resources. Resources are obligated to curtail when
called upon to do so with two or more hours notice, provided the NYISO notify the Responsible
Interface Party a day ahead of the possibility of such a call. In addition, ICAP/SCR resources are
subject to testing each Capability Period to verify that they can fulfill their curtailment
requirement. Failure to curtail could result in penalties administered under the ICAP program.
Curtailments are called by the NYISO when reserve shortages are anticipated. Resources may
register for either EDRP or ICAP/SCR but not both. Special Case Resources are eligible for an
energy payment during an event, using the same performance calculation as EDRP resources.
The Targeted Demand Response Program (“TDRP”), introduced in July 2007, is a
NYISO reliability program that deploys existing EDRP and SCR resources on a voluntary basis,
1 Terms in upper case not defined herein have the meaning ascribed to them in the NYISO’s Market Administration and Control Area Services Tariff.
Page 1
at the request of a Transmission Owner, in targeted subzones to solve local reliability problems. The TDRP program is currently available in Zone J, New York City.
The DADRP program provides demand resources with an opportunity to offer their load
curtailment capability into the Day-Ahead Market (“DAM”) as an energy resource. Resources
submit offers by 5:00 a.m. specifying the hours and amount of load curtailment they are offering
for the next day, and the price at which they are willing to curtail. Prior to November 1, 2004,
the minimum offer price was $50/MWh. The offer floor price currently is $75/MWh. Offers are
structured like those of generation resources: DADRP program resources may specify minimum
and maximum run times and the hours that they are available. They are eligible for Bid
Production Cost guarantee payments to make up for any difference between the market price received and their block offer price across the day. Load scheduled in the DAM is obligated to curtail the next day. Failure to curtail results in the imposition of a penalty for each such hour equal to the product of the MW curtailment shortfall and the greater of the corresponding DAM or Real-Time Market price of energy.
The DSASP program, introduced in June 2008, provides demand resources that meet
telemetry and other qualification requirements an opportunity to offer their load curtailment
capability into the DAM and/or Real-Time Market to provide Operating Reserves and
Regulation Service. DSASP resources must qualify to provide Operating Reserves or Regulation
Service through standard resource testing requirements. Offers are submitted through the same
process as generation resources. Resources submit offers by 5:00 a.m. specifying the ancillary
service they are offering (Spinning or Non-Synchronous Reserves, and/or Regulation, if
qualified) along with the hours and amount of load curtailment for the next day, and the price at
which they are willing to curtail. Real-time offers may be made up to 75 minutes before the hour
of the offer. Although DSASP resources are not scheduled for energy in the DAM, they are
required to submit energy offers, which are used in the co-optimization algorithm for dispatching
operating reserve resources. Similar to the DADRP, the energy offer floor price is currently
$75/MWh. DSASP resources are not paid for energy. They are eligible for a Day-Ahead
Margin Assurance Payment to make up for any balancing difference between their Day-Ahead
Reserve or Regulation schedule and Real-Time dispatch, subject to their performance for the
scheduled service. Performance indices are calculated on an interval basis for both Reserves and
Regulation. Payment is adjusted by the performance index for the service provided.
Page 2
Summary of Significant Findings
Emergency Demand Response Program / ICAP Special Case Resources
As of July 31, 20112, a total of 35 CSPs and Responsible Interface Parties have resources
enrolled in the NYISO’s EDRP and/or ICAP/SCR programs3. This level of participation
represents a reduction of two load serving entities, eleven aggregators, four transmission owners, and five resources representing themselves (referred to herein as a “direct resource”) since 2010 figures. Participating CSPs and RIPs include:
•4 Transmission Owners
•3 Load Serving Entities not affiliated with a Transmission Owner (“Competitive LSE”)
•20 aggregators that are not Load Serving Entities or Transmission Owners
•7 EDRP or ICAP/SCR direct resources
Resource representatives that are not Transmission Owners or affiliates thereof, including
Load Serving Entities not affiliated with Transmission Owners and aggregators, currently
sponsor 59.5% of the total EDRP and ICAP/SCR enrolled MW, down from the 75.4% enrolled
in 2010. In 2011, one non-Transmission Owner had resources enrolled in the EDRP program; all
other EDRP resources were enrolled through Transmission Owners. Direct resources represent
7.7% of the enrolled MW in the ICAP/SCR program or 6.9% of the combined reliability program MW.
EDRP and ICAP/SCR had a total of 5,807 end-use locations enrolled capable of providing a total of 2,173.2 MW of demand response capability, a 13% decrease over the 2010 MW
2 For several years, August 31 has been the date customarily used for reporting NYISO’s demand
response program participation statistics. In 2011, the NYISO made a change from reporting demand response enrollment as of August 31 each year to July 31 of each year to better align with several other reporting requirements for reliability and planning. Reporting as of July 31 also provides transparency with other reporting requirements for demand response. The NYISO evaluated the difference in
enrollment between July and August and found it to be nominal (2% - 3%).
3 The report on reliability programs is based on a snapshot of the programs as of July 31, 2011.
Page 3
enrollment level. The demand response resources in NYISO reliability programs represent 6.4%
of the 2011 Summer Capability Period peak demand of 33,866 MW, a nominal reduction from
2010. There were 417 end-use locations in EDRP (200 EDRP plus 217 Unsold SCRs) and 5,390
end-use locations in ICAP/SCR. ICAP/SCR represents 93% of the total resources enrolled in the
NYISO’s reliability programs and 91% of the reliability programs’ total enrolled MW. The
2011 SCR enrollments increased 32% while the enrolled MWs off load reduction decreased
13% over 2010. The Targeted Demand Response Program, which deploys EDRP and
ICAP/SCR resources in subzones of Zone J (New York City) for local reliability, included 56%
of total NYCA EDRP end-use locations and encompassed 34% of total NYCA EDRP MW. The
TDRP also included 46% of total NYCA ICAP/SCR end-use locations, representing 23% of the
total NYCA enrolled ICAP/SCR MW, an increase of 2% and a decrease of 1%, respectively.
Since participation in EDRP and ICAP/SCR became mutually exclusive, EDRP end-use
locations and MW have continued to decrease while ICAP/SCR end-use locations and MW have
increased, as expected, given the monthly reservation payment associated with the ICAP/SCR
program. Aggregations by Responsible Interface Parties now account for 97.2% of ICAP/SCR
resources and 65% of enrolled MW in the program, a decrease from 2010 in enrolled MW of
almost 3.6%.
There were two deployments of the ICAP/SCR and EDRP programs during July 2011. The NYISO deployments of the ICAP/SCR and EDRP programs occurred from 1:00 p.m. to 6:00 p.m. (HB 13 through HB 17) for zones G through K on July 21, 2011, from 12:00 p.m. to 6:00 p.m. (HB 12 through HB 17) on July 22, 2011 in zone J, and from 1:00 p.m. to 6:00 p.m. (HB 13 through HB 17) in zones A, B, C, E, F, G, H, I, and K on July 22, 2011. Details on the 2011
demand response events is provided in the section titled “2011 Event Performance for
Emergency Demand Response Program and ICAP Special Case Resources.”
Day-Ahead Demand Response Program
During the analysis period of September 2010 through August 2011, only one resource
made offers for a period on a single day and the resource was scheduled for only two of the
hours it offered its reduction and for fewer than three MW in each of those two hours. Given the
minimal activity in DADRP during the analysis period, there is nothing material to report for this
period.
Page 4
Participation in Reliability-Supporting Demand Response Programs
Aggregation of ICAP/SCR Resources
Enrollments for ICAP/SCR resources are tracked by both (a) end-use location and (b) Program
ID. Program IDs, used to identify demand resources4 in NYISO’s systems, may represent
individually enrolled end-use locations or aggregations of end-use locations enrolled as a single
resource. Table 1 indicates that there are a total of 99 aggregations represented by Responsible
Interface Parties, collectively containing a total of 5,315 end-use locations with 1,697.7 MW of
the total 1,976.2 MW of enrolled ICAP/SCR. Seventy-five (75) individually enrolled resources
account for 278.5 MW.
Table 1: Detail of 2011 ICAP/SCR Program Participation Level by Resource Type
Resource Type
Individual Resources
Aggregated Resources
Total
ICAP^ICAP Unsold
# Program# End-useSold# Program# End-useEnrolled
IDsLocationsMWIDsLocationsMW
7575278.5131343.6
9953151697.7192044.9
17453901976.23221748.6
MW represent the ICAP equivalent MW sold in the ICAP market in July 2011.
^ Nine individual resources, with a total ICAP equivalent of 30 MW have been omitted
from enrollment and event performance reporting until data submission issues are
resolved.
The right-hand section of Table 1 provides information for ICAP/SCR resources that did
not sell MW in the July 2011 capacity market auctions. In cases where an ICAP/SCR resource
offers load reduction in a NYISO auction and it is not sold, or when the resource’s derated MW
value is zero, that resource is automatically included in the EDRP program at its enrolled MW
value until the next auction or until the resource confirms a bilateral transaction with an LSE.
The EDRP program totals reported include the offered, but unsold MW of enrolled ICAP/SCR
resources.
4 A resource is defined as a single end-use location enrolled in a program individually or an aggregation of end-use locations enrolled as a unit; resources are identified by a Program ID.
Page 5
EDRP and ICAP/SCR Program Enrollment
At the end of July 2011, the NYISO’s reliability programs had a total of 5,807 end-use locations enrolled, providing a total of 2,172.9 MW of demand response capability, a 13%
reduction over the 2010 MW enrollment level. There were 417 end-use locations in EDRP (200 EDRP resources + 217 ICAP/SCR Unsold resources) and 5,390 end-use locations in ICAP/SCR. ICAP/SCR represents 93% of the total reliability program resources and 91% of the total
reliability program MW, a decrease of 13% in the ICAP/SCR program.
Table 2: 2011 Program Enrollment Summary by Curtailment Service Provider Type
EDRP (1)ICAP Unsold (2)
##
ICAP (3)^DADRP (4)
##
CSP
Type #
20
0
7
4
4
35
Agent Type# CSP End-use
Locations
Aggregator1*
End-Use Customer00
Direct Customer00
LSE00
Transmission Owner3*
Total4200
EnrolledEnrolled
# RIPEnd-use
MWMW
Locations
0.381444.7
0.0000.0
0.01*40.8
0.02693.0
147.81*0.1
148.11221748.6
ICAP
# RIPEnd-use# DRPEnd-useMW
MW
LocationsLocations
2045351010.21*9.0
000.0000.0
739152.1000.0
3707274.92*15.0
4109538.91*13.0
3453901976.24437.0
*
Number of end-use locations by category is fewer than 5 and has been masked for this public version of the table. The unredacted values are presented in the confidential appendix submitted as Attachment 1.
Note 1: The sum of EDRP and SCR Unsold Enrolled MW = Total EDRP.
Note 2: Resources in the ICAP/SCR program with Unsold capacity are considered EDRP resources in the month(s) that capacity is
unsold. MW represent Enrolled MW in the ICAP program, but not sold.
Note 3: MW represent the ICAP equivalent MW sold in the ICAP market in July 2011.
Note 4: Total NYISO enrollment is not necessarily the sum of all programs due to the rules that state that end-use locations are
allowed to participate in a reliability program (EDRP or ICAP) and economic (DADRP or DSASP).
^ Nine individual resources, with a total ICAP equivalent of 30 MW have been omitted from enrollment and event performance
reporting until data submission issues are resolved.
Table 2 shows the total number of CSPs enrolled for 2011 in the first column and the
number of CSPs, by type, with the number of end-use locations and enrolled MW for each of the program categories. This table provides the enrollment detail by program and CSP type.
Enrollments in EDRP in 2011 were predominantly through Transmission Owners.
ICAP/SCR enrollments by aggregators provide 84.1% of participating end-use locations and
51.1% of the enrolled MW.
Table 3 shows program enrollment detail by Load Zone. Although statistics on resource class are not collected, resources in Zones A through E are typically industrial and retail
resources, while those in Zones J and K include commercial office, retail, and multi-family
residential resources.
Page 6
Table 3: 2011 Program Enrollment by Zone
EDRP (1)
Enrolled
ICAP Offered/Unsold (2)
Enrolled
ICAP (3)^
ICAP
DADRP (4)
Zone
A
B
C
D
E
F
G
H
I
J
K
Total
#
13
*
27
8
26
10
13
*
13
86
0
200
MW
10.5
1.0
15.1
3.7
25.1
5.3
17.1
1.8
3.7
64.8
0.0
148.1
#
MW
1642.3
90.1
*0.0
*0.1
91.0
50.2
*0.2
00.0
*0.2
1482.7
221.9
21748.6
#
MW
522347.8
264120.5
366136.9
23457.6
16845.6
213137.7
16767.1
2610.1
14936.9
2496464.1
996152.0
53901976.2
#MW
00.0
00.0
00.0
00.0
00.0
*28.0
*9.0
00.0
00.0
00.0
00.0
437.0
*
Note 1:
Note 2:
Note 3:
Note 4:
^
Number of end-use locations by category is fewer than 5 and has been masked for this public version of the table. The unredacted values are presented in the confidential appendix submitted as Attachment 1.
The sum of EDRP and SCR Unsold Enrolled MW = Total EDRP.
Resources in the ICAP/SCR program with Unsold capacity are considered EDRP resources in the month(s) that capacity is unsold. MW represent Enrolled MW in the ICAP program, but not sold.
MW represent the ICAP equivalent MW sold in the ICAP market in July 2011.
Total NYISO enrollment is not necessarily the sum of all programs due to the rules that state that end-use locations are allowed to participate in a reliability program (EDRP or ICAP) and economic (DADRP or DSASP). Nine individual resources, with a total ICAP equivalent of 30 MW have been omitted from enrollment and event performance reporting until data submission issues are resolved.
Targeted Demand Response Program Enrollment
Load Zone J currently is the only Load Zone with resources assigned to the Targeted
Demand Response Program. This Zone has been divided into subzones designated by
Consolidated Edison Company of New York, Inc. (“Con Edison”) Resources enrolled in EDRP and ICAP/SCR are assigned to one of the various subzones based on their location. Unassigned resources remain in the general Zone J category (J9: Shared Subzone). The sub-load pockets correspond to the following Con Edison network area substation groupings:
• J1: Sherman Creek/Parkchester/E
179th
• J2: Astoria West/Queensbridge
• J3: Vernon/Greenwood • J4: Staten Island
• J5: Astoria East/Corona/Jamaica
Page 7
• J6: W 49th• J8: Farragut/Rainey
• J7: E13th/East River• J9: Shared Subzone
Table 4: EDRP End-use Locations enrolled in the Targeted Demand Response Program -
Zone J
J1J2J3J4J5J6J7J8J9Total
MW0.41.06.90.87.32.22.21.043.064.8
End-use Locations5619*217914*86
Number of end-use locations by category is fewer than 5 and has been masked for this public
* version of the table. The unredacted values are presented in the confidential appendix submitted as
Attachment 1.
Table 5: ICAP/SCR End-use Locations enrolled in the Targeted Demand Response Program - Zone J
J1J2J3J4J5J6J7J8J9Total
MW50.225.052.627.828.260.972.089.70.0406.6
End-use Locations1531845079827024035655502363
Historical Enrollment in Reliability Programs
Figure 1 plots the growth in the NYISO’s reliability-based programs from inception
through July 2011. The stacked area plots enrolled MW by program and year. The lines plot the
number of end-use locations by program and year. From May 2001 through July 2011,
combined enrollment in EDRP and ICAP/SCR has grown from approximately 200 MW to
2,172.9 MW; and the total number of end-use locations has increased from approximately 200 in
March 2002 to 5,816. Since participation in EDRP and ICAP/SCR became mutually exclusive,
EDRP resources and MW have continued to decrease while ICAP/SCR resources and MW have
increased.
Page 8


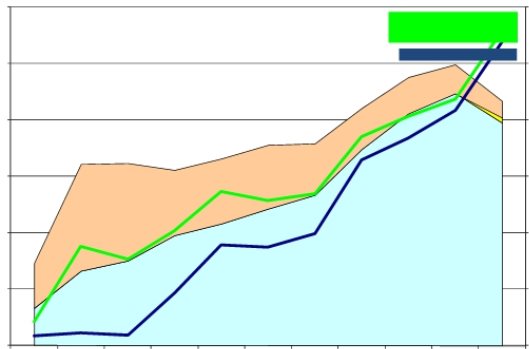
Figure 1: Historical Growth in Resources and MW in NYISO Reliability Programs
3000
2500
2000
1500
1000
500
0
Total Reliability MW: 2173
Total Reliability End-use Locations: 5807
EDRP MW
ICAP/SCR MW
200120022003200420052006
EDRP End-use Locations: 200 +
Unsold SCR End-Use Locations:
217
SCR End-Use Locations 5390
20072008200920102011
6000
5000
4000
3000
2000
1000
0
ICAP/SCR MWUnsold SCREDRP MWICAP/SCR End-use LocationsEDRP End-use Locations
Changes in Program Enrollment
Table 6 shows the program enrollment changes by number of program IDs enrolled.
Program IDs, which are used to represent a resource in NYISO’s market systems, may represent individual end-use locations or aggregations of end-use locations. Table 7 shows the program enrollment changes by number of end-use locations.
Page 9
Table 6: Program Enrollment by Program ID - Changes 2010 to 2011
2010
CountMW
EDRP207257.3
ICAP/SCR
Unsold82.0
ICAP/SCR2052238.5
DADRP22331.4
2011
MW
Change
CountMW
200148.1-109.2
21748.646.6
1741976.2-262.3
4 37.0 -294.4
Percent Change FromSubscribed MW per
2010 to 2011Program ID
ProgramSubscribedPercent
ID CountMW20102011Change
-3%-42%1.240.74-40%
2613%2349%0.250.22-10%
-15%-12%10.9211.364%
-82%-89%15.069.25-39%
Table 7: Program Enrollments by End-use Location - Changes 2010 to 2011
2010
CountMW
EDRP207257.3
ICAP/SCR
Unsold82.0
ICAP/SCR41712238.5
DADRP50331.4
2011
MW
CountMWChange
200148.1-109.2
21748.646.6
53901976.2-262.3
4 37.0 -294.4
Percent Change FromSubscribed MW per
2010 to 2011End-use location
End-use
LocationSubscribedPercent
CountMW20102011Change
-3%-42%1.240.74-40%
2613%2349%0.250.22-10%
29%-12%0.540.37-32%
-92%-89%6.639.2540%
Table 7, which shows changes in enrollment by end-use location, depicts significant
changes in all programs since the year-end report for Summer 2010. Changes in the number of enrolled resources in the ICAP/SCR Unsold category for July 2011 can be attributed to one or more of the following: the change in baseline methodology which could result in a baseline that was higher than in previous years; poor performance factors which would leave some resources with little or no capacity to sell; or offered capacity that did not sell in an ICAP auction. As
reported in the June 2011 report, enrollment in ICAP/SCR was expected to decrease due to the change to the baseline methodology that went into effect for the Summer 2011 Capability Period. The impacts of the rule change are discussed in detail below in the section titled “Impact of 2011 Market Rule Changes to ICAP/SCR Enrollment for Summer 2011.”
Enrollment in DADRP has been static for several years and many of the enrolled
resources have shown no bidding activity in the market in at least the last two years. The changes
in enrollment in DADRP are of two types: resources that formally withdrew from the DADRP
program in 2011 (7 resources, 26.4 MW) or resources that have been removed from reporting
due to inactivity since 2008 to provide a more accurate representation of the enrolled MW in the
Page 10
DADRP (20 resources, 268 MW). The DADRP resources that have been removed from
reporting are still eligible to make offers in the day-ahead energy market and will be counted in future enrollment reports if their bidding activity changes.
Figures 2 through 4 track enrollment and MW in EDRP, ICAP/SCR and DADRP,
respectively, over the period 2001 through 2011. The primary difference between Figures 2 and
3 is the representation of ICAP resources: Figure 2 shows percent change and average
subscribed MW by Program ID, while Figure 3 shows percent change and average subscribed
MW by end-use location. Figure 2 shows the number of Program IDs, including individually
enrolled resources and aggregated resources. Figure 3 provides information on the total number
of end-use locations. Seventy-five (75) individually enrolled resources account for 278.5 MW.
ICAP/SCR enrollment of end-use locations was initiated in 2004; prior to that period, the
enrolled resources shown in Figures 2 and 3 for ICAP/SCR were based on program IDs, also
referred to as Aggregation IDs. In addition, during 2001 and 2002, program enrollment was non-
exclusive, i.e., an end-use location could register for both EDRP and ICAP/SCR. Beginning in
2003, participation in the EDRP and ICAP/SCR programs became mutually exclusive.5
Figure 4 shows that since making EDRP and ICAP/SCR mutually exclusive, the general
trend has been for EDRP enrollment and MW to decrease and ICAP/SCR enrollment and MW to
increase, as expected, given the monthly reservation payment associated with the ICAP/SCR
program.
5 Pursuant to the tariff, SCRs may participate in both the EDRP and the ICAP/SCR programs
concurrently if the resource has metering to distinguish the MWs of Demand Reduction in the Special
Case Resource from the MWs in the Emergency Demand Response Program. The metering requirement supports the program rule that MW cannot be committed both as Unforced Capacity and to the
Emergency Demand Response Program.
Page 11
Figure 2: Demand Response Program Enrollment History by Program ID, 2001 - 2011
1600
1400
1200
1000
800
600
400
200
0
20012002200320042005200620072008200920102011
EDRPICAP/SCRDADRP
Figure 3: Demand Response Program Enrollment History by Number of End-use locations,
2001 - 2011
6000
5000
4000
3000
2000
1000
0
20012002200320042005200620072008200920102011
EDRPICAP/SCRDADRP
Page 12
Figure 4: Demand Response Program MW Enrollment History, 2001 - 2011
2500
2000
1500
1000
500
0
20012002200320042005200620072008200920102011
EDRP MWICAP/SCR MWDADRP MW
Impact of 2011 Market Rule Changes to ICAP/SCR Enrollment for Summer 2011
In the mid-year compliance filing on demand response, the NYISO reported on the
impact of the 2011 Market Rule Change from APMD to ACL baseline methodology and believes that this change also contributed to the reduction in MW enrolled for July 2011.
To evaluate the impact of the 2011 Market Rule Change from the APMD to the ACL baseline methodology on the amount of enrolled MW the NYISO compared enrollment
characteristics of resources that were enrolled in both July 2010 and July 2011. The 3,308
resources analyzed represent 79% of the number of resources enrolled in July 2010 and 61% of the number of resources enrolled in July 2011.The NYISO analyzed two aspects of the data that may have contributed to the reduction:
• Comparison of APMD and ACL to determine impact of change to gross
resource capacity; and
• Comparison of Committed Maximum Demand (CMD) for July of each year
to determine whether resources adjusted the amount of capacity (the Declared
Value) they could make available.
Page 13
o Declared Value is calculated by subtracting the CMD from the resource’s
baseline (APMD or ACL) and is the basis for the enrolled capacity of the
resource.
Table 8 below illustrates how a change to the 2011 CMD affects the Declared Value of a
resource, depending on whether the 2011 ACL is greater or less than the 2010 APMD. The table
includes the end-use location count and MW change for each of the possible combinations in
enrollment for July 2011. To illustrate the impact of enrollment changes, Figure 5 provides an
example of the combination shown in the first two cells of the first shaded row in Table 8: when
the 2011 ACL of a re-enrolled resource is less than the 2010 APMD and the resource raises its
CMD, the result is a lower Declared Value for July 2011. The 100 kW reduction from the 2010
APMD to the 2011 ACL plus the 100 kW increase in the 2011 CMD resulted in a 200 kW
reduction to the 2011 Declared Value. Keeping the same CMD value for 2011 would result in a 100 kW reduction from the 2010 Declared Value.
Figure 5. Example of Impact from Enrollment Changes
1800
1600
2010 APMD
1400
1200
1000
800
600
400
200
0
100 KW change
2010 Declared2011 Declared
ValueValue
100 KW change
2010 APMD - 2010 CMD = 2010 Declared Value
1550 KW - 550 KW = 1000 KW
2011 ACL - 2011 CMD = 2011 Declared Value
1450 KW - 650 KW = 800 KW
2011 ACL
2011 CMD
2010 CMD
Page 14
Table 8. July 2011 Enrollment Changes for Re-enrolled Resources
Enrollment
Change
2011 ACL ≤
2010 APMD
Higher CMD
Lower Declared
Value than 2010
Same CMD as
2010
Lower Declared
Value than
2010
Lower CMD
Same Declared Value
as 2010 or Increase
over 2010 Declared
Value
Net Impact from
Lower CMDRe-enrolled
Resources
Lower Declared
Value than 2010
End-use
Locations
591
66454
9532064
MW(133)
Same Declared
2011 ACL >Value as 2010 or
2010 APMDLower Declared
Value than 2010
(13)
Increase over
2010 Declared
Value
32
Increase over 2010
Declared Value
(255)(369)
End-use
Locations
937
33274
1,244
End-use
Locations
1,528
99728
9533,308
Totals (MW)(173)(11)68(255)(370)
There was a 262 MW reduction in ICAP/SCR enrollment from 2010. The net impact of
the ACL baseline methodology change for re-enrolled resources was a reduction in Declared
Value of 370 MW, which exceeds the net reduction in enrolled MW for July as shown in Table 7 above. The 29% increase in enrolled end-use locations (e.g., new resources) mitigated the
reduction from 2010.
The first column of Table 8 shows that, for the 2,064 resources where the ACL method
resulted in a baseline that was less than or equal to the APMD method, the change to Declared
Value MW was a reduction of 369 MW. The net reduction in Declared Value MW from the
1,244 resources that realized an ACL greater than their July 2010 APMD, was 1 MW.
The second through fifth columns of Table 8 provide detail on the effect of the change to
the Committed Maximum Demand on the quantity of enrolled MW, and the number of resources
that made the change. Resources that maintained the same Committed Maximum Demand as
last year show a net reduction of 11 MW (column 3, last row). Resources that lowered their
Page 15
Committed Maximum Demand6 show a net reduction of 187 MW enrolled (columns 4 + 5, last
row).
Analysis of ICAP/SCR Strike Prices
Beginning in 2003, resources in the ICAP/SCR program were required to indicate, at the time of enrollment, a curtailment strike price, between $0-$500/MWh, which would be used by the NYISO to determine which resources to call for curtailments when all resources in a given Zone or Zones are not needed to restore system security to its equilibrium state.
To characterize how resources responded to this requirement, strike price curves were
developed for all resources for 2011. The curves map out the percentage of enrolled MW at a
given strike price. Figure 5 illustrates the strike price curves for 2003 to 2011, covering the
period of time that the program provision has been in place. The steeper slope for the strike
price curve overall indicates that strike prices are clustered close to the offer ceiling of
$500/MWh. It is evident that resources, over time, have increased the number of higher strike prices. Figure 6 is a detailed view of the strike price curves for the past four years, 2007 through 2011, and displays a limited range where the price curve levels off to the offer ceiling. The strike price curves for 2010 and 2011 have the same shape.
6 One reason a resource may have lowered its Contract Minimum Demand is in recognition of a change to its SCR baseline that resulted from the 2011 Market Rule Changes.
Page 16


Figure 6: 2003 - 2011 ICAP/SCR Curtailment Bid Curves
500
450
400
350
300
250
200
150
100
50
0
0%
500
450
400
350
300
250
200
150
100
50
0
2003 (758 MW)
2004 (980.8 MW)
2005 (1083.8 MW)
2006 (1216.2 MW)
2007 (1338.5 MW)
2008 (1743.8 MW)
2009 (2060.6 MW)
2010 (2238.5 MW)
2011 (1976.2 MW)
25%50%75%100%
% of Total MW
Figure 7: 2007 - 2011 ICAP/SCR Curtailment Bid Curve Detail
2.41%
2.29%
1.20%
2007 (1338.5 MW)
2008 (1743.8 MW)
2009 (2060.6 MW)
2010 (2238.5 MW)
2011 (1976.2 MW)
0.54%
0.52%
0%1%2%3%4%5%6%
% of Total MW
Page 17
2011 Event Performance for Emergency Demand Response Program and ICAP/Special Case Resources
In 2011, the NYISO deployed EDRP and SCR resources on two occasions. There were two deployments of the ICAP/SCR and EDRP programs during July 2011. The NYISO
deployments of the ICAP/SCR and EDRP programs occurred on July 21, 2011 and July 22, 2011. The 2011 deployments were as follows:
July 21:
SCR and EDRP resources were deployed in Zones G, H, I, J, and K from 1 p.m. to 6 p.m. (HB 13 through HB 17) for transmission security operations, the requirement to restore system power flows to within normal operating limits. Scarcity pricing was not applied because a
reserve shortage was not identified.7
July 22:
SCR and EDRP resources were deployed in Zone J from 12 p.m. to 6 p.m. (HB 12
through HB 17) and in zones A, B, C, E, F, G, H, I, and K from 1 p.m. to 6 p.m. (HB 13 through HB 17) SCR and EDRP resources in Zones G through K were deployed for transmission security operations. SCR and EDRP resources in Zones A, B, C, E, and F were deployed to meet
statewide capacity requirements in response to import transaction curtailments and nearly 1600 MW of load forecast error; about 90% of the load forecast error was due to weather forecast
error. Scarcity pricing was applied for certain intervals.
The following intervals, based on end timestamps, were subject to EDRP/SCR Scarcity Pricing Rule A (impacting NYCA): 13:05 - 13:10, 13:17 - 15:00, and 16:05 - 17:05.
The following intervals, based on end timestamps, were subject to EDRP/SCR Scarcity Pricing Rule B (impacting the East): 13:15, 15:05 - 16:00, and 17:25.
7 2011 demand response event information presented by Emilie Nelson to Market Issues Working Group, August
29, 2011: http://www.nyiso.com/public/webdocs/committees/bic_miwg/meeting_materials/2011-08-
29/MIWG_ScarcityPricing_July2011_Overview_Final.pdf
Page 18
NYISO Demand Response Program Events
Table 9 provides a summary of average hourly response by SCR and EDRP resources during the two demand response events on July 21, 2011 and July 22, 2011. Detailed hourly event performance by program is provided in the sections below.
Table 9. Summary of July 2011 Demand Response Event Performance
Average
Average
Hourly
PerformanceZones
Enrolled MW
SCR (MW) EDRP (MW) Total
Hourly
Performance
%
July 21, 2011G, H, I J, K658.97.6666.5823.580.9%
July 22, 2011A, B, C, E, F, G, H, I, J, K1396.421.11417.51697.483.5%
ICAP/SCR Capacity Performance
Tables 10 and 11 contain performance figures based on the ICAP/SCR reporting rules
contained in the NYISO’s Installed Capacity Manual. ICAP/SCR performance is determined by comparing the actual hourly interval metered energy with the Average Coincident Load (ACL):
RED_MWgn = ACLgm - METER_MWgn
where:
• RED_MWgn is the Installed Capacity Equivalent performance that Resource g supplies
during hour n of an SCR event;
• ACLgm is the Average Coincident Load for Resource g applicable to month m, using data
submitted in its Special Case Resource Certification; and
• METER_MWgn is the metered hourly-integrated energy for Resource g in hour n of an SCR
event.
Performance using this measure compares actual reduction with the Installed Capacity Equivalent (ICAP) of the resource’s reduction capability sold. Individual resource performance factors used to determine the kW that can be sold in the next like Capability Period (i.e., Summer or Winter) are based on the four highest contiguous hours of reduction during each event as well as performance during mandatory tests.
Page 19
Table 10: SCR MW Performance Based on ICAP Measures - July 21, 2011
21‐JulMWh
ZoneHB 13 HB 14
HB 15HB 16 HB 17
Average
Hourly MW
% Performance
ICAP MWof ICAP
All Event Hours
G58.263.165.866.464.363.669.691.3%
H9.810.010.210.310.410.110.1100.5%
I20.726.127.829.130.226.835.376.0%
J402.6429.0438.9449.1465.7437.1464.194.2%
K109.7117.5121.9127.5130.2121.3152.079.8%
Total601.1645.8664.6682.3700.7658.9731.190.1%
Table 11: SCR MW Performance Based on ICAP Measures - July 22, 2011
ZoneHB 12 HB 13
HB 14HB 15 HB 16
HB 17
Average
Hourly MW
% Performance
ICAP MWof ICAP
All Event Hours
A305.1326.6341.1343.6347.5332.8334.499.5%
B96.5102.4105.4107.5109.7104.3120.586.5%
C110.9128.8135.6140.1140.5131.2136.995.8%
E39.149.652.754.555.350.245.6110.2%
F116.2127.0130.5135.4133.2128.4137.793.3%
G61.366.169.070.069.867.367.2100.1%
H8.78.88.88.99.08.810.187.7%
I26.327.128.028.932.028.536.977.2%
J367.3393.8437.9456.2472.0499.2437.7464.394.3%
K96.0102.8107.9113.1116.1107.2152.070.5%
Total367.31253.81377.01435.11473.91512.41396.41505.492.8%
NYISO Event Energy Performance and Payments
In addition to compensation for committing to reduce Capacity, resources in ICAP/SCR
are also paid for their actual energy reduction during a called event. To compute energy
payments, performance is determined using a Customer Baseline Load (CBL) computed using
recent historical data to determine what the resource’s energy consumption would have been if
the Special Case Resource had not reduced its load. This computation method is the same
Page 20
method used in the EDRP program to measure load reduction eligible for energy payment.8 For settlement of the energy payment, the amount of load reduction is equal to the difference
between the hourly CBL and hourly interval meter readings..
Tables 12 and 13 present a energy reduction data for ICAP/SCR resources that performed
in the NYISO’s ICAP/SCR events. Since the ICAP/SCR ACL values are determined for the
prior like Capability Period and the CBL is determined from load data that ranges from two
weeks to 30 days prior to the event, differences in performance can be expected. Contributing
to the difference between the capacity performance reported above and the energy performance
reported (in Tables 12 and 13) is the fact that not all Responsible Interface Parties submitted
CBL energy performance data. The NYISO has observed that some RIPs only submit CBL data
for larger resources, particularly in Zone J where energy prices are typically higher than the rest
of the NYCA. Tables 14 and 15 provide details on the energy payments made to SCRs for the
July 21 and July 22 events, respectively.
Table 12: SCR Energy Performance based on CBL - July 21, 2011
Hourly CBL Performance for SCRs Reporting Energy Performance
21‐JulMWh
ZoneHB 13 HB 14
HB 15HB 16 HB 17
Average
Hourly MW
CBL
ICAP MW Performance as
% of ICAP
G42.146.045.242.137.042.543.996.9%
H9.09.29.29.18.69.08.8102.2%
I25.731.533.834.530.731.225.5122.4%
J230.6251.8251.5243.0217.7238.9263.690.6%
K82.289.689.286.077.985.0115.573.6%
Table 13: SCR Energy Performance based on CBL - July 22, 2011
Hourly CBL Performance for SCRs Reporting Energy Performance
22‐JulMWhMWh
ZoneHB 12HB 13
HB 14HB 15HB 16HB 17
Average
Hourly MW
CBL
ICAP MW Performance as
% of ICAP
A293.8309.7314.9307.1300.6305.2305.3100.0%
B65.470.368.161.754.764.087.073.6%
C91.3100.295.590.477.691.0109.283.3%
E28.737.135.733.529.732.938.186.5%
F114.9127.5125.6125.5116.7122.0121.5100.5%
G47.252.149.850.956.551.350.5101.7%
H8.08.08.18.07.57.97.9100.0%
I31.733.334.635.634.233.924.7136.9%
J212.8240.6273.6282.8279.6257.6257.8278.592.6%
K76.080.981.178.573.077.9106.673.1%
Total212.8997.81092.61096.21070.81008.01044.11129.392.5%
Table 14: SCR Energy Payments - July 21, 2011
21‐Jul
ZoneHB 13 HB 14
HB 15HB 16 HB 17
Sum of LBMP Sum of BPCG
Payments Payments
Total Payments
J$ 4,513$ 5,491$ 0,151$ 2,411$ 6,057$$ 38,603$ 97,225
K$ 0,191$ 4,733$ 0,816$ 1,839$ 2,855$ 0,434$ 52,009$ 12,443
Total$ 2,951$ 2,749$ 0,840$ 5,015$ 0,893$$ 44,136$ ,016,583
Table 15: SCR Energy Payments - July 22, 2011
22‐Jul
ZoneHB 13
A $ 15,424
HB 14HB 15HB 16HB 17
$ 30,507 $ $ 26,898 $
Sum of LBMP Sum of BPCG
Payments Payments
$ $ 11,752
Total Payments
$ 48,449
B$$$ ,039$$ ,461$ 9,622$$ 56,242
E$$$ ,082$$ ,835$ 4,660$$
H$ ,061$ ,234$ ,660$ ,143$ ,602$ 8,700$ ,148$
I$$ 7,684$$$ ,328$ 9,668$ ,031$
J$ 16,921$ 21,486$ 44,744$ 63,110$ 55,291$$$ ,913$ 73,499
Total$ 16,921$ 55,283$ 28,273$ 82,447$ 20,623$ 84,065$$ 19,225$ ,706,837
Page 22
Tables 16 and 17 report the July 2011 event energy reductions of EDRP resources
computed using the CBL method. Performance of EDRP resources during both events varied
greatly by zone, with overall performance on both days near 10%. It is important to note that the enrolled MW values shown below that are used to compute performance include unsold SCRs as reported in Table 3.
Table 16: Energy Reductions of EDRP Resources - July 21, 2011
21‐JulMWh
ZoneHB 13 HB 14
Average
HB 15HB 16HB 17 Hourly
MW
Enrolled % Performance
MW of Enrolled MW
G0.20.20.10.00.00.117.31%
J5.05.76.87.05.56.067.59%
K1.11.51.21.20.61.11.960%
Total6.57.88.58.86.67.692.48%
Table 17: Energy Reductions of EDRP Resources - July 22, 2011
22‐JulMWh
ZoneHB 12 HB 13
HB 14HB 15 HB 16
HB 17
Average
Hourly MW
Enrolled
(MW)
% Performance
of Enrolled
(MW)
A0.30.30.40.70.70.552.80.9%
B0.00.00.00.00.00.00.00.0%
C1.52.01.61.41.41.615.110.5%
E3.65.54.43.11.63.626.114.0%
F0.60.70.70.50.30.55.59.9%
H0.00.10.10.00.00.01.82.7%
I0.50.60.50.60.50.53.913.8%
J12.612.413.313.613.712.313.067.519.2%
K1.01.11.01.11.21.11.958.0%
Total12.620.123.722.621.218.021.1191.911.0%
Page 23
Tables 18 and 19 report the July 2011 event energy payments of EDRP resources.
Table 18: Energy Payments to EDRP Resources - July 21, 2011
21‐Jul
ZoneHB 13 HB 14
HB 15HB 16 HB 17
Total Energy
Payments
J$2,499$2,872$3,375$3,521$2,766$15,032
K$555$772$596$590$316$2,830
Total$3,267$3,922$4,262$4,376$3,278$
Table 19: Energy Payments to EDRP Resources - July 22, 2011
22‐Jul
Total
ZoneHB 12HB 13HB 14HB 15HB 16HB 17Energy
Payments
A$151$139$220$356$346$1,213
B$‐$‐$‐$‐$‐$‐
C$759$1,001$822$704$684$3,970
E$1,820$2,745$2,193$1,540$810$9,109
F$278$340$357$265$125$1,365
G$82$88$78$21$‐$270
H$21$41$32$22$11$127
I$249$296$323$306$246$1,419
J$6,897$6,251$7,028$7,858$7,595$6,153$41,781
K$522$700$682$637$622$3,162
Total$6,897$10,132$12,378$12,566$11,446$8,997$62,415
Table 20 provides a summary of energy payments for by event and program during
NYISO demand response program events in July 2011. Table 21 shows the hourly detail of the energy payments by program and event.
Page 24
Table 20: Summary of Energy Payments for 2011 Events
Energy
Payment
SummaryZonesSCREDRPTotal
July 21, 2011G, H, I J, K$1,016,583$19,104$1,035,687
July 22, 2011A, B, C, E, F, G, H, I, J, K$2,706,837$62,415$2,769,252
Totals$3,723,420$81,519$3,804,939
Table 21: Hourly Detail of Energy Payments for 2011 Events
Energy
Payment
Summary Zones
HB 12HB 13HB 14
BPCGTotal
HB 15HB 16HB 17Payments to
SCRsPayments
July 21, 2011G, H, I J, K$46,218$66,670$55,102$59,390$64,171$744,136$1,035,687
July 22, 2011A, B, C, E, F, G, H, I, J, K$123,818$465,415$540,650$395,013$532,069$193,062$519,225$2,769,252
Totals$123,818$511,633$607,321$450,115$591,459$257,233$1,263,361$3,804,939
Combined Hourly Event Performance
SCR resources provided approximately 98% of the average hourly MWh reductions
(658.9 MW) during both demand response events in July 2011 (Tables 22 and 23). Response by EDRP resources improved on July 22 when additional zones were deployed. Table 24
summarized hourly event performance by event date.
Table 22: Hourly Event Performance Detail
NYISO Demand Response Event - July 21, 2011
Combined
Hourly
Performance
July 21, 2011 Zones
HB 12HB 13HB 14HB 15
Average
AverageEnrolledHourly
HB 16HB 17
HourlyMWPerformance
%
SCRG, H, I J, K601.1645.8664.6682.3700.7658.9731.190.1%
EDRPG, H, I J, K6.57.88.58.86.67.692.48.3%
Totals607.6653.6673.2691.1707.2666.5823.580.9%
Page 25
Table 23: Hourly Event Performance Detail
NYISO Demand Response Event - July 22, 2011
Hourly
Performance
July 22, 2011
HB 12HB 13
Zones
HB 14HB 15HB 16HB 17
Average
AverageEnrolledHourly
HourlyMWPerformance
%
SCRA, B, C, E, F, G, H, I, J, K367.31253.81377.01435.11473.91512.41396.41505.492.8%
EDRPA, B, C, E, F, G, H, I, J, K12.620.123.722.621.218.021.1191.911.0%
Totals379.81273.91400.71457.71495.11530.41417.41697.483.5%
Table 24: Combined Hourly Event Performance Detail
Average
Hourly
Performance Zones
HB 12HB 13HB 14HB 15
AverageEnrolledHourly
HB 16HB 17
HourlyMWPerformance
%
July 21, 2011G, H, I J, K607.6653.6673.2691.1707.2666.5823.580.9%
July 22, 2011A, B, C, E, F, G, H, I, J, K379.81273.91400.71457.71495.11530.41417.41697.483.5%
Table 25 shows the Summer 2011 peak hour performance by demand response program SCR and EDRP Resources. Performance is calculated according to the performance methods for each program. The peak hour occurred on July 22, 2011 in hour beginning 15.
Table 25: Peak Hour Response by Demand Response Program
Peak Hour
Performance
7/22/11 HB 15ZonesSCR (MW)EDRP (MW)Total
July 22, 2011A, B, C, E, F, G, H, I, J, K1435.122.61457.7
Day-Ahead Demand Response Program
The DADRP program provides demand resources with an opportunity to offer their load
curtailment capability into the Day-Ahead energy market as energy supply resources. Resources
submit offers by 5:00 a.m., specifying the hours and amount of load curtailment they are offering
for the next day, and the price at which they are willing to curtail. Prior to November 1, 2004,
the offer price had to be $50/MWh or higher. As of November 1, 2004, the offer floor price for
DADRP has been set at $75/MWh. Offers are structured like those of generation resources, so
DADRP program resources may specify minimum and maximum run times and effectively
Page 26
submit a block of hours on an all-or-nothing basis. This structure makes resources eligible for
Bid Production Cost Guarantee payments that make up for any difference between the market
price during that block of hours and their block offer price. Load scheduled in the DAM is
obligated to curtail the next day. Failure to curtail results in the imposition of a penalty equal to
the product of the MW curtailment shortfall and the greater of the corresponding Day-Ahead and
Real-Time market price.
During the analysis period of September 2010 through August 2011, only one resource
made offers for a period on a single day and the resource was scheduled for only two of the
hours it offered its reduction and for fewer than three MW in each of those two hours. Given the
minimal activity in DADRP during the analysis period, there is nothing on DADRP to report for
this period.
Update on 2011 Demand Response Initiatives
This section provides an update on the status of the following initiatives that the NYISO has been working on with its stakeholders to improve the administration of its demand response programs and to address regulatory directives to facilitate market participation:
• Order 745 Compliance Filing
• Market Rules for Aggregations of Small Demand Resources in the Ancillary Services
Markets
• Procedures for Direct Communication for DSASP
• Aggregations of Demand Side Resources in the Ancillary Services Markets and the
availability of Direct Communication
• Program Design for Demand Response Participation in the Real-Time Energy Market
• Continued Development of the Demand Response Information System (DRIS)
Order 745 Compliance Filing
On August 19, 2011, the NYISO submitted its compliance filing to meet the requirements
of Order 745, Demand Response Compensation in Organized Wholesale Energy Markets. Prior
to its filing, the NYISO presented the details of how it proposed to implement the requirements
in its presentation to a joint session of the Price-Responsive Load Working Group (PRLWG) and
Page 27
Market Issues Working Group (MIWG) on August 9, 2011 titled NYISO’s Compliance Filing to Order 745: Demand Response Compensation in Organized Wholesale Energy Markets9.
Market Rules for Aggregations of Small Demand Resources in the Ancillary Services Market
Because Direct Communication for DSASP is expected to streamline program
participation in DSASP and make it feasible for aggregations of small demand resources to
participate in the ancillary services market, the NYISO focused its efforts in 2011 on developing the technical specifications for direct communications for DSASP, with a commitment to
stakeholders to begin discussions about market rule changes for aggregations of small demand resources during the first quarter of 2012.
Technical Specifications and Procedures for Direct Communication for DSASP
The NYISO delivered its technical specification to stakeholders through a series of
presentations at stakeholder meetings in November and December: Price-Responsive Load
Working Group10 (11/28/11), the Market Issues Working Group (12/1/11), Business Issues
Committee (12/14/11), Operations Committee (12/15/11) and Computer Data Advisory
Subcommittee 12/8/11). On January 9, 2012, the presentation was made to the System
Operations Advisory Subcommittee. At each stakeholder presentation, stakeholders were
informed of the procedures for obtaining the technical specification requirements that were not
covered in the presentation because they had been identified as Critical Energy Infrastructure
Information.
Demand Response in the Real-Time Energy Market
The NYISO completed an architectural design specification at the conclusion of 2011 to
understand which applications may be impacted by the implementation of Demand Response in
9 Demand Response Compensation in Organized Wholesale Energy Markets
http://www.nyiso.com/public/webdocs/committees/bic_prlwg/meeting_materials/2011-08-
09/Compliance_Filing_on_Order_745.pdf
10 DSASP Direct Communications Technical Specification
http://www.nyiso.com/public/webdocs/committees/bic_prlwg/meeting_materials/2011-11-
28/DSASP_Stakeholder_Presentation.pdf
Page 28
the Real-Time Energy Market. As the market design and market rules are developed, the architectural design specification will be updated.
Continued Development of the Demand Response Information System (DRIS)
In the second half of 2011, the NYISO had two additional deployments to increase the
functionality of the Demand Response Information System. The deployments included the following functionality described under each deployment.
July 2011
• Minor improvements to existing functionality that was not market-facing. September 2011
• Implementation to support the tariff changes for the SCR baseline from APMD to
ACL:
o Changes to the data structure, import procedures and calculation of the Average
Coincident Load (ACL);
o Supporting functionality for Provisional ACL;
o Provisions to allow adjustments to metered load for demand reductions in a
Transmission Owner’s demand reduction program during hours that are part of the ACL calculation;
o Addition of an aggregation performance factor which permits over-performance
of one SCR in an SCR Aggregation to compensate for under-performance of
another SCR in the same SCR Aggregation in the same hour;
o Reporting of in-period verification data; and
o RIP deficiency calculations.
Demand Response Initiatives for 2012
This section provides an overview of the projects that the NYISO has planned for its demand response programs for 2012.
Page 29
Implementation of NYISO’s Order 745 Compliance Filing for a Monthly Net Benefits Test
The NYISO is anticipating an order on its Order 745 compliance filing and has identified
the changes to systems and procedures that will need to be made to comply with its filing. Once the NYISO receives its order, the NYISO will assess whether changes to the current
implementation plan are required.
Order 745 Compliance Filing on the Feasibility of a Dynamic Net Benefit Tests
As directed in Order 745, the NYISO will make a compliance filing in September 2012 to
report on the results of a study to determine the feasibility of integrating a dynamic version of the Net Benefits Test on a real-time basis.
Market Rules for Aggregations of Small Demand Resources in the Ancillary Services Market
With the completion of the technical specifications for Direct Communications for
DSASP, the NYISO has begun work on developing the proposed market rules and procedures
for integrating aggregations of small demand resources into its ancillary service markets through
the Demand Side Ancillary Services Program (DSASP). Presentations to stakeholders are
expected to begin in February and the NYISO anticipates filing proposed tariff changes in the
spring of 2012.
Demand Response in the Real-Time Energy Market
The NYISO will begin work with its stakeholders in mid-2012 to complete a market
design for demand response in the real-time energy market by the end of 2012.
Continued Development of the Demand Response Information System (DRIS)
The NYISO has one planned deployment in 2012 for DRIS to further improve the
administration of its demand response programs. The planned deployment for June 2012 will
integrate demand response event creation with communication services from a third-party
provider to improve event notification. This deployment will be used by NYISO Operators to
Page 30
deploy demand response resources and provide a way for market participants to respond with an estimate of their anticipated capability directly into DRIS. A second deployment for late 2012 may be added to address any market rule or procedural changes.
Page 31
NYISO 2011 Annual Report on Demand Response Programs
Program Descriptions
The New York Independent System Operator, Inc. (“NYISO”) offers two demand
response programs that support reliability: the Emergency Demand Response Program1
(“EDRP”) and the Installed Capacity-Special Case Resource Program (“ICAP/SCR”). In
addition, demand response resources may participate in the NYISO’s energy market through the Day-Ahead Demand Response Program (“DADRP”), or the Ancillary Services market through the Demand-Side Ancillary Services Program (“DSASP”).
EDRP provides demand resources with the opportunity to earn the greater of $500/MWh or the prevailing locational-based marginal price (“LBMP”) for energy consumption curtailments provided when the NYISO calls on the resource. There are no consequences for enrolled EDRP resources that fail to curtail. Resources participate in EDRP through Curtailment Service
Providers (“CSPs”), which serve as the interface between the NYISO and resources.
The ICAP/SCR program allows demand resources that meet certification requirements to
offer Unforced Capacity (“UCAP’) to Load Serving Entities (“LSEs”). Special Case Resources
can participate in the Installed Capacity (“ICAP”) Market just like any other ICAP Resource;
however, Special Case Resources participate through Responsible Interface Parties, which serve
as the interface between the NYISO and resources. Resources are obligated to curtail when
called upon to do so with two or more hours notice, provided the NYISO notify the Responsible
Interface Party a day ahead of the possibility of such a call. In addition, ICAP/SCR resources are
subject to testing each Capability Period to verify that they can fulfill their curtailment
requirement. Failure to curtail could result in penalties administered under the ICAP program.
Curtailments are called by the NYISO when reserve shortages are anticipated. Resources may
register for either EDRP or ICAP/SCR but not both. Special Case Resources are eligible for an
energy payment during an event, using the same performance calculation as EDRP resources.
The Targeted Demand Response Program (“TDRP”), introduced in July 2007, is a
NYISO reliability program that deploys existing EDRP and SCR resources on a voluntary basis,
1 Terms in upper case not defined herein have the meaning ascribed to them in the NYISO’s Market Administration and Control Area Services Tariff.
Page 1
at the request of a Transmission Owner, in targeted subzones to solve local reliability problems. The TDRP program is currently available in Zone J, New York City.
The DADRP program provides demand resources with an opportunity to offer their load
curtailment capability into the Day-Ahead Market (“DAM”) as an energy resource. Resources
submit offers by 5:00 a.m. specifying the hours and amount of load curtailment they are offering
for the next day, and the price at which they are willing to curtail. Prior to November 1, 2004,
the minimum offer price was $50/MWh. The offer floor price currently is $75/MWh. Offers are
structured like those of generation resources: DADRP program resources may specify minimum
and maximum run times and the hours that they are available. They are eligible for Bid
Production Cost guarantee payments to make up for any difference between the market price received and their block offer price across the day. Load scheduled in the DAM is obligated to curtail the next day. Failure to curtail results in the imposition of a penalty for each such hour equal to the product of the MW curtailment shortfall and the greater of the corresponding DAM or Real-Time Market price of energy.
The DSASP program, introduced in June 2008, provides demand resources that meet
telemetry and other qualification requirements an opportunity to offer their load curtailment
capability into the DAM and/or Real-Time Market to provide Operating Reserves and
Regulation Service. DSASP resources must qualify to provide Operating Reserves or Regulation
Service through standard resource testing requirements. Offers are submitted through the same
process as generation resources. Resources submit offers by 5:00 a.m. specifying the ancillary
service they are offering (Spinning or Non-Synchronous Reserves, and/or Regulation, if
qualified) along with the hours and amount of load curtailment for the next day, and the price at
which they are willing to curtail. Real-time offers may be made up to 75 minutes before the hour
of the offer. Although DSASP resources are not scheduled for energy in the DAM, they are
required to submit energy offers, which are used in the co-optimization algorithm for dispatching
operating reserve resources. Similar to the DADRP, the energy offer floor price is currently
$75/MWh. DSASP resources are not paid for energy. They are eligible for a Day-Ahead
Margin Assurance Payment to make up for any balancing difference between their Day-Ahead
Reserve or Regulation schedule and Real-Time dispatch, subject to their performance for the
scheduled service. Performance indices are calculated on an interval basis for both Reserves and
Regulation. Payment is adjusted by the performance index for the service provided.
Page 2
Summary of Significant Findings
Emergency Demand Response Program / ICAP Special Case Resources
As of July 31, 20112, a total of 35 CSPs and Responsible Interface Parties have resources
enrolled in the NYISO’s EDRP and/or ICAP/SCR programs3. This level of participation
represents a reduction of two load serving entities, eleven aggregators, four transmission owners, and five resources representing themselves (referred to herein as a “direct resource”) since 2010 figures. Participating CSPs and RIPs include:
•4 Transmission Owners
•3 Load Serving Entities not affiliated with a Transmission Owner (“Competitive LSE”)
•20 aggregators that are not Load Serving Entities or Transmission Owners
•7 EDRP or ICAP/SCR direct resources
Resource representatives that are not Transmission Owners or affiliates thereof, including
Load Serving Entities not affiliated with Transmission Owners and aggregators, currently
sponsor 59.5% of the total EDRP and ICAP/SCR enrolled MW, down from the 75.4% enrolled
in 2010. In 2011, one non-Transmission Owner had resources enrolled in the EDRP program; all
other EDRP resources were enrolled through Transmission Owners. Direct resources represent
7.7% of the enrolled MW in the ICAP/SCR program or 6.9% of the combined reliability program MW.
EDRP and ICAP/SCR had a total of 5,807 end-use locations enrolled capable of providing a total of 2,173.2 MW of demand response capability, a 13% decrease over the 2010 MW
2 For several years, August 31 has been the date customarily used for reporting NYISO’s demand
response program participation statistics. In 2011, the NYISO made a change from reporting demand response enrollment as of August 31 each year to July 31 of each year to better align with several other reporting requirements for reliability and planning. Reporting as of July 31 also provides transparency with other reporting requirements for demand response. The NYISO evaluated the difference in
enrollment between July and August and found it to be nominal (2% - 3%).
3 The report on reliability programs is based on a snapshot of the programs as of July 31, 2011.
Page 3
enrollment level. The demand response resources in NYISO reliability programs represent 6.4%
of the 2011 Summer Capability Period peak demand of 33,866 MW, a nominal reduction from
2010. There were 417 end-use locations in EDRP (200 EDRP plus 217 Unsold SCRs) and 5,390
end-use locations in ICAP/SCR. ICAP/SCR represents 93% of the total resources enrolled in the
NYISO’s reliability programs and 91% of the reliability programs’ total enrolled MW. The
2011 SCR enrollments increased 32% while the enrolled MWs off load reduction decreased
13% over 2010. The Targeted Demand Response Program, which deploys EDRP and
ICAP/SCR resources in subzones of Zone J (New York City) for local reliability, included 56%
of total NYCA EDRP end-use locations and encompassed 34% of total NYCA EDRP MW. The
TDRP also included 46% of total NYCA ICAP/SCR end-use locations, representing 23% of the
total NYCA enrolled ICAP/SCR MW, an increase of 2% and a decrease of 1%, respectively.
Since participation in EDRP and ICAP/SCR became mutually exclusive, EDRP end-use
locations and MW have continued to decrease while ICAP/SCR end-use locations and MW have
increased, as expected, given the monthly reservation payment associated with the ICAP/SCR
program. Aggregations by Responsible Interface Parties now account for 97.2% of ICAP/SCR
resources and 65% of enrolled MW in the program, a decrease from 2010 in enrolled MW of
almost 3.6%.
There were two deployments of the ICAP/SCR and EDRP programs during July 2011. The NYISO deployments of the ICAP/SCR and EDRP programs occurred from 1:00 p.m. to 6:00 p.m. (HB 13 through HB 17) for zones G through K on July 21, 2011, from 12:00 p.m. to 6:00 p.m. (HB 12 through HB 17) on July 22, 2011 in zone J, and from 1:00 p.m. to 6:00 p.m. (HB 13 through HB 17) in zones A, B, C, E, F, G, H, I, and K on July 22, 2011. Details on the 2011
demand response events is provided in the section titled “2011 Event Performance for
Emergency Demand Response Program and ICAP Special Case Resources.”
Day-Ahead Demand Response Program
During the analysis period of September 2010 through August 2011, only one resource
made offers for a period on a single day and the resource was scheduled for only two of the
hours it offered its reduction and for fewer than three MW in each of those two hours. Given the
minimal activity in DADRP during the analysis period, there is nothing material to report for this
period.
Page 4
Participation in Reliability-Supporting Demand Response Programs
Aggregation of ICAP/SCR Resources
Enrollments for ICAP/SCR resources are tracked by both (a) end-use location and (b) Program
ID. Program IDs, used to identify demand resources4 in NYISO’s systems, may represent
individually enrolled end-use locations or aggregations of end-use locations enrolled as a single
resource. Table 1 indicates that there are a total of 99 aggregations represented by Responsible
Interface Parties, collectively containing a total of 5,315 end-use locations with 1,697.7 MW of
the total 1,976.2 MW of enrolled ICAP/SCR. Seventy-five (75) individually enrolled resources
account for 278.5 MW.
Table 1: Detail of 2011 ICAP/SCR Program Participation Level by Resource Type
Resource Type
Individual Resources
Aggregated Resources
Total
ICAP^ICAP Unsold
# Program# End-useSold# Program# End-useEnrolled
IDsLocationsMWIDsLocationsMW
7575278.5131343.6
9953151697.7192044.9
17453901976.23221748.6
MW represent the ICAP equivalent MW sold in the ICAP market in July 2011.
^ Nine individual resources, with a total ICAP equivalent of 30 MW have been omitted
from enrollment and event performance reporting until data submission issues are
resolved.
The right-hand section of Table 1 provides information for ICAP/SCR resources that did
not sell MW in the July 2011 capacity market auctions. In cases where an ICAP/SCR resource
offers load reduction in a NYISO auction and it is not sold, or when the resource’s derated MW
value is zero, that resource is automatically included in the EDRP program at its enrolled MW
value until the next auction or until the resource confirms a bilateral transaction with an LSE.
The EDRP program totals reported include the offered, but unsold MW of enrolled ICAP/SCR
resources.
4 A resource is defined as a single end-use location enrolled in a program individually or an aggregation of end-use locations enrolled as a unit; resources are identified by a Program ID.
Page 5
EDRP and ICAP/SCR Program Enrollment
At the end of July 2011, the NYISO’s reliability programs had a total of 5,807 end-use locations enrolled, providing a total of 2,172.9 MW of demand response capability, a 13%
reduction over the 2010 MW enrollment level. There were 417 end-use locations in EDRP (200 EDRP resources + 217 ICAP/SCR Unsold resources) and 5,390 end-use locations in ICAP/SCR. ICAP/SCR represents 93% of the total reliability program resources and 91% of the total
reliability program MW, a decrease of 13% in the ICAP/SCR program.
Table 2: 2011 Program Enrollment Summary by Curtailment Service Provider Type
EDRP (1)ICAP Unsold (2)
##
ICAP (3)^DADRP (4)
##
CSP
Type #
20
0
7
4
4
35
Agent Type# CSP End-use
Locations
Aggregator1*
End-Use Customer00
Direct Customer00
LSE00
Transmission Owner3*
Total4200
EnrolledEnrolled
# RIPEnd-use
MWMW
Locations
0.381444.7
0.0000.0
0.01*40.8
0.02693.0
147.81*0.1
148.11221748.6
ICAP
# RIPEnd-use# DRPEnd-useMW
MW
LocationsLocations
2045351010.21*9.0
000.0000.0
739152.1000.0
3707274.92*15.0
4109538.91*13.0
3453901976.24437.0
*
Number of end-use locations by category is fewer than 5 and has been masked for this public version of the table. The unredacted values are presented in the confidential appendix submitted as Attachment 1.
Note 1: The sum of EDRP and SCR Unsold Enrolled MW = Total EDRP.
Note 2: Resources in the ICAP/SCR program with Unsold capacity are considered EDRP resources in the month(s) that capacity is
unsold. MW represent Enrolled MW in the ICAP program, but not sold.
Note 3: MW represent the ICAP equivalent MW sold in the ICAP market in July 2011.
Note 4: Total NYISO enrollment is not necessarily the sum of all programs due to the rules that state that end-use locations are
allowed to participate in a reliability program (EDRP or ICAP) and economic (DADRP or DSASP).
^ Nine individual resources, with a total ICAP equivalent of 30 MW have been omitted from enrollment and event performance
reporting until data submission issues are resolved.
Table 2 shows the total number of CSPs enrolled for 2011 in the first column and the
number of CSPs, by type, with the number of end-use locations and enrolled MW for each of the program categories. This table provides the enrollment detail by program and CSP type.
Enrollments in EDRP in 2011 were predominantly through Transmission Owners.
ICAP/SCR enrollments by aggregators provide 84.1% of participating end-use locations and
51.1% of the enrolled MW.
Table 3 shows program enrollment detail by Load Zone. Although statistics on resource class are not collected, resources in Zones A through E are typically industrial and retail
resources, while those in Zones J and K include commercial office, retail, and multi-family
residential resources.
Page 6
Table 3: 2011 Program Enrollment by Zone
EDRP (1)
Enrolled
ICAP Offered/Unsold (2)
Enrolled
ICAP (3)^
ICAP
DADRP (4)
Zone
A
B
C
D
E
F
G
H
I
J
K
Total
#
13
*
27
8
26
10
13
*
13
86
0
200
MW
10.5
1.0
15.1
3.7
25.1
5.3
17.1
1.8
3.7
64.8
0.0
148.1
#
MW
1642.3
90.1
*0.0
*0.1
91.0
50.2
*0.2
00.0
*0.2
1482.7
221.9
21748.6
#
MW
522347.8
264120.5
366136.9
23457.6
16845.6
213137.7
16767.1
2610.1
14936.9
2496464.1
996152.0
53901976.2
#MW
00.0
00.0
00.0
00.0
00.0
*28.0
*9.0
00.0
00.0
00.0
00.0
437.0
*
Note 1:
Note 2:
Note 3:
Note 4:
^
Number of end-use locations by category is fewer than 5 and has been masked for this public version of the table. The unredacted values are presented in the confidential appendix submitted as Attachment 1.
The sum of EDRP and SCR Unsold Enrolled MW = Total EDRP.
Resources in the ICAP/SCR program with Unsold capacity are considered EDRP resources in the month(s) that capacity is unsold. MW represent Enrolled MW in the ICAP program, but not sold.
MW represent the ICAP equivalent MW sold in the ICAP market in July 2011.
Total NYISO enrollment is not necessarily the sum of all programs due to the rules that state that end-use locations are allowed to participate in a reliability program (EDRP or ICAP) and economic (DADRP or DSASP). Nine individual resources, with a total ICAP equivalent of 30 MW have been omitted from enrollment and event performance reporting until data submission issues are resolved.
Targeted Demand Response Program Enrollment
Load Zone J currently is the only Load Zone with resources assigned to the Targeted
Demand Response Program. This Zone has been divided into subzones designated by
Consolidated Edison Company of New York, Inc. (“Con Edison”) Resources enrolled in EDRP and ICAP/SCR are assigned to one of the various subzones based on their location. Unassigned resources remain in the general Zone J category (J9: Shared Subzone). The sub-load pockets correspond to the following Con Edison network area substation groupings:
• J1: Sherman Creek/Parkchester/E
179th
• J2: Astoria West/Queensbridge
• J3: Vernon/Greenwood • J4: Staten Island
• J5: Astoria East/Corona/Jamaica
Page 7
• J6: W 49th• J8: Farragut/Rainey
• J7: E13th/East River• J9: Shared Subzone
Table 4: EDRP End-use Locations enrolled in the Targeted Demand Response Program -
Zone J
J1J2J3J4J5J6J7J8J9Total
MW0.41.06.90.87.32.22.21.043.064.8
End-use Locations5619*217914*86
Number of end-use locations by category is fewer than 5 and has been masked for this public
* version of the table. The unredacted values are presented in the confidential appendix submitted as
Attachment 1.
Table 5: ICAP/SCR End-use Locations enrolled in the Targeted Demand Response Program - Zone J
J1J2J3J4J5J6J7J8J9Total
MW50.225.052.627.828.260.972.089.70.0406.6
End-use Locations1531845079827024035655502363
Historical Enrollment in Reliability Programs
Figure 1 plots the growth in the NYISO’s reliability-based programs from inception
through July 2011. The stacked area plots enrolled MW by program and year. The lines plot the
number of end-use locations by program and year. From May 2001 through July 2011,
combined enrollment in EDRP and ICAP/SCR has grown from approximately 200 MW to
2,172.9 MW; and the total number of end-use locations has increased from approximately 200 in
March 2002 to 5,816. Since participation in EDRP and ICAP/SCR became mutually exclusive,
EDRP resources and MW have continued to decrease while ICAP/SCR resources and MW have
increased.
Page 8
Figure 1: Historical Growth in Resources and MW in NYISO Reliability Programs
3000
2500
2000
1500
1000
500
0
Total Reliability MW: 2173
Total Reliability End-use Locations: 5807
EDRP MW
ICAP/SCR MW
200120022003200420052006
EDRP End-use Locations: 200 +
Unsold SCR End-Use Locations:
217
SCR End-Use Locations 5390
20072008200920102011
6000
5000
4000
3000
2000
1000
0
ICAP/SCR MWUnsold SCREDRP MWICAP/SCR End-use LocationsEDRP End-use Locations
Changes in Program Enrollment
Table 6 shows the program enrollment changes by number of program IDs enrolled.
Program IDs, which are used to represent a resource in NYISO’s market systems, may represent individual end-use locations or aggregations of end-use locations. Table 7 shows the program enrollment changes by number of end-use locations.
Page 9
Table 6: Program Enrollment by Program ID - Changes 2010 to 2011
2010
CountMW
EDRP207257.3
ICAP/SCR
Unsold82.0
ICAP/SCR2052238.5
DADRP22331.4
2011
MW
Change
CountMW
200148.1-109.2
21748.646.6
1741976.2-262.3
4 37.0 -294.4
Percent Change FromSubscribed MW per
2010 to 2011Program ID
ProgramSubscribedPercent
ID CountMW20102011Change
-3%-42%1.240.74-40%
2613%2349%0.250.22-10%
-15%-12%10.9211.364%
-82%-89%15.069.25-39%
Table 7: Program Enrollments by End-use Location - Changes 2010 to 2011
2010
CountMW
EDRP207257.3
ICAP/SCR
Unsold82.0
ICAP/SCR41712238.5
DADRP50331.4
2011
MW
CountMWChange
200148.1-109.2
21748.646.6
53901976.2-262.3
4 37.0 -294.4
Percent Change FromSubscribed MW per
2010 to 2011End-use location
End-use
LocationSubscribedPercent
CountMW20102011Change
-3%-42%1.240.74-40%
2613%2349%0.250.22-10%
29%-12%0.540.37-32%
-92%-89%6.639.2540%
Table 7, which shows changes in enrollment by end-use location, depicts significant
changes in all programs since the year-end report for Summer 2010. Changes in the number of enrolled resources in the ICAP/SCR Unsold category for July 2011 can be attributed to one or more of the following: the change in baseline methodology which could result in a baseline that was higher than in previous years; poor performance factors which would leave some resources with little or no capacity to sell; or offered capacity that did not sell in an ICAP auction. As
reported in the June 2011 report, enrollment in ICAP/SCR was expected to decrease due to the change to the baseline methodology that went into effect for the Summer 2011 Capability Period. The impacts of the rule change are discussed in detail below in the section titled “Impact of 2011 Market Rule Changes to ICAP/SCR Enrollment for Summer 2011.”
Enrollment in DADRP has been static for several years and many of the enrolled
resources have shown no bidding activity in the market in at least the last two years. The changes
in enrollment in DADRP are of two types: resources that formally withdrew from the DADRP
program in 2011 (7 resources, 26.4 MW) or resources that have been removed from reporting
due to inactivity since 2008 to provide a more accurate representation of the enrolled MW in the
Page 10
DADRP (20 resources, 268 MW). The DADRP resources that have been removed from
reporting are still eligible to make offers in the day-ahead energy market and will be counted in future enrollment reports if their bidding activity changes.
Figures 2 through 4 track enrollment and MW in EDRP, ICAP/SCR and DADRP,
respectively, over the period 2001 through 2011. The primary difference between Figures 2 and
3 is the representation of ICAP resources: Figure 2 shows percent change and average
subscribed MW by Program ID, while Figure 3 shows percent change and average subscribed
MW by end-use location. Figure 2 shows the number of Program IDs, including individually
enrolled resources and aggregated resources. Figure 3 provides information on the total number
of end-use locations. Seventy-five (75) individually enrolled resources account for 278.5 MW.
ICAP/SCR enrollment of end-use locations was initiated in 2004; prior to that period, the
enrolled resources shown in Figures 2 and 3 for ICAP/SCR were based on program IDs, also
referred to as Aggregation IDs. In addition, during 2001 and 2002, program enrollment was non-
exclusive, i.e., an end-use location could register for both EDRP and ICAP/SCR. Beginning in
2003, participation in the EDRP and ICAP/SCR programs became mutually exclusive.5
Figure 4 shows that since making EDRP and ICAP/SCR mutually exclusive, the general
trend has been for EDRP enrollment and MW to decrease and ICAP/SCR enrollment and MW to
increase, as expected, given the monthly reservation payment associated with the ICAP/SCR
program.
5 Pursuant to the tariff, SCRs may participate in both the EDRP and the ICAP/SCR programs
concurrently if the resource has metering to distinguish the MWs of Demand Reduction in the Special
Case Resource from the MWs in the Emergency Demand Response Program. The metering requirement supports the program rule that MW cannot be committed both as Unforced Capacity and to the
Emergency Demand Response Program.
Page 11
Figure 2: Demand Response Program Enrollment History by Program ID, 2001 - 2011
1600
1400
1200
1000
800
600
400
200
0
20012002200320042005200620072008200920102011
EDRPICAP/SCRDADRP
Figure 3: Demand Response Program Enrollment History by Number of End-use locations,
2001 - 2011
6000
5000
4000
3000
2000
1000
0
20012002200320042005200620072008200920102011
EDRPICAP/SCRDADRP
Page 12
Figure 4: Demand Response Program MW Enrollment History, 2001 - 2011
2500
2000
1500
1000
500
0
20012002200320042005200620072008200920102011
EDRP MWICAP/SCR MWDADRP MW
Impact of 2011 Market Rule Changes to ICAP/SCR Enrollment for Summer 2011
In the mid-year compliance filing on demand response, the NYISO reported on the
impact of the 2011 Market Rule Change from APMD to ACL baseline methodology and believes that this change also contributed to the reduction in MW enrolled for July 2011.
To evaluate the impact of the 2011 Market Rule Change from the APMD to the ACL baseline methodology on the amount of enrolled MW the NYISO compared enrollment
characteristics of resources that were enrolled in both July 2010 and July 2011. The 3,308
resources analyzed represent 79% of the number of resources enrolled in July 2010 and 61% of the number of resources enrolled in July 2011.The NYISO analyzed two aspects of the data that may have contributed to the reduction:
• Comparison of APMD and ACL to determine impact of change to gross
resource capacity; and
• Comparison of Committed Maximum Demand (CMD) for July of each year
to determine whether resources adjusted the amount of capacity (the Declared
Value) they could make available.
Page 13
o Declared Value is calculated by subtracting the CMD from the resource’s
baseline (APMD or ACL) and is the basis for the enrolled capacity of the
resource.
Table 8 below illustrates how a change to the 2011 CMD affects the Declared Value of a
resource, depending on whether the 2011 ACL is greater or less than the 2010 APMD. The table
includes the end-use location count and MW change for each of the possible combinations in
enrollment for July 2011. To illustrate the impact of enrollment changes, Figure 5 provides an
example of the combination shown in the first two cells of the first shaded row in Table 8: when
the 2011 ACL of a re-enrolled resource is less than the 2010 APMD and the resource raises its
CMD, the result is a lower Declared Value for July 2011. The 100 kW reduction from the 2010
APMD to the 2011 ACL plus the 100 kW increase in the 2011 CMD resulted in a 200 kW
reduction to the 2011 Declared Value. Keeping the same CMD value for 2011 would result in a 100 kW reduction from the 2010 Declared Value.
Figure 5. Example of Impact from Enrollment Changes
1800
1600
2010 APMD
1400
1200
1000
800
600
400
200
0
100 KW change
2010 Declared2011 Declared
ValueValue
100 KW change
2010 APMD - 2010 CMD = 2010 Declared Value
1550 KW - 550 KW = 1000 KW
2011 ACL - 2011 CMD = 2011 Declared Value
1450 KW - 650 KW = 800 KW
2011 ACL
2011 CMD
2010 CMD
Page 14
Table 8. July 2011 Enrollment Changes for Re-enrolled Resources
Enrollment
Change
2011 ACL ≤
2010 APMD
Higher CMD
Lower Declared
Value than 2010
Same CMD as
2010
Lower Declared
Value than
2010
Lower CMD
Same Declared Value
as 2010 or Increase
over 2010 Declared
Value
Net Impact from
Lower CMDRe-enrolled
Resources
Lower Declared
Value than 2010
End-use
Locations
591
66454
9532064
MW(133)
Same Declared
2011 ACL >Value as 2010 or
2010 APMDLower Declared
Value than 2010
(13)
Increase over
2010 Declared
Value
32
Increase over 2010
Declared Value
(255)(369)
End-use
Locations
937
33274
1,244
End-use
Locations
1,528
99728
9533,308
Totals (MW)(173)(11)68(255)(370)
There was a 262 MW reduction in ICAP/SCR enrollment from 2010. The net impact of
the ACL baseline methodology change for re-enrolled resources was a reduction in Declared
Value of 370 MW, which exceeds the net reduction in enrolled MW for July as shown in Table 7 above. The 29% increase in enrolled end-use locations (e.g., new resources) mitigated the
reduction from 2010.
The first column of Table 8 shows that, for the 2,064 resources where the ACL method
resulted in a baseline that was less than or equal to the APMD method, the change to Declared
Value MW was a reduction of 369 MW. The net reduction in Declared Value MW from the
1,244 resources that realized an ACL greater than their July 2010 APMD, was 1 MW.
The second through fifth columns of Table 8 provide detail on the effect of the change to
the Committed Maximum Demand on the quantity of enrolled MW, and the number of resources
that made the change. Resources that maintained the same Committed Maximum Demand as
last year show a net reduction of 11 MW (column 3, last row). Resources that lowered their
Page 15
Committed Maximum Demand6 show a net reduction of 187 MW enrolled (columns 4 + 5, last
row).
Analysis of ICAP/SCR Strike Prices
Beginning in 2003, resources in the ICAP/SCR program were required to indicate, at the time of enrollment, a curtailment strike price, between $0-$500/MWh, which would be used by the NYISO to determine which resources to call for curtailments when all resources in a given Zone or Zones are not needed to restore system security to its equilibrium state.
To characterize how resources responded to this requirement, strike price curves were
developed for all resources for 2011. The curves map out the percentage of enrolled MW at a
given strike price. Figure 5 illustrates the strike price curves for 2003 to 2011, covering the
period of time that the program provision has been in place. The steeper slope for the strike
price curve overall indicates that strike prices are clustered close to the offer ceiling of
$500/MWh. It is evident that resources, over time, have increased the number of higher strike prices. Figure 6 is a detailed view of the strike price curves for the past four years, 2007 through 2011, and displays a limited range where the price curve levels off to the offer ceiling. The strike price curves for 2010 and 2011 have the same shape.
6 One reason a resource may have lowered its Contract Minimum Demand is in recognition of a change to its SCR baseline that resulted from the 2011 Market Rule Changes.
Page 16
Figure 6: 2003 - 2011 ICAP/SCR Curtailment Bid Curves
500
450
400
350
300
250
200
150
100
50
0
0%
500
450
400
350
300
250
200
150
100
50
0
2003 (758 MW)
2004 (980.8 MW)
2005 (1083.8 MW)
2006 (1216.2 MW)
2007 (1338.5 MW)
2008 (1743.8 MW)
2009 (2060.6 MW)
2010 (2238.5 MW)
2011 (1976.2 MW)
25%50%75%100%
% of Total MW
Figure 7: 2007 - 2011 ICAP/SCR Curtailment Bid Curve Detail
2.41%
2.29%
1.20%
2007 (1338.5 MW)
2008 (1743.8 MW)
2009 (2060.6 MW)
2010 (2238.5 MW)
2011 (1976.2 MW)
0.54%
0.52%
0%1%2%3%4%5%6%
% of Total MW
Page 17
2011 Event Performance for Emergency Demand Response Program and ICAP/Special Case Resources
In 2011, the NYISO deployed EDRP and SCR resources on two occasions. There were two deployments of the ICAP/SCR and EDRP programs during July 2011. The NYISO
deployments of the ICAP/SCR and EDRP programs occurred on July 21, 2011 and July 22, 2011. The 2011 deployments were as follows:
July 21:
SCR and EDRP resources were deployed in Zones G, H, I, J, and K from 1 p.m. to 6 p.m. (HB 13 through HB 17) for transmission security operations, the requirement to restore system power flows to within normal operating limits. Scarcity pricing was not applied because a
reserve shortage was not identified.7
July 22:
SCR and EDRP resources were deployed in Zone J from 12 p.m. to 6 p.m. (HB 12
through HB 17) and in zones A, B, C, E, F, G, H, I, and K from 1 p.m. to 6 p.m. (HB 13 through HB 17) SCR and EDRP resources in Zones G through K were deployed for transmission security operations. SCR and EDRP resources in Zones A, B, C, E, and F were deployed to meet
statewide capacity requirements in response to import transaction curtailments and nearly 1600 MW of load forecast error; about 90% of the load forecast error was due to weather forecast
error. Scarcity pricing was applied for certain intervals.
The following intervals, based on end timestamps, were subject to EDRP/SCR Scarcity Pricing Rule A (impacting NYCA): 13:05 - 13:10, 13:17 - 15:00, and 16:05 - 17:05.
The following intervals, based on end timestamps, were subject to EDRP/SCR Scarcity Pricing Rule B (impacting the East): 13:15, 15:05 - 16:00, and 17:25.
7 2011 demand response event information presented by Emilie Nelson to Market Issues Working Group, August
29, 2011: http://www.nyiso.com/public/webdocs/committees/bic_miwg/meeting_materials/2011-08-
29/MIWG_ScarcityPricing_July2011_Overview_Final.pdf
Page 18
NYISO Demand Response Program Events
Table 9 provides a summary of average hourly response by SCR and EDRP resources during the two demand response events on July 21, 2011 and July 22, 2011. Detailed hourly event performance by program is provided in the sections below.
Table 9. Summary of July 2011 Demand Response Event Performance
Average
Average
Hourly
PerformanceZones
Enrolled MW
SCR (MW) EDRP (MW) Total
Hourly
Performance
%
July 21, 2011G, H, I J, K658.97.6666.5823.580.9%
July 22, 2011A, B, C, E, F, G, H, I, J, K1396.421.11417.51697.483.5%
ICAP/SCR Capacity Performance
Tables 10 and 11 contain performance figures based on the ICAP/SCR reporting rules
contained in the NYISO’s Installed Capacity Manual. ICAP/SCR performance is determined by comparing the actual hourly interval metered energy with the Average Coincident Load (ACL):
RED_MWgn = ACLgm - METER_MWgn
where:
• RED_MWgn is the Installed Capacity Equivalent performance that Resource g supplies
during hour n of an SCR event;
• ACLgm is the Average Coincident Load for Resource g applicable to month m, using data
submitted in its Special Case Resource Certification; and
• METER_MWgn is the metered hourly-integrated energy for Resource g in hour n of an SCR
event.
Performance using this measure compares actual reduction with the Installed Capacity Equivalent (ICAP) of the resource’s reduction capability sold. Individual resource performance factors used to determine the kW that can be sold in the next like Capability Period (i.e., Summer or Winter) are based on the four highest contiguous hours of reduction during each event as well as performance during mandatory tests.
Page 19
Table 10: SCR MW Performance Based on ICAP Measures - July 21, 2011
21‐JulMWh
ZoneHB 13 HB 14
HB 15HB 16 HB 17
Average
Hourly MW
% Performance
ICAP MWof ICAP
All Event Hours
G58.263.165.866.464.363.669.691.3%
H9.810.010.210.310.410.110.1100.5%
I20.726.127.829.130.226.835.376.0%
J402.6429.0438.9449.1465.7437.1464.194.2%
K109.7117.5121.9127.5130.2121.3152.079.8%
Total601.1645.8664.6682.3700.7658.9731.190.1%
Table 11: SCR MW Performance Based on ICAP Measures - July 22, 2011
ZoneHB 12 HB 13
HB 14HB 15 HB 16
HB 17
Average
Hourly MW
% Performance
ICAP MWof ICAP
All Event Hours
A305.1326.6341.1343.6347.5332.8334.499.5%
B96.5102.4105.4107.5109.7104.3120.586.5%
C110.9128.8135.6140.1140.5131.2136.995.8%
E39.149.652.754.555.350.245.6110.2%
F116.2127.0130.5135.4133.2128.4137.793.3%
G61.366.169.070.069.867.367.2100.1%
H8.78.88.88.99.08.810.187.7%
I26.327.128.028.932.028.536.977.2%
J367.3393.8437.9456.2472.0499.2437.7464.394.3%
K96.0102.8107.9113.1116.1107.2152.070.5%
Total367.31253.81377.01435.11473.91512.41396.41505.492.8%
NYISO Event Energy Performance and Payments
In addition to compensation for committing to reduce Capacity, resources in ICAP/SCR
are also paid for their actual energy reduction during a called event. To compute energy
payments, performance is determined using a Customer Baseline Load (CBL) computed using
recent historical data to determine what the resource’s energy consumption would have been if
the Special Case Resource had not reduced its load. This computation method is the same
Page 20
method used in the EDRP program to measure load reduction eligible for energy payment.8 For settlement of the energy payment, the amount of load reduction is equal to the difference
between the hourly CBL and hourly interval meter readings..
Tables 12 and 13 present a energy reduction data for ICAP/SCR resources that performed
in the NYISO’s ICAP/SCR events. Since the ICAP/SCR ACL values are determined for the
prior like Capability Period and the CBL is determined from load data that ranges from two
weeks to 30 days prior to the event, differences in performance can be expected. Contributing
to the difference between the capacity performance reported above and the energy performance
reported (in Tables 12 and 13) is the fact that not all Responsible Interface Parties submitted
CBL energy performance data. The NYISO has observed that some RIPs only submit CBL data
for larger resources, particularly in Zone J where energy prices are typically higher than the rest
of the NYCA. Tables 14 and 15 provide details on the energy payments made to SCRs for the
July 21 and July 22 events, respectively.
Table 12: SCR Energy Performance based on CBL - July 21, 2011
Hourly CBL Performance for SCRs Reporting Energy Performance
21‐JulMWh
ZoneHB 13 HB 14
HB 15HB 16 HB 17
Average
Hourly MW
CBL
ICAP MW Performance as
% of ICAP
G42.146.045.242.137.042.543.996.9%
H9.09.29.29.18.69.08.8102.2%
I25.731.533.834.530.731.225.5122.4%
J230.6251.8251.5243.0217.7238.9263.690.6%
K82.289.689.286.077.985.0115.573.6%
Table 13: SCR Energy Performance based on CBL - July 22, 2011
Hourly CBL Performance for SCRs Reporting Energy Performance
22‐JulMWhMWh
ZoneHB 12HB 13
HB 14HB 15HB 16HB 17
Average
Hourly MW
CBL
ICAP MW Performance as
% of ICAP
A293.8309.7314.9307.1300.6305.2305.3100.0%
B65.470.368.161.754.764.087.073.6%
C91.3100.295.590.477.691.0109.283.3%
E28.737.135.733.529.732.938.186.5%
F114.9127.5125.6125.5116.7122.0121.5100.5%
G47.252.149.850.956.551.350.5101.7%
H8.08.08.18.07.57.97.9100.0%
I31.733.334.635.634.233.924.7136.9%
J212.8240.6273.6282.8279.6257.6257.8278.592.6%
K76.080.981.178.573.077.9106.673.1%
Total212.8997.81092.61096.21070.81008.01044.11129.392.5%
Table 14: SCR Energy Payments - July 21, 2011
21‐Jul
ZoneHB 13 HB 14
HB 15HB 16 HB 17
Sum of LBMP Sum of BPCG
Payments Payments
Total Payments
J$ 4,513$ 5,491$ 0,151$ 2,411$ 6,057$$ 38,603$ 97,225
K$ 0,191$ 4,733$ 0,816$ 1,839$ 2,855$ 0,434$ 52,009$ 12,443
Total$ 2,951$ 2,749$ 0,840$ 5,015$ 0,893$$ 44,136$ ,016,583
Table 15: SCR Energy Payments - July 22, 2011
22‐Jul
ZoneHB 13
A $ 15,424
HB 14HB 15HB 16HB 17
$ 30,507 $ $ 26,898 $
Sum of LBMP Sum of BPCG
Payments Payments
$ $ 11,752
Total Payments
$ 48,449
B$$$ ,039$$ ,461$ 9,622$$ 56,242
E$$$ ,082$$ ,835$ 4,660$$
H$ ,061$ ,234$ ,660$ ,143$ ,602$ 8,700$ ,148$
I$$ 7,684$$$ ,328$ 9,668$ ,031$
J$ 16,921$ 21,486$ 44,744$ 63,110$ 55,291$$$ ,913$ 73,499
Total$ 16,921$ 55,283$ 28,273$ 82,447$ 20,623$ 84,065$$ 19,225$ ,706,837
Page 22
Tables 16 and 17 report the July 2011 event energy reductions of EDRP resources
computed using the CBL method. Performance of EDRP resources during both events varied
greatly by zone, with overall performance on both days near 10%. It is important to note that the enrolled MW values shown below that are used to compute performance include unsold SCRs as reported in Table 3.
Table 16: Energy Reductions of EDRP Resources - July 21, 2011
21‐JulMWh
ZoneHB 13 HB 14
Average
HB 15HB 16HB 17 Hourly
MW
Enrolled % Performance
MW of Enrolled MW
G0.20.20.10.00.00.117.31%
J5.05.76.87.05.56.067.59%
K1.11.51.21.20.61.11.960%
Total6.57.88.58.86.67.692.48%
Table 17: Energy Reductions of EDRP Resources - July 22, 2011
22‐JulMWh
ZoneHB 12 HB 13
HB 14HB 15 HB 16
HB 17
Average
Hourly MW
Enrolled
(MW)
% Performance
of Enrolled
(MW)
A0.30.30.40.70.70.552.80.9%
B0.00.00.00.00.00.00.00.0%
C1.52.01.61.41.41.615.110.5%
E3.65.54.43.11.63.626.114.0%
F0.60.70.70.50.30.55.59.9%
H0.00.10.10.00.00.01.82.7%
I0.50.60.50.60.50.53.913.8%
J12.612.413.313.613.712.313.067.519.2%
K1.01.11.01.11.21.11.958.0%
Total12.620.123.722.621.218.021.1191.911.0%
Page 23
Tables 18 and 19 report the July 2011 event energy payments of EDRP resources.
Table 18: Energy Payments to EDRP Resources - July 21, 2011
21‐Jul
ZoneHB 13 HB 14
HB 15HB 16 HB 17
Total Energy
Payments
J$2,499$2,872$3,375$3,521$2,766$15,032
K$555$772$596$590$316$2,830
Total$3,267$3,922$4,262$4,376$3,278$
Table 19: Energy Payments to EDRP Resources - July 22, 2011
22‐Jul
Total
ZoneHB 12HB 13HB 14HB 15HB 16HB 17Energy
Payments
A$151$139$220$356$346$1,213
B$‐$‐$‐$‐$‐$‐
C$759$1,001$822$704$684$3,970
E$1,820$2,745$2,193$1,540$810$9,109
F$278$340$357$265$125$1,365
G$82$88$78$21$‐$270
H$21$41$32$22$11$127
I$249$296$323$306$246$1,419
J$6,897$6,251$7,028$7,858$7,595$6,153$41,781
K$522$700$682$637$622$3,162
Total$6,897$10,132$12,378$12,566$11,446$8,997$62,415
Table 20 provides a summary of energy payments for by event and program during
NYISO demand response program events in July 2011. Table 21 shows the hourly detail of the energy payments by program and event.
Page 24


Table 20: Summary of Energy Payments for 2011 Events
Energy
Payment
SummaryZonesSCREDRPTotal
July 21, 2011G, H, I J, K$1,016,583$19,104$1,035,687
July 22, 2011A, B, C, E, F, G, H, I, J, K$2,706,837$62,415$2,769,252
Totals$3,723,420$81,519$3,804,939
Table 21: Hourly Detail of Energy Payments for 2011 Events
Energy
Payment
Summary Zones
HB 12HB 13HB 14
BPCGTotal
HB 15HB 16HB 17Payments to
SCRsPayments
July 21, 2011G, H, I J, K$46,218$66,670$55,102$59,390$64,171$744,136$1,035,687
July 22, 2011A, B, C, E, F, G, H, I, J, K$123,818$465,415$540,650$395,013$532,069$193,062$519,225$2,769,252
Totals$123,818$511,633$607,321$450,115$591,459$257,233$1,263,361$3,804,939
Combined Hourly Event Performance
SCR resources provided approximately 98% of the average hourly MWh reductions
(658.9 MW) during both demand response events in July 2011 (Tables 22 and 23). Response by EDRP resources improved on July 22 when additional zones were deployed. Table 24
summarized hourly event performance by event date.
Table 22: Hourly Event Performance Detail
NYISO Demand Response Event - July 21, 2011
Combined
Hourly
Performance
July 21, 2011 Zones
HB 12HB 13HB 14HB 15
Average
AverageEnrolledHourly
HB 16HB 17
HourlyMWPerformance
%
SCRG, H, I J, K601.1645.8664.6682.3700.7658.9731.190.1%
EDRPG, H, I J, K6.57.88.58.86.67.692.48.3%
Totals607.6653.6673.2691.1707.2666.5823.580.9%
Hourly
Performance
July 21, 2011
HB 12HB 13
Zones
HB 14HB 15HB 16HB 17
Average
AverageEnrolledHourly
HourlyMWPerformance
%
SCRG, H, I J, K1881.52054.42130.82186.22237.7658.9731.190.1%
EDRPG, H, I J, K6.57.88.58.86.67.692.48.3%
Totals1888.02062.22139.32194.92244.2666.5823.580.9%
Page 25
Table 23: Hourly Event Performance Detail
NYISO Demand Response Event - July 22, 2011
Hourly
Performance
July 22, 2011
HB 12HB 13
Zones
HB 14HB 15HB 16HB 17
Average
AverageEnrolledHourly
HourlyMWPerformance
%
SCRA, B, C, E, F, G, H, I, J, K367.31253.81377.01435.11473.91512.41396.41505.492.8%
EDRPA, B, C, E, F, G, H, I, J, K12.620.123.722.621.218.021.1191.911.0%
Totals379.81273.91400.71457.71495.11530.41417.41697.483.5%
Table 24: Combined Hourly Event Performance Detail
Average
Hourly
Performance Zones
HB 12HB 13HB 14HB 15
AverageEnrolledHourly
HB 16HB 17
HourlyMWPerformance
%
July 21, 2011G, H, I J, K607.6653.6673.2691.1707.2666.5823.580.9%
July 22, 2011A, B, C, E, F, G, H, I, J, K379.81273.91400.71457.71495.11530.41417.41697.483.5%
Table 25 shows the Summer 2011 peak hour performance by demand response program SCR and EDRP Resources. Performance is calculated according to the performance methods for each program. The peak hour occurred on July 22, 2011 in hour beginning 15.
Table 25: Peak Hour Response by Demand Response Program
Peak Hour
Performance
7/22/11 HB 15ZonesSCR (MW)EDRP (MW)Total
July 22, 2011A, B, C, E, F, G, H, I, J, K1435.122.61457.7
Day-Ahead Demand Response Program
The DADRP program provides demand resources with an opportunity to offer their load
curtailment capability into the Day-Ahead energy market as energy supply resources. Resources
submit offers by 5:00 a.m., specifying the hours and amount of load curtailment they are offering
for the next day, and the price at which they are willing to curtail. Prior to November 1, 2004,
the offer price had to be $50/MWh or higher. As of November 1, 2004, the offer floor price for
DADRP has been set at $75/MWh. Offers are structured like those of generation resources, so
DADRP program resources may specify minimum and maximum run times and effectively
Page 26
submit a block of hours on an all-or-nothing basis. This structure makes resources eligible for
Bid Production Cost Guarantee payments that make up for any difference between the market
price during that block of hours and their block offer price. Load scheduled in the DAM is
obligated to curtail the next day. Failure to curtail results in the imposition of a penalty equal to
the product of the MW curtailment shortfall and the greater of the corresponding Day-Ahead and
Real-Time market price.
During the analysis period of September 2010 through August 2011, only one resource
made offers for a period on a single day and the resource was scheduled for only two of the
hours it offered its reduction and for fewer than three MW in each of those two hours. Given the
minimal activity in DADRP during the analysis period, there is nothing on DADRP to report for
this period.
Update on 2011 Demand Response Initiatives
This section provides an update on the status of the following initiatives that the NYISO has been working on with its stakeholders to improve the administration of its demand response programs and to address regulatory directives to facilitate market participation:
• Order 745 Compliance Filing
• Market Rules for Aggregations of Small Demand Resources in the Ancillary Services
Markets
• Procedures for Direct Communication for DSASP
• Aggregations of Demand Side Resources in the Ancillary Services Markets and the
availability of Direct Communication
• Program Design for Demand Response Participation in the Real-Time Energy Market
• Continued Development of the Demand Response Information System (DRIS)
Order 745 Compliance Filing
On August 19, 2011, the NYISO submitted its compliance filing to meet the requirements
of Order 745, Demand Response Compensation in Organized Wholesale Energy Markets. Prior
to its filing, the NYISO presented the details of how it proposed to implement the requirements
in its presentation to a joint session of the Price-Responsive Load Working Group (PRLWG) and
Page 27
Market Issues Working Group (MIWG) on August 9, 2011 titled NYISO’s Compliance Filing to Order 745: Demand Response Compensation in Organized Wholesale Energy Markets9.
Market Rules for Aggregations of Small Demand Resources in the Ancillary Services Market
Because Direct Communication for DSASP is expected to streamline program
participation in DSASP and make it feasible for aggregations of small demand resources to
participate in the ancillary services market, the NYISO focused its efforts in 2011 on developing the technical specifications for direct communications for DSASP, with a commitment to
stakeholders to begin discussions about market rule changes for aggregations of small demand resources during the first quarter of 2012.
Technical Specifications and Procedures for Direct Communication for DSASP
The NYISO delivered its technical specification to stakeholders through a series of
presentations at stakeholder meetings in November and December: Price-Responsive Load
Working Group10 (11/28/11), the Market Issues Working Group (12/1/11), Business Issues
Committee (12/14/11), Operations Committee (12/15/11) and Computer Data Advisory
Subcommittee 12/8/11). On January 9, 2012, the presentation was made to the System
Operations Advisory Subcommittee. At each stakeholder presentation, stakeholders were
informed of the procedures for obtaining the technical specification requirements that were not
covered in the presentation because they had been identified as Critical Energy Infrastructure
Information.
Demand Response in the Real-Time Energy Market
The NYISO completed an architectural design specification at the conclusion of 2011 to
understand which applications may be impacted by the implementation of Demand Response in
9 Demand Response Compensation in Organized Wholesale Energy Markets
http://www.nyiso.com/public/webdocs/committees/bic_prlwg/meeting_materials/2011-08-
09/Compliance_Filing_on_Order_745.pdf
10 DSASP Direct Communications Technical Specification
http://www.nyiso.com/public/webdocs/committees/bic_prlwg/meeting_materials/2011-11-
28/DSASP_Stakeholder_Presentation.pdf
Page 28
the Real-Time Energy Market. As the market design and market rules are developed, the architectural design specification will be updated.
Continued Development of the Demand Response Information System (DRIS)
In the second half of 2011, the NYISO had two additional deployments to increase the
functionality of the Demand Response Information System. The deployments included the following functionality described under each deployment.
July 2011
• Minor improvements to existing functionality that was not market-facing. September 2011
• Implementation to support the tariff changes for the SCR baseline from APMD to
ACL:
o Changes to the data structure, import procedures and calculation of the Average
Coincident Load (ACL);
o Supporting functionality for Provisional ACL;
o Provisions to allow adjustments to metered load for demand reductions in a
Transmission Owner’s demand reduction program during hours that are part of the ACL calculation;
o Addition of an aggregation performance factor which permits over-performance
of one SCR in an SCR Aggregation to compensate for under-performance of
another SCR in the same SCR Aggregation in the same hour;
o Reporting of in-period verification data; and
o RIP deficiency calculations.
Demand Response Initiatives for 2012
This section provides an overview of the projects that the NYISO has planned for its demand response programs for 2012.
Page 29
Implementation of NYISO’s Order 745 Compliance Filing for a Monthly Net Benefits Test
The NYISO is anticipating an order on its Order 745 compliance filing and has identified
the changes to systems and procedures that will need to be made to comply with its filing. Once the NYISO receives its order, the NYISO will assess whether changes to the current
implementation plan are required.
Order 745 Compliance Filing on the Feasibility of a Dynamic Net Benefit Tests
As directed in Order 745, the NYISO will make a compliance filing in September 2012 to
report on the results of a study to determine the feasibility of integrating a dynamic version of the Net Benefits Test on a real-time basis.
Market Rules for Aggregations of Small Demand Resources in the Ancillary Services Market
With the completion of the technical specifications for Direct Communications for
DSASP, the NYISO has begun work on developing the proposed market rules and procedures
for integrating aggregations of small demand resources into its ancillary service markets through
the Demand Side Ancillary Services Program (DSASP). Presentations to stakeholders are
expected to begin in February and the NYISO anticipates filing proposed tariff changes in the
spring of 2012.
Demand Response in the Real-Time Energy Market
The NYISO will begin work with its stakeholders in mid-2012 to complete a market
design for demand response in the real-time energy market by the end of 2012.
Continued Development of the Demand Response Information System (DRIS)
The NYISO has one planned deployment in 2012 for DRIS to further improve the
administration of its demand response programs. The planned deployment for June 2012 will
integrate demand response event creation with communication services from a third-party
provider to improve event notification. This deployment will be used by NYISO Operators to
Page 30
deploy demand response resources and provide a way for market participants to respond with an estimate of their anticipated capability directly into DRIS. A second deployment for late 2012 may be added to address any market rule or procedural changes.
Page 31