THIS FILING LETTER DOES NOT CONTAIN ANY PRIVILEGED OR CONFIDENTIAL
INFORMATION. REPORT SECTIONS II AND III DO NOT CONTAIN ANY PRIVILEGED OR CONFIDENTIAL INFORMATION. THE BODY OF REPORT SECTION I AND
ATTACHMENT II, AND ATTACHMENTS V THROUGH VII DO NOT CONTAIN ANY PRIVILEGED OR CONFIDENTIAL INFORMATION. ATTACHMENT I, ATTACHMENT III AND ATTACHMENT IV CONTAIN PRIVILEGED AND CONFIDENTIAL
INFORMATION, AND ARE CLEARLY MARKED.
December 15, 2017
Kimberly D. Bose, Secretary
Federal Energy Regulatory Commission 888 First Street, N.E.
Washington, D.C. 20426
Re: Annual Report in Docket Nos. ER01-3001-000, ER03-647-000 and
Request for Privileged Treatment of Attachments I, III, and IV
Dear Ms. Bose:
Enclosed for filing in the above-referenced dockets is the New York Independent System
Operator, Inc.’s (“NYISO’s”) Annual Installed Capacity Report on the NYISO’s Capacity Market,
Possible Withholding, New Generation Projects, and Net Revenue Analysis (the “Report”).1 By Order dated February 3, 2010, the Commission directed the NYISO to file this report for informational
purposes only.2
I. List of Documents Submitted
The NYISO submits with this letter, and the below request for confidential treatment, a public version of the Report, with Attachments I, III, and IV redacted. Separately, the NYISO is submitting as confidential, Attachments I, III and IV (the “Confidential Attachments”).
As with prior annual Installed Capacity Reports, the Report is comprised of the following
separate sections: Section I: Capacity Market Report and Withholding Analysis, Section II: Report on New Generation Projects, and Section III: New Generation Projects and Net Revenue Analysis.
1 New York Indepen. Sys. Operator, Inc., 117 FERC ¶ 61,086 (2006); New York Indepen. Sys. Operator, Inc., 103 FERC ¶ 61,201 (2003), 108 FERC ¶ 61,280 (2004), 121 FERC ¶ 61,090 (2007), 123 FERC ¶ 61,206 (2008). In Docket ER03-647, the NYISO files an annual report regarding its Demand Side Management
programs on January 15, and a semi-annual report on its Demand Side Management programs and new
generation projects on June 15 each year.
2 New York Indepen. Sys. Operator, Inc., Order, Docket Nos. ER01-3001 and ER03-647 (Feb. 3, 2010).
II. Request for Confidential Treatment of Attachments I, III, and IV
In accordance with Sections 388.107 and 388.112 of the Commission’s Regulations,3 Article 6
of the NYISO’s Market Administration and Control Area Services Tariff, Sections 1.0(4) and 4.0 of
the NYISO’s Code of Conduct, the NYISO requests Privileged and Confidential treatment of the
contents of the Confidential Attachments. The NYISO also requests that the Confidential Attachments
be exempted from public disclosure under the Freedom of Information Act (“FOIA”), 5 U.S.C. §522.4
The Confidential Attachments contain privileged, commercially sensitive, and trade secret information that is not made public by the NYISO and that could cause competitive harm to the
affected Market Participants,5 and could adversely affect competition in the markets administered by the NYISO, if publicly disclosed. This information includes the identity of Installed Capacity
Suppliers and their respective offering behavior, and the basis therefor. This confidential,
commercially sensitive information is exempt from disclosure under 5 U.S.C. §522(b)(4). For this reason, the NYISO requests that the contents of Confidential Attachments receive Privileged and Confidential treatment and be exempt from FOIA disclosure.
A public version of the contents of Attachment I is set forth in Report Section 1.5.4.2. A public version of Confidential Attachment III, summarizing and masking the contents of Attachment III, is included in the Report as Attachment II. A masked and aggregated version of Confidential Attachment IV is set forth in Report Section 1.5.4.4.
The NYISO requests waiver of any obligation it may have under the Commission’s regulations
or the Secretary’s rules to submit a redacted version of the Confidential Attachments. The NYISO
incorporated into the body of Report Section I a masked or aggregated version of the information that
is contained in the Confidential Attachments and thereby makes publicly available the information
contained in Attachment III that is not confidential and commercially sensitive. In that regard, the
NYISO has provided a redacted version of the information contained in the Confidential Attachments.
The Confidential Attachments are identified and marked in accordance with the Commission’s regulations and rules published by the Secretary’s Office for submitting Privileged information.
3 18 C.F.R. §§ 388.107, 388.112.
4 The information provided by the NYISO for which the NYISO claims an exemption from FOIA disclosure is labeled “Contains Privileged Information - Do Not Release.”
5 Terms with initial capitalization not defined herein have the meaning set forth in the NYISO’s Market Administration and Control Area Services Tariff.
III. Correspondence
Copies of correspondence concerning this filing should be addressed to:
Robert E. Fernandez, General Counsel
Raymond Stalter, Director of Regulatory Affairs *Gloria Kavanah, Senior Attorney
New York Independent System Operator, Inc.
10 Krey Boulevard
Rensselaer, N.Y. 12144
Tel: (518) 356-6000
Fax: (518) 356-4702
rfernandez@nyiso.com
rstalter@nyiso.com
gkavanah@nyiso.com
* Person designated to receive service.
Respectfully submitted,
/s/ Gloria Kavanah
Gloria Kavanah
Counsel for
New York Independent System Operator, Inc.
cc:Michael Bardee
Anna Cochrane
James Ganly
Jette Gebhart
Kurt Longo
David Morenoff
Daniel Nowak
Larry Parkinson
J. Arnold Quinn
Douglas Roe
Kathleen Schnorf Gary Will
CERTIFICATE OF SERVICE
I hereby certify that I have this day served the foregoing document upon each person
designated on the official service list compiled by the Secretary in this proceeding in accordance with the requirements of Rule 2010 of the Rules of Practice and Procedure, 18 C.F.R. §385.2010.
Dated at Rensselaer, NY this 15th day of December 2017.
/s/ Joy A. Zimberlin
Joy A. Zimberlin
New York Independent System Operator, Inc.
10 Krey Blvd.
Rensselaer, NY 12144 (518) 356-6207
2017 Annual Installed Capacity Report
Report on the NYISO’s Capacity Market, Possible Withholding, New Generation Projects, and Net Revenue Analysis
December 15, 2017
Contents
I. Capacity Market Report.........................................................3
I.2 Overview...................................................................3
I.3 Market Design and Regulatory Developments........................................7
I.3.1. Buyer-Side Mitigation Enhancements.............................................7
I.3.2. Revisions to Pivotal Supplier Rules..............................................7
I.3.3 Annual Updates for the ICAP Demand Curves.......................................7
I.3.4 Locality Exchange Factor......................................................8
I.4. Recent Installed Capacity Auction Results...........................................9
I.5 Capacity Withholding Analysis...................................................21
I.5.1 All Capacity Areas in the NYCA................................................21
I.5.2 Unoffered and Unsold Capacity................................................23
I.5.3 New York City and G-J Localities...............................................26
I.5.4 Rest of State..............................................................30
I.5.4.1 Overview...............................................................30
I.5.4.2 Analysis of ROS Unoffered Capacity...........................................32
I.5.4.3 Analysis of ROS Unsold Capacity..............................................33
I.5.4.4 Monthly Price Impacts......................................................34
II. NYISO Report on New Generation Projects..........................................38
III. New Generation Projects and Net Revenue Analysis..................................39
III.1 Overview.................................................................39
III.2 Market Design Developments to Enhance ICAP Demand Curve Performance...............39
III.3 Interconnection Queue Projects.................................................39
III.4 Proposed Resource Additions..................................................41
III.5 Net Revenue Analysis........................................................44
III.5.1 Quantification of “Need”.....................................................44
Attachments
Attachment I: Confidential. Unoffered Capacity: Market Participant Explanations Attachment II: Unsold Capacity Offers (Masked)
Attachment III: Confidential. Unsold Capacity Offers (Unmasked)
Attachment IV: Confidential. Unsold Capacity Offers: Market Participant Explanations Attachment V: Interconnection Queue
Attachment VI: Status Key for Interconnection Queue
Attachment VII: November 1999 - October 2016 Installed Capacity Auction Activity
2017 Annual Installed Capacity Report |December 15, 2017| I
Tables
Table 1: List of Mothballed and Retired Units..........................................18
Table 2: Minimum Installed Capacity Requirements (%)...................................25
Table 3: Unoffered and Unsold MW.................................................26
Table 4: ROS Unoffered and Unsold Capacity MW by Type of Market Participant................31
Table 5: Maximum Price Impact of ROS Unoffered Capacity (15MW+)........................33
Table 6: Maximum Price Impact of ROS Unsold MW.....................................34
Table 7: Going Forward Cost Definitions..............................................35
Table 8: ROS Unsold MW with reported GFCs costs above ICAP Monthly Auction Prices (15MW+)...35
Table 9: ROS ICAP Spot Auction Price Impact Analysis Results.............................36
Table 10: Capacity Resource Changes since the publication of the 2017 NYISO Gold Book........42
Table 11: Current Status of Tracked Market-Based Solutions and Transmission Owner Plans.......43
Table 12: Summer Available Capacity vs. Required Capacity...............................45
Table 13: Annual Revenue Requirements in UCAP terms ($/MW)...........................46
Table 14: Benchmark Annual Revenues in UCAP terms ($/MW)............................47
Table 15: Revenue Margins.......................................................47
Charts
Chart 1: UCAP Available Reserve and Spot Market Clearing Prices...........................5
Chart 2: NYCA Market Clearing Prices...............................................10
Chart 3: NYCA Offered MW.......................................................11
Chart 4: NYC Market Clearing Prices................................................12
Chart 5: NYC Offered MW........................................................13
Chart 6: G-J Locality Market Clearing Prices...........................................14
Chart 7: G-J Locality Offered MW...................................................15
Chart 8: Long Island Market Clearing Prices...........................................16
Chart 9: Long Island Offered MW...................................................17
Chart 10: Average Percent of Unoffered MW...........................................23
Chart 11: Average Percent of Unsold MW.............................................24
Chart 12: NYC Mitigation Results...................................................28
Chart 13: NYC Generator and SCR UCAP............................................28
Chart 14: G-J Locality Mitigation Results..............................................29
Chart 15: G-J Locality Generator and SCR UCAP.......................................29
Chart 16: Rest of State Capacity Available, Offered, Sold and Exported.......................30
Chart 17: NYISO Interconnection Queue Projects.......................................40
Chart 18: UCAP based Revenue Margins.............................................48
Chart 19: UCAP based Capacity Margins.............................................49
Chart 20: Capacity Market Revenues Relative to CONE Requirements........................49
2017 Annual Installed Capacity Report |December 15, 2017| II
I. Capacity Market Report I.2 Overview
This report (the “December 2017 Report”) reviews the outcomes of the Installed
Capacity (“ICAP”) market administered by the New York Independent System Operator
(“NYISO”); assesses the effectiveness of the ICAP Demand Curves1 (“Demand Curves”) in
attracting investment in new and existing capacity resources; and examines potential
withholding activity in the NYISO-administered Capacity auctions for the New York Control Area
(“NYCA”) within its three Localities, New York City (“NYC”), the G-J Locality (“G-J”), and Long
Island (“LI”), and the remaining area that comprises the NYCA, the Rest of State (“ROS”)
(referred to in this report as “capacity areas”).2 The December 2017 Report covers the Winter
2016-2017 and Summer 2017 Capability Periods, which span from November 2016 through
October 2017. Similar NYISO reports filed in previous years cover earlier periods.
With the exception of the G-J Locality capacity prices, during the Winter 2016-2017
Capability Period capacity prices were lower, on average, than those of the previous Winter
Capability Period. The average ICAP Spot Market Auction (“Spot Market Auction”) prices over the Winter 2016-2017 Capability Period were $0.47/kW-month, $3.48/kW-month, $3.48/kW-
month, and $0.47/kW-month, for NYCA, the G-J Locality, NYC, and LI, respectively. These prices compare with $0.95/kW-month, $3.24/kW-month, $5.97/kW-month and $1.65/kW-month during the previous winter for NYCA, the G-J Locality, NYC, and LI respectively.
Capacity prices during the Summer 2017 Capability Period in NYC and NYCA were
lower on average than those of the previous (2016) Summer Capability Period. The average
Spot Market Auction prices in NYC were $10.04/kW-month compared to $12.24/kW-month, and were $2.35/kW-month compared to $4.09/kW-month for NYCA. The average Spot Market
Auction prices over the Summer 2017 Capability Period were higher for G-J and the LI Locality, i.e., $9.85/kW-month and $6.66/kW-month compared to $9.24/kW-month and $4.63/kW-month respectively during the previous Summer Capability Period.
The average Spot Market Auction prices for Summer 2017 were lower than the Summer 2016 average by $1.74/kW-month in NYCA; by $2.20/kW-month in NYC; and higher by
$0.61/kW-month in the G-J Locality; and by $2.03/kW-month in LI. These price changes were driven primarily by changes in the respective Locational Minimum Installed Capacity
Requirements (“LCRs”), as well as by the changes in available capacity compared to the load forecast throughout NYCA. These dynamics are depicted in Table 1.
1 Terms in upper case not defined herein shall have the meaning set forth in the NYISO’s Market Administration and Control Area Services Tariff (“Services Tariff”), with the exception of Rest of State
(“ROS”) when such term refers to a period before the Summer 2014 Capability Period. Consistent with the Services Tariff revision to establish the G-J Locality beginning with the Summer 2014 Capability
Period and change the definition of Rest of State accordingly, when ROS refers to Winter 2013-2014 or a prior period, it means Load Zones A through I. Any other terms not so defined have the meaning set forth in the Open Access Transmission Tariff (“OATT”).
2 The NYISO’s Capacity auctions have four Market-Clearing Prices: NYCA, New York City, Long Island and the G-J Locality.
2017 Annual Installed Capacity Report |December 15 2017|3
For the Winter 2016-2017 and Summer 2017 Capability Periods, there was minimal
change in the proportion of Load Serving Entity (“LSE”) Unforced Capacity (“UCAP”)
requirements met through purchases in the NYISO-administered capacity auctions versus
bilateral transactions when compared to previous Capability Periods. In the Winter 2016-2017 Capability Period, 34.78% of LSE Capacity requirements were met through bilateral
transactions (35.71% in the previous Winter Capability Period), while the remaining percent of LSE requirements were met through purchases in the NYISO-administered auctions. Similarly, in the Summer 2017 Capability Period, 39.16% of LSE capability requirements were met
through bilateral transactions (36.38% in Summer 2016), while the remaining LSE requirements were satisfied through purchases made in the NYISO-administered auctions.
The seasonal average quantities of unoffered capacity constituted less than 0.7% of
available supply in the NYC, LI, and the G-J Locality (see Chart 10). The seasonal average
quantities of unsold capacity (i.e., capacity that was offered but went unsold) was below 1% for
each of the three Localities (see Chart 11).3 Total unsold and unoffered capacity quantities from
ROS resources were at or below 1% in the Winter 2016-2017, and at or below 0.5% in Summer
2017. The UCAP offered and purchased in NYCA and each of the three Localities exceeded
the LCRs; therefore, prices were below the base reference point on the respective ICAP
Demand Curves.
Overall, the Market-Clearing Prices in the ICAP Spot Market Auctions support the
conclusion that the ICAP Spot Market Auctions continue to be attractive to Installed Capacity
Suppliers. Previously the NYISO stated that it is difficult to correlate the effect of the ICAP
Demand Curves on the level of investment in the NYCA, partially because in the past NYC has
had capacity in excess of the LCR, and partially due to the lead-time required to site, develop,
and construct a new generator. The ICAP Demand Curves provide transparent capacity market
price signals that developers consider in their projections of anticipated future revenues when
making near-term investment decisions. Capacity market outcomes are reviewed to ensure
market signals are aligned with reliability needs. When market changes are identified, the
NYISO works with its stakeholders on prioritizing the need for and developing a suitable market
rules.
The NYISO continues to monitor potential reliability risks and other issues that may
affect the reliability outlook for New York’s bulk electric system. On October 18, 2016, the
NYISO Board of Directors approved the 2016 Reliability Needs Assessment (“RNA”) Report
(“2016 RNA Report”),4 which is the first step in preparing the 2016 Comprehensive Reliability
Plan. The 2016 RNA Report’s key findings identified two transmission security needs in portion
of the Bulk Power Transmission Facilities beginning in 2017. On April 11, 2017issued the
Comprehensive Reliability Plan Final Report (“CRP”).5 The CRP concluded that the Bulk
3 Section I.5.2 of this report provides information and analysis of the unoffered and unsold
capacity.
4 The 2016 RNA Report is available at:
<http://www.nyiso.com/public/webdocs/media_room/press_releases/2016/Child_2016_RNA/2016RNA_Fi
nal_Oct18_2016.pdf>.
5 See New York Independent System Operator, “2016 Comprehensive Reliability Plan issued on April 11, 2017, available at:
<http://www.nyiso.com/public/webdocs/markets_operations/services/planning/Planning_Studies/Reliabilit
y_Planning_Studies/Reliability_Assessment_Documents/2016CRP_Report_Final_Apr11_2017.pdf>.
2017 Annual Installed Capacity Report |December 15 2017|4
Power Transmission Facilities will meet all applicable Reliability Criteria over the 2017 through 2026 Study Period, and confirms that the initially identified in RNA were resolved.
The NYISO is preparing for the next Reliability Planning Process, which will begin in January 2018, for the New York Control Area Bulk Power Transmission Facilities based on updated assumptions including risk factors and other reliability issues
Chart 1: UCAP Available Reserve and Spot Market Clearing Prices
NYCA UCAP Available vs. NYCA Requirement
125%$20
NYCA UCAP Available as
120%Percentage of NYCA Requirement$16
NYCA Market Clearing Price
115%$12
110%$8
105%$4
100%$0
LI UCAP Available vs. LI Requirement
125%
120%
115%
110%
105%
100%
$20
LI UCAP Available as
Percentage of LI Requirement
$16
LI Market Clearing Price
$12
$8
$4
$0
2017 Annual Installed Capacity Report |December 15 2017|5
G-J Locality UCAP Available vs. G-J Locality Requirement
125%
120%
115%
110%
105%
100%
G-J UCAP Available as
Percentage of G-J Requirement G-J Market Clearing Price
$20
$16
$12
$8
$4
$0
NYC UCAP Available vs. NYC Requirement
125%
120%
115%
110%
105%
100%
NYC UCAP Available as
Percentage of NYC Requirement NYC Market Clearing Price
$20
$16
$12
$8
$4
$0
2017 Annual Installed Capacity Report |December 15 2017|6
I.3 Market Design and Regulatory Developments
Over the past year there have been several ICAP market design initiatives and
regulatory developments pertaining to the NYISO’s Installed Capacity market. The significant developments are described below.
I.3.1. Buyer-Side Mitigation Enhancements
On July 14, 2017, NYISO filed proposed Services Tariff revisions to include: (i)
enhancements to the rules governing the forecasts determined and used by the NYISO in the
course of making determinations under the Buyer-Side Mitigation (“BSM”) Rules; and (ii)
improvements to rules governing the use of escalation factors and inflation rates under the BSM
Rules. Federal Energy Regulatory Commission (“FERC”) accepted the revisions on September
11, 2017.
I.3.2. Revisions to Pivotal Supplier Rules
On February 6, 2017, NYISO filed revisions to the Services Tariff to apply across all
Mitigated Capacity Zones uniform rule by which a “Pivotal Supplier” can rebut the presumption
of control of unforced capacity. Under the revisions, Control of Unforced Capacity will no longer
be rebuttable in Zone J through forward capacity sales, such as sales in Strip or Monthly
auctions. These revisions are necessary to eliminate incongruities in the rebuttal standard
between Mitigated Capacity Zones and that, in so doing, all suppliers will be treated the same,
irrespective of the Mitigated Capacity Zone in which they are selling. FERC accepted revisions,
effective April 7, 2017.
I.3.3 Annual Updates for the ICAP Demand Curves
FERC accepted proposed revisions to the NYISO’s rules to move from a triennial ICAP Demand Curve reset to a quadrennial reset period with annual updates. The ICAP Demand
Curves will be updated formulaically for each of the remaining three years of each reset period. The three components of the ICAP Demand Curve input parameters that will be updated
annually are the (i) winter-to-summer ratio, (ii) gross cost of new entry for peaking plants using
an escalation factor, and iii) Net Energy and Ancillary Services revenue offset. The updates to the winter-to-summer ratio and the Energy and Ancillary Services revenue will be based on
rolling three years of data. On November 2, 2017, the NYISO posted the first annual update for each of the ICAP Demand Curves. The tariff provision for a collar was triggered for the New
York City and Long Island Demand Curves.
2017 Annual Installed Capacity Report |December 15 2017|7
I.3.4 Locality Exchange Factor
On November 30, 2016, NYISO filed revisions to its Services Tariff to correct a pricing inefficiency that could arise in the event of capacity exports from certain Localities in the NYCA. The methodology recognizes that an exporting generator continues to operate within its Locality, which would be reflected in the ICAP Spot Market Auction clearing prices by accounting for the portion of exported capacity that can be replaced by capacity located in Rest of State. FERC accepted the revisions, effective January 29, 2017.
2017 Annual Installed Capacity Report |December 15 2017|8
I.4. Recent Installed Capacity Auction Results
Capacity committed through self-supply, bilateral transactions, and the NYISO-
administered auctions (referred to herein as “committed” capacity) remains above the NYCA
Minimum Installed Capacity Requirement and above each Locality’s LCRs. In general, the
amount of capacity available from many generators in the NYCA increases in the Winter
Capability Period because of higher possible output at lower ambient temperatures. Capacity
imports from External Control Areas fluctuate both seasonally and monthly. The NYCA
Demand Curve price can decline to zero when supply exceeds the NYCA Minimum Installed
Capacity Requirement by 12 percent or more. Accordingly, the NYCA Market-Clearing Prices
have been consistently at or above ten percent of the NYCA ICAP Demand Curve reference
price6, particularly in the Winter Capability Period when prices were consistently below $1/kW-
month on average.
The amount of Capacity committed to the NYCA, including imports, continues to be high relative to the minimum requirements established with the Installed Reserve Margin of 18
percent. The monthly average import levels into the entire NYCA were about 2,440 MW in the Winter 2016-2017 Capability Period and about 3,070 MW in the Summer 2017 Capability
Period. Those values represent approximately a 460 MW increase in the monthly average over the amount imported in the previous Winter Capability Period and a 390 MW monthly average increase relative to the 2016 Summer Capability Period.
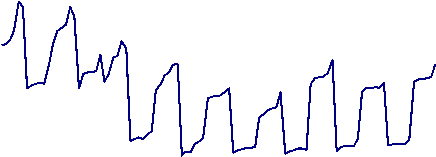
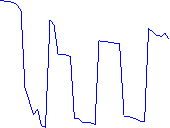
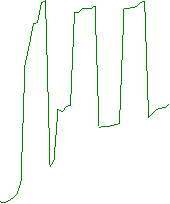
ICAP Market-Clearing Prices and auction activity levels from November 1999 through October 2017 for the NYCA, G-J Locality, NYC, and LI are summarized in tabular form in
Attachment VII. Market-Clearing Prices are depicted graphically in Chart 2, Chart 4, Chart 6 and Chart 8; and the amount of capacity committed, MW that were offered, and unsold MW are depicted in Chart 37, Chart 5, Chart 78, and Chart 9.
6 The reference price when the ICAP Demand Curve is translated to UCAP.
7 Previous years’ Reports presented only ROS unsold data in Chart 3. This year’s Report presents in Chart 3 the NYCA-wide unsold data.
8 The previous year’s Report presented only Load Zone G, H and I unsold data in Chart 5. This year’s Report presents in Chart 5 the Zones G, H, I, and J unsold data.
2017 Annual Installed Capacity Report |December 15 2017|9
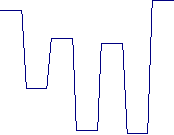
Chart 2: NYCA Market Clearing Prices
$8.00
Strip
Monthly
$7.00
$6.00
$5.00
$4.00
$3.00
$2.00
$1.00
$-
Winter Capability
Periods
Shaded Grey
Spot
2017 Annual Installed Capacity Report |December 15 2017|10
Chart 3: NYCA Offered MW
45,000
40,000
35,000
30,000
25,000
20,000
15,000
10,000
5,000
0
NYCA RequirementNYCA ExcessNYCA Unsold
2017 Annual Installed Capacity Report |December 15 2017|11

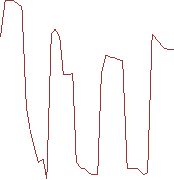
Chart 4: NYC Market Clearing Prices
$25.00
$22.50
$20.00
$17.50
$15.00
$12.50
$10.00
$7.50
$5.00
$2.50
$-
Winter Capability
Periods
Shaded Grey
Strip
Monthly
Spot
2017 Annual Installed Capacity Report |December 15 2017|12
Chart 5: NYC Offered MW
11,000
10,000
9,000
8,000
7,000
6,000
5,000
4,000
3,000
2,000
1,000
0
NYC RequirementNYC ExcessNYC Unsold
2017 Annual Installed Capacity Report |December 15 2017|13
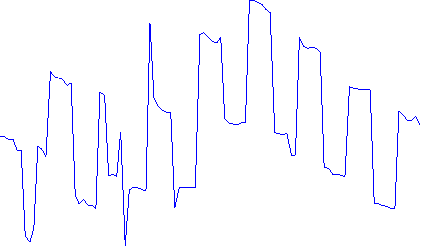
Chart 6: G-J Locality Market Clearing Prices
$25.00
$22.50
Winter CapabilityStrip
Periods
Shaded GreyMonthly
$20.00Spot
$17.50
$15.00
$12.50
$10.00
$7.50
$5.00
$2.50
$-
2017 Annual Installed Capacity Report |December 15 2017|14
Chart 7: G-J Locality Offered MW
16,000
15,000
14,000
13,000
12,000
11,000
10,000
9,000
8,000
7,000
6,000
5,000
4,000
3,000
2,000
1,000
0
G-J RequirementG-J ExcessG-J Unsold
2017 Annual Installed Capacity Report |December 15 2017|15
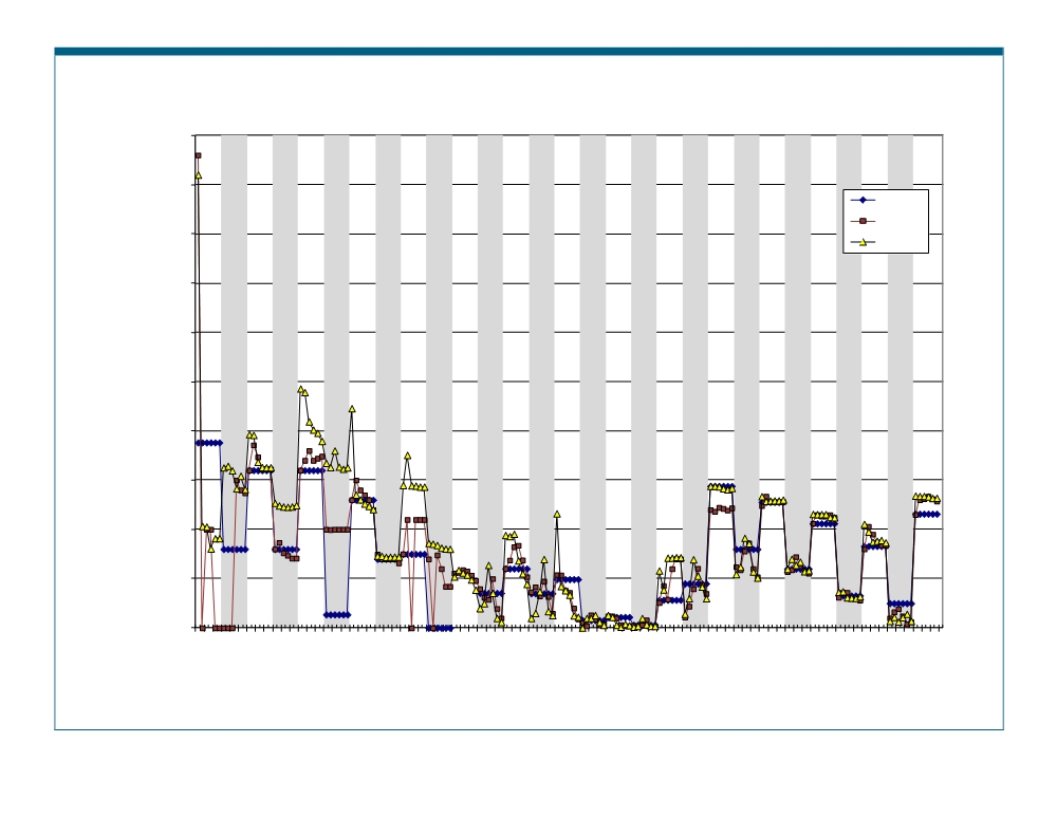
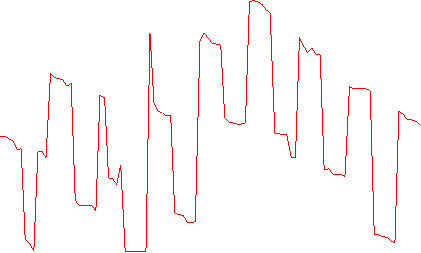
Chart 8: Long Island Market Clearing Prices
$25.00
$22.50
$20.00
$17.50
$15.00
$12.50
$10.00
$7.50
$5.00
$2.50
$-
Winter Capability
Periods
Shaded Grey
Strip
Monthly
Spot
2017 Annual Installed Capacity Report |December 15 2017|16
Chart 9: Long Island Offered MW
6,500
6,000
5,500
5,000
4,500
4,000
3,500
3,000
2,500
2,000
1,500
1,000
500
0
LI RequirementLI ExcessLI Unsold
2017 Annual Installed Capacity Report |December 15 2017|17
Table 1 summarizes amount of generating capacity throughout the NYCA that has
deactivated during the Winter 2009/2010 through November 2017. Over this period, 58
generators (counted by PTID) accounted for 63 instances of generators (counted by PTID)
entering or switching between a retired, laid-up, IIFO, or mothballed state. These instances total 4,319.7 MW. Of the 58, 3 generators exited the market (i.e., entered one of the preceding states) and reentered the market, and again exited the market; and 10 generators exited the market one time and reentered and remain in the market. These 13 generators total 967.8 MW. A net of 3,351.9 MW exited the Capacity Market during this timeframe.
Table 1: List of Mothballed and Retired Units
Organization NameUnit NameZoneMW1Status2Period
AES Eastern Energy LPAES Greenidge Unit 3C52.80RWinter 2009-2010
AES Eastern Energy LP
Emera Energy U.S.
Subsidiary No. 1, Inc.
AES Greenidge Unit 4
AES Greenidge Unit 4
C106.10M
C (106.10) RTS
Winter 2010-2011
Winter 2016-2017
AES Eastern Energy LPAES Westover Unit 7C43.50RWinter 2009-2010
NRG Power Marketing, LLCAstoria GT 05J16.00IIFOWinter 2015-2016
NRG Power Marketing, LLCAstoria GT 07J15.50IIFOWinter 2015-2016
NRG Power Marketing, LLCAstoria GT 08J15.30MSummer 2016
NRG Power Marketing LLCAstoria GT 10J24.90MSummer 2012
NRG Power Marketing LLCAstoria GT 10J(24.90)RTSSummer 2013
NRG Power Marketing, LLCAstoria GT 10J24.90MSummer 2016
NRG Power Marketing LLCAstoria GT 11J23.60MSummer 2012
NRG Power Marketing LLCAstoria GT 11J(23.60)RTSSummer 2013
NRG Power Marketing, LLCAstoria GT 11J23.60MSummer 2016
NRG Power Marketing, LLCAstoria GT 12J22.70IIFOWinter 2015-2016
NRG Power Marketing, LLCAstoria GT 13J24.00IIFOWinter 2015-2016
Astoria Generating Company, LPAstoria 2J177.00MWinter 2011-2012
Astoria Generating Company, LPAstoria 2J(177.00)RTSWinter 2014-2015
Astoria Generating Company, LPAstoria 4J375.60MSummer 2012
Innovative Energy Systems, Inc.Auburn LFGC0.0IIFOSummer 2016
Innovative Energy Systems, Inc.Auburn LFGC0.0IIFO to RWinter 2016-2017
Erie Blvd. Hydro - Seneca OswegoBaldwinsville 2C0.20RSummer 2012
Erie Blvd. Hydro - Seneca OswegoBaldwinsville 2C(0.20)RTSWinter 2013-2014
National Grid Generation LLCBarrett 07K17.30RWinter 2011-2012
Rochester Gas & Electric Corp.Beebee GTB15.00RWinter 2011-2012
Binghamton BOP, LLCBinghamton Cogen PlantC43.80RWinter 2011-2012
Binghamton BOP, LLCBinghamton Cogen PlantC(43.80)RTSWinter 2014-2015
Dynegy Danskammer, LLCDanskammer 1G67.00R3Winter 2012-2013
Danskammer Energy, LLCDanskammer 1G(67.00)RTSSummer 2014
2017 Annual Installed Capacity Report |December 15, 2017|18
Organization NameUnit NameZoneMW1Status2Period
Dynegy Danskammer, LLCDanskammer 2G62.70R3Winter 2012-2013
Danskammer Energy, LLCDanskammer 2G(62.70)RTSSummer 2014
Dynegy Danskammer, LLCDanskammer 3G137.20R3Winter 2012-2013
Danskammer Energy, LLCDanskammer 3G(137.20)RTSWinter 2014-2015
Dynegy Danskammer, LLCDanskammer 4G236.20R3Winter 2012-2013
Danskammer Energy, LLCDanskammer 4G(236.20)RTSWinter 2014-2015
Dynegy Danskammer, LLC
NRG Energy, Inc.
(Dunkirk Power LLC)
NRG Power Marketing, LLC
NRG Energy, Inc.
(Dunkirk Power LLC)
NRG Energy, Inc.
(Dunkirk Power LLC)
Danskammer Diesel (5&6)
Dunkirk 1
Dunkirk 2
Dunkirk 3
Dunkirk 4
G5.00R
A96.20M
A97.20MO
A201.40M
A 199.10 M
Summer 2012
Summer 2013
Winter 2015-2016
Summer 2012
Summer 2012
Energy Systems North East LLCEnergy Systems North EastA82.00RWinter 2010-2011
National Grid Generation LLCFar Rockaway_4K110.60RSummer 2012
Freeport Electric MunicipalityFreeport ElectricK0.00RSummer 2013
National Grid Generation LLCGlenwood 4K118.70RSummer 2012
National Grid Generation LLCGlenwood 5K122.00RSummer 2012
Erie Blvd. Hydro - North SalmonHogansburgD0.30RWinter 2014-2015
NRG Power Marketing, LLCHuntley 67A196.50RWinter 2015-2016
NRG Power Marketing, LLCHuntley 68A198.00RWinter 2015-2016
Erie Blvd. Hydro - Lower HudsonJohnsonville 2F0.00RWinter 2010-2011
Erie Blvd. Hydro - Lower Hudson
New York Power Authority
Johnsonville 2
Kensico Hydro Project
(Units 1, 2, 3)
F(0.00)RTS
I 3.00 R
Winter 2013-2014
Summer 2012
National Grid Generation LLCMontauk 2K2.00RSummer 2013
National Grid Generation LLCMontauk 3K2.00RSummer 2013
National Grid Generation LLC
Niagara Generation, LLC
Niagara Generation, LLC
Niagara Power Marketing, LLC
Montauk 4
Niagara Generation
Biomass Facility
Niagara Generation
Biomass Facility
Niagara Generation
Biomass Facility
K2.00R
A50.50M
A(50.50)RTS
A 50.50 IIFO
Summer 2013
Summer 2013
Winter 2013-2014
Winter 2015-2016
New York Power AuthorityPoletti 1J891.00RWinter 2009-2010
Project Orange AssociatesProject Orange 1C43.60RWinter 2010-2011
Project Orange Associates
ReEnergy Chateaugay LLC
ReEnergy Chateaugay LLC
Rochester Gas & Electric
Project Orange 2
ReEnergy Chateaugay
Biomass-to-Energy
ReEnergy Chateaugay
Biomass-to-Energy
Rochester Station 9
Unit 2 CT
C44.00R
D18.60M
D18.60M to R
B 15.80 R
Winter 2010-2011
Summer 2013
Summer 2016
Winter 2013-2014
Erie Blvd. Hydro - Seneca OswegoSeneca Oswego Fulton 1C0.70RSummer 2013
Erie Blvd. Hydro - Seneca OswegoSeneca Oswego Fulton 2C0.30RSummer 2013
Syracuse Energy CorporationSyracuse Energy ST1C11.00RSummer 2013
Syracuse Energy CorporationSyracuse Energy ST2C58.90RSummer 2013
TC Ravenswood, LLCTC Ravenswood GT 04J15.20MOSummer 2016
2017 Annual Installed Capacity Report |December 15, 2017|19
Organization NameUnit NameZoneMW1Status2Period
TC Ravenswood, LLCTC Ravenswood GT 3-3J37.70MSummer 2014
TC Ravenswood, LLCTC Ravenswood GT 3-4J35.80RSummer 2011
TC Ravenswood, LLCTC Ravenswood GT 3-4J(38.60)RTSSummer 2014
TC Ravenswood, LLCTC Ravenswood GT05J15.70MOSummer 2016
TC Ravenswood, LLCTC Ravenswood GT06J16.70MOSummer 2016
TC Ravenswood, LLCTC Ravenswood GT07J16.50MWinter 2013-2014
AES Eastern Energy LPWestover Unit 8C83.80MWinter 2010-2011
AES ES Westover LLCWestover LESRC0.00RSummer 2013
Helix Ravenswood, LLCRavenswood GT09J16.30IIFOWinter 2017-2018
Notes to Table 1:
Note 1: The capacity values listed are the CRIS MW values stated in the NYISO’s Load and Capacity Data Report
(referred to as the “Gold Book”).
Note 2: “IIFO” means ICAP Ineligible Forced Outage, “R” indicates “retired” (including “Retired,) “M” indicates
“mothballed”, MO means “Mothball Outage”, and “RTS” indicates returned to service after being M, MO, or
R. RTS” Changes in status of generators that were IIFO and subsequently changed their status are indicated on this table. Services Tariff provisions defining the terms ICAP Ineligible Force Outage, Mothball, and Retire apply to outages pursuant to the rules effective May 1, 2015.
Note 3: Helios Power Capital, LLC, et al., Joint Petition for Expedited Approval for the Lease, Sale and Operation of
the Danskammer Generating Facility Under Lightened Regulation and for Related Relief, PSC Case No. 14-
E-0117 (Jun. 27, 2014).
2017 Annual Installed Capacity Report |December 15, 2017|20
I.5 Capacity Withholding Analysis
I.5.1 All Capacity Areas in the NYCA
This section of the report addresses potential withholding issues in the NYISO-
administered capacity auctions for all four capacity areas during the period of November 2016 to
October 2017: ROS, NYC, the G-J Locality, and LI. For purposes of this report, in order to
identify whether any potential withholding occurred, the NYISO analyzed the differences
between available capacity9 and the supply committed through self-supply, bilateral
transactions, and the NYISO-administered auctions. In particular, the NYISO examined:
The NYCA capacity that was available to be offered into the ICAP Spot Market Auctions,
but was not offered (“unoffered capacity”),
Available NYCA capacity that was offered into the ICAP Spot Market Auctions but was
not sold (“unsold capacity”),
Unoffered capacity as a percentage of available capacity, and Unsold capacity as a percentage of offered capacity.
When capacity is available but not offered, it is an indication that physical withholding
may have occurred. Similarly, if available capacity is offered at a price that causes it to not
clear, it is an indication of possible economic withholding. The amounts of unoffered and unsold
capacity are determined from the ICAP Spot Market Auction results because this auction is the
last opportunity for an Installed Capacity Supplier to sell its capacity. The existence of unoffered
and unsold capacity, however, does not necessarily imply the intent to manipulate market
prices.
As reflected in the NYISO’s previous reports on the Installed Capacity Demand Curves,
patterns of unsold capacity have varied across the three Localities and the NYCA. For the
entire NYCA there generally has been more unsold capacity in Winter months than Summer
months, due in part to lower prices in the Winter months. The monthly average of unsold MW
for the Winter 2016-2017 Capability period in relation to the Winter 2015-2016 Capability Period
was as follows: NYC 51 MW compared to 2 MW, G-J Locality 31 MW compared to 2 MW, Long
Island 4 MW compared to 1 MW, and NYCA-wide 227 MW compared to 187 MW. The
seasonal monthly average amount of unsold MW for the Summer 2017 Capability Period for all
of the NYCA was zero MW, while it was near zero (0.46) MW in the Summer 2016 Capability
Period.
In Long Island, there was a monthly average of 4 MW of unsold capacity in the Winter 2016-2017 Capability Period, compared to near 1 MW in the Winter 2015-2016 Capability Period; and 0 MW in the Summer 2017 Capability Period compared to near 1 MW in the
Summer 2016 Capability Period.
In NYC, there was a monthly average of 51 MW of unsold capacity in the Winter 2016-
2017 Capability Period, compared to 2 MW in the Winter 2015-2016 Capability Period; and 0
9 Available capacity is defined as the lesser of the NYISO-accepted DMNC and the Capacity
Resource Interconnection Service (“CRIS”) MW value, with the Equivalent Demand Forced Outage Rates (“EFORd”) reduction applied.
2017 Annual Installed Capacity Report |December 15, 2017|21
MW in the Summer 2017 Capability Period compared to near 0 MW in the Summer 2016 Capability Period.
In the G-J Locality, there was a monthly average of 31 MW of unsold capacity in the
Winter 2016-2017 Capability Period, compared to 2 MW in the Winter 2015-2016 Capability
Period; and 0 MW in the Summer 2017 Capability Period compared to near 0 MW in the
Summer 2016 Capability Period. The increase in unsold capacity in NYC and the G-J Locality
from the prior Capability Year is due in part to offers from particular resources that cleared in
prior years but did not clear in Winter 2016-2017 due to lower Spot Market Auction clearing
prices.
There are three types of capacity auctions in each Capability Period: a Capability Period
Auction (also referred to as the “strip auction”), six Monthly Auctions, and six ICAP Spot Market
Auctions. Available capacity may be offered into any or all of the auctions. There are three
distinct minimum ICAP requirements: one each for the NYC, G-J, and LI Localities, as well as
one for the NYCA as a whole. LSEs with Load in NYC, G-J, or LI Localities are required to
procure minimum levels of capacity that is electrically located within the respective Locality - the
“LCRs” in terms of Unforced Capacity, i.e., the Locational Minimum Unforced Capacity
Requirement. Such capacity is also credited toward each NYC and Long Island LSE’s overall
NYCA obligation. The NYISO establishes the NYCA Minimum Installed Capacity Requirement
and the LCRs annually.
The Services Tariff does not require Installed Capacity Suppliers to offer UCAP into the
ICAP markets except for certain suppliers in Mitigated Capacity Zones (i.e., NYC and the G-J
Locality). Until the implementation of the ICAP market power mitigation measures set forth in
Attachment H of the Services Tariff, which were effectuated in May 2008, the majority of
capacity in NYC - that of the “Divested Generation Owners” - had been subject to Commission-
approved ICAP mitigation measures that imposed bid caps and required the units’ capacity to
be offered into the ICAP auctions. The Commission’s March 7, 2008 Order10 removed the
requirements unique to the Divested Generation Owners and approved mitigation measures
applicable to all In-City capacity. The March 7, 2008 Order effectuated new In-City mitigation
measures, based on Pivotal Supplier determinations combined with offering conduct and price
impact thresholds, to determine whether market power had been exercised. ICAP market
power mitigation measures became effective for the G-J Locality concurrent with its
implementation. These measures for NYC and G-J Locality are set forth in Section 23.4.5
(Attachment H) of the Services Tariff (as revised over time, “Supply-side Mitigation Measures”).
In developing the information for this report, the NYISO examined auction outcomes of the Capability Periods from Summer 2007, which began May 1, 2007, through Summer 2017, which ended October 31, 2017. Since the capacity product transacted in the NYISO-
administered ICAP auctions is UCAP, the following information was examined:
Certification data, reflecting the certified MW of UCAP from all the Resources physically
located within New York available to supply capacity to the NYCA. The analysis did not
include resources physically located outside of the NYCA.
10 See New York Independent System Operator, Inc., Docket No. EL07-39-000, Order Conditionally Approving Proposal, 122 FERC ¶ 61,211 (2008).
2017 Annual Installed Capacity Report |December 15, 2017|22

Certification data, reflecting the certified MW of UCAP from all the Resources within the
G-J Locality (Load Zones G, H, I, and J) available to supply capacity to the NYCA. The
analysis did not include resources physically located outside of the NYCA.
The amount of UCAP supplied, which includes UCAP sold in any of the NYISO ICAP
auctions, UCAP certified as self-supplied against an LSE’s Unforced Capacity obligation, and UCAP committed through bilateral transactions.
I.5.2 Unoffered and Unsold Capacity
Chart 10 presents seasonal averages of unoffered capacity as a percentage of available Capacity for each of the three capacity areas.
Chart 10: Average Percent of Unoffered MW
The Long Island Locality has fairly consistent seasonal fluctuations in the amounts of
unoffered capacity, which can be seen in Chart 10. The LI Locality is characterized by
procurement chiefly through bilateral transactions and self-supply. The amount of unoffered
capacity in the LI Locality fluctuates between 0.02% and 2.3%. A portion of that unoffered
capacity is not actually available due, in some instances, to site permit restrictions. Another
portion arises from purchases due to bidders for NYCA capacity (i.e., not requiring capacity
located in Long Island) in the Capability Period and Monthly Auctions.11 The NYISO has
observed that these NYCA bidders sometimes fail to offer the Long Island capacity in the ICAP
Spot Market Auction.
11 When the Market Clearing Price in these auctions is the same for NYCA and Long Island capacity, offers of capacity located in the Long Island Locality is used to meet NYCA bids.
2017 Annual Installed Capacity Report |December 15, 2017|23
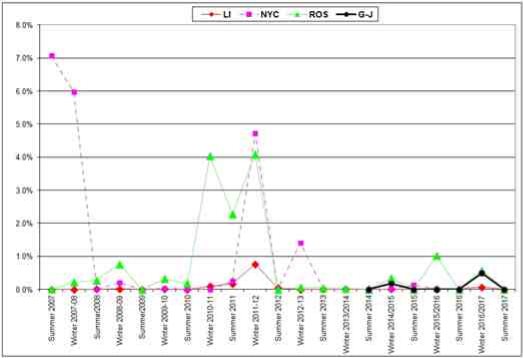
In the NYC Locality, prior to the Summer 2008 Capability Period, the low level of
unoffered capacity was principally due to the offer requirement applicable to the Divested
Generation Owners. Beginning with the Summer 2008 Capability Period, the near absence of
unoffered capacity can be attributed to the Supply-side Mitigation Measures effectuated in 2008.
The G-J Locality became effective beginning in May 2014. Initially, the level of unoffered capacity was at the level of that in ROS, but fell to near zero.
In ROS the unoffered MW for the Winter 2016-2017 and Summer 2017 Capability Periods was consistently below 0.5%.12
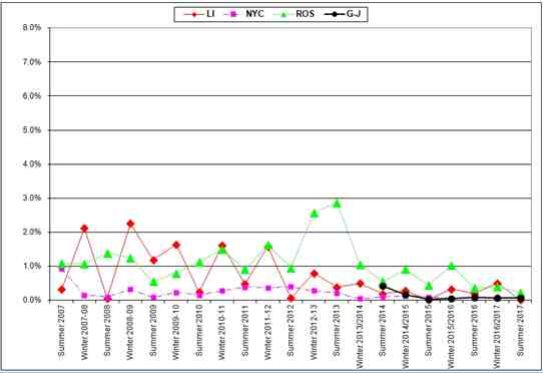
Chart 11 displays unsold capacity as a percent of available UCAP in each of the four capacity areas, which has been below 1% for the past nine Capability Periods.13
Chart 11: Average Percent of Unsold MW
For all Capability Periods beginning with the Summer 2007 Capability Period, nearly all
Long Island offered capacity was sold. In NYC, the average amount of unsold capacity as a
percentage of available capacity trended at near zero levels from the start of the Summer 2008
Capability Period, except for the Winter 2011-2012, and Winter 2012-2013 Capability Periods
when some offered capacity did not clear because it was offered at a price greater than the
UCAP Offer Reference Level. The UCAP Offer Reference Level is the price at which the ICAP
Spot Market Auction would clear if all available capacity was offered and sold. For the Winter
12 As noted in n. 1, the definition of Rest of State prior to the Summer 2014 Capability Period was
Load Zones A though I, and beginning with the Summer 2014 Capability Period is Load Zones A through
F.
13 Section I.5.4.3 of this report provides information and analysis of the unsold capacity in ROS.
2017 Annual Installed Capacity Report |December 15, 2017|24
2016-2017 and Summer 2017 Capability Periods, nearly all of the capacity offered in NYC
auctions was sold. The G-J Locality had less than 0.5% unsold MW in the 2016-2017 Capability Year. The increase in unsold capacity in NYC and the G-J Locality from the prior Capability
Year is due in part to offers from particular resources that cleared in prior years but did not clear in Winter 2016-2017 due to lower Spot Market clearing prices.
The NYCA Minimum Installed Capacity Requirement and LCRs increased for each capacity area since last Capability Year. .
Table 2 summarizes these values for NYC, G-J, LI, and the NYCA over the past eleven
years.
Table 2: Minimum Installed Capacity Requirements (%)14
Capability YearNYCG-JLINYCA
2007/200880-99116.5
2008/200980-94115
2009/201080-97.5116.5
2010/2011 (May)80-102118
2010/2011 (June-April)80-104.5118
2011/201281-101.5115.5
2012/201383-99116
2013/201486-105117
2014/20158588107117
2015/201683.590.5103.5117
2016/201780.590102.5117.5
2017/201881.591.5103.5118
Table 3 displays the breakdown of unsold capacity for each Locality and NYCA. These
unsold MW were not cleared in the NYC, G-J, LI, or NYCA spot auctions. As part of the
NYISO’s August 24, 2010 ICAP compliance filing,15 the NYISO stated that it would include
unoffered and unsold capacity in the NYC Locality in its annual Installed Capacity Demand
Curves reports. Table 3 also displays the unoffered capacity values for MWs that came from
NYC, GHI, LI, and ROS to give a full representation of the data that underlies this report.
Beginning with November 2016, the amount of unoffered MW stayed very low in NYC,
LI, and G-J Locality, totaling 256 MW in the Winter 2016-2017 and 57 MW in the Summer 2017.
14 The New York State Reliability Council issues an annual IRM Study Report, which presents the lowest feasible amount of capacity for the NYCA. Each report includes a comparison of the IRM and LCR values to the previous year along with an explanation of each parameter that contributed to the changes. The NYISO determines the actual LCRs for each Locality taking into consideration changes that have occurred since the Reliability Council approved the IRM Study Report. The 2016 IRM Study Report
covering the period of May 2017 through April 2018 is available at:
˂http://www.nysrc.org/NYSRC_NYCA_ICR_Reports.html˃.
15 See New York Independent System Operator, Inc., Resubmittal of August 24, 2010 Filing, Docket Nos. ER10-2210-000, EL07-39-000, and ER08-695-0004 at p. 16.
2017 Annual Installed Capacity Report |December 15, 2017|25
The total amount of unsold MW in NYC, G-J and LI was 137.6 MW in the Winter 2016-2017, and zero MW in the Summer 2017.
Section I.5.4.2 discusses explanations provided by Market Participants for unoffered MW in ROS in Winter 2016-2017. There was no unsold MW in ROS in the Summer 2017. Section I.5.4.3 presents the Market Participant explanations for and an analysis of unsold MW in ROS in the Winter 2016-2017.
Table 3: Unoffered and Unsold MW
UnofferedUnsold
MonthNYCGHILIROSNYCG-JLINYCA
Nov-1617.32.228.194.340.430.84.20408.80
Dec-165.48.119.182.152.430.84.2251.8
Jan-174.83.519.3150.252.430.88.3221.9
Feb-174.80.126.297.357.330.84.175.9
Mar-173.7464.799.252.430.81.1180.8
Apr-1713.31.430.4177.352.430.83.8224.6
May-174.60.20101.60000
Jun-172.10.50118.30000
Jul-171.10.70.735.20000
Aug-171.21.50930000
Sep-1736.50.3167.80000
Oct-175.30.51.137.50000
I.5.3 New York City and G-J Localities
To administer the Supply-side Mitigation Measures, the NYISO identifies Pivotal
Suppliers by examining the NYC UCAP and G-J Locality UCAP that each ICAP Supplier, along
with its Affiliated Entities, Controls in excess of the pivotal control threshold.16 The UCAP under
the Control of Pivotal Suppliers (“Mitigated UCAP”) must be offered into the ICAP Spot Market
Auction at a price at or below the lesser of the UCAP Offer Reference Level or the ICAP
Supplier’s Going-Forward Costs determined by the NYISO (“GFCs”). Chart 12 and Chart 14
illustrate the effects of the Supply-side Mitigation Measures. The UCAP Offer Reference Level,
as shown in these Charts, becomes the price cap that the Pivotal Supplier must offer at or
below in the ICAP Spot Market Auction, unless the Pivotal Supplier’s GFCs are higher.
The level of unoffered and unsold MW can be inferred from Chart 12 and Chart 14 by
comparing the Locality Spot Market Auction price to the UCAP Offer Reference Level, while
Chart 13 and Chart 15 depict the levels of available generator and SCR UCAP in the Locality.
The difference between the ICAP Spot Market Auction clearing price and UCAP Offer
Reference Level can be attributed to Locality capacity that is either not offered or is offered at a
price above the UCAP Offer Reference Level. Note that the Locality Spot Market Auction price
will diverge from the UCAP Offer Reference Level when the NYCA ICAP Spot Market Auction
16 See Market Services Tariff Sections 23.2.1 and 23.4.5.
2017 Annual Installed Capacity Report |December 15, 2017|26
sets the Locality ICAP Spot Market Auction price.17 This divergence is the result of the auction rules, and is not caused by unoffered or unsold Locality Capacity.
17 In the 2015/2016 Capability Year, the NYCA ICAP price set the Long Island ICAP price in May 2016 and June 2016.
2017 Annual Installed Capacity Report |December 15, 2017|27
Chart 12: NYC Mitigation Results18
$202,000
$181,800
$161,600
$141,400
$121,200
$101,000
$8800
$6600
$4400
$2200
$-0
NYC Spot Auction PriceUCAP Offer Reference LevelPivotal Control Threshold
Chart 13: NYC Generator and SCR UCAP
11,000600
10,500
500
10,000
400
9,500
9,000300
`
8,500
200
8,000
100
7,500
7,0000
NYC Generator UCAPNYC SCR UCAP
18 Per Services Tariff Section 23.2, a “Pivotal Supplier” in NYC needs to control at least 500 MW of Unforced Capacity, and a specified portion of the capacity necessary to meet the NYC LCR in an ICAP Spot Market Auction.
2017 Annual Installed Capacity Report |December 15, 2017|28
Chart 14: G-J Locality Mitigation Results19
$202,000
$181,800
$161,600
$141,400
$121,200
$101,000
$8800
$6600
$4400
$2200
$-0
G-J Locality Spot Auction PriceUCAP Offer Reference LevelPivotal Control Threshold
Chart 15: G-J Locality Generator and SCR UCAP
16,000600
15,000
500
14,000
13,000400
12,000
300
`
11,000
10,000200
9,000
100
8,000
7,0000
G-J Locality Generator UCAPG-J Locality SCR UCAP
19 Per Services Tariff Section 23.2, a “Pivotal Supplier” in the G-J Locality needs to control at least 650 MW of Unforced Capacity, and a specified portion of the capacity necessary to meet the G-J Locality LCR in an ICAP Spot Market Auction.
2017 Annual Installed Capacity Report |December 15, 2017|29
I.5.4 Rest of State
I.5.4.1 Overview
This section of the report addresses possible withholding of Capacity located in the Rest of State20 from November 2016 through October 2017. For this review, the NYISO conducted a detailed analysis of unoffered and unsold capacity. This section of the report pertains primarily to the NYCA but also contains some explanations for unoffered capacity in NYC, the G-J
Locality, and Long Island.
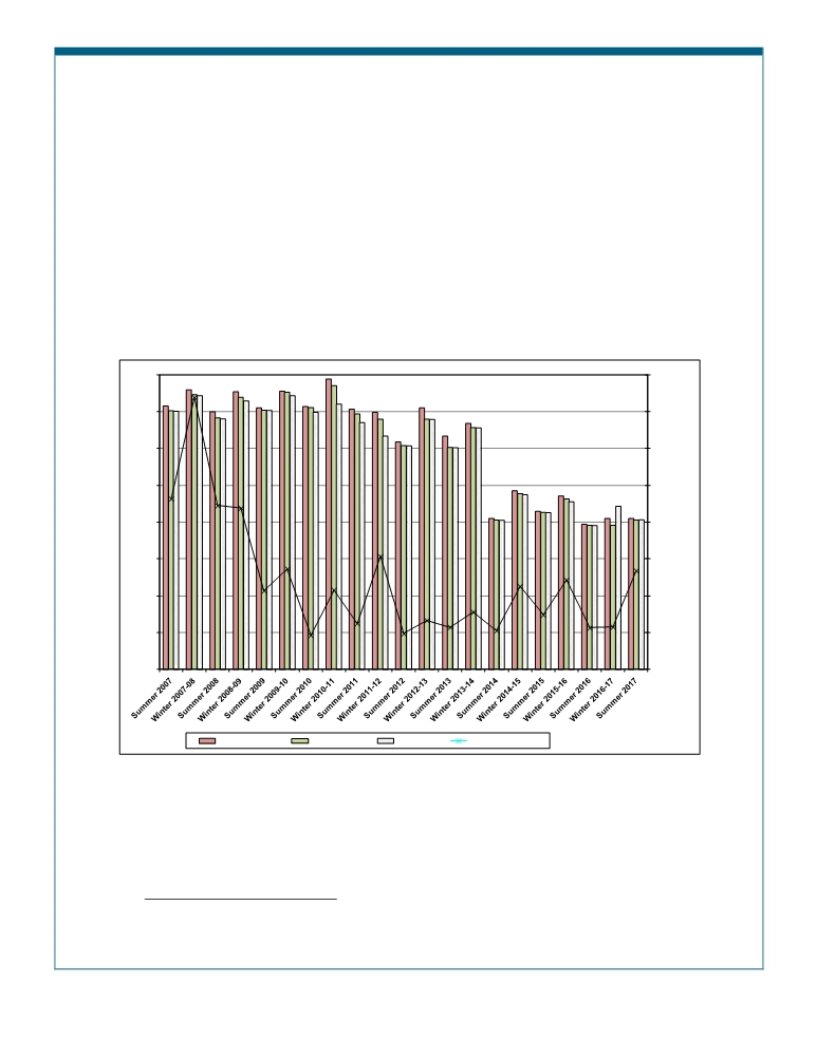
Chart 16 shows the monthly average values over each Capability Period for four ROS capacity types: available, offered, sold, and exported MW.
Chart 16: Rest of State Capacity Available, Offered, Sold and Exported
25
1,258
23
21
19845
817
17
15
13
11
9
807
610
560
473
471
338
289
1,350
Starting with Summer 2014, ROS
is comprised of Load Zone s A-F
1,200
1,050
900
750
600
552
489514
450
350384372320
322323
308300
296
150
ROS AvailableROS OfferedROS SoldCapacity Exports
Examination of Rest of State capacity data pertaining to individual Market Participants revealed general patterns in unsold and unoffered capacity. The patterns suggest a three-way classification of suppliers by market sector: all generation-owning transmission owners, ROS generation owners, and other suppliers (a category which includes SCRs.) Table 4 of this
December 2017 Report summarizes the monthly averages of unoffered and unsold capacity for each Capability Period since the Summer 2008.
20 Prior to the Summer 2014 Capability Period, ROS consisted of transmission zones A through I; starting May 2014, ROS is defined as transmission zones A through F.
2017 Annual Installed Capacity Report |December 15, 2017|30
Table 4: ROS Unoffered and Unsold Capacity MW by Type of Market
Participant
ROS Monthly Average Unoffered Capacity MW by Type of Market Participant
GenCo% of GenCoOthers% OtherTO% TOCapability Period Monthly Average
Summer 2008114.232.74%30.328.69%204.3758.57%348.9
Summer 200949.241.06%1.421.18%69.2557.76%119.9
Summer 201098.137.13%7.872.98%158.2259.90%264.2
Summer 201154.125.80%76.7036.56%78.9737.64%209.8
Summer 201260.129.48%75.3236.96%68.4033.56%203.8
Summer 2013486.678.28%64.2010.33%70.7711.39%621.5
Summer 201458.962.03%24.2325.52%11.8212.45%95.0
Summer 201521.326.97%30.7338.98%26.8534.05%78.9
Summer 20166.610.81%15.525.42%38.863.77%60.9
Summer 201745.259.75%18.424.39%12.015.85%75.6
ROS Monthly Average Unoffered Capacity MW by Type of Market Participant
GenCo% of GenCoOthers% OtherTO% TOCapability Period Monthly Average
Winter 2008-2009236.878.54%0.60.19%64.121.27%301.5
Winter 2009-201093.348.14%9.54.88%91.046.98%193.7
Winter 2010-2011212.657.39%30.48.19%127.534.41%370.4
Winter 2011-2012138.536.98%93.725.00%142.438.02%374.6
Winter 2012-2013437.373.43%21.03.52%137.323.05%595.5
Winter 2013-2014118.250.12%54.122.94%63.626.94%235.9
Winter 2014-201570.641.63%47.027.72%52.030.65%169.6
Winter 2015-201682.557.83%9.26.41%51.035.76%142.7
Winter 2016-201738.232.70%32.527.86%46.139.45%116.7
ROS Monthly Average Unsold Capacity MW by Type of Market Participant
GenCo% of GenCoOthers% OtherTO% TOCapability Period Monthly Average
Summer 200861.699.49%0.30.51%00%61.9
Summer 200900%00%00%0
Summer 201015.435.56%27.864.44%00%43.2
Summer 2011479.991.01%44.98.52%2.50.47%527.3
Summer 201200%00%00%0
Summer 201311.6100%00%00%11.6
Summer 201400%00%00%0
Summer 201500%00%00%0
Summer 201600%00%00%0
Summer 201700%00%00%0
ROS Monthly Average Unsold Capacity MW by Type of Market Participant
GenCo% of GenCoOthers% OtherTO% TOCapability Period Monthly Average
Winter 2008-2009178.797.65%4.32.35%00%183.0
Winter 2009-201073.495.30%3.64.70%00%77.0
Winter 2010-2011895.689.53%104.710.47%00%1000.3
Winter 2011-2012811.386.49%88.49.43%38.44.09%938.0
Winter 2012-20138.360.98%5.339.02%00%13.7
Winter 2013-201400%7.0100%00%7.0
Winter 2014-20155.07.79%59.092.21%00%64.0
Winter 2015-2016127.567.86%17.69.38%42.823%187.9
Winter 2016-2017172.188.39%22.611.61%0.00.00%194.7
2017 Annual Installed Capacity Report |December 15, 2017|31
Salient facts from the above tables are:
The group of all ROS generation-owning Transmission Owners consistently had
unoffered capacity which ranged from 11% to 65% of total unoffered capacity.
The group of all ROS generation-owning Transmission Owners had up to 23% of offered
and unsold capacity.
The group of generation owners consistently had unoffered capacity which ranged from
25% to 79% of total unoffered capacity.
The group of generation owners had unsold capacity which accounted for 0% to 100% of
total capacity that was offered and unsold capacity.
The group of all others including SCRs consistently had unoffered capacity that ranged
from 0% to 39% of total unoffered capacity.
The group of all others including SCRs had capacity that was offered and unsold
capacity that ranged from 0% to 100%.
I.5.4.2 Analysis of ROS Unoffered Capacity
This section provides a detailed analysis of the unoffered capacity located in the ROS.
The section also presents the maximum price impact of the unoffered capacity, in each month
and averaged over the six months of each Capability Period. Market Participants with a
significant amount of unoffered capacity were provided an opportunity to justify their unoffered
MW. Generally, responses suggest that the Installed Capacity Suppliers’ reasons for not
offering the Capacity were benign, and none of the instances evidenced behavior intended to
artificially raise prices.
Instances of unoffered capacity in Mitigated Capacity Zones are potentially subject to a non-discretionary penalty assessment (Services Tariff Section 23.4.5.4.2), and are not included in this section.
The NYISO contacted each Installed Capacity Supplier with at least 15 MW of unoffered
capacity in any one month during the period November 2016 through October 2017 for an
explanation of why it did not offer all of its capacity. There were eleven Market Participants with
15 MW or more of unoffered capacity in any given month in ROS, and the NYISO sought and received explanations from each of them.21
Eight Market Participants reported that their failure to offer capacity into the ICAP market
was due to an administrative oversight. Six of the instances failed to offer in just one month
over the two capability periods. One instance failed to offer in two consecutive months and the
remaining instance had several months in which they failed to offer. Out of the eight Market
Participants that had reported that the failure to offer was due to an administrative oversight
reason, five indicated that new procedures would be put in place to avoid failing to offer capacity
in the future. One of the eight also indicated its offering pattern as part of its explanation.
Three Market Participants reported environmental and/or physical conditions as cause for not offering capacity. These responses detailed causes including conservative operating strategies, SCR aggregation changes, and planned maintenance.
21 Confidential Attachment I provides a detailed summary of the Market Participants’ explanations for having unoffered capacity.
2017 Annual Installed Capacity Report |December 15, 2017|32
Table 5 shows the maximum price impact of the unoffered capacity (15 MW or higher
per incident) based on the slopes of the ICAP Demand Curves for the relevant Capability
Periods. The maximum price impact is calculated as the lesser of (1) the product of the monthly
unsold MW and the slope of the ICAP Demand Curve and (2) the ICAP Spot Market Auction
Market-Clearing Price, since the price impact cannot exceed the auction price. Monthly values
and seasonal averages of the maximum price impact are reported. The maximum price impact
of the unoffered capacity, averaged over the six months of the Winter 2016-2017 and Summer
2017 Capability Periods, was $0.17/kW-month (ranging from $0.06/kW-month to $0.25/kW-
month) and $0.08/kW-month (ranging from $0.00/kW-month to $0.21/kW-month), respectively.
Table 5: Maximum Price Impact of ROS Unoffered Capacity (15MW+)22
Total
MonthUnoffered
MW
MonthlySeasonal
MaximumAverage
PriceMaximum
Impact Price Impact
Nov-1643.7$0.10
Dec-1625.0$0.06
Jan-17110.9$0.25
Feb-1766.2$0.15
Mar-1768.2$0.16
Apr-17142.6$0.33
May-1784.2$0.20
Jun-1788.0$0.21
Jul-170.0$0.00
Aug-1721.2$0.05
Sep-170.0$0.00
Oct-17 0.0 $0.00
$0.17
$0.08
I.5.4.3 Analysis of ROS Unsold Capacity
This section analyzes and reports on ROS unsold capacity in the ICAP Spot Market Auction. It also presents the maximum price impact of the ROS unsold capacity, in any one month and the price impact average for the six months of the Capability Period. Attachment II summarizes masked unsold capacity offers.23
For each Installed Capacity Supplier that had 15 MW or more of unsold capacity in a
given month, the NYSIO (a) requested and received its explanation of its behavior; and (b)
performed a unit-specific GFC analysis if the aggregated monthly average price impact over the
capability period was greater than or equal to $0.20/kW-month, or $0.35/kW-month in any
month.
The process utilized by the NYISO in performing this analysis only requires the
development of a unit-specific GFC if the generator had an ICAP Spot Market Auction offer that
22 The price impact of all ROS unoffered capacity average $0.25/kW-month for the Winter 2016-
2017 (ranging from $0.19/kW-month to $0.35/kW-month), and $0.18/kW-month for the Summer 2017 (ranging from $0.08/kW-month to $0.28/kW-month). The monthly price impact cannot exceed the ICAP Spot Market Auction clearing price for that month.
23 Attachment II is a redacted version of the unsold capacity offers
2017 Annual Installed Capacity Report |December 15, 2017|33
was greater than the generator’s class average Net GFC with half net revenues.24 In order to comply with the requirement in the Analysis Plan while making the analysis more useful to the Commission and stakeholders, this report is using unit-specific GFCs. The unit-specific GFC data utilized represents an increase in accuracy when compared to class average Net GFCs, and is used in place of the class average NET GFC with half net revenue step.
I.5.4.4 Monthly Price Impacts
includes the average monthly maximum price impact of unsold capacity for each
Capability Period. The average price impacts were $0.33/kW-month in Winter 2016-2017 and
$0.00/kW-month in the Summer 2017. The Capability Period impact threshold of $0.20/kW-
month was exceeded for Winter 2016-2017. Additionally, monthly maximum price impact
exceeds the $0.35/kW-month threshold for months of November 2016, December 2016, and
April 2017.
Table 6: Maximum Price Impact of ROS Unsold MW
Month
Total Unsold
MW
Monthly Maximum
Price
Impact
Seasonal
Average
Maximum
Price Impact
Jan-17188.2
Feb-1744.3
$0.32
$0.10
$0.33
Jul-170.0
Aug-170.0
$0.00
$0.00
$0.00
Oct-170.0$0.00
In addition to calculating the monthly maximum and average maximum price impacts,
price impacts of unsold capacity offered at varying levels of Going Forward Costs (“GFCs”), as
described in
Table 7, were estimated. For the purpose of this report, the GFCs are defined as costs
that could be reasonably expected to be avoided if the plant was mothballed for at least one
year less projected net revenues from energy and ancillary services markets. These GFCs may
24 Going Forward Cost terminology and elements for purposes of ROS unsold capacity analysis were discussed in detail at Table 7 in the 2012 Annual Installed Capacity Report. See 2012 Annual
Report at Table 7, filed in FERC Docket Nos. ER01-3001-000, E03-647-000 (Feb. 14, 2013) (see also, New York Indep. Sys. Operator, Inc. Docket Nos. ER01-3001-000, E03-647-000, “Updated Status Report on Stakeholder Discussions Regarding Annual Installed Capacity Demand Curve Reports and Plan for Further Reports at Attachment A (Nov 12, 2009) (“Analysis Plan”).
2017 Annual Installed Capacity Report |December 15, 2017|34
provide insight into why a generator offered its capacity at a non-zero offer price. In this analysis, GFCs are calculated for the entire capacity of the plant.
Generators face uncertainty about net revenues, among other things, which may
influence the prices at which they offer capacity. To account for this uncertainty, the calculated GFCs including varying levels of net revenues: full, half, and no net revenues. Confidential Attachment IV to this report shows the specific generator’s costs and/or SCR’s heuristic
methods for ICAP Suppliers with at least 15 MW of unsold capacity in any one month during November 2016 - April 2017 time period less the varying levels of net revenues.
Table 7 describes and defines the GFCs.
Table 7: Going Forward Cost Definitions
Avoidable Costs (ACs)
Net energy and ancillary services revenues (net revenues)
GFCs with full net revenues
GFCs with half net revenues
GFCs with no net revenues
Costs that would be avoided or deferred if a generator was mothballed for a year or more, based on the calculation of the industry average cost data for the type of generator.
Estimated energy plus ancillary services revenues minus
estimated production costs, with a minimum value of zero.
ACs minus net revenues. This value is used to represent Net GFCs with certainty of net revenues.
ACs minus 0.5 times net revenues. This value is used to represent Net GFCs with some uncertainty.
ACs. This value is used to represent Net GFCs without certainty of net revenues.
The Winter 2016-2017 ICAP Strip Auction Price in ROS is $0.75/kW-month, while the ICAP Monthly Auction Price for the upcoming auction month varied between $0.20/kW-month and $0.85/kW-month for Winter 2016-2017 Capability Period. Table 8 below shows the amount of unsold capacity by month for which calculated GFCs with full net revenue were exceeding the ICAP Monthly Auction Price for the upcoming auction month.
Table 8: ROS Unsold MW with reported GFCs costs above ICAP
Monthly Auction Prices (15MW+)
Month
Total Unsold
MW (15+)
Total Unsold with GFCs
ICAP Monthly Auction Priceabove ICAP Monthly
Auction Price (15MW+)
Apr-17189.3$0.25189.3
There are three generators associated with unsold capacity and two SCR resources. Attachment IV contains the confidential information provided by the Market Participants in
response to the NYISO’s request for information regarding their bidding strategy and cost data for the months in which there was unsold capacity.
All Market Participants responded to the NYISO’s information request with the following information regarding their behavior for months in which they had unsold capacity.
2017 Annual Installed Capacity Report |December 15, 2017|35
• Three generators submitted avoidable cost estimates in support of a calculated
GFC value.
• Two SCRs submitted heuristic strategies in support of a GFC value, citing
approximate shutdown costs or administrative and operational costs.
The NYISO performed ICAP Spot Market Auction simulations for a more detailed
understanding of how the non-zero price offers may have affected Market Clearing Prices. The NYISO simulated auction outcomes under three scenarios: GFCs with full net revenues, GFCs with half net revenues and GFCs with no net revenues. These scenarios are labeled scenarios 1, 2, and 3 in Table 9. The NYISO performed the simulations by replacing offers that originally did not clear with the unit-specific GFC at varying levels of net revenues. It is important to note that offers were only replaced with the GFCs value if the offers were not awarded any MW. If
the offer was marginal and only cleared a portion of its MW, or if the offer was inframarginal, the specific offers at the original offer prices were used. The offers that were analyzed for purposes of the simulations are provided in Attachment II.25
Table 9 shows the results of the auction simulations in each of the scenarios, for each
month of the analysis period (Winter 2016/2017). For comparison, the original ROS ICAP Spot
Market Auction prices are reported, in addition to the simulated ROS ICAP Spot Auction Prices
under each of the scenarios. The simulation price deltas relative to the original clearing prices
should not be positive because only entire offers that did not clear and which were originally
priced above the ICAP Monthly Auction clearing price were replaced with GFCs. The amount of
the price reduction shown in the simulations is static or decreasing as half or no revenues are
recognized in the GFC calculations. That outcome is consistent with what would be expected.
Table 9: ROS ICAP Spot Auction Price Impact Analysis Results
MonthROS Spot PricesS1[1]S2[2]S3[3]S1 deltaS2 deltaS3 delta
Nov-16$0.35$0.35$0.35$0.35$0.00$0.00$0.00
Dec-16$0.55$0.55$0.55$0.55$0.00$0.00$0.00
Jan-17$0.32$0.32$0.32$0.32$0.00$0.00$0.00
Feb-17$0.54$0.54$0.54$0.54$0.00$0.00$0.00
Mar-17$0.71$0.71$0.71$0.71$0.00$0.00$0.00
Apr-17$0.35$0.35$0.35$0.35$0.00$0.00$0.00
Notes to Table 9:
Note 1: GFCs with full net revenues
Note 2: GFCs with half net revenues
Note 3: GFCs with no net revenues
The results of the simulations shown in Table 9 indicate that the NYCA ICAP Spot
Market Auction prices likely would not have been lower if the entire offers did not clear were
offered at their respective GFC values. In all three scenarios, there would be no price impact.
As noted earlier, the simulations were performed by replacing only entire offers that did not clear
25 The unmasked unsold capacity offers are provided in Confidential Attachment III.
2017 Annual Installed Capacity Report |December 15, 2017|36
with their respective GFCs. The associated potential zero price impacts do not indicate that economic withholding occurred.
The analysis shows that no economic withholding occurred over the Winter 2016-2017.
During this period, the ICAP Spot Market Auction Market-Clearing Price for the NYCA was
below the Capability Period Market-Clearing Price and both above and below the Monthly
Auction clearing prices for the NYCA. The Capability Period and Monthly Auctions reflect market
place expectations for upcoming Spot Auction Market-Clearing Prices. In addition the Winter
2016-2017 ICAP Spot Market Auction Market-Clearing Price for the NYCA was below the
estimated Going Forward Costs for all of the ROS generators with unsold capacity.
2017 Annual Installed Capacity Report |December 15, 2017|37
II. NYISO Report on New Generation Projects
In its October 23, 2006 order, the Commission ordered the NYISO to submit “a list of
investments in new generation projects in New York (including a description and current status of each such project), regardless of the stage of project development at the time of the filing.”26 The NYISO keeps a list of Interconnection Requests and Transmission Projects for the New
York Control Area that includes information about all generation projects in the State that have requested interconnection.
The NYISO interconnection process for generators and Merchant Transmission Facilities
is described in two attachments of the NYISO OATT: OATT Attachment X entitled, “Standard
Large Facility Interconnection Procedures,” and OATT Attachment Z entitled, “Small Generator
Interconnection Procedures.” OATT Attachment X applies to Generating Facilities that exceed
20 MW in size and to Merchant Transmission Facilities, collectively referred to as “Large
Facilities.” OATT Attachment Z applies to Generating Facilities no larger than 20 MW.
Under OATT Attachment X, Developers of Large Facilities must submit an
Interconnection Request to the NYISO. The NYISO assigns a Queue Position to all valid
Interconnection Requests. Under OATT Attachment X, proposed generation and Merchant Transmission Facility projects undergo up to three studies: the Feasibility Study, the System Reliability Impact Study, and the Class Year Interconnection Facilities Study. The Class Year Interconnection Facilities Study is performed on a Class Year basis for a group of eligible projects pursuant to the requirements of OATT Attachment S. Under OATT Attachment Z, proposed small generators undergo a process that is similar, but with different paths and
options that are dependent on the specific circumstances of the project.
Proposed generation and transmission projects currently in the NYISO interconnection process are listed on the list of Interconnection Requests and Transmission Projects for the New York Control Area (“NYISO Interconnection Queue”). The generation projects on that list are shown in Attachment IV to this report, which is dated November 30, 2017. The NYISO updates the NYISO Interconnection Queue on at least a monthly basis and posts the most recent list on the NYISO’s public web site27 at the “Planning Documents and Resources”,
underneath the “Interconnection Studies” section.
The status of each project on the NYISO Interconnection Queue is shown in the column
labeled “S.” An explanation of this column is provided in Attachment V to this report. Also, note
that the proposed In-Service Date for each project is the date provided to the NYISO by the
respective Owner/Developer, is updated only on a periodic basis, and is subject to change.
26 See New York Independent System Operator Inc., 117 FERC ¶ 61,086, at P 14 (2006).
27 See <http://www.nyiso.com/public/markets_operations/services/planning/documents/index.jsp>.
2017 Annual Installed Capacity Report |December 15, 2017|38
III. New Generation Projects and Net Revenue Analysis III.1 Overview
The ICAP Demand Curves are designed to send efficient price signals to developers to build new generation and to generation owners to invest in existing generation when and where it is needed. In past ICAP annual reports, the NYISO stated that it is difficult to relate the
investment in new generation to the ICAP Demand Curves given the lead-time required to site, develop, and construct new generation, and to address other barriers to new entry; however,
the ICAP Demand Curves provide transparency for projecting Spot Market capacity price
signals that developers and owners consider prior to making investment decisions. Further,
since the creation of the new G-J Locality (encompassing Load Zones G, H, I and J) and the
implementation of the ICAP Demand Curves for it, there has been investment in resources in
Load Zones G, H, I, and J. This section of the report provides net revenue analysis on a
comparable basis to that used in the prior reports.
III.2 Market Design Developments to Enhance ICAP Demand Curve Performance
On January 17, 2017, FERC accepted the tariff revisions that establish the ICAP
Demand Curves for the 2017-2018 Capability Year.28 The January 2017 Order accepted the NYISO’s proposal to use the dual-fuel F-class frame combustion turbine (Siemens SGT6-
5000(F)) with selective catalytic reduction emission controls (“selective catalytic reduction”) to develop the ICAP Demand Curves for NYC, LI, and the G-J Locality for purposes establishing the ICAP Demand Curves effective through April 2021. A gas-only Siemens SGT6-5000(F) frame combustion turbine with an operational limit in lieu of selective catalytic reduction was selected as the representative peaking plant for the NYCA ICAP Demand Curve. The current ICAP Demand Curves are sending appropriate price signals.
III.3 Interconnection Queue Projects
The NYISO’s interconnection queue lists the projects that are being and will be
evaluated in the interconnection study processes. In-service dates stated on the
interconnection queue for projects are provided by the developers, and the NYISO periodically updates the queue (Attachment V). Chart 177 was compiled using data from Attachment V.
Chart 17 depicts the amount of generation listed on the NYISO’s interconnection queue since
2003 in NYC, LI, and Rest of State (“ROS”), and starting with Summer 2014 Capability Period it includes the G-J Locality. Wind projects are depicted separately from generation projects with other fuel types. The ROS depiction in Chart 177 does account for the change in its composition starting in Summer 2014 Capability Period with the creation of the G-J Locality (“G-J”). From
2003 through April 2014, ROS was comprised of Load Zones A through I. Since May 2014, it
has been comprised of Load Zones A through F.
28 As discussed in [Section I[ ] above, the NYISO’s tariff now has a quadrennial ICAP Demand Curve reset, with annual updates in the intervening years.
2017 Annual Installed Capacity Report |December 15, 2017|39
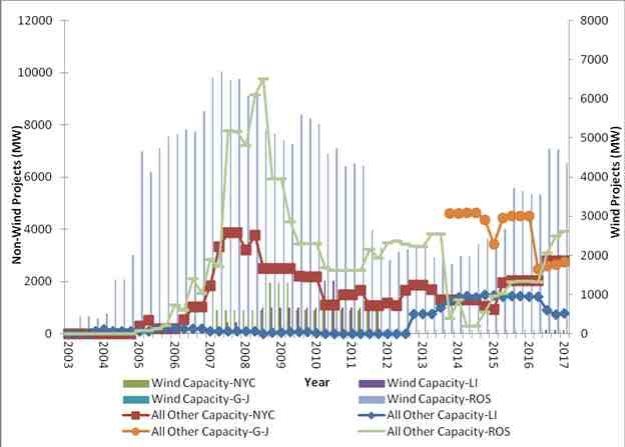
Chart 17: NYISO Interconnection Queue Projects
Chart 177 reports only those projects that were placed in the queue after May 1, 2003.29 Since the queue includes projects at various stages, for purposes of the analysis for this section of the report, the NYISO included those projects that are identified as active. Accordingly, pre2005 period projects with codes ‘I’, ‘W’, or ‘C’ were excluded; and for 2005 and beyond projects, status codes 0, 1, 12, 13, and 14 were omitted.
The number of generation projects and the amount of MW in the interconnection process
has increased since the ICAP Demand Curves became effective in May 2003. The number of
MW associated with projects based on technologies other than wind (measured on the left Y-
axis, above) did not increase significantly until the summer of 2005. Chart 177 shows that
29 Each project in the queue is provided a status code that identifies its position in the study process that
ranges from the initial scoping meeting to entering service. Prior to 2005, each project was provided a status-code
based on the NYISO System Reliability Impact Study from the following: P=Pending, A=Active, I=Inactive, R=Under
Review, C=Completed, W=Withdrawn. Starting in 2005, the classification system was changed and status-codes
were based on the standard steps in the NYISO’s interconnection process as follows: 1=Scoping Meeting Pending,
2=FES Pending, 3=FES in Progress, 4=SRIS Pending, 5=SRIS in Progress, 6=SRIS Approved, 7=FS Pending,
8=Rejected Cost Allocation/Next FS Pending, 9=FS in Progress, 10=Accepted Cost Allocation/IA in Progress, 11=IA Completed, 12=Under Construction, 13=In Service for Test, 14=In Service Commercial, 0=Withdrawn, where
FES=Feasibility Study, SRIS=System Reliability Impact Study, FS=Facilities Study.
2017 Annual Installed Capacity Report |December 15, 2017|40
beginning with the Winter 2007-2008 Capability Period, the number of MW listed in the
interconnection queue for the Rest of State rose sharply, particularly new non-wind projects. By
the end of 2011, this trend had largely reversed to pre-Winter 2007-2008 Capability Period
levels. The sharp decrease in proposed new non-wind generation in ROS shown in Chart 177
beginning with the Summer 2014 Capability Period is indicative of Load Zones G, H, I no longer
being part of ROS. Non-wind generation projects have increased in both ROS and all localities
since 2015. Wind generation projects have increased in ROS since 2015, and one wind project
was proposed in LI in 2017. No wind projects have been proposed in NYC or the G-J Locality in
2015, 2016, or to-date in 2017.
In addition to the proposed projects reflected in Chart 177, there are proposed HVDC
transmission lines. Two of the projects are from External Control Areas, one project with a
terminus in NYC, and the other project with a terminus in LI. A third project is proposed to be a
connection between Load Zone F (in the ROS) and Load Zone H (in the G-J Locality). If these
projects receive CRIS and Unforced Capacity Deliverability Rights (“UDRs”), the UCAP
associated with the UDRs can be used to satisfy the applicable LCR in which the facility has a
terminus.
III.4 Proposed Resource Additions
On October 18, 2016, the NYISO Board of Directors approved the 2016 Reliability
Needs Assessment Report (RNA).30 This report assessed resource adequacy, transmission security and transmission adequacy of the New York Control Area (NYCA) bulk power
transmission system for calendar years 2017 through 2026. In April of 2017, the NYISO issued the 2016 Comprehensive Reliability Plan (CRP), which reflected a reliable system.31
As mentioned above, the G-J Locality and its ICAP Demand Curve are providing market price signals for resources to locate new units and invest in existing units, including returning capacity to service in this area. For example, CPV Valley and Taylor Biomass are new
generation that is being built in Load Zone G, and Bowline 2 received additional CRIS MW in order to restore its full capacity. Other indications that the Demand Curve price signals are
working include units in the NYCA returning to service. These resource additions are included among the capacity resource changes summarized in Table 10.
30 The 2016 RNA report is available at:
<http://www.nyiso.com/public/webdocs/markets_operations/services/planning/Planning_Studies/Reliability_Planning_
Studies/Reliability_Assessment_Documents/2016RNA_Final_Oct18_2016.pdf>
31 The 2016 CRP report is available at:
<http://www.nyiso.com/public/webdocs/markets_operations/services/planning/Planning_Studies/Reliability_Planning_
Studies/Reliability_Assessment_Documents/2016CRP_Report_Final_Apr11_2017.pdf >.
2017 Annual Installed Capacity Report |December 15, 2017|41
Table 10: Capacity Resource Changes
since the publication of the 2017 NYISO Gold Book32
K139In Service
Table 11 presents the market-based solution projects and Transmission Owners’ plans that were submitted in response to previous requests for solutions pursuant to the NYISO’s reliability planning process. These solutions were included in the 2012 Comprehensive
Reliability Plan. A number of other projects that are in the NYISO Interconnection Queue
continue to move through the interconnection process.
32 Based on information as of 11/30/17 contained in “Generator Status Updates” and “Planned Generation Retirements” documents available at:
<http://www.nyiso.com/public/markets_operations/services/planning/documents/index.jsp>
2017 Annual Installed Capacity Report |December 15, 2017|42
Table 11: Current Status of Tracked Market-Based Solutions and
Transmission Owner Plans
Included
Queue #
ProjectSubmitted
Zone
Original
I/S Date
Name
Plate
(MW)
CRISSummerProposal
(MW) (MW) Type
in the
Current2016
StatusRNA
Base
Case
339
Station 255CRP 2012
B-N/A
N/AN/ATO Plan
Q4 2019-
2020 Yes
N/A
N/A
N/A
N/A
Clay-Teall #10
115kV
NYSEG/RGE’s
terminal
upgrades,
increasing the
ratings on
Stolle Road-
Gardenville 230
kV Line #66,
addressing a
preliminary
Reliability Need
identified in
preliminary
("1st pass")
2016 RNA
NYSEG/RGE’s
terminal
upgrades,
increasing the
ratings on both
Clay-Pannell
PC1 and PC2
345 kV lines,
addressing a
preliminary
Reliability Need
identified in
preliminary
("1st pass")
2016 RNA
Oakdale
345/115 kV 3rd
transformer
and substation
reconfiguration,
addressing the
Oakdale
345/115 kV
Reliability Need
identified in
final 2016 RNA
CRP 2012
RNA 2016
RNA 2016
CRP 2016
CRP 2014
C2016N/A
A2019N/A
C2019N/A
C2015N/A
N/AN/ATO Plan
N/AN/ATO Plan
N/AN/ATO Plan
N/AN/ATO Plan
Q4 2017Yes
I/SYes
2019Yes
2021No
2017 Annual Installed Capacity Report |December 15, 2017|43
III.5 Net Revenue Analysis
FERC’s order directing the NYISO to submit an ICAP annual report stated that the
NYISO should include a complete net revenue analysis to provide information about whether
NYISO market revenues are adequate to incent new capacity resources in regions where
capacity is needed. Where there is growing pressure on existing capacity, e.g., the reserve
margin is shrinking; there should be a rise in combined revenues from the Energy and Capacity
markets.
As in the prior annual reports, the NYISO examined the level of “need” for additional
capacity by looking at the percentage of capacity in excess of the applicable minimum Installed
Capacity requirement. The NYISO then looked at possible revenues from the Capacity, Energy,
and Ancillary Services markets for a hypothetical gas turbine which is similar to what was used
to complete the net revenue analysis in the prior reports. This analysis shows, in general, that
there is a tendency for revenues to increase as the percentage of excess capacity decreases
and vice versa.
III.5.1 Quantification of “Need”
For purposes of this analysis, the excess of capacity relative to the applicable minimum requirement was used as a proxy for need. Capacity margin is calculated as:
Capacity margin % = ۯܞ܉ܑܔ܉܊ܑܔܑܜܡ
܀܍ܙܝܑܚ܍ܕ܍ܖܜ
x 100
Using this definition, a value in excess of 100% reflects an excess capacity margin. A
relatively high value indicates less of a need for additional capacity and, conversely, declining
values suggest an increased need.33 Table 12 displays the required and available amounts of
UCAP as calculated from detailed data from monthly certified capacity, auction offers, and sales
awards.
33 The use of “need” in this context is based on the revenue analysis and is not intended to infer whether there may be a system-specific need.
2017 Annual Installed Capacity Report |December 15, 2017|44
Table 12: Summer Available Capacity vs. Required Capacity
201220132014201520162017
NYCARequirement (MW)35,07635,46735,81235,92035,43035,513
Availability (MW)37,88136,17736,08137,34036,35036,749
Capacity margin %108.0%102.0%100.7%104.0%102.6%103.5%
NYCRequirement (MW)8,8979,3259,4719,2728,5899,095
Availability (MW)9,6969,7219,5689,6809,2519,888
Capacity margin %109.0%104.2%101.0%104.4%107.7%108.7%
LIRequirement (MW)4,9615,3945,4315,2845,2075,303
Availability (MW)5,8585,7405,6755,6185,6795,785
Capacity margin %118.1%106.4%104.5%106.3%109.1%109.1%
G-JRequirement (MW)n/an/a13,49513,93413,51513,622
Availability (MW)n/an/a13,61014,58114,18214,407
Capacity margin %n/an/a100.9%104.6%104.9%105.8%
In Table 12, the NYCA Minimum Unforced Capacity Requirement is based on the annual
NYCA Minimum Installed Capacity Requirement. For each of the NYC, LI, and the G-J Locality,
the respective Locational Minimum Unforced Capacity Requirement is derived from their
respective Locational Minimum Installed Capacity Requirement. “Available Capacity” reflects the
aggregate of UCAP ratings excluding the amount of imported capacity via external
transactions.34
Since November 2014, the ICAP Demand Curves were established based on a different
peaking plant than that used to establish prior curves. For the 2016 data in Table 12, the
NYISO assumed a revenue requirement based on the same plant used for the analysis in the
2013 annual report; i.e., the respective peaking plant used to establish the ICAP Demand
Curves for the 2013-2014 Capability Year. This representation provides a direct comparison of
the revenues and revenue margins for the twelve months of market outcomes prior to 2014-
2015 Capability Year to those in previous annual reports. For the 2014 G-J Locality revenue
analysis, the NYISO used cost assumptions for the LMS100 used in the NYCA region and
adjusted the costs based upon information developed by the ICAP Demand Curve reset
independent consultant in 2014.
Table 13 shows the annual revenue requirement for the hypothetical plants based on the
assumptions used in the previous ICAP Demand Curves and the 2017 ICAP Demand Curves.
For the G-J Locality the annual revenue requirements for 2014 have been adjusted for six
months only — the 2014 Summer Capability Period — the period that corresponds with the
initial implementation for the ICAP Demand Curves for the G-J Locality. The notional values
used for the New York City, LI, and G-J Localities are based on an LMS100 technology, and for
NYCA, figures are based on GE 7FA combustion turbine without selective catalytic reduction for
the years 2011 to 2014. For 2015 and 2016 figures, a dual-fuel Siemens F class Frame unit with
selective catalytic reduction was used as the peaking plant for the G-J, J, and LI Localities. A
34 In contrast to the forecasted figures used in the Gold Book, this table reflects data based on realized outcomes over the Summer Capability Periods.
2017 Annual Installed Capacity Report |December 15, 2017|45
gas-only Siemens F class Frame unit without selective catalytic reduction was used for the NYCA. For 2017, the same technology from 2016 was used assuming the 2017-2018 ICAP Demand Curve parameters.
Table 13: Annual Revenue Requirements in UCAP terms ($/MW)
201220132014201520162017
NYCA$122,650$124,094$126,111$113,738$117,709$117,970
NYC$282,388$284,578$288,371$217,390$231,098$228,487
LI$263,070$262,912$263,455$176,031$179,684$179,236
NCZ$116,966$154,522$162,388$161,911
Note to Table 13: As with prior annual reports, this table is based on November of the year prior to the year stated in the first row, through October of the year stated, except that the Annual Revenue Requirements for the G-J Locality for 2014 are based on the six month revenue requirement calculated beginning with the Summer 2014 Capability Period when the G-J Locality and its ICAP Demand Curve were first implemented.
Table 14 shows the revenues for individual markets (i.e., the Energy, Ancillary Services (A/S)), and the ICAP Spot Market Auction that the identified hypothetical peaking plant may have received based on actual LBMPs, natural gas prices, and other reasonable parameters used to calculate variable costs from the corresponding Demand Curve reports.
For previous reports, a model was used to calculate the Energy and Ancillary Services
revenue for the respective hypothetical peaking plants. Net Energy revenues are earned in
hours when the Day-Ahead Market LBMP exceeds the calculated variable cost. Otherwise, Day-
Ahead Ancillary Services revenues are earned. This approach is similar to the “standard
method” used by the Market Monitoring Unit for the NYISO in its annual State of the Market
reports. This year’s report relied upon the FERC-approved Net EAS Model used within the 2017
ICAP Demand Curves to calculate Net EAS revenues. This model utilizes both Day-Ahead and
Real-Time prices to provide a more accurate estimate of a proxy plant’s hypothetical revenue.
For 2012, 2013 and the Winter 2013/2014 Capability Period, the Ancillary Services
revenues earned by the hypothetical LMS100 technology were based upon 10-Minute Non-
Synchronized Reserve prices, whereas Ancillary Service revenues for the hypothetical NYCA peaking plant were based on Day-Ahead 30-Minute Reserve prices. For the Capability Year
beginning May 2014, the Frame Combustion Turbine technology Ancillary Services revenues for the hypothetical peaking plant technology in all capacity regions were based upon Day-Ahead 30-Minute Operating Reserve prices. The decrease in Net EAS from 2016-2017 was likely
attributable to the improved data available through the new model.
ICAP Market revenues were based on the ICAP Spot Market clearing prices for each Locality.
2017 Annual Installed Capacity Report |December 15, 2017|46
Table 14: Benchmark Annual Revenues in UCAP terms ($/MW)
Revenue Elements in $Revenue Elements as % of Total
201220132014201520162017201220132014201520162017
Energy$35,147$42,916$72,191$38,006$8,775$14,16570%47%56%50%12%33%
A/S$666$1,873$2,342$3,602$33,496$11,4911%2%2%5%46%27%
NYCA[1]
Capacity$14,650$46,730$54,400$35,120$30,200$16,89029%51%42%46%42%40%
Total$50,463$91,519$128,933$76,729$72,471$42,546100%100%100%100%100%100%
Energy$55,634$59,779$67,397$27,493$25,577$14,99635%31%27%16%16%15%
A/S$9,300$10,366$14,722$4,123$23,399$5,0586%5%6%2%15%5%
NYC
Capacity$95,550$124,320$169,380$142,450$109,260$81,13060%64%67%82%69%80%
Total$160,483$194,465$251,499$174,066$158,235$101,184100%100%100%100%100%100%
Energy$117,016$130,905$137,433$70,875$66,945$33,81181%68%67%56%55%41%
LongA/S$6,971$6,388$9,322$2,840$17,428$6,4275%3%5%2%14%8%
IslandCapacity$20,180$54,720$59,130$53,160$37,620$42,77014%28%29%42%31%52%
Total$144,168$192,013$205,885$126,875$121,992$83,008100%100%100%100%100%100%
Energy$5,174$14,591$8,883$11,1536%15%8%11%
A/S$11,162$5,219$34,522$10,28412%5%29%10%
G-J [2]
Capacity$72,980$78,810$74,850$79,97082%80%63%79%
Total$89,316$98,620$118,255$101,407100%100%100%100%
Note to Table 14: As with prior annual reports, this table is based on November of the year prior to
the year stated in the first row, through October of the year stated, except for the G-J Locality,
which is based on the six months of revenues calculated for the Summer 2014 Capability Period.
In order to assess revenue adequacy for purposes of this report, “Revenue Margin” is
the metric used. “Revenue Margin” is Benchmark Revenues (as reflected in Table 14)
expressed as a percentage of Required Revenues. Revenue Margins are calculated as:
Revenue Margin % = ۰܍ܖ܋ܐܕ܉ܚܓ ܀܍ܞ܍ܖܝ܍
܀܍ܙܝܑܚ܍܌ ܀܍ܞ܍ܖܝ܍
x 100
A higher value indicates a greater degree of adequacy of revenues using this approach.
The following table displays the values of Revenue Margins for the hypothetical peaking plant.
Table 15: Revenue Margins
201220132014201520162017
NYCA41%74%102%67%62%36%
NYC57%68%87%80%68%44%
LI55%73%78%72%68%46%
G-J76%64%73%63%
Note to Table 15: As with prior annual reports, this table is based on November of the year prior to
the year stated in the first row, through October of the year stated; except for the G-J Locality for
2014, which is based on the six months of revenues and revenue requirement calculated for the
Summer 2014.
In 2017, Revenue Margins decreased from prior levels in NYCA and NYC largely due to
the decrease in capacity revenues. In 2017, the changes in Revenue Margins for LI and the G-J
Locality were a result of the changes in the estimated Energy and Ancillary Services revenues.
This may be attributed to a change in the model used to estimate these revenues. To assess
whether the revenue streams for the hypothetical plant are adequate in relation to the level of
need for new capacity, data from Tables 12, 13, and 14 are graphed below, showing revenue
2017 Annual Installed Capacity Report |December 15, 2017|47
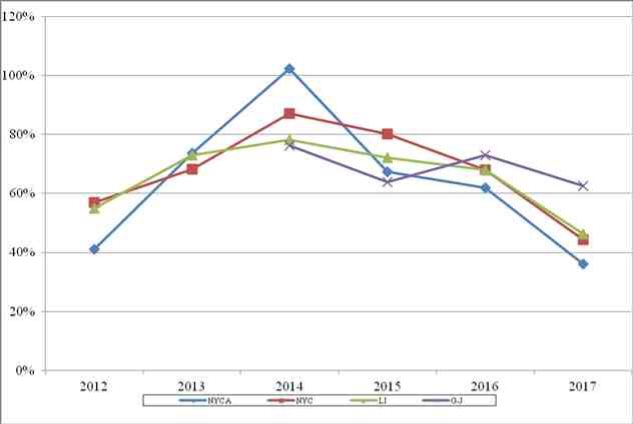
(Chart 18) and Capacity (Chart 19), as well as revenue relative to value used for the cost of new entry (Chart 20).
The capacity revenue component of the total net revenue as a percentage of the cost of new entry in the NYCA and in each Locality is depicted in Chart 20. The amount of excess
capacity peaked in NYCA, NYC, and LI in 2011, and as a result, the capacity market revenues relative to the cost of new entry requirements shown in this chart dropped precipitously, thereby appropriately signaling to the market that sufficient capacity already existed.35 As the amount of excess capacity above requirements shrinks, capacity market revenues increase. The effect of the recent increases to the level of excess capacity is reflected in the generally lower revenue margins calculated for 2016 and 2017 compared to other recent prior years
Chart 18: UCAP based Revenue Margins
35 2011 State of Market Report, p. A-13.
2017 Annual Installed Capacity Report |December 15, 2017|48
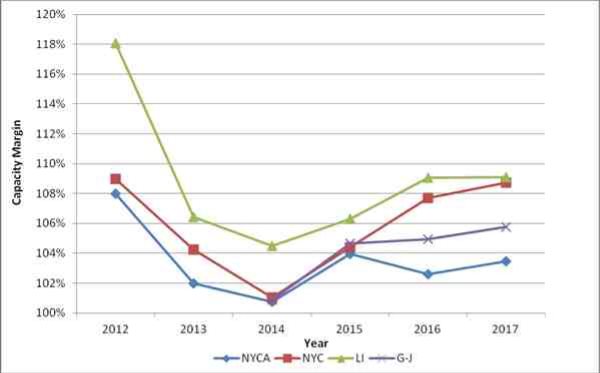
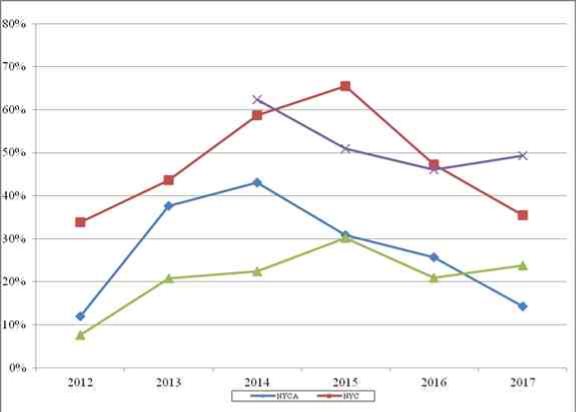
Chart 19: UCAP based Capacity Margins
Chart 20: Capacity Market Revenues Relative to CONE Requirements
2017 Annual Installed Capacity Report |December 15, 2017|49
Attachments
2017 Annual Installed Capacity Report |December 15, 2017|
Attachment I: Confidential.
Unoffered Capacity: Market Participant Explanations
(Not included with the public filing.)
2017 Annual Installed Capacity Report |December 15, 2017|Attachment I| i
Attachment II: Unsold Capacity Offers (Masked)
AUCTIONAUCTION
TYPE MONTH
LOCATIONMasked PTID
DESCRIPTION Name
OFFEROFFER
CAPACITY MW PRICE
AWAREDEDMARKET
CAPACITYCLEARING
MWPRICE
UNSOLD
MW
SpotNov‐2016ROSOffer I36.2$1.000.0$0.3536.2
SpotNov‐2016ROSOffer II50.0$0.950.0$0.3550.0
SpotNov‐2016ROSOffer III50.0$0.850.0$0.3550.0
SpotNov‐2016ROSOffer IV33.9$1.480.0$0.3533.9
SpotNov‐2016ROSOffer V1.7$0.500.0$0.351.7
SpotNov‐2016ROSOffer VI50.0$0.900.0$0.3550.0
SpotNov‐2016ROSOffer VII53.0$0.500.0$0.3553.0
SpotNov‐2016ROSOffer VIII100.0$0.750.0$0.35100.0
SpotDec‐2016ROSOffer I86.2$1.000.0$0.5586.2
SpotDec‐2016ROSOffer II100.0$0.750.0$0.55100.0
SpotDec‐2016ROSOffer III33.9$2.220.0$0.5533.9
SpotJan‐2017ROSOffer I50.0$0.540.0$0.3250.0
SpotJan‐2017ROSOffer II52.6$0.500.0$0.3252.6
SpotJan‐2017ROSOffer III33.9$2.220.0$0.3233.9
SpotJan‐2017ROSOffer IV1.7$0.350.0$0.321.7
SpotJan‐2017ROSOffer V50.0$0.770.0$0.3250.0
SpotFeb‐2017ROSOffer I33.9$2.220.0$0.5433.9
SpotFeb‐2017ROSOffer II50.0$0.5439.6$0.5410.4
SpotMar‐2017ROSOffer I50.0$1.090.0$0.7150.0
SpotMar‐2017ROSOffer II50.0$1.320.0$0.7150.0
SpotMar‐2017ROSOffer III50.0$0.860.0$0.7150.0
SpotApr‐2017ROSOffer I50.0$1.010.0$0.3550.0
SpotApr‐2017ROSOffer II50.0$0.3510.7$0.3539.3
SpotApr‐2017ROSOffer III50.0$0.570.0$0.3550.0
SpotApr‐2017ROSOffer IV1.7$0.500.0$0.351.7
SpotApr‐2017ROSOffer V50.0$0.790.0$0.3550.0
Grand Total1168.4
2017 Annual Installed Capacity Report |December 15, 2017|Attachment II| ii
Attachment III: Unsold Capacity Offers (UnMasked)
(Not included with the public filing.)
2017 Annual Installed Capacity Report |December 15, 2017|Attachment III| iii
Attachment IV: Confidential. Unsold Capacity Offers:
Market Participant Explanations
(Not included with the public filing.)
2017 Annual Installed Capacity Report |December 15, 2017|Attachment IV| iv
Attachment V: Interconnection Queue
QueueDateSPWPType/LocationInterconnectionLastAvailabilityFS Complete/ProposedProposed
Pos.Owner/DeveloperProject Nameof IR(MW)(MW)FuelCounty/StateZPointUtilitySUpdateof StudiesSGIA TenderIn-ServiceCOD
251CPV Valley, LLCCPV Valley Energy Center7/5/07677.6690.6CC-DOrange, NYGCoopers - Rock Tavern 345kVNYPA117/31/16FES, SRIS, FS10/15/132017/062018/02
276Air Energie TCI, Inc.Crown City Wind Farm1/30/089090WCortland, NYCCortland - Fenner 115kVNM-NG71/31/15FES, SRIS2018/122018/12
331National GridNortheast NY Reinforcement4/22/09N/AN/A ACSaratoga, NYFNGrid 230kVNM-NG12,145/31/16SIS2010-2019N/A
333National GridWestern NY Reinforcement5/5/09N/AN/A ACCattaraugus, NYANGrid 115kVNM-NG12,145/31/16SIS2015-2019N/A
338RG&EBrown's Race II8/11/096.36.3HMonroe, NYBStation 137 11kVRG&E115/31/17FS2018/092018/09
339RG&ETransmission Reinforcement8/17/09N/AN/A ACMonroe, NYBNiagara - Kintigh 345kVRG&E1212/31/16SIS2019/WN/A
347Franklin Wind Farm, LLCFranklin Wind12/2/0950.450.4WDelaware, NYEOakdale - Delhi 115kVNYSEG74/30/16FES, SRIS2019/102019/12
349Taylor Biomass Energy-Montgomery, LLC Taylor Biomass12/30/091922.5SWOrange, NYGMaybrook - Rock Tavern 69kVCHGE1211/30/16SRIS, FS10/15/132017/122018/04
358West Point Partners, LLCWest Point Transmission9/13/1010001000DCGreene, Westchester, NYF, HLeeds - Buchanan North 345kVNM-NG/ConEd74/30/17FES, SRIS2021/012021/05
361US PowerGen Co.Luyster Creek Energy2/15/11401444CC-DQueens, NYJAstoria West Substation 138kVCONED76/30/17FES, SRIS2021/062021/06
363Poseidon Transmission 1, LLCPoseidon Transmission4/27/11500500DCNJ - Suffolk, NYKRuland Rd. 138kVLIPA107/31/17FES, SRIS, FS2/2/20172020/032021/01
367Orange & RocklandNorth Rockland Transformer9/14/11N/AN/A ACRockland, NYGLine Y94 345kVConEd65/31/16SIS2018/06N/A
371South Mountain Wind, LLCSouth Mountain Wind10/31/111818WDelaware, NYERiver Rd Substation 46kVNYSEG710/31/17FES2020/112020/12
372Dry Lots Wind, LLCDry Lots Wind10/31/113333WHerkimer, NYESchuyler - Whitesboro 46kVNM-NG710/31/17FES, SRIS2020/112020/12
382Astoria Generating Co.South Pier Improvement5/30/1291.295.5CT-NGKings, NYJGowanus Substation 138kVConEd76/30/17SRIS2020/062020/06
383NRG Energy, Inc.Bowline Gen. Station Unit #35/30/12775814CC-NG Rockland, NYGLadentown Subsation 345kVO&R/ConEd76/30/16SRIS2022/012022/06
386Vermont Green Line Devco, LLCGrand Isle Intertie6/28/12400400DCClinton, NY - VTDPlattsburgh 230kV-New Haven, VT 345kVNYPA79/30/16FES, SRIS2018/062018/06
387Cassadaga Wind, LLCCassadaga Wind7/19/12126126WChautauqua, NYADunkirk - Moon Station 115 kVNM-NG94/30/17FES, SRIS2019/092019/12
393NRG Berrians East Development, LLCBerrians East Replacement10/16/1294.257CT-DQueens , NYJAstoria East Substation 138kVCONED97/31/17FES, SRIS2018/062018/06
395Copenhagen Wind Farm, LLCCopenhagen Wind11/12/1279.979.9WLewis, NYEBlack River-Lighthouse Hill 115kVNM-NG107/31/17FES, SRIS, FS2/2/20172018/052018/11
396Baron Winds, LLCBaron Winds11/30/12300300WSteuben, NYCHillside - Meyer 230kVNYSEG95/31/17FES, SRIS2019/092019/12
396ANew York State Electric & GasWood Street Transformer12/14/12N/AN/A ACPutnum, NYGWood St. 345/115kVNYSEG65/31/16SIS2021/12N/A
398Black Oak Wind Farm, LLCBlack Oak Wind1/10/1312.512.5WTompkins, NYCMontour - Coddington 115kVNYSEG105/31/17SIS, FS8/28/152018/012018/03
401Caithness Long Island II, LLCCaithness Long Island II3/22/13599632CC-DSuffolk, NYKSills Road Substation 138kVLIPA86/30/17SRIS2018/042019/05
403PSEG Power New YorkBethlehem Energy Center Upr5/28/137251.2CC-DAlbany, NYFBethlehem Energy CenterNM-NG102/28/17FES, SRIS, FS2/2/20172017-20192017-2019
414North America Transmission, LLCSegment B Enhanced9/5/13N/AN/A ACAlbany-Dutchess, NYF, GNew Scotland - P. Valley 345kVNM-NG/ConEd53/31/17None20192019
421EDP Renewables North AmericaArkwright Summit11/1/137878WChautauqua, NYADunkirk - Falconer 115 kVNM-NG97/31/17SRIS2017/102018/10
422NextEra Energy Resources, LLCEight Point Wind Energy Center11/7/13101.2101.2WSteuben-Allegany, NY CBennett 115kVNYSEG96/30/17FES, SRIS2018/122018/12
429Orange & RocklandNorth Rockland Station2/12/14N/AN/A ACRockland, NYGLine Y88 345kVConEd65/31/16SIS2018/06N/A
430H.Q. Energy Services U.S. Inc.Cedar Rapids Transmission3/5/14N/AN/A ACSt. Lawrence, NYDDennison - Alcoa 115kVNM-NG911/30/17SIS2019/Q4N/A
431Greenidge GenerationGreenidge Unit #44/11/14106.3106.3ST-NGYates, NYCGreenidge Substation 115kVNYSEG143/31/17SRIS, FSI/SI/S
432New York State Electric & GasSouth Perry Transformer4/15/14N/AN/A ACWyoming, NYBSouth Perry Substation 115kVNYSEG65/31/17SIS2019/07N/A
440Erie Power, LLCErie Power6/2/1479.488CC-NG Chautauqua, NYASouth Ripley Substation 230kVNM-NG97/31/17SRIS2019/022019/02
444Cricket Valley Energy Center, LLC Cricket Valley Energy Center II6/18/1410201132CC-NG Dutchess, NYGPleasant Valley - Long Mt. 345kVConEd9, 117/31/17SRIS2017/122020/01
445Lighthouse Wind, LLCLighthouse Wind6/30/14201.3201.3WNiagara, NYAAES Somerset Substation 345kVNYSEG78/31/17FES, SRIS2020/082020/12
448Alps Interconnector, LLCAlps HVDC8/12/14600600DCNE-Rensselaer, NYFAlps Substation 345kVNM-NG51/31/16FES2019/062019/06
449Stockbridge Wind, LLCStockbridge Wind8/13/1472.672.6WMadison, NYEWhitman - Oneida 115kVNM-NG710/31/17SRIS2019/082019/12
458TDI-USA Holdings, Inc.CH Interconnection10/24/1410001000DCQuebec - NY, NYJAstoria Annex Substation 345kVNYPA96/30/17FES, SRIS2021/Q12021/Q2
461Consolidated Edison Co. of NYEast River 1 Uprate12/1/1422CT-NGNew York, NYJEast River ComplexConEd9, 144/30/17SRIS, FS2/2/2017I/SI/S
462Consolidated Edison Co. of NYEast River 2 Uprate12/1/1422CT-NGNew York, NYJEast River ComplexConEd9, 144/30/17SRIS, FS2/2/2017I/SI/S
465Hudson Transmssion PartnersHudson Transmission NY to PJM12/15/14675675DC/ACNew York, NYJW49th St 345kV - Bergen 230kVConEd75/31/17SRIS2021/012021/05
466Atlantic Wind, LLCBone Run Win12/16/14132132WCattaraugus, NYAFalconer - Homer Hill 115kVNM-NG711/30/16FES, SRIS2019/122019/12
467Invenergy Solar Development, LLCShoreham Solar12/22/142525SSuffolk, NYKRidge - Wildwood 69kVLIPA93/31/17SRIS2018/062018/06
468Apex Clean Energy LLCGalloo Island Wind12/30/14110.4110.4WOswego, NYCHammermill - Wine Creek 115kVNM-NG95/31/17FES, SRIS2019/102019/12
473Calverton Solar LLCCalverton Solar1/21/151010SSuffolk, NYKRiverhead - Wildwood 69kVLIPA512/31/16FES2017/Q32017/Q3
474EDP Renewables North AmericaNorth Slope Wind1/30/15200200WFranklin-Clinton, NYDPatnode 230kVNYPA73/31/17FES, SRIS2021/102021/10
477Riverhead Solar Farm LLCRiverhead Solar2/18/152020SSuffolk, NYKEdwards Substation 138kVLIPA96/30/17FES, SIS2018/102018/10
487LI Energy Storage SystemFar Rockaway Battery Storage3/9/152020ESSuffolk, NYKFar Rockaway Substation 69kVLIPA45/31/17FES2018/102018/10
494Alabama Ledge Wind Farm LLCAlabama Ledge Wind3/31/1579.879.8WGenesee, NYAOakfield - Lockport 115kVNM-NG95/31/17SRIS2020/072020/10
495Mohawk Solar LLCMohawk Solar4/2/159898SMontgomery, NYFSt. Johnsville - Marshville 115kVNM-NG68/31/17FES, SRIS2018/092018/12
2017 Annual Installed Capacity Report |December 15, 2017|Attachment V| v
Attachment V: Interconnection Queue
QueueDateSPWPType/LocationInterconnectionLastAvailabilityFS Complete/ProposedProposed
Pos.Owner/DeveloperProject Nameof IR(MW)(MW)FuelCounty/StateZPointUtilitySUpdateof StudiesSGIA TenderIn-ServiceCOD
496Renovo Energy Center, LLCRenovo Energy Center
497Invenergy Wind Developm ent LLC Bull Run Wind
498ESC Tioga County Power, LLCTioga County Power
505RES America Devlopments Inc.Ball Hill Wind
506Empire State Connector Corp.Empire State Connector
510Bayonne Energy CenterBayonne Energy Center II
511AG Energy, LPOgdensburg
512Northbrook Lyons FallsLyons Fills Mill Hydro
513Stony Creek Energy LLCOrangeville
514RES Americas Developments Inc. Empire Wind
515North Bergen Liberty Generation Center LLCLiberty Generation
516East Coast Power LLCLinden Cogen Uprate
518PPL Electric UtilitiesCompass
519Canisteo Wind Energy LLCCanisteo Wind
520EDP Renewables North AmericaRolling Upland Wind
521Invenergy NY, LLCBull Run II Wind
522NYC Energy LLCNYC Energy
523Dunkirk Power LLCDunkirk Unit 2
524Dunkirk Power LLCDunkirk Unit 3 & 4
525New York Power AuthorityWestern NY Energy Link
526Atlantic Wind, LLCNorth Ridge Wind
530NextEra Energy Transmission New York, Inc.Empire State Line
531Invenergy Wind Developm ent LLC Num ber 3 Wind Energy
532RES America Devlopments LLCAllegany Wind
534OneEnergy Development, LLCGreat Valley Solar
535sPower Development Company, LLC Riverhead Expansion
537NextEra Energy Transmission New York, Inc.Segment A
538NextEra Energy Transmission New York, Inc.Segment B
539NextEra Energy Transmission New York, Inc.Segment B Alt
540AVANGRIDConnect NY Edic - PV
541AVANGRIDConnect NY Edic - Ramapo
542National GridSegment A Edic-New Scotland
543National GridSegment B Knickerbocker-PV
545Sky High Solar, LLCSky High Solar
545ANextEra Energy Transmission New York, Inc.Empire State Line Alt
546Atlantic Wind, LLCRoaring Brook Wind
547North America Transmission, LLC Dysinger-Stolle
555North America Transmission, LLC Segment A Base
556North America Transmission, LLC Segment A Double Circuit
557North America Transmission, LLC Segment A Enhanced
558North America Transmission, LLC Segment A 765
559North America Transmission, LLC Segmant B Base
560Atlantic Wind, LLCDeer River Wind
561As toria Generating Co. LPAs toria Generating Unit 4
563Double Lock Solar, LLCDouble Lock Solar
564Rock District Solar, LLCRock District Solar
565Tayandenga Solar, LLCeTayandenega Solar
566New York Power AuthorityMA 1 & 2 Rebuild
567Tribes Hill Solar, LLCTribes Hill Solar
568Turkey Hollow Solar, LLCTurkey Hollow Solar
570Hecate Energy, LLCAlbany County
4/13/15480504CC-NG Chemung, NY - PA
4/24/15303.6303.6WClinton, NY
4/29/15550550CC-NG Chemung, NY - PA
6/2/15100100WChautauqua, NY
6/10/1510001000DCOnondaga-New Y ork, NY
8/3/15120.4129.4CT-DBayonne, NJ
9/4/157990.1CT-NG St. Lawrence, NY
9/11/1514.114.1HLewis, NY
9/21/152020ESWyoming, NY
10/1/15120120WRensselaer, NY
10/7/1510001000 CC-NG New York, NY
10/12/15234.4234.4 CT-NG Linden, NJ-NY,NY
10/27/15N/AN/AACPA-Rockland, NY
11/2/15290.7290.7WSteuben, NY
12/3/1572.672.6WMadison, NY
12/15/15145.4145.4WClinton, NY
12/16/1579.979.9CT-NG New York, NY
12/17/157575ST-NG Chautauqua, NY
12/17/15370370ST-NG Chautauqua, NY
12/18/15N/AN/AACNiagara, NY
12/23/15100100WSt. Lawrence, NY
1/4/16N/AN/AACNiagara-Erie, NY
1/11/16105.8105.8WLewis, NY
2/1/16100100WAllegany, NY
2/3/162020SWashington, NY
2/23/163636SSuffolk, NY
4/25/16N/AN/AACOneida-Albany NY
4/25/16N/AN/AACAlbany-Dutchess, NY
4/25/16N/AN/AACAlbany-Dutchess, NY
4/28/1610001000DCOneida-Dutchess, NY
4/28/1610001000DCOneida-Dutchess, NY
5/4/16N/AN/AACOneida-Albany NY
5/4/16N/AN/AACAlbany-Dutchess, NY
5/10/162020SOnondaga, NY
5/17/16N/AN/AACNiagara-Erie, NY
5/19/167878WLewis, NY
5/25/16N/AN/AACNiagara-Erie, NY
7/6/16N/AN/AACOneida-Albany NY
7/6/16N/AN/AACOneida-Albany NY
7/6/16N/AN/AACOneida-Albany NY
7/6/16N/AN/AACOneida-Albany NY
7/6/16N/AN/AACOneida-Albany NY
7/8/16100100WLewis, NY
7/18/16385385ST-DNew York, NY
7/25/162020SHerkimer, NY
7/25/162020SSchoharie, NY
7/25/162020SHerkimer, NY
8/4/16N/AN/AACSt. Law rence-Lew is, NY
8/10/162020SMongomery, NY
8/16/162020SDelaware, NY
8/17/16 20 20 S Albany, NY
CHomer City - Watercure 345kV
DPatnode 230kV
CHomer City - Watercure 345kV
ADunkirk - Gardenville 230kV C, J Clay - Gowanus 345kV
JGowanus Substation 345kV
ENorth Ogdensburg Substation
ETaylorville- Boonville 115 kV
AStony Creek 230kV
FStephentown - Greenbush 115kV
JW49th St 345kV
JLinden Cogen 345kV
GLackawanna - Ramapo 345kV
CBennett 115kV
ECounty Line - Bothertown 115kV
DPatnode 230kV
JHudson Avenue East 138kV
ADunkirk 115kV
ADunkirk 230kV
ANiagara - Stolle - Gardenville
EColton - Malone 115kV
ADysinger - Stolle 345kV
ELowville - Bremen 115kV
BFreedom Substation
FBattenkill Substation
KEdwards Substation 138kV
E, F Edic - New Scotland 345kV
F, G Greenbush - PV 345kV
F, G Greenbush - PV 345kV
E, G Edic - PV 345kV
E, G Edic - Ramapo 345kV
E, F Edic - New Scotland 345kV
F, G Greenbush - PV 345kV
C115kV
ADysinger - Stolle 345kV
EChases Lake Substation
ADysinger - Stolle 345kV
E, F Edic - New Scotland 345kV
E, F Edic - New Scotland 345kV
E, F Edic - New Scotland 345kV
E, F Edic - New Scotland 345kV
E, F Knickerbocker - PV 345kV
EBlack River-Lighthouse Hill 115kV
JAstoria West Substation 138 kV
EMarshville 115kV
FSharon - Cobleskill 69kV
ESt. Johnsville - Inghams 115kV D, E Moses & Adirondack 230kV
FChurch St. 69KV
FGrand Gorge - Axtell Road 115kV
F Long Lane - Lafarge 115kV
NYSEG911/30/17FES, SRIS2019/092020/06
NYPA56/30/16FES2018/102018/12
NYSEG94/30/17FES, SRIS2020/062021/05
NM-NG94/30/17SRIS2018/092018/12
NYPA/NM-NG/
ConEd45/31/17FES2021/102022/01
ConEd97/31/17SRIS2017/112018/02
NM-NG910/31/17SRIS2018/052018/05
NM-NG711/30/16SIS2018/032018/03
NYSEG78/31/17SIS2018/032018/03
NM-NG42/28/17FES2019/102019/10
ConEd39/30/17None2019/062019/06
ConEd95/31/17SRIS2020/052020/05
ConEd58/31/17FES2023/122023/12
NYSEG510/31/16FES2019/102019/12
NYSEG56/30/17FES2019/072019/10
NYPA56/30/17FES2018/102018/12
ConEd511/30/17FES2019/102019/10
NM-NG911/30/17SRIS2018/082018/12
NM-NG911/30/17SRIS2018/082018/12
NY PA /NY SEG65/31/17SIS2020N/A
NM-NG611/30/17FES, SRIS2019/112019/12
NY PA /NY SEG610/31/17SIS2020/052020/05
NM-NG52/28/17FES2019/102019/12
Village of Arcade54/30/17None2018/092018/12
NM-NG711/30/17FES, SIS2018/022018/02
LIPA511/30/17FES2020/112020/12
NM-NG/NYPA
58/31/17None2018/112018/11
NM-NG/NYSEG/
CHGE/ConEd58/31/17None2018/112018/11
NM-NG/NYSEG/
CHGE/ConEd58/31/17None2018/112018/11
NM-NG/NYSEG/
ConEd512/31/16None2020/122020/12
NM-NG/NYSEG/
O&R510/31/16None2020/122020/12
NM-NG511/30/16None2021/122021/12
NM-NG/NYSEG/
CHGE/ConEd511/30/16None2021/122021/12
NM-NG57/31/17FES2018/122018/12
NY PA /NY SEG610/31/17SIS2020/062020/06
NM-NG57/31/17FES2019/112019/12
NYPA/NYSEG/
NM-NG610/31/17SIS2020/062020/06
NM-NG/NYSEG/
CHGE/ConEd51/31/17None2020/012020/01
NM-NG/NYSEG/
CHGE/ConEd51/31/17None2020/062020/06
NM-NG/NYSEG/
CHGE/ConEd51/31/17None2020/012020/01
NM-NG/NYSEG/
NYPA/CHGE/ConE
d512/31/16None2020/012020/01
NM-NG/NYSEG/
CHGE/ConEd51/31/17None2019/092019/09
NM-NG410/31/17FES2019/112019/12
ConEd511/30/17None2018/052018/05
NM-NG44/30/17None2018/122018/12
NM-NG44/30/17None2018/122018/12
NM-NG44/30/17None2018/122018/12
NYPA510/31/16None2022/122022/12
NM-NG44/30/17None2018/122018/12
NYSEG711/30/17SIS2018/122018/12
NM-NG 5 10/31/17 None 2019/06 2019/06
2017 Annual Installed Capacity Report |December 15, 2017|Attachment V| vi
Attachment V: Interconnection Queue
QueueDateSPWPType/LocationInterconnectionLastAvailabilityFS Complete/ProposedProposed
Pos.Owner/DeveloperProject Nameof IR(MW)(MW)FuelCounty/StateZPointUtilitySUpdateof StudiesSGIA TenderIn-ServiceCOD
671East Coast Power LLCLinden Cogen Uprate9/25/1732.023.0CT-NG Linden, NJ-NY,NYJ Linden Cogen 345kVConEd411/30/17None2018/012018/01
672LS Power Development, LLCHelix Ravenswood I10/6/1730.230.2NG New York, NYJ Rainey Substation 345kVConEd210/31/17None2022/072023/01
673LS Power Development, LLCHelix Ravenswood II10/6/1772.472.4NG New York, NYJ Rainey Substation 345kVConEd210/31/17None2022/072023/01
674Helix Ravenswood, LLCVernon Battery Storage I10/24/171010ES Queens, NYJ Vernon SubstationConEd411/30/17None2020/052020/05
675Helix Ravenswood, LLCVernon Battery Storage II10/24/171010ES Queens, NYJ Vernon SubstationConEd411/30/17None2020/052020/05
677Granada Solar, LLCGrange Solar10/25/172020S Nanticoke, NYC Vincent Cors 34.5kVNYSEG111/30/17None2019/062019/06
678LI Solar Generation, LLCCalverton Solar Energy Center10/26/1722.922.9S Suffolk, NYK Edwards Substation 138kVLIPA111/30/17None2020/122020/12
Number of new projects during November2
Number of new projects year to date85
Number withdrawn during November4
Number withdrawn year to date38
NOTES: ● The column labeled 'SP' refers to the maximum summer megawatt electrical output. The column labeled 'WP' refers to the maximum winter megawatt electrical output.
● Type / Fuel. Key: ST=Steam Turbine, CT=Combustion Turbine, CC=Combined Cycle, CS= Steam Turbine & Combustion Turbine, H=Hydro, PS=Pumped Storage, W=Wind, NU=Nuclear, NG=Natural Gas, M=Methane, SW=Solid Waste, S=Solar, Wo=Wood, F=Flywheel ES=Energy Storage, O=Oil, C=Coal, D=Dual Fuel, AC=AC Transmission, DC=DC Transmission, L=Load, FC=Fuel Cell
● The column labeled 'Z' refers to the zone
● The column labeled 'S' refers to the status of the project in the NYISO's LFIP. Key: 1=Scoping Meeting Pending, 2=FES Pending, 3=FES in Progress, 4=SRIS/SIS Pending, 5=SRIS/SIS in Progress, 6=SRIS/SIS Approved, 7=FS Pending, 8=Rejected Cost Allocation/Next FS Pending, 9=FS in Progress, 10=Accepted Cost Allocation/IA in Progress, 11=IA Completed, 12=Under Construction, 13=In Service for Test, 14=In Service Commercial, 0=Withdrawn
● Availability of Studies Key: None=Not Available, FES=Feasibility Study Available, SRIS=System Reliability Impact Study Available, FS=Facilities Study and/or ATRA Available ● FS Complete/SGIA Tender refers to the Attachment X milestone used to apply the 4-year COD limitation.
● Proposed in-service dates and Commerical Operation Dates (COD) are shown in format Year/Qualifier, where Qualifier may indicate the month, season, or quarter.
DPS/State - SIR Interconnection Queue (for Projects not subject to the NYISO process):
http://www3.dps.ny.gov/W/PSCWeb.nsf/All/286D2C179E9A5A8385257FBF003F1F7E?OpenDocument
2017 Annual Installed Capacity Report |December 15, 2017|Attachment V| vii
Attachment VI: Interconnection Queue
1
2
3
4
5
6
7
8
9
10
11
12
13
14
Scoping Meeting Pending FES Pending
FES in Progress
SRIS/SIS Pending
SRIS/SIS in Progress SRIS/SIS Approved FS Pending
Rejected Cost Allocation/ Next FS Pending
FS in Progress
Accepted Cost Allocation/ IA in Progress
IA Completed
Under Construction
In Service for Test
In Service Commercial
Interconnection Request has been received, but scoping meeting has not yet occurred
Awaiting execution of Feasibility Study Agreement
Feasibility Study is in Progress
Awaiting execution of System Reliability Impact Study (SRIS) or System Impact Study (SIS) Agreement and/or OC approval of SRIS or SIS scope38
SRIS/SIS Approved by NYISO Operating Committee
Awaiting execution of Facilities Study Agreement
Project was in prior Class Year, but rejected cost allocation—Awaiting execution
of Facilities Study Agreement for next Class Year or the start of the next Class
Year
Class Year Facilities Study or Small Generator Facilities Study is in Progress Interconnection Agreement is being negotiated
Interconnection Agreement is executed and/or filed with FERC Project is under construction
38 System Reliability Impact Study (SRIS) applies to a Large Facility Interconnection Request. System Impact Study (SIS) applies to a Small Generator Interconnection Request or a non-merchant transmission study request.
2017 Annual Installed Capacity Report |December 15, 2017|Attachment I| vii
Attachment VII: November 1999 - October 2017 Installed Capacity Auction Activity
NYCANYCLIG-J Locality
CapabilityMonthly AuctionS pot Market **Minimum RequiredExcess S oldCapabilityMonthly AuctionS pot MarketMinimum RequiredExcess S oldCapabilityMonthlyS pot MarketMinimum RequiredExcess S oldCapabilityMonthly AuctionS pot MarketMinimum RequiredExcess S old
Period* (S trip)**Period* (S trip)Period*AuctionPeriod* (S trip)
(S trip)
MonthMW PriceMW PriceMW PriceMWMWMW PriceMW PriceMW PriceMWMWMW PriceMW PriceMW PriceMWMWMWPriceMWPriceMWPriceMWMW
Nov-9935,563.18,305.64,555.3
Dec-9935,563.18,305.64,555.3
Jan-00Installed Capacity M arket Existed but all purchases and35,563.1Installed Capacity M arket Existed but all purchases and8,305.6Installed Capacity M arket Existed but all purchases4,555.3
Feb-00sales were bilateral35,563.1sales were bilateral8,305.6and sales were bilateral4,555.3
Mar-0035,563.18,305.64,555.3
Apr-0035,563.18,305.64,555.3
May-001,976.0$1.50434.2$1.3032.7$0.5035,636.01,976.05,408.8$8.7559.4$12.500.0-8,272.00.0-0.0-0.0-4,638.0
Jun-001,976.0$1.50528.4$1.4037.1$1.2835,563.11,976.05,408.8$8.75313.4$9.4652.7$12.508,272.00.0-0.0-0.0-4,638.0
Jul-001,976.0$1.50344.2$1.80140.8$1.9835,563.11,976.05,408.8$8.75342.7$9.40100.0$12.508,272.00.0-0.0-0.0-4,638.0
Aug-001,976.0$1.50351.4$1.62194.8$1.7735,563.11,976.05,408.8$8.75332.6$9.42133.9$12.508,272.00.0-0.0-0.0-4,638.0
Sep-001,976.0$1.50648.9$1.3281.3$1.1635,563.11,976.05,408.8$8.75344.5$9.40149.5$12.508,272.00.0-0.0-0.0-4,638.0
Oct-001,976.0$1.50681.6$1.3096.9$0.8935,563.11,976.05,408.8$8.75304.2$9.49214.0$12.508,272.00.0-0.0-0.0-4,638.0
Nov-004,010.6$1.041,813.6$1.00157.7$0.8035,563.14,010.64,861.4$8.75735.0$8.74170.3$8.758,272.00.0-0.0-0.0-4,638.0
Dec-004,010.6$1.041,854.1$0.97167.2$0.8635,563.14,010.64,861.4$8.75785.1$8.74154.8$8.758,272.00.0-0.0-0.0-4,638.0
Jan-014,010.6$1.041,847.6$0.97170.5$0.8535,563.14,010.64,861.4$8.75899.5$8.74154.8$8.758,272.00.0-0.0-0.0-4,638.0
Feb-014,010.6$1.041,893.8$0.95177.2$0.8335,563.14,010.64,861.4$8.75921.7$8.71154.8$8.758,272.00.0-0.0-0.0-4,638.0
Mar-014,010.6$1.042,032.8$0.95208.1$0.7935,563.14,010.64,861.4$8.75936.5$8.74156.0$8.758,272.00.0-0.0-0.0-4,638.0
Apr-014,010.6$1.041,659.7$0.87192.3$0.5935,563.14,010.64,861.4$8.75985.6$8.56156.7$8.728,272.00.0-0.0-0.0-4,638.0
May-012,738.6$1.90852.3$2.251,022.2$9.5836,132.02,738.65,316.6$8.75248.7$8.75235.1$12.508,375.0(est.)0.0-0.0-3.2$10.834,625.0
Jun-012,738.6$1.90397.6$2.681,521.0$9.4136,132.02,738.65,316.6$8.75228.4$10.92299.0$12.188,375.0(est.)0.0-0.0-7.0$10.834,625.0
Jul-012,738.6$1.901,776.6$4.311,534.9$9.4436,132.02,738.65,316.6$8.75407.8$9.77292.5$8.838,375.0(est.)0.0-0.0-20.2$10.834,625.0
Aug-012,738.6$1.901,788.4$4.561,601.3$9.3536,132.02,738.65,316.6$8.75440.1$8.38350.1$9.468,375.0(est.)0.0-0.0-21.3$10.834,625.0
Sep-012,738.6$1.901,701.2$4.161,498.0$9.2136,132.02,738.65,316.6$8.75434.9$8.42316.0$8.348,375.0(est.)0.0-0.0-33.0$10.834,625.0
Oct-012,738.6$1.901,787.1$4.031,473.4$9.1436,132.02,738.65,316.6$8.75430.1$7.99343.4$8.728,375.0(est.)0.0-0.0-33.0$10.834,625.0
Nov-011,760.4$2.00878.0$0.105.8$-32,892.31,760.43,972.5$9.40772.8$9.0077.7$4.807,613.30.0-0.6$3.508.5$12.334,077.6
Dec-011,760.4$2.00687.2$0.496.5$-32,892.31,760.43,972.5$9.40906.8$6.8811.5$ -7,613.30.0-1.3$3.5037.4$12.334,077.6
Jan-021,760.4$2.00750.5$0.84133.0$0.7532,892.31,760.43,972.5$9.40492.6$5.47377.3$8.257,613.30.0-1.3$5.0039.7$12.334,077.6
Feb-021,760.4$2.00836.2$0.7025.5$-32,892.31,760.43,972.5$9.40631.1$6.69229.3$9.207,613.30.0-0.0$ -40.6$11.504,077.6
Mar-021,760.4$2.00901.3$0.6130.0$0.2532,892.31,760.43,972.5$9.40784.3$6.9290.6$7.507,613.30.0-14.0$11.5026.4$11.494,077.6
Apr-021,760.4$2.00677.9$0.695.6$0.0232,892.31,760.43,972.5$9.40932.9$7.1211.6$9.407,613.30.0-41.4$11.480.0-4,077.6
May-023,201.6$1.75552.1$0.332.3$-32,479.53,201.64,355.2$9.20684.1$9.3830.5$9.397,621.60.0-0.0-0.0-4,177.8
Jun-023,201.6$1.75438.3$0.3620.3$0.0132,479.53,201.64,355.2$9.20671.2$6.1116.7$0.507,621.60.0-0.0-0.0-4,177.8
Jul-023,201.6$1.75721.9$0.9711.1$0.0132,479.53,201.64,355.2$9.20684.7$5.340.3$0.017,621.60.0-0.0-0.0-4,177.8
Aug-023,201.6$1.75722.6$0.9155.4$0.0132,479.53,201.64,355.2$9.20693.8$5.1515.1$2.007,621.60.0-0.0-0.0-4,177.8
Sep-023,201.6$1.75714.0$0.2571.2$0.0132,479.53,201.64,355.2$9.20688.4$4.8324.5$0.017,621.60.0-0.0-0.0-4,177.8
Oct-023,201.6$1.75712.1$0.161.4$-32,479.53,201.64,355.2$9.20699.0$4.7219.2$1.957,621.60.0-0.0-0.0-4,177.8
Nov-023,486.7$0.651,024.3$0.5085.0$0.4034,169.73,486.74,540.0$7.00748.1$6.4061.1$4.108,021.80.0-0.0-0.0-4,256.2
Dec-023,486.7$0.651,219.3$0.2851.4$0.1034,169.73,486.74,540.0$7.00762.7$4.0929.9$2.808,021.80.0-0.0-0.0-4,256.2
Jan-033,486.7$0.651,584.4$0.26189.1$2.1034,169.73,486.74,540.0$7.00787.9$4.0213.3$2.108,021.80.0-0.0-0.0-4,256.2
Feb-033,486.7$0.651,623.1$0.3485.6$0.5034,169.73,486.74,540.0$7.00808.6$3.511.5$3.008,021.80.0-0.0-0.0-4,256.2
Mar-033,486.7$0.651,825.9$0.3258.8$0.2534,169.73,486.74,540.0$7.00799.7$3.9721.9$4.008,021.80.0-0.0-0.0-4,256.2
Apr-033,486.7$0.651,571.5$0.154.2$0.0134,169.73,486.74,540.0$7.00829.7$3.399.1$3.608,021.80.0-0.0-0.0-4,256.2
May-032,889.2$1.671,634.8$1.30101.5$0.2535,303.50.02,501.7$11.223,016.3$10.00110.2$12.368,356.70.06.6$9.412.2$24.000.2$23.004,415.30.0
Jun-032,889.2$1.671,866.0$1.062,148.7$2.3435,303.52,073.22,501.7$11.22683.0$13.782,375.5$11.468,356.70.06.6$9.410.0--------341.9$5.174,415.3341.9
Jul-032,889.2$1.671,249.2$2.012,824.2$2.2835,303.52,274.12,501.7$11.22527.9$11.572,558.0$11.468,356.70.06.6$9.411.0$5.00344.7$5.144,415.3344.7
Aug-032,889.2$1.671,344.1$2.043,096.6$2.2535,303.52,299.32,501.7$11.22567.9$11.562,497.9$11.468,356.70.06.6$9.411.1$5.00441.8$4.034,415.3441.8
Sep-032,889.2$1.671,396.7$1.973,134.1$2.0835,303.52,448.12,501.7$11.22558.1$11.562,499.5$11.468,356.70.06.6$9.410.0--------397.8$4.554,415.3396.2
Oct-032,889.2$1.671,408.4$1.933,253.2$2.0135,303.52,504.82,501.7$11.22638.8$11.552,415.1$11.458,356.70.06.6$9.410.0--------397.8$4.554,415.3396.0
Nov-032,163.2$1.172,128.8$1.156,833.0$1.9435,203.42,566.9475.0$6.55579.3$6.675,029.3$6.988,346.1571.00.0$4.000.0--------114.3$8.144,401.983.7
Dec-032,163.2$1.171,860.1$1.487,203.1$1.7935,203.42,698.6475.0$6.55909.4$6.644,711.0$6.988,346.1571.00.0$4.000.0--------107.5$8.224,401.976.9
Jan-042,163.2$1.172,083.6$1.506,972.2$1.7535,203.42,732.1475.0$6.55968.9$6.644,644.8$6.988,346.1571.00.0$4.000.0--------128.2$7.994,401.997.0
Feb-042,163.2$1.172,475.9$1.586,379.9$1.7335,203.42,747.4475.0$6.552,167.5$6.773,422.4$6.988,346.1571.00.0$4.000.6$7.50202.6$7.084,401.9176.0
Mar-042,163.2$1.172,180.0$1.546,569.8$1.0035,203.43,369.3475.0$6.551,938.0$6.053,841.5$6.988,346.1571.00.0$4.000.6$7.00142.6$7.724,401.9119.9
Apr-042,163.2$1.172,646.7$0.996,987.5$0.8035,203.43,543.8475.0$6.552,047.2$6.003,779.1$6.988,346.1571.00.0$4.000.6$6.85199.0$7.044,401.9179.7
Starting May 2006, Monthly Auction prices and quantities are reported for the upcoming auction month only**Including auction sales from neighboring Control Areas
Attachment VII: November 1999 - October 2017 Installed Capacity Auction Activity
NYCANYCLIG-J Locality
CapabilityMonthly AuctionSpot Market **Minimum RequiredExcess SoldCapabilityMonthly AuctionSpot MarketMinimum RequiredExcess SoldCapabilityMonthlySpot MarketMinimum RequiredExcess SoldCapabilityMonthly AuctionSpot MarketMinimum RequiredExcess Sold
Period* (Strip)**Period* (Strip)Period*AuctionPeriod* (Strip)
(Strip)
MonthMWPriceMWPriceMWPriceMWMWMWPriceMWPriceMWPriceMWMWMW PriceMWPriceMWPriceMWMWMWPriceMWPriceMWPriceMWMW
May-042,441.0$1.682,489.7$1.656,189.1$1.3135,584.53,328.01,245.3$11.152,022.4$11.162,898.3$11.428,444.6214.911.2$8.001.6$8.0097.5$9.834,761.581.2
Jun-042,441.0$1.682,133.6$1.486,239.9$1.2735,584.53,355.31,245.3$11.152,532.8$11.292,391.9$11.428,444.6214.911.2$8.0011.2$9.2990.8$9.794,761.584.3
Jul-042,441.0$1.681,756.7$1.296,410.6$1.0435,584.53,518.81,245.3$11.152,705.7$11.292,261.3$11.428,444.6214.911.2$8.0015.9$8.67193.4$8.424,761.5192.9
Aug-042,441.0$1.682,046.5$1.156,544.7$1.1735,584.53,428.11,245.3$11.153,126.1$11.251,854.4$11.428,444.6214.911.2$8.0016.4$8.05213.1$8.164,761.5213.1
Sep-042,441.0$1.682,258.8$1.166,456.2$1.0735,584.53,499.61,245.3$11.153,272.4$11.251,798.6$11.428,444.6214.911.2$8.0016.2$8.06214.2$8.154,761.5214.2
Oct-042,441.0$1.682,460.8$1.186,633.9$1.1235,584.53,465.61,245.3$11.152,771.9$11.212,336.3$11.428,444.6214.911.2$8.0016.2$8.06214.2$8.154,761.5214.2
Nov-043,050.7$0.602,344.4$0.706,730.6$0.7035,515.93,759.32,249.4$6.681,253.8$6.963,137.5$7.128,469.5705.913.9$4.0010.9$4.00358.2$6.344,736.0357.7
Dec-043,050.7$0.603,058.4$0.696,011.5$0.6135,515.93,823.52,249.4$6.681,606.0$7.072,758.3$7.128,469.5705.913.9$4.009.0$4.33368.5$6.214,736.0367.6
Jan-053,050.7$0.602,945.8$0.595,928.6$0.2735,515.94,064.82,249.4$6.682,433.6$7.031,919.3$7.128,469.5705.913.9$4.009.0$3.81372.1$6.164,736.0371.4
Feb-053,050.7$0.602,769.6$0.496,256.2$0.2535,515.94,082.22,249.4$6.682,596.5$7.031,761.5$7.128,469.5705.913.9$4.007.6$3.68373.3$6.144,736.0372.8
Mar-053,050.7$0.602,890.9$0.456,025.4$0.4135,515.93,966.22,249.4$6.682,671.8$7.031,784.0$7.128,469.5705.913.9$4.007.0$3.54371.9$6.164,736.0371.9
Apr-053,050.7$0.602,891.5$0.486,241.1$0.2735,515.94,064.82,249.4$6.682,611.4$7.031,851.9$7.128,469.5705.913.9$4.007.0$3.54367.4$6.234,736.0365.8
May-052,624.6$0.751,630.0$0.756,975.7$2.0035,799.23,110.82,547.2$11.681,035.2$11.862,547.1$12.038,526.8284.010.6$8.002.7$8.0085.5$12.154,904.985.4
Jun-052,624.6$0.751,752.9$1.406,306.6$1.9635,799.23,135.22,547.2$11.682,657.9$11.80974.2$11.968,526.8291.310.6$8.002.0$8.50100.4$11.964,904.997.8
Jul-052,624.6$0.754,077.8$1.295,073.3$1.0035,799.23,703.42,547.2$11.682,742.6$11.82992.5$11.958,526.8292.510.6$8.004.3$9.00195.3$10.484,904.9195.0
Aug-052,624.6$0.753,819.1$0.815,147.3$1.0035,799.23,703.42,547.2$11.682,689.7$11.821,134.8$11.868,526.8301.610.6$8.004.6$8.50222.5$10.064,904.9222.5
Sep-052,624.6$0.753,412.5$0.815,303.5$1.4535,799.23,436.72,547.2$11.682,842.0$11.821,086.6$11.708,526.8318.210.6$8.004.6$8.61233.0$9.904,904.9233.0
Oct-052,624.6$0.753,861.2$1.035,142.0$1.2535,799.23,555.22,547.2$11.682,644.5$11.821,238.1$11.868,526.8301.610.6$8.004.6$8.71260.0$9.494,904.9260.0
Nov-052,987.1$0.622,676.1$0.676,661.9$0.8535,761.53,789.01,846.4$5.11943.9$6.393,865.4$6.558,569.2854.315.0$0.6810.0$5.00330.5$8.374,962.4330.5
Dec-052,987.1$0.623,466.7$0.686,306.0$0.6535,761.53,907.21,846.4$5.112,130.4$6.442,674.7$6.558,569.2854.315.0$0.6810.1$4.99344.5$8.164,962.4344.5
Jan-062,987.1$0.623,966.1$0.635,625.3$2.0135,761.53,102.51,846.4$5.112,558.2$6.212,116.6$6.558,569.2854.315.0$0.6810.0$5.00288.1$9.004,962.4288.1
Feb-062,987.1$0.623,379.8$1.016,432.7$1.6735,761.53,305.21,846.4$5.113,162.5$5.782,037.4$6.558,569.2854.315.0$0.6810.0$5.00343.1$8.184,962.4343.1
Mar-062,987.1$0.625,214.9$0.585,234.1$0.5735,761.53,954.51,846.4$5.112,704.7$5.782,031.7$6.558,569.2854.315.0$0.6810.0$5.00350.8$8.074,962.4350.8
Apr-062,987.1$0.624,899.7$0.515,357.5$0.4035,761.54,055.01,846.4$5.113,237.1$5.881,540.4$6.558,569.2854.315.0$0.6810.0$5.00346.1$8.144,962.4346.1
May-06 *3,014.5$1.442,196.7$1.646,936.8$3.2537,154.22,526.42,186.7$12.351,422.7$12.432,209.8$12.718,798.1255.94.0$6.509.0$6.50166.8$11.155,110.3165.0
Jun-063,014.5$1.442,747.7$2.596,163.0$3.1237,154.22,601.62,186.7$12.351,088.8$12.442,165.3$12.718,798.1255.94.0$6.502.3$7.50469.3$6.765,110.3462.5
Jul-063,014.5$1.442,914.1$2.945,901.1$3.3337,154.22,481.42,186.7$12.351,021.0$12.501,909.6$12.718,798.1255.94.0$6.503.0$7.00483.0$6.525,110.3478.8
Aug-063,014.5$1.443,447.6$3.305,488.5$3.0037,154.22,675.12,186.7$12.35930.5$12.601,870.7$12.718,798.1255.94.0$6.503.0$6.75497.2$6.315,110.3493.0
Sep-063,014.5$1.444,041.3$3.005,087.8$2.8037,154.22,295.32,186.7$12.35847.6$12.631,953.5$12.718,798.1255.94.0$6.504.6$6.50503.4$6.195,110.3500.8
Oct-063,014.5$1.444,258.0$2.755,368.3$2.7737,154.22,814.82,186.7$12.35818.3$12.702,316.7$12.718,798.1255.94.0$6.507.2$6.00513.6$6.025,110.3512.6
Nov-063,167.7$2.503,170.9$1.757,454.7$1.5037,319.23,577.83,298.4$5.671,023.5$5.802,057.8$5.848,831.5974.81.5$3.509.6$3.75672.0$3.665,072.2669.4
Dec-063,167.7$2.502,475.7$2.257,841.7$2.1837,319.23,170.53,298.4$5.671,015.1$5.842,018.8$5.848,831.5974.81.5$3.5011.0$3.50670.6$3.655,072.2669.7
Jan-073,167.7$2.502,756.5$2.457,780.6$2.7137,319.22,853.43,298.4$5.671,064.4$5.841,973.8$5.848,831.5974.81.5$3.5013.0$3.50673.0$3.605,072.2672.9
Feb-073,167.7$2.503,308.7$2.607,029.1$2.6737,319.22,876.63,298.4$5.67954.8$5.842,144.0$5.848,831.5974.81.5$3.5013.0$3.50672.3$3.615,072.2672.3
Mar-073,167.7$2.504,699.7$1.745,932.2$1.3437,319.23,673.83,298.4$5.67922.4$5.842,008.8$5.848,831.5974.81.5$3.5013.0$3.50672.3$3.615,072.2672.3
Apr-073,167.7$2.504,653.5$1.305,912.0$1.1037,319.23,817.93,298.4$5.67990.0$5.841,971.6$5.848,831.5974.81.5$3.5013.0$3.30672.3$3.615,072.2672.3
May-073,196.6$2.252,610.6$2.406,283.6$3.1637,228.32,618.71,894.0$12.371,099.1$12.343,125.4$12.729,058.3281.12.2$3.753.0$3.75450.3$7.255,056.3450.2
Jun-073,196.6$2.252,748.0$2.905,876.5$3.3937,228.32,485.61,894.0$12.371,194.4$12.372,951.5$12.729,058.3281.12.2$3.753.0$5.50353.1$8.785,056.3353.1
Jul-073,196.6$2.252,849.9$3.155,749.7$3.5237,228.32,407.61,894.0$12.371,088.3$12.373,073.0$12.729,058.3281.12.2$3.750.0$0.00451.5$7.235,056.3451.4
Aug-073,196.6$2.253,136.7$3.205,334.6$3.4337,228.32,462.41,894.0$12.371,092.6$12.373,153.8$12.729,058.3281.12.2$3.751.0$5.50454.0$7.225,056.3452.0
Sep-073,196.6$2.253,694.8$3.155,513.6$3.1437,228.32,631.61,894.0$12.371,161.0$12.373,037.9$12.729,058.3281.12.2$3.751.3$5.50455.6$7.175,056.3455.5
Oct-073,196.6$2.253,943.4$3.005,503.1$3.0337,228.32,698.21,894.0$12.371,251.1$12.372,942.8$12.729,058.3281.12.2$3.751.4$5.50455.7$7.175,056.3455.7
Nov-073,064.4$1.912,586.1$1.909,045.5$1.6036,819.23,503.7908.2$5.321,393.5$5.614,438.1$5.778,870.81,009.50.0$0.002.0$3.50631.5$4.314,972.5630.6
Dec-073,064.4$1.912,743.1$1.998,009.1$2.2236,819.23,149.2908.2$5.321,532.1$5.614,067.3$5.778,870.81,009.50.0$0.000.0$0.00635.9$4.274,972.5633.0
Jan-083,064.4$1.913,753.2$2.407,053.4$3.4036,819.22,477.3908.2$5.321,149.7$5.594,662.5$5.778,870.81,009.50.0$0.001.9$3.70640.3$4.204,972.5637.4
Feb-083,064.4$1.913,065.0$3.006,848.0$3.1836,819.22,602.7908.2$5.321,342.9$5.594,442.2$5.778,870.81,009.50.0$0.007.2$3.00645.1$4.074,972.5645.1
Mar-083,064.4$1.914,215.1$1.508,288.3$1.0536,819.23,818.1908.2$5.321,573.3$3.603,348.7$1.058,870.81,494.90.0$0.002.8$2.10648.5$4.024,972.5648.5
Apr-083,064.4$1.914,308.8$1.057,759.5$0.7536,819.23,989.6908.2$5.321,245.5$1.052,964.9$0.758,870.81,591.60.0$0.002.8$2.10648.8$4.014,972.5648.8
May-082,994.7$2.671,851.8$2.808,294.8$2.6036,632.53,080.6494.9$6.50903.4$6.524,987.2$5.538,910.6985.90.0$2.8021.8$2.80652.1$2.604,684.9650.8
Jun-082,994.7$2.672,460.9$2.897,684.7$2.9436,632.52,909.9494.9$6.501,620.2$5.403,745.8$6.038,910.6930.10.0$2.80110.5$2.89644.9$2.944,684.9583.3
Jul-082,994.7$2.671,972.8$3.008,324.1$2.8036,632.52,981.6494.9$6.50744.5$6.033,758.3$6.338,910.6896.90.0$2.80128.2$3.00653.4$2.804,684.9650.8
Aug-082,994.7$2.672,542.7$2.897,451.6$2.7036,632.53,030.1494.9$6.501,157.8$6.333,349.2$6.178,910.6914.80.0$2.8087.1$2.89657.4$2.704,684.9656.3
Sep-082,994.7$2.673,494.7$2.706,766.6$2.4536,632.53,156.4494.9$6.501,083.2$5.993,083.4$5.988,910.6935.70.0$2.8013.0$2.70659.4$2.454,684.9658.9
Oct-082,994.7$2.673,526.1$2.406,944.8$1.9336,632.53,418.3494.9$6.50604.4$5.913,230.1$5.838,910.6951.90.0$2.807.9$2.40668.7$1.934,684.9668.7
Attachment VII: November 1999 - October 2017 Installed Capacity Auction Activity
NYCANYCLIG-J Locality
CapabilityMonthly AuctionSpot Market **Minimum RequiredExcess SoldCapabilityMonthly AuctionSpot MarketMinimum RequiredExcess SoldCapabilityMonthlySpot MarketMinimum RequiredExcess SoldCapabilityMonthly AuctionSpot MarketMinimum RequiredExcess Sold
Period* (Strip)**Period* (Strip)Period*AuctionPeriod* (Strip)
(Strip)
MonthMWPriceMWPriceMWPriceMWMWMWPriceMWPriceMWPriceMWMWMW PriceMWPriceMWPriceMWMWMWPriceMWPriceMWPriceMWMW
Nov-082,810.1$1.772,596.0$1.609,114.6$1.0036,492.63,877.51,260.8$2.791,378.2$2.283,974.3$1.529,003.41,447.10.3$1.771.8$1.60772.8$1.004,566.1772.6
Dec-082,810.1$1.772,200.1$1.509,113.9$1.2536,492.63,752.11,260.8$2.79616.1$1.594,186.0$1.259,003.41,558.10.3$1.7710.0$1.50802.4$1.254,566.1802.2
Jan-092,810.1$1.772,987.3$1.508,448.2$3.1936,492.62,779.01,260.8$2.79846.5$1.514,151.0$3.199,003.41,579.90.3$1.77147.9$1.50847.0$3.194,566.1733.9
Feb-092,810.1$1.773,863.7$2.508,250.3$1.7736,492.63,492.11,260.8$2.791,021.1$3.063,729.9$1.779,003.41,592.00.3$1.7766.4$2.50821.1$1.774,566.1820.9
Mar-092,810.1$1.773,674.6$1.108,190.4$0.5036,492.64,128.21,260.8$2.79849.6$1.493,622.8$0.509,003.41,592.00.3$1.7797.0$1.10849.1$0.504,566.1816.9
Apr-092,810.1$1.773,991.3$0.508,257.2$0.3036,492.64,228.61,260.8$2.79588.0$0.753,755.6$0.309,003.41,586.60.3$1.7725.4$0.50821.1$0.304,566.1820.9
May-092,371.1$3.012,500.2$3.018,492.0$2.6136,362.43,216.7436.7$6.75757.9$7.004,976.3$8.728,855.3707.353.3$3.0169.5$3.01414.8$4.714,748.5410.4
Jun-092,371.1$3.013,034.3$3.508,675.3$4.2236,362.42,505.4436.7$6.751,447.7$8.603,854.3$8.658,855.3714.253.3$3.0141.5$3.50415.8$4.654,748.5415.8
Jul-092,371.1$3.013,915.6$4.117,495.4$4.4236,362.42,420.6436.7$6.751,623.8$8.712,930.4$8.478,855.3732.753.3$3.0170.6$4.11404.9$4.774,748.5404.8
Aug-092,371.1$3.014,459.5$4.197,242.4$3.4236,362.42,857.0436.7$6.751,281.0$8.522,960.2$8.458,855.3735.153.3$3.0167.6$4.19717.8$3.424,748.5717.8
Sep-092,371.1$3.014,413.9$3.497,393.3$2.7636,362.43,147.7436.7$6.75795.5$8.403,403.2$7.658,855.3816.453.3$3.0168.2$3.49742.9$2.764,748.5738.9
Oct-092,371.1$3.014,957.6$2.597,087.7$2.2336,362.43,380.5436.7$6.751,095.1$7.622,926.6$7.708,855.3811.153.3$3.0120.4$2.59749.3$2.234,748.5743.1
Nov-093,201.1$1.753,044.6$1.559,111.4$0.5035,785.34,081.4825.2$4.652,274.7$1.943,124.0$1.238,551.61,422.335.0$1.7531.0$1.55843.5$0.504,685.0843.3
Dec-093,201.1$1.753,125.0$1.308,472.6$0.7535,785.33,976.7825.2$4.65498.5$1.683,607.0$0.768,551.61,467.435.0$1.75113.1$1.30875.3$0.754,685.0842.3
Jan-103,201.1$1.753,765.0$1.648,871.7$1.8535,785.33,505.4825.2$4.65485.5$1.784,257.0$1.858,551.61,497.135.0$1.7582.0$1.64843.4$1.854,685.0843.3
Feb-103,201.1$1.753,948.2$2.568,406.4$3.4935,785.32,810.0825.2$4.65506.1$6.404,240.3$7.988,551.6782.035.0$1.7582.3$2.56843.3$3.494,685.0843.3
Mar-103,201.1$1.754,425.9$1.598,211.1$0.8535,785.33,933.4825.2$4.651,152.4$7.493,472.0$7.728,551.6807.335.0$1.7517.5$1.59843.3$0.854,685.0843.3
Apr-103,201.1$1.754,420.5$0.748,399.0$0.6435,785.34,021.8825.2$4.65945.5$7.503,468.4$7.168,551.6860.135.0$1.7579.5$0.74855.4$0.644,685.0843.3
May-102,868.1$2.474,462.0$2.707,827.0$3.5235,045.32,860.21,096.8$12.90335.7$13.334,004.2$13.538,336.0372.026.2$2.4716.8$2.70354.8$5.814,901.0354.0
Jun-102,868.1$2.474,521.8$2.758,863.7$2.1235,045.33,396.51,096.8$12.901,451.5$13.402,571.5$13.138,336.0403.626.2$2.4754.7$2.75829.0$2.125,021.0829.0
Jul-102,868.1$2.474,335.2$2.008,617.7$1.9135,045.33,475.31,096.8$12.90836.2$13.002,797.1$13.058,336.0412.126.2$2.4785.7$2.00816.9$1.915,021.0816.9
Aug-102,868.1$2.473,982.7$1.808,123.1$1.6835,045.33,563.71,096.8$12.90650.2$12.983,025.4$12.978,336.0418.726.2$2.4722.1$1.80851.2$1.685,021.0851.2
Sep-102,868.1$2.474,376.5$1.007,993.5$0.6335,045.33,964.31,096.8$12.90992.0$12.852,799.0$12.508,336.0457.826.2$2.478.4$1.00865.9$0.635,021.0865.9
Oct-102,868.1$2.474,178.9$0.458,165.3$0.4835,045.34,022.91,096.8$12.90882.1$12.452,838.5$12.728,336.0439.226.2$2.4725.7$0.45851.8$0.565,021.0851.8
Nov-102,820.1$0.394,179.3$0.279,383.4$0.0135,832.54,295.91,109.8$4.60829.9$4.754,571.0$4.298,737.51,179.51.2$0.396.1$0.27913.4$0.015,073.8913.3
Dec-102,820.1$0.394,173.1$0.108,433.9$0.5035,832.54,100.21,109.8$4.601,620.7$4.283,389.7$3.668,737.51,237.61.2$0.3917.7$0.10915.8$0.505,073.8913.3
Jan-112,820.1$0.393,272.7$0.659,786.2$0.5035,832.54,100.21,109.8$4.601,154.6$3.663,135.3$3.998,737.51,207.61.2$0.3947.1$0.65913.3$0.505,073.8913.3
Feb-112,820.1$0.393,848.7$0.458,839.8$0.6535,832.54,040.01,109.8$4.60736.7$4.253,516.2$3.578,737.51,245.81.2$0.3976.7$0.45913.3$0.655,073.8913.3
Mar-112,820.1$0.394,111.8$0.158,199.3$0.3035,832.54,180.11,109.8$4.60801.5$4.004,231.1$3.578,737.51,246.01.2$0.3975.9$0.15926.6$0.305,073.8913.3
Apr-112,820.1$0.394,450.5$0.208,448.2$0.1535,832.54,240.01,109.8$4.60800.7$3.823,509.6$3.328,737.51,269.11.2$0.3985.7$0.20918.4$0.155,073.8913.3
May-113,515.9$0.553,416.9$0.607,530.4$0.6534,684.43,911.1726.5$13.541,663.8$13.203,354.4$11.978,832.0462.41.2$0.5560.4$0.60895.3$0.655,051.7895.3
Jun-113,515.9$0.553,475.2$0.607,382.8$0.5534,684.43,948.7726.5$13.541,661.7$12.002,896.2$11.768,832.0482.31.2$0.5560.8$0.60904.5$0.555,051.7904.5
Jul-113,515.9$0.553,769.6$0.507,562.7$0.1534,684.44,104.2726.5$13.541,254.1$11.843,301.5$5.768,832.01,046.91.2$0.5535.6$0.50906.1$0.155,051.7904.5
Aug-113,515.9$0.553,922.3$0.167,786.3$0.0534,684.44,142.8726.5$13.54834.6$9.503,361.6$5.838,832.01,040.81.2$0.5532.5$0.16910.8$0.055,051.7908.3
Sep-113,515.9$0.553,832.0$0.107,936.4$0.1834,684.44,093.1726.5$13.54691.3$6.993,680.6$5.718,832.01,052.31.2$0.5558.5$0.10892.1$0.205,051.7890.0
Oct-113,515.9$0.554,200.8$0.107,384.2$0.1334,684.44,105.9726.5$13.54646.0$6.493,511.6$9.018,832.0883.01.2$0.5561.8$0.10900.9$0.135,051.7900.9
Nov-112,008.0$0.154,091.0$0.129,525.7$0.0634,778.94,147.41,031.2$2.701,089.8$3.004,279.6$0.508,833.01,550.73.6$0.1549.7$0.12900.7$0.064,989.3898.1
Dec-112,008.0$0.154,821.7$0.108,957.9$0.1034,778.94,130.01,031.2$2.70763.1$2.003,767.2$4.688,833.01,222.53.6$0.1548.2$0.10902.3$0.104,989.3898.1
Jan-122,008.0$0.155,072.3$0.159,513.6$0.5034,778.93,956.11,031.2$2.70647.3$4.003,886.5$4.918,833.01,205.03.6$0.1529.1$0.15923.7$0.504,989.3898.1
Feb-122,008.0$0.154,988.6$0.409,232.3$0.1834,778.94,095.21,031.2$2.701,020.3$4.803,172.1$4.878,833.01,208.13.6$0.1524.2$0.40900.4$0.184,989.3898.1
Mar-122,008.0$0.155,033.6$0.088,976.3$0.1034,778.94,130.01,031.2$2.70988.5$4.302,991.7$4.708,833.01,221.03.6$0.150.6$0.08922.2$0.104,989.3898.1
Apr-122,008.0$0.155,323.6$0.109,215.1$0.1034,778.94,130.01,031.2$2.70967.6$4.452,958.9$4.618,833.01,228.53.6$0.156.6$0.10921.4$0.104,989.3898.1
May-122,421.3$1.253,682.7$1.289,279.4$2.9135,076.32,970.8530.8$11.701,335.1$12.303,028.7$17.168,896.9288.82.5$1.4212.9$1.28877.2$2.914,961.1873.5
Jun-122,421.3$1.253,563.1$2.149,626.6$1.9435,076.33,386.1530.8$11.70596.6$15.653,991.5$11.548,896.9718.62.5$1.4213.7$2.14868.2$1.944,961.1868.2
Jul-122,421.3$1.255,070.0$1.458,508.7$1.9835,076.33,367.3530.8$11.701,074.6$11.853,397.6$10.958,896.9763.72.5$1.424.5$1.45609.3$3.564,961.1608.7
Aug-122,421.3$1.255,185.9$2.018,300.3$1.9035,076.33,401.0530.8$11.70858.5$11.393,234.6$10.648,896.9787.52.5$1.424.5$3.00616.0$3.564,961.1608.5
Sep-122,421.3$1.255,430.8$2.289,157.8$2.4035,076.33,190.1530.8$11.70572.9$10.743,230.1$10.478,896.9800.42.5$1.4213.9$3.50606.8$3.594,961.1606.8
Oct-122,421.3$1.255,783.6$2.387,906.1$2.4835,076.33,154.5530.8$11.70699.2$10.522,998.9$10.528,896.9796.72.5$1.4217.0$3.50607.5$3.584,961.1607.0
Nov-121,815.7$0.824,428.8$0.5412,143.0$0.7135,852.63,988.0275.1$4.501,093.6$3.004,579.7$3.369,057.31,364.428.4$2.250.4$0.54877.1$0.714,959.4876.7
Dec-121,815.7$0.824,696.1$1.1010,874.4$1.5035,852.63,636.9275.1$4.501,420.2$4.854,785.4$4.919,057.31,241.128.4$2.250.6$1.10891.8$1.504,959.4891.8
Jan-131,815.7$0.825,452.4$1.9810,063.0$3.4835,852.62,756.2275.1$4.502,202.4$4.893,851.5$4.919,057.31,241.128.4$2.257.7$1.98891.8$3.484,959.4891.8
Feb-131,815.7$0.825,684.1$3.029,372.0$2.6535,852.63,125.2275.1$4.502,398.4$4.943,521.2$4.919,057.31,241.128.4$2.2522.1$3.02892.7$2.654,959.4892.7
Mar-131,815.7$0.826,064.9$2.189,534.1$2.0935,852.63,372.6275.1$4.502,350.1$4.933,641.7$4.919,057.31,241.128.4$2.251.4$2.18892.7$2.094,959.4892.7
Apr-131,815.7$0.826,067.1$1.689,599.9$1.5035,852.63,634.2275.1$4.502,323.2$4.933,840.8$4.919,057.31,241.128.4$2.251.1$1.74892.7$1.504,959.4892.7
May-132,635.9$4.202,898.7$4.518,417.8$5.7635,466.81,817.2953.1$14.80931.1$15.504,065.1$16.299,325.0378.040.5$7.2010.2$6.00342.0$7.205,394.3340.3
Jun-132,635.9$4.203,486.2$5.757,704.8$6.0735,466.81,685.8953.1$14.801,250.1$16.153,796.8$16.459,325.0365.540.5$7.2020.2$5.91340.2$7.205,394.3340.2
Jul-132,635.9$4.203,908.6$5.767,298.2$5.7935,466.81,804.3953.1$14.801,447.0$16.303,553.8$16.109,325.0393.640.5$7.2034.8$6.11341.4$7.185,394.3341.4
Aug-132,635.9$4.204,048.4$5.707,056.5$5.6335,466.81,870.7953.1$14.801,513.6$15.993,533.5$15.809,325.0417.340.5$7.2045.4$6.06350.7$7.085,394.3350.7
Sep-132,635.9$4.204,160.1$5.496,709.4$5.6235,466.81,877.0953.1$14.801,107.0$15.723,923.9$15.669,325.0428.340.5$7.2051.4$5.97354.7$7.035,394.3354.7
Oct-132,635.9$4.204,238.3$5.556,812.1$5.9335,466.81,742.8953.1$14.801,269.8$15.703,790.9$16.119,325.0392.640.5$7.2052.7$6.09348.6$7.105,394.3348.6
Attachment VII: November 1999 - October 2017 Installed Capacity Auction Activity
NYCANYCLIG-J Locality
CapabilityMonthly AuctionS pot Market **Minimum RequiredExcess S oldCapabilityMonthly AuctionS pot MarketMinimum RequiredExcess S oldCapabilityMonthlyS pot MarketMinimum RequiredExcess S oldCapabilityMonthly AuctionS pot MarketMinimum RequiredExcess S old
Period* (S trip)**Period* (S trip)Period*AuctionPeriod* (S trip)
(S trip)
MonthMWPriceMWPriceMWPriceMWMWMWPriceMWPriceMWPriceMWMWMWPriceMWPriceMWPriceMWMWMWPriceMWPriceMWPriceMWMW
Nov-132,157.7$2.583,116.4$2.1511,895.7$2.0635,700.43,401.7431.1$7.54533.0$7.905,503.5$10.019,222.2878.430.6$4.009.4$3.10729.9$2.735,363.6728.9
Dec-132,157.7$2.583,040.5$2.9510,260.2$3.1035,700.42,953.8431.1$7.54946.7$9.904,515.1$9.689,222.2904.030.6$4.0067.7$2.95709.2$3.105,363.6702.4
Jan-142,157.7$2.583,873.3$3.909,173.5$4.5735,700.42,322.5431.1$7.541,273.9$9.604,274.1$9.639,222.2908.130.6$4.0073.6$3.90729.0$4.575,363.6729.0
Feb-142,157.7$2.583,832.5$4.308,922.0$4.2935,700.42,440.5431.1$7.541,524.0$9.523,783.4$9.569,222.2913.530.6$4.0082.3$4.30722.4$4.295,363.6722.1
Mar-142,157.7$2.584,472.5$3.008,925.2$2.8635,700.43,058.5431.1$7.541,749.2$9.493,592.2$9.729,222.2901.030.6$4.0026.8$3.00742.7$2.865,363.6742.7
Apr-142,157.7$2.584,563.7$1.9010,046.8$1.7435,700.43,535.5431.1$7.541,668.5$9.613,489.5$9.759,222.2898.830.6$4.0012.1$2.59745.1$2.555,363.6744.8
May-142,147.9$5.152,467.4$5.506,600.9$6.6835,812.41,345.3655.3$16.24516.9$16.544,645.8$18.839,470.568.410.7$6.3940.5$6.20298.5$6.685,430.5249.0476.1$9.96435.4$10.332,384.8$12.3813,494.981.8
Jun-142,147.9$5.152,995.1$6.606,458.0$6.2135,812.41,549.9655.3$16.241,239.6$18.723,383.6$18.849,470.567.810.7$6.3951.4$6.68290.0$6.445,430.5247.4476.1$9.96996.6$12.241,775.2$12.3513,494.986.0
Jul-142,147.9$5.153,817.3$6.215,920.2$6.1035,812.41,598.6655.3$16.241,608.1$18.713,082.1$18.699,470.581.210.7$6.3961.6$6.40287.8$6.465,430.5245.2476.1$9.961,150.8$12.251,611.1$12.3213,494.990.5
Aug-142,147.9$5.153,830.9$5.956,594.8$5.8035,812.41,734.3655.3$16.241,816.1$18.472,887.8$18.569,470.592.510.7$6.3963.6$6.40281.9$6.475,430.5244.3476.1$9.961,148.7$12.251,643.1$12.2513,494.9101.3
Sep-142,147.9$5.153,849.7$5.756,334.4$5.6035,812.41,819.9655.3$16.241,956.9$18.372,937.9$18.179,470.5125.910.7$6.3966.5$6.40288.7$6.475,430.5244.3476.1$9.961,339.2$12.101,650.9$12.0413,494.9135.3
Oct-142,147.9$5.154,460.5$5.497,060.7$5.3935,812.41,915.8655.3$16.241,955.7$18.193,051.0$17.949,470.5146.310.7$6.39102.0$6.40275.0$6.515,430.5239.4476.1$9.961,319.7$11.891,813.8$11.6413,494.9197.1
Nov-142,324.7$2.903,417.2$2.2410,141.2$1.4336,505.63,725.51,023.8$8.45930.4$8.694,356.8$8.969,508.6926.945.6$3.0019.9$2.85635.9$2.995,393.5635.9389.5$5.90675.1$6.623,236.9$5.7613,582.31,121.1
Dec-142,324.7$2.903,575.8$2.568,544.1$3.5036,505.62,773.51,023.8$8.451,292.6$8.893,800.2$8.879,508.6934.445.6$3.0019.9$2.95636.2$3.505,393.5636.2389.5$5.90802.8$5.453,275.9$4.7613,582.31,281.0
Jan-152,324.7$2.903,320.2$3.619,299.0$2.4136,505.63,275.51,023.8$8.451,314.3$8.823,754.6$8.809,508.6940.745.6$3.00230.4$3.61613.4$3.205,393.5612.7389.5$5.90607.4$4.443,142.8$3.7613,582.31,438.9
Feb-152,324.7$2.903,641.3$2.608,452.9$3.3636,505.62,837.41,023.8$8.451,477.9$8.743,572.7$8.949,508.6928.345.6$3.0042.7$3.15644.0$3.365,393.5643.2389.5$5.90556.4$3.762,919.2$4.2113,582.31,367.7
Mar-152,324.7$2.904,372.2$1.809,956.8$0.7236,505.64,051.91,023.8$8.451,567.1$8.703,487.4$7.289,508.61,074.045.6$3.0034.4$2.90652.0$2.875,393.5650.0389.5$5.90726.0$3.973,368.3$2.9313,582.31,571.5
Apr-152,324.7$2.904,489.9$0.458,546.3$0.7536,505.64,036.21,023.8$8.451,820.6$7.253,313.8$7.309,508.61,072.145.6$3.0035.1$2.77644.7$2.925,393.5644.7389.5$5.90791.0$2.893,308.7$2.8213,582.31,588.1
May-152,108.4$3.501,977.6$3.968,381.6$4.0735,919.82,533.7548.6$15.50986.5$15.613,992.0$16.049,271.7354.220.0$5.3042.9$5.30339.7$5.785,284.0327.2723.0$8.50227.6$10.502,617.1$10.9313,934.4356.1
Jun-152,108.4$3.502,981.6$4.217,997.7$4.8835,919.82,178.1548.6$15.501,648.1$15.663,369.2$15.419,271.7405.820.0$5.3056.7$5.74328.1$5.775,284.0328.1723.0$8.50462.8$10.742,351.8$10.5613,934.4413.6
Jul-152,108.4$3.502,847.4$4.708,227.6$3.9835,919.82,570.7548.6$15.501,822.0$15.353,206.2$15.269,271.7418.020.0$5.3057.4$5.67328.7$5.775,284.0328.7723.0$8.50445.0$10.342,756.6$8.3613,934.4762.7
Aug-152,108.4$3.503,036.0$3.918,611.2$3.5835,919.82,744.9548.6$15.501,781.3$15.403,321.0$15.329,271.7413.520.0$5.3057.4$5.67327.8$5.775,284.0327.8723.0$8.501,061.0$8.342,078.7$8.3213,934.4769.1
Sep-152,108.4$3.503,410.3$3.508,650.2$3.4835,919.82,792.5548.6$15.501,759.2$15.363,542.6$15.269,271.7418.020.0$5.3057.4$5.74344.7$5.625,284.0344.7723.0$8.501,045.2$8.362,077.8$8.2713,934.4776.9
Oct-152,108.4$3.503,392.1$3.098,218.0$2.9635,919.83,017.9548.6$15.501,794.5$15.323,509.4$15.019,271.7438.620.0$5.3060.4$5.60345.7$5.615,284.0345.7723.0$8.501,100.3$8.392,100.9$8.1313,934.4799.5
Nov-151,806.5$1.252,404.5$0.6611,055.6$0.4635,715.54,087.3631.2$6.67996.1$6.654,166.1$6.368,916.11,122.912.0$1.6434.2$1.55866.1$1.825,215.8747.0400.5$3.73434.4$3.783,872.5$3.4613,538.11,512.3
Dec-151,806.5$1.252,994.1$1.2510,170.9$1.2835,715.53,731.2631.2$6.67958.0$6.404,203.8$6.298,916.11,128.012.0$1.6463.6$1.80764.9$1.855,215.8743.9400.5$3.73578.5$3.473,678.2$3.4813,538.11,509.3
Jan-161,806.5$1.252,969.7$1.6510,663.8$1.3735,715.53,694.4631.2$6.671,088.6$6.244,187.9$5.858,916.11,161.512.0$1.6475.4$1.80776.0$1.555,215.8776.0400.5$3.73698.8$3.443,413.8$3.1613,538.11,557.4
Feb-161,806.5$1.252,968.2$1.3410,383.8$1.4635,715.53,655.7631.2$6.671,122.1$6.104,100.1$5.848,916.11,162.312.0$1.6474.9$1.50777.4$1.535,215.8777.4400.5$3.73794.6$3.203,322.5$3.1513,538.11,558.4
Mar-161,806.5$1.253,201.7$0.6010,933.4$0.5435,715.54,052.7631.2$6.671,042.2$6.044,220.6$5.818,916.11,164.312.0$1.6474.4$1.50783.1$1.525,215.8778.6400.5$3.73820.1$3.163,337.5$3.1413,538.11,560.7
Apr-161,806.5$1.253,154.5$0.4010,780.6$0.5835,715.54,037.0631.2$6.671,063.1$5.954,189.5$5.658,916.11,176.212.0$1.6470.4$1.40775.3$1.605,215.8771.0400.5$3.73832.0$3.163,365.1$3.0313,538.11,576.7
May-161,823.9$3.622,607.6$3.838,971.6$5.2735,429.82,058.0581.0$10.99800.8$11.154,091.6$12.418,589.0650.030.0$4.1531.3$4.00489.2$5.275,207.2480.3375.5$8.25608.8$8.402,837.6$9.3613,514.5649.4
Jun-161,823.9$3.622,887.1$5.159,078.1$4.8935,429.82,214.7581.0$10.991,024.2$12.383,986.1$12.298,589.0658.530.0$4.15188.8$5.15456.8$4.895,207.2445.5375.5$8.25917.0$9.362,548.6$9.2813,514.5661.4
Jul-161,823.9$3.623,373.7$4.709,316.6$4.2735,429.82,471.4581.0$10.991,172.0$12.273,731.5$12.228,589.0663.630.0$4.1540.3$4.75482.5$4.375,207.2479.9375.5$8.25890.2$9.272,397.2$9.2513,514.5665.1
Aug-161,823.9$3.623,330.1$4.159,752.3$3.6435,429.82,736.0581.0$10.991,217.5$12.183,714.0$12.218,589.0664.430.0$4.1536.3$4.35477.0$4.425,207.2474.1375.5$8.25842.1$9.252,427.8$9.2313,514.5668.6
Sep-161,823.9$3.623,434.3$3.419,949.6$3.3235,429.82,870.0581.0$10.991,230.6$12.143,661.4$12.198,589.0666.030.0$4.1597.1$4.20477.9$4.465,207.2470.3375.5$8.25807.1$9.143,938.0$9.1513,514.5679.7
Oct-161,823.9$3.623,605.8$2.8410,128.3$3.1235,429.82,952.9581.0$10.991,155.4$12.153,905.6$12.148,589.0669.230.0$4.1544.9$4.19486.7$4.345,207.2483.0375.5$8.25775.2$9.102,729.2$9.1613,514.5678.5
Nov-161,624.4$0.752,384.7$0.4911,961.3$0.3536,354.84,208.8633.9$3.50590.7$3.505,218.9$3.698,977.31,456.430.0$1.2510.0$0.50958.8$0.355,258.3927.5230.6$3.50201.5$3.504,316.5$3.6913,827.11,506.1
Dec-161,624.4$0.752,504.7$0.8011,793.8$0.5536,354.84,123.1633.9$3.50750.5$3.655,161.9$3.638,977.31,458.730.0$1.2542.2$0.81937.4$0.555,258.3933.6230.6$3.50403.5$3.454,101.3$3.6313,827.11,514.8
Jan-171,624.4$0.753,413.7$0.8511,767.5$0.3236,354.84,223.8633.9$3.50889.0$3.594,883.5$3.538,977.31,470.030.0$1.2541.7$0.97938.6$0.325,258.3934.7230.6$3.50536.6$3.504,293.0$3.5313,827.11,530.4
Feb-171,624.4$0.753,020.0$0.3911,572.2$0.5436,354.84,125.8633.9$3.50994.6$3.504,754.8$3.478,977.31,470.030.0$1.2547.7$0.60936.5$0.545,258.3932.1230.6$3.50574.8$3.404,281.9$3.4713,827.11,539.1
Mar-171,624.4$0.752,725.1$0.2011,693.4$0.7136,354.84,049.2633.9$3.50982.5$3.464,796.4$3.308,977.31,499.830.0$1.25127.5$0.20933.7$0.715,258.3896.6230.6$3.50600.1$3.144,278.5$3.3013,827.11,565.0
Apr-171,624.4$0.752,689.9$0.2512,720.6$0.3536,354.84,209.1633.9$3.501,016.3$3.244,826.0$3.258,977.31,500.330.0$1.2579.4$0.30931.6$0.355,258.3929.2230.6$3.50520.7$3.244,585.1$3.2513,827.11,572.8
May-172,235.7$3.002,405.4$3.159,864.2$1.7235,512.83,529.2616.4$11.71594.0$11.834,562.6$10.579,095.4747.978.3$5.7930.3$5.75485.0$6.715,302.5478.7503.1$10.50361.4$10.503,218.6$10.2813,621.8730.8
Jun-172,235.7$3.002,895.2$2.418,775.0$3.8935,512.82,604.4616.4$11.71717.3$10.555,389.7$10.249,095.4776.078.3$5.7933.3$6.50485.9$6.695,302.5480.3503.1$10.50392.9$10.253,227.8$10.0113,621.8765.4
Jul-172,235.7$3.002,956.4$3.1510,314.2$2.2635,512.83,299.0616.4$11.71797.5$10.254,452.4$9.869,095.4807.378.3$5.7930.9$6.55486.1$6.695,302.5480.2503.1$10.50535.5$9.943,489.0$9.7513,621.8798.4
Aug-172,235.7$3.003,375.5$2.2410,152.7$2.1835,512.83,331.5616.4$11.71954.1$9.904,359.9$9.859,095.4808.778.3$5.7960.8$6.68486.8$6.675,302.5482.0503.1$10.50571.1$9.733,473.6$9.6913,621.8806.0
Sep-172,235.7$3.003,640.9$2.0910,006.4$2.1835,512.83,332.7616.4$11.711,067.7$9.854,314.5$10.199,095.4779.578.3$5.7956.9$6.55492.5$6.595,302.5487.6503.1$10.50631.1$9.673,452.7$9.9013,621.8779.2


Oct-172,235.7$3.003,689.6$1.8510,333.9$1.8435,512.83,476.9616.4$11.711,094.8$9.904,276.0$9.559,095.4834.178.3$5.7956.9$6.43491.8$6.605,302.5486.9503.1$10.50620.5$9.683,530.9$9.4713,621.8834.3