10 Krey Boulevard Rensselaer, NY 12144
June 1, 2015
Hon. Kimberly D. Bose, Secretary
Federal Energy Regulatory Commission 888 First Street, NE
Washington, DC 20426
Re: New York Independent System Operator, Inc., Informational Report, Docket
No. AD14-6-00_
Dear Secretary Bose:
In accordance with Paragraph 23 and the ordering paragraph of the Commission’s
November 15, 2014 Order on Technical Conference (“November Order”),1 the New York
Independent System Operator, Inc. (“NYISO”) respectfully submits this informational report
(“Report”). The November Order directed the “NYISO to explore the issues and evaluate the
proposals discussed at the conference, including the MMU’s recommendations, through its
stakeholder process and file an informational report.”2 This Report describes the various
stakeholder meetings convened, and review process conducted, by the NYISO after the February 26, 2014 Technical Conference3 (“Technical Conference”). The issues discussed in this Report include “whether or not to model Load Zone K as an export-constrained zone for a future ICAP Demand Curve reset proceeding.4 It also discusses whether a proposal can be developed that
could reduce the cost of procuring capacity while meeting the NYISO loss of load (“LOLE”)
objective, as well as other proposals made by the NYISO, the independent Market Monitoring
Unit (“MMU”), and stakeholders at the Technical Conference.
Several related issues were raised by stakeholders at the Technical Conference and in
their written comments. In addition to modeling Load Zone K5 as an export constrained zone,
1 New York Indep. Sys. Operator, Inc., 149 FERC ¶ 61,164 (2014) (“November Order”).
2 Id. at P 23.
3 See New York Indep. Sys. Operator, Inc., Notice of Technical Conference, Docket No. AD14-6-
000 (Jan. 28, 2014), Supplemental Notice of Technical Conference (Feb. 14, 2014), (collectively, the “Technical Conference Notice”).
4 November Order at P 2, citing certain NYISO pleadings in Docket No. ER13-1380 and the
August 13, 2013 order in that proceeding, New York Indep. Sys. Operator, Inc .,144 FERC ¶ 61,126 at
P 20.
5 Capitalized terms not defined herein have the meaning set forth in the NYISO’s Market
Administration and Control Area Services Tariff (“Services Tariff”) and if not defined therein, then in the Open Access Transmission Tariff (“OATT”).
Hon. Kimberly D. Bose, Secretary June 1, 2015
Page 2
stakeholders raised issues regarding the methodology to determine the Locational Minimum Installed Capacity Requirements (“LCRs”); rules to eliminate Localities or achieve price
convergence; enhancements to the triggers for creating and “pre-defining” capacity zones (i.e., Localities), and a capacity Deliverability right for transmission projects that increase the
deliverability of a constrained interface.
I.DOCUMENTS SUBMITTED
In support of this filing, the NYISO respectfully submits the following documents that
were provided to stakeholders in 2014 and to date in 2015 as part of the discussions with them:
1. Capacity Zone (Locality) Elimination, presented by the NYISO, at the October 30,
2014 joint meeting of the Market Issues Working Group and ICAP Working Group (“Attachment I”) (also available at:
<http://www.nyiso.com/public/webdocs/markets_operations/committees/bic_miwg/m
eeting_materials/2014-10-30/Capacity_%20Zone_%20Elimination_Final_103014.pdf
>).
2.Capacity Zone (Locality) Pre-Define & Eliminate, presented by the NYISO, at the
November 17, 2014, ICAP Working Group meeting (“Attachment II”) (also available
at:
<http://www.nyiso.com/public/webdocs/markets_operations/committees/bic_icapwg/
meeting_materials/2014-11-
17/Predefine_Eliminate_Capacity%20Zone_Nov17_Final.pdf>).
3. Treatment of Zone K Export Constraints into the G-J Locality: Market Design
Concept, presented by the NYISO, at the December 18, 2014 joint meeting of the
Market Issues Working Group and ICAP Working Group (“Attachment III”) (also
available at:
<http://www.nyiso.com/public/webdocs/markets_operations/committees/bic_miwg/m
eeting_materials/2014-12-
18/agenda%203%20NCZ%20_%20Export%20Constrained%20Zones.pdf>).
4. Numeric Example posted by the NYISO with stakeholder meeting materials on its
website, on February 19, 2015 (“Attachment VII”) (also available at:
<http://www.nyiso.com/public/webdocs/markets_operations/committees/bic_miwg/m
eeting_materials/2014-12-18/Numerical%20Example%20for%20the%2012-18-
2014%20Presentaion%20regarding%20Treatment%20of%20Zone%20K%20Export %20Constraints2.pdf>).
5. 2013 State of the Market Report Recommendation to Enhance Locational Pricing in
the Capacity Market, presented by Pallas Lee Van Schaick of Potomac Economics at
Hon. Kimberly D. Bose, Secretary June 1, 2015
Page 3
the August 20, and November 14, ICAP Working Group Meeting (“Attachment V”) (also available at:
<http://www.nyiso.com/public/webdocs/markets_operations/committees/bic_icapwg/
meeting_materials/2014-11-14/Capacity_2013%20SOM__8172014.pdf>).
6. Compliance with FERC Order on Technical Conference re: Treatment of Zone K
Export Constraints into the G-J Locality, presented by the NYISO, at the February
24, 2015 ICAP Working Group meeting (“Attachment VI”) (also available at:
<http://www.nyiso.com/public/webdocs/markets_operations/committees/bic_icapwg/
meeting_materials/2015-02-
24/agenda%203%20Export%20Constrained%20Zones_ICAPWG%202-24-
15_Final.pdf>).
7. IRM/LCR Process and Dynamics, presented by Mark Younger, Hudson Energy
Economics, at the January 29, 2015 joint meeting of the Market Issues Working Group, ICAP Working Group, and the Price Responsive Load Working Group (“Attachment VII”) (also available at:
<http://www.nyiso.com/public/webdocs/markets_operations/committees/bic_miwg/m
eeting_materials/2015-01-
29/agenda%208%20IRM%20LCR%20Process%20Dynamics.pdf>).
8. LCR Process Review; Setting of the IRM and LCRs: the Basic Process; and LCR
Process Review: Next Steps; presented by the NYISO at the March 5, 2015 meeting
of the LCR Task Force (collectively, “Attachment VIII”) also available at:
˂http://www.nyiso.com/public/webdocs/markets_operations/committees/bic_icapwg_
lcrtf/meeting_materials/2015-03-05/02_LCR%20Alternative%20for%20Kick-
off%20meeting.pdf˃, ˂
http://www.nyiso.com/public/webdocs/markets_operations/committees/bic_icapwg_l
crtf/meeting_materials/2015-03-05/03_Background%20Slides_IRM_LCR.pdf˃; ˂
http://www.nyiso.com/public/webdocs/markets_operations/committees/bic_icapwg_l
crtf/meeting_materials/2015-03-05/04_LCR%20Process%20Next%20Steps.pdf˃.
9. Objective of LCR Methodology Review: Possible Alternatives, presented by the
NYISO at the April 8, 2015 meeting of the LCR Task Force (“Attachment IX”) (also available at:
˂http://www.nyiso.com/public/webdocs/markets_operations/committees/bic_icapwg_
lcrtf/meeting_materials/2015-04-
08/LCR%20Objective_Possible%20Alternatives.pdf>).
Hon. Kimberly D. Bose, Secretary June 1, 2015
Page 4
II.BACKGROUND
On April 30, 2013, the NYISO filed revisions to its Services Tariff and its Open Access Transmission Tariff (“OATT”) to establish a new Locality that would encompass Load Zones G, H, I, and J but exclude Load Zone K (“the G-J Locality”).6 In that proceeding, certain parties argued that Load Zone K should have been included in the G-J Locality based on assertions that capacity located in Load Zone K could provide some level of support to Load Zones G, H, and I. Some parties also suggested that to the extent that Load Zone K warranted special consideration, it should be modeled as an “export-constrained” Load Zone.7
The Commission accepted the NYISO’s proposal to establish the G-J Locality (without
including Load Zone K.)8 It also directed the Commission’s staff to convene a technical
conference, in a separate proceeding, “to discuss with interested parties whether or not to model
Load Zone K as an export-constrained zone for a future ICAP Demand Curve reset proceeding.”9
The Technical Conference was established to principally discuss whether and how to
model Load Zone K as an export-constrained zone, including whether and how to determine the
MW limit to be placed on capacity located in Load Zone K that can be relied upon to serve the
needs of Load Zones G through J.10 At the Technical Conference, various other issues were
discussed that were related to, but that extended beyond the issues outlined in the Technical
Conference Notice. These additional issues are described above. Multiple parties submitted
post-conference comments that largely reiterated the discussion at the Technical Conference,
many of which had been previously raised in the NYISO’s stakeholder process. The NYISO’s
post-conference comments suggested that the Commission should permit it to continue exploring
those issues and proposals through its stakeholder process.11 The NYISO explained that a
stakeholder process would:
[A]llow the NYISO to consider the process for setting [Locational Minimum
Installed Capacity Requirements (“LCRs”)] and how it may be adapted to
properly reflect export constrained aspects of Localities as well as the treatment of export constrained aspects of Localities in the auction clearing mechanism.
6 New York Indep. Sys. Operator, Inc., Proposed Tariff Revisions to Establish and Recognize a New Capacity Zone and Request for Action on Pending Compliance Filing, Docket No. ER13-1380-000 (April 30, 2013) (“April 2013 Filing”).
7 See November Order at P 2, describing the NYISO’s position in, and other parties’ positions on, the April 2013 Filing. See also New York Indep. Sys. Operator, Inc., 144 FERC ¶ 61,126 (2013) (“August 2013 Order”) at PP 32 - 51.
8 August 2013 Order at PP 52 - 55.
9 Id. at P 56.
10 Technical Conference Notice.
11 Post-Technical Conference Comments of the New York Indep. Sys. Operator, Inc., Docket No. AD14-6-000 (March 26, 2014).
Hon. Kimberly D. Bose, Secretary June 1, 2015
Page 5
Further, it would give the NYISO time to continue to consider the potential
development of alternative rules to pre-define and eliminate capacity zones. It
would not risk displacing other priority projects, including those that are being
undertaken in response to earlier Commission compliance mandates or high
priority recommendations by the [MMU] for the NYISO. Providing the
stakeholder process time to function would give the NYISO and its stakeholders
experience with G-J Locality pricing before completing the evaluation and
considering a decision on export constraint modeling. A stakeholder process
would also permit the NYISO to consider changes to modeling rules in tandem
with the triennial process for evaluating and potentially creating New Capacity
Zones.12
The NYISO asked the Commission to delay further action until it had conducted stakeholder discussions and proposed to submit a report by June 1, 2015.13
The November Order accepted the NYISO’s proposal. It concluded that:
[I]t would be worthwhile for NYISO and its stakeholders to explore whether a
proposal can be developed that could reduce the cost of procuring capacity while
meeting the NYISO LOLE objective. Therefore, we accept NYISO’s
recommendation to conduct a stakeholder process and to file a report on this
process by June 1, 2015. While we agree with NYISO that it is premature to
require it to file tariff language by June 1, 2015, we believe that valuable market
rule changes that could reduce costs should not be unduly delayed. Accordingly,
the Commission orders NYISO to explore the issues and evaluate the proposals
discussed at the conference, including the MMU’s recommendations, through its
stakeholder process and file an informational report with the Commission by June
1, 2015.14
III. THE EXPLORATION OF ISSUES AND EVALUATION OF PROPOSALS
THROUGH THE STAKEHOLDER PROCESS
A summary of the steps that the NYISO has taken to consider, analyze, and address
several of the issues raised during the Technical Conference, with the MMU and stakeholders follows below. The stakeholder discussions have illustrated that there are disparate stakeholder interests and concerns. Further consideration through the stakeholder process would allow the NYISO and stakeholders to better assess the benefits and detriments of changes, how those changes might affect other NYISO market initiatives.
12 Id. at 3-4.
13 Id. at 5.
14 Order on Technical Conference at P 23.
Hon. Kimberly D. Bose, Secretary June 1, 2015
Page 6
Prior to the issuance of the November Order, based on consideration and input from the MMU and its stakeholders, the NYISO had already made it a priority to conduct three discrete
projects in 2014 in order to address issues raised at the Technical Conference. The NYISO
committed to lead further stakeholder discussions regarding (i) market design concepts regarding whether and how to model export constraints in the ICAP Spot Market Auction, (ii) market
design concepts regarding the elimination Localities, and (iii) market design concepts that would lead to pre-defined capacity zones.15
(i)Eliminating Localities
On October 30, 2014, the NYISO presented to and discussed with stakeholders at a joint meeting of its Market Issues Working Group and its ICAP Working Group, whether there is a need for, and potential issues associated with, the concept of eliminating Localities. The NYISO presented background information on why locational capacity is valued in some areas.16 It also discussed some of the challenges and concerns that would arise and need to be addressed in
association with designing a rule set to eliminate a Locality.
Stakeholders expressed disparate views on the concept. End user interests and some
transmission owners recommended that the NYISO consider a change to the current NCZ Study;
i.e., the process, methodology, and parameters used to evaluate the need for a New Capacity
Zone. Their suggestions included having the NYISO monitor the binding interface that gave rise
to the creation of a Locality in order to identify when it was no longer binding. They also argued
that because the NCZ Study, which examines Deliverability, would identify the need for an NCZ
if one MW is constrained at an interface, there should be a rule that the Locality should be
eliminated when the constraint at the interface is relieved by one MW or more. The NYISO
evaluated that proposal and informed stakeholders that it would create the potential for turning
the Locality “on” and “off” thereby creating significant market uncertainty. That uncertainty
includes issues surrounding projects subject to a buyer-side mitigation Offer Floor, the effect on
sales in the Capability Period Auction and Monthly Auction, and price signals to developers and
investors of proposed, under-development, and existing capacity resources. Several stakeholders
agreed with the NYISO’s assessment. There was also discussion of a need to limit the frequency
and add predictability to a design to eliminate Localities, and potential opportunity to ensure an
accurate price signal.
Based on the stakeholder discussions and analysis, and potential opportunity to ensure an
accurate price signal, to advance consideration of eliminating Localities, the NYISO proposed
that a rule should provide that the Locality be eliminated if the binding interface is relieved with
sufficient Deliverability Headroom such that it would not be expected to bind again (at least for
some foreseeable length of time, which would need to be determined) once the Locality was
15 NYISO, 2014 Business Plan Highlights pp , 8, and 9, available at:
<http://www.nyiso.com/public/webdocs/company/strategic_plan/2014_nyiso_businessplanhighlights_fina
l.pdf>
16 See Attachment I.
Hon. Kimberly D. Bose, Secretary June 1, 2015
Page 7
eliminated. The NYISO also suggested that price convergence might be a preferable trigger for eliminating Localities.
In response, some stakeholders indicated a preference for pursuing eliminating Localities
as opposed to defining under what circumstances price separation should cease. Stakeholders
from the supply sectors indicated more effort should be focused on whether there was even a
need to eliminate Localities and if doing so would jeopardize reliability. Other stakeholders
rejected that suggestion and argued that because only a Deliverability criterion is used to identify
the need for an NCZ, the same criterion should be applied to identifying when to eliminate
Localities. Some representatives of capacity suppliers expressed their continued support for the
concept of pre-defining capacity zones. It was clear from the responses that a large number of
stakeholders that provided input thought that the current Deliverability construct for creating
NCZs possibly should include an additional criterion, and should be re-evaluated as part of the
discussion on rules to eliminate Localities.
(ii) Eliminating Localities and Pre-Defining Capacity Zones
After further analysis and consideration of stakeholder input, at a November 17, 2014
ICAP Working Group meeting the NYISO presented further information and led a discussion of potential market design concepts for pre-defining and eliminating Localities.17 The NYISO
presented some information regarding PJM Interconnection LLC (“PJM”) rules for predefining and eliminating its capacity zones; and discussed possible options for the NYISO. The NYISO and stakeholders also reviewed and discussed potential bulk system or market triggers for
eliminating Localities, and issues that would arise if they are eliminated, including how they
might be compounded or lessened depending on the frequency of the elimination determinations. Many of the issues previously raised by stakeholders, at the Technical Conference and at the October 30 ICAP Working Group meeting were further discussed.
Load interests indicated that in the near-term, price convergence should not be considered
as the criterion for eliminating a Locality because with the current market structure, it is unlikely
to occur. They suggested that the existing market structure be retained and that the trigger for
eliminating Localities be an appropriate amount of Highway interface Headroom with a buffer
(to be defined.) They further suggested that such a criterion for elimination would need to be
balanced with a similar creation rule, and that the rule would also need to consider and balance
reliability and higher costs.
Some suppliers commented that satisfying the Deliverability constraints may not ensure
reliability in a Locality that has load pockets, or where there is significant uncertainty of capacity
remaining in service. They cautioned that the magnitude of headroom used as the criteria to
eliminate a Locality be sufficiently large to ensure reliability. Similarly, they suggested that the
NYISO should apply that same parameter when creating new Localities in order to avoid
reliability problems caused by unexpected loss of capacity. Price convergence was again
17 See Attachment II.
Hon. Kimberly D. Bose, Secretary June 1, 2015
Page 8
suggested as an alternative, including using price convergence as the criteria to trigger
eliminating Localities. The NYISO was asked to consider a rule to achieve price convergence by shifting the zero crossing point on the ICAP Demand Curve. A representative of load interests expressed disagreement with that proposal.
It was apparent to the NYISO that there was no consensus on the concepts surrounding
rules to eliminate and create Localities. This discussion was also part of the NYISO Budget
Priorities Working Group, where stakeholders expressed disagreement between whether the
project to discuss rules to eliminate capacity zones should be separate or combined with a project
to discuss concepts surrounding pre-defining capacity zones. As discussed below, the Budget
Priorities Working Group process did keep these two projects separated. Based on stakeholder
input received through that process, the NYISO prioritized a project for 2015 reviewing concepts
for eliminating Localities.
(iii) Load Zone K Export Constrained Capacity
At the joint meeting of the Market Issues Working Group and the ICAP Working Group
on December 18, 2014 the NYISO led a discussion for a market design concept to model the
excess capacity that cleared in the Load Zone K ICAP Spot Market Auction as part of the supply
stack in the G-J Locality ICAP Spot Market Auction, up to the level of the export constraint.18
The NYISO provided background on the existing ICAP auction pricing hierarchy rules and
mechanics. The proposed market design concept was based on the concept the NYISO had
introduced at the Technical Conference. Under the proposed concept, the NYISO would solve
the ICAP Spot Market Auction as it does today, with one change. That is, the NYISO would (a)
count the MW that clear above the Load Zone K LCR,19 up to the Load Zone K export limit
MW, toward the G-J LCR and (b) count the remaining MW in Load Zone K that clear above the
Load Zone K LCR (i.e. those above the export limit) toward the NYCA Minimum Unforced
Capacity Requirement (“NYCA Minimum Requirement”). This approach would recognize the
reliability value to the G-J Locality of excess MW of capacity in Load Zone K above the LCR
target, up to the Load Zone K export limit. It would also lower the total cost of capacity. This
approach could reduce costs to loads in the G-J Locality without raising costs to loads in Load
Zone K. Because of its relative simplicity compared to other concepts proposed at the Technical
Conference, the NYISO suggested at this stakeholder meeting that it potentially could be
implemented prior to the next ICAP Demand Curve reset.20
18 See Attachment III.
19 LCR in this context refers to the Locational Minimum Unforced Capacity Requirement. That amount is derived from the Locational Minimum Installed Capacity Requirement. For simplicity in this Report, the NYISO is referring to both as the “LCR.”
20 That timing would depend on the timing of when the proposal became an established rule in
relation to when the ICAP Demand Curve reset independent consultant had an opportunity to consider
fully the implications in its report. It also would depend on whether necessary software revisions could
Hon. Kimberly D. Bose, Secretary June 1, 2015
Page 9
Stakeholders expressed little support for this concept. Some stakeholders representing suppliers raised questions regarding the application of buyer-side capacity market mitigation
rules, and were skeptical that the market design concept could be confined to modifying only the auction rules without modifying the NYISO’s process for setting LCRs. They also commented that NYISO’s proposal would not provide proper price signals for capacity to locate in Long
Island. Representatives of load interests were interested in discussing issues further so they
could better evaluate the proposal, and also whether excess capacity in Load Zone K should also be recognized in all Load Zones with which it has ties.
In response to requests from stakeholders, the NYISO posted on its website a detailed
numerical example to further illustrate the Load Zone K export concept it had presented at the
December 18 stakeholder meeting.21 The example shows how the ICAP Spot Market Auction
would clear under the proposal. The NYISO presented the proposal at the February 24, 2015
meeting of the ICAP Working Group. Stakeholders were afforded the opportunity to discuss the
example in detail, and to raise any questions regarding it and the related market design concept
proposal. No stakeholder expressed an interest in the NYISO doing either. Therefore, the
NYISO did not pursue the discussion. Since the posting of the numerical examples, some load interests have indicated that they would like to see this discussion brought back to the
stakeholder process for further review and evaluation. The NYISO will be considering with its stakeholders whether to prioritize that project in the NYISO’s 2016 business plan.
(iv) The MMU’s Locational Capacity Framework
The MMU’s 2013 Annual State of the Market Report 22 included in its list of
recommendations for the NYISO certain capacity market enhancements. The MMU further
recommended that the NYISO “create a dynamic and efficient framework for reflecting
locational planning requirements, including three key aspects: a) Pre-define interfaces/zones that
address potential resource adequacy needs and highway deliverability constraints to allow prices
to accurately reflect the locational value of capacity; b) Grant internal capacity deliverability
rights between zones when private investors upgrade transmission into a local area; c) Modify
demand curve reset methodology to minimize the cost of satisfying planning requirements.”23
These recommendations built on the MMU’s comments at the February Technical Conference.
be deployed in time for the start of the Capability Year to which new ICAP Demand Curves would apply (May 1, 2017).
21 See Attachment IV.
22 Potomac Economics, Ltd., 2013 State of the Market Report for the New York ISO Markets (May 2014) (“2013 State of the Market Report”), available at:
˂http://www.nyiso.com/public/webdocs/markets_operations/documents/Studies_and_Reports/Reports/M
arket_Monitoring_Unit_Reports/2013/2013%20State%20of%20the%20Market%20Report.pdf˃.
23 See Attachment V.
Hon. Kimberly D. Bose, Secretary June 1, 2015
Page 10
When the MMU initially discussed its 2013 State of the Market Report recommendations,
stakeholders requested that the MMU further discuss this capacity market framework at a
separate ICAP Working Group meeting due to its complexity. At two separate ICAP Working
Group meetings, on August 20, 2014 and November 14, 2014, the MMU led two lengthy
discussions of these recommendations. The MMU discussed its recommendation to enhance
locational pricing and described its view on elements of an enhanced framework that could
dynamically recognize the reliability value of capacity in Load Zone K in the G-J Locality ICAP
Demand Curve.
While the MMU’s presentation was apparently met with interest by the meeting
participants, several also indicated that the MMU proposal would likely require a complete
reworking of the NYISO’s capacity market and potentially impact the policies and rules
administered by the New York State Reliability Council. Stakeholders asked that the MMU
develop and present a cost-benefit analysis that would illustrate a savings to consumers. Other
stakeholders noted that this proposal would not follow the current LCR setting process and could
result in some Localities procuring capacity at levels below the minimum requirements. Some
stakeholders expressed concern regarding how this market design concept would support and
ensure reliability. While there certainly was some interest in the MMU’s market concept,
stakeholders participating in the meeting expressed that further evaluating it would be a
significant long term undertaking that would be unlikely to be completed prior to the next ICAP
Demand Curve reset.
The MMU’s 2014 State of the Market Report included recommendations that effectively repeated the recommendation to adopt a locational framework, but the recommendations in the 2014 report modified the recommendations in the 2013 State of the Market Report based on feedback from stakeholders.24 Specifically, the recommendation was modified to ensure
Localities would not under-procure capacity. The 2014 State of the Market Report provided additional information on potential benefits, but the MMU has indicated it will work with the NYISO’s Planning Department to provide additional information.
The NYISO reviewed the proposal and has taken the position, which is similar to several comments stakeholders proffered, that the MMU’s presented framework, in general, would
require significant changes to the current capacity market, be complicated to define, and
challenging to administer.
24 Potomac Economics, Ltd., 2014 State of the Market Report for the New York ISO Markets
(May 2015) (“2014 State of the Market Report”) at pp. x - ix, 100 - 101, available at:
˂http://www.nyiso.com/public/webdocs/markets_operations/documents/Studies_and_Reports/Reports/M
arket_Monitoring_Unit_Reports/2014/NYISO2014SOMReport__5-13-2015_Final.pdf˃ at pp. xi, 64-65,
102.
Hon. Kimberly D. Bose, Secretary June 1, 2015
Page 11
(v)Further Consideration of Pre-Defining, Eliminating, and Export
Constrained Concepts
The NYISO’s discussion with it stakeholders of the topics of pre-defining and
eliminating Localities, and export constrained capacity market design concepts also took place in its annual “project prioritization” process. This is the stakeholder process through which, among other things, the NYISO obtains stakeholder input as it establishes what proposals it will bring to the stakeholders as a market design concept proposal for discussion, or a market design approval project to be taken through the governance process for a stakeholder vote. The NYISO
suggested that several issues raised by stakeholders at the Technical Conference and by post-
conference comments, be evaluated in 2015. The potential list included the MMU’s capacity
market framework recommendation described above, modeling export constraints in the ICAP
Spot Market Auction for nested capacity zones, and developing market rules to pre-define
capacity zones combined with rules to eliminate them.
As part of the project prioritization process, based on input from stakeholders,
consideration of rules to eliminate Localities was separated from consideration of developing market rules to pre-define capacity zones. Based on further stakeholder input, the NYISO
committed to consider rules for the elimination of Localities or for the achievement of capacity price convergence. The NYISO is currently developing its follow up discussion on this market design concept, which will be based in part on its consideration of stakeholder input to date. It will be presenting and discussing this concept to stakeholders.
At the February 24, 2015 ICAP Working Group meeting, the NYISO highlighted for
stakeholders key issues that had been raised during the Technical Conference and in post-
conference filed comments.25 The NYISO offered stakeholders an opportunity to make
presentations at a future ICAP Working Group meeting on export constrained modeling
concepts, with the objectives of defining the preferred approach and alternatives, presenting
numerical examples, and describing the benefits and detriments.26 No party requested an
opportunity to make a presentation or lead a discussion, and no party provided materials.
(vi) Consideration of LCR Setting Methodology
In relation to discussions regarding the November Order, and based on discussions with
the stakeholder Operating Committee, the NYISO initiated a process to identify and evaluate
alternatives to the current LCR setting process. The NYISO conducts this process after the New
York State Reliability Council sets the NYCA Installed Reserve Margin (“IRM”). Mark
Younger of Hudson Energy Economics made a presentation to a joint meeting of Market Issues
Working Group, ICAP Working Group, and Price Responsive Load Working Group, on the
25 See Attachment VI.
26 See id. at Slide 8.
Hon. Kimberly D. Bose, Secretary June 1, 2015
Page 12
“IRM/LCR Process & Dynamics.”27 Mr. Younger described factors that could affect the LCRs, and proposed an analysis of the current methodology, using certain sensitivities.
The NYISO notified stakeholders and the MMU that the LCR Task Force was being
convened and asked them to participate. On March 5, 2015, the LCR Task Force met. In order
to facilitate the NYISO’s and its stakeholders’ consideration of a potential alternative process to
calculate LCRs, the NYISO presented background material so that all stakeholders had a
common understanding of the current process by which the LCRs and the IRM were set. It also
enumerated some concerns previously raised by stakeholders regarding the LCRs, and proposed
next steps for the LCR Task Force to consider alternatives.28 In the meeting, the NYISO,
stakeholders, and the MMU discussed the process to calculate the LCRs and the process by
which it will consider and analyze alternatives. The NYISO responded to numerous questions.
The LCR Task Force met again on April 8, 2015. At this meeting, the NYISO presented and described objectives of the current LCR setting methodology and possible alternatives.29 It solicited stakeholder input to develop a consensus on an objective for the group to focus on when evaluating candidate alternative methodologies to determination the LCRs. The following
objectives were discussed:
Maintain the existing process
Minimize the NYCA-wide capacity procurement costs Minimize the NYCA-wide MW requirement
Lowest Possible G-J LCR: Retain J and K “as found” and determine the minimum G-J
No consensus on the objective was reached at the meeting. Rather, stakeholders suggested
that the NYISO perform studies to demonstrate how the results will differ based on the objective. The NYISO indicated such an approach would require extensive use of resources and should only be undertaken until (and unless) clearer objectives were defined.
IV. THE NYISO’S CONCLUSION AND RECOMMENDED NEXT STEPS
Based on the NYISO’s exploration of the issues and evaluation of the proposals
discussed at the February Technical Conference, including the MMU’s recommendations,
through its stakeholder process, the NYISO has concluded that its existing rules are working and
that incremental enhancements may well be beneficial. It has also concluded that its stakeholder
process and project prioritization process is best suited to continue to explore enhancements to its
27 See Attachment VII.
28 See Attachment VIII.
29 See Attachment IX.
Hon. Kimberly D. Bose, Secretary June 1, 2015
Page 13
existing market rules. Due to the complexity, a measured approach to identify and define the enhancements, and address implications is appropriate.
The Services Tariff process for identifying the need for an NCZ, obtaining stakeholder
input throughout the process, filing with the Commission proposed rules to implement it, and
then developing an ICAP Demand Curve for the NCZ along with the other ICAP Demand
Curves, was utilized for the first time, in 2013. It resulted in the creation of the G-J Locality. In
accordance with that Services Tariff process, by October 1, 2015 the NYISO will have initiated
the NCZ Study process and have obtained stakeholder input for the NCZ Study to be issued by
January 15, 2016.30 As the NYISO stated at the Joint Technical Conference on New York
Markets & Infrastructure in November 2014, “[t]he NYISO is mindful of the fact that the
creation of the new zone has led to wholesale capacity price increases that have had retail price
implications. But the NYISO believes that the creation of the new zone was necessary, fully
consistent with tariff requirements, and will benefit all New York consumers over time. Needed
investments in resources in the lower Hudson Valley are now being made that will bolster long-
term reliability and lower capacity prices in the region as they enter service.”31 The
Danskammer Generating Station announced its return to service and the Bowline Unit 2 has
entered Class Year 2015 as a step towards returning it to its full capacity, and the 720 MW CPV
Valley Energy Center is proceeding with development.32 These projects will enhance reliability,
which will benefit all consumers.
The process for identifying the need for an NCZ is very transparent; it gives stakeholders and all Market Participants and potential developers advanced notice of the changes in the
market place, and then sends price signals that also have been carefully set in the Demand Curve process. The NYISO recognizes that some incremental adjustments could provide further
benefits and have the potential for reducing costs. However, it also believes that care must be
taken to develop those rules carefully so that the benefits of the tariff-established process to
create new Localities are not compromised, and that uncertainty surrounding the rules does not
chill potential economic investment.
The NYISO is beginning the project prioritization process with its stakeholders for 2016. As described below, the issues the NYISO is suggesting that stakeholder consider includes issues raised at the February Technical Conference:
30 See Services Tariff Sections 5.16.1.2 and 5.16.
31 Written Statement of Emilie Nelson, Vice President - Market Operations, on Behalf of the New York Independent System Operator, Inc., Docket No. AD14-18-000 (Nov. 3, 2014) at 18.
32 On May 28, 2015, CPV announced that it “expects to commence construction [on the project]
in late 2015. See Competitive Power Ventures Closes Investment Transaction with Global Infrastructure
Partners (May 28, 2015), available at: ˂http://www.cpv.com/press_releases.html#web˃˃. The
Interconnection Agreement for the project is fully executed.
Hon. Kimberly D. Bose, Secretary June 1, 2015
Page 14
Alternative methods for calculating the LCRs: This project would consider alternative
methods for calculating the LCRs for each Locality. The project would include a
continuation of the on-going work of the LCR Task Force.
Modify the ICAP Demand Curve framework to minimize costs of satisfying LCRs: This
project would create a dynamic and efficient framework for incenting the lowest cost
solutions when setting and meeting locational planning requirements in the capacity
market. The MMU has proposed this concept indicating it might enable the capacity
market to better provide locational signals in the future and result in more efficient
market outcomes.
Locational Planning Requirements - Pre-define Localities: This project would consider
rules for reflecting locational planning requirements in the capacity market to better
enable the market to provide locational signals in the future by predefining a set of
interfaces or zones that address potential resource adequacy needs and highway
deliverability constraints.
Develop rules for eliminating Localities or achieving price convergence: This effort
would build on discussions to date and evaluate whether a mechanism to eliminate
Localities is necessary. If it is deemed necessary, then further evaluate the market design concepts for developing the market rules to allow for the elimination of Localities or achieve price convergence when the deliverability constraint(s) that caused its creation is effectively removed such that the constraint can no longer be expected to bind.
Model Zone K as export constrained: This effort would also build upon and enhance
initial design concepts developed with stakeholders.
Over the coming months, the NYISO’s stakeholders will be “scoring” the proposed
projects, which will result in a ranking that the NYISO utilizes to prioritize which projects
stakeholders believe warrant consideration above other projects. The NYISO believes that this
Hon. Kimberly D. Bose, Secretary June 1, 2015
Page 15
input is important to assessing where the greatest benefits to the market can reasonably be achieved.33
In any case, the NYISO will be continuing the LCR Task Force. As described above,
however, that work must consider potential implications for the New York State Reliability
Council rules that are utilized to set the IRM, and how the process for determining the LCRs can best complement those rules. It is also possible that the NYISO may have to engage the New York State Reliability Council to consider revisions to the processes or rules for setting the IRM as part of the approach for considering changes in methods for determining LCRs.
Timing of consideration is also important. The NYISO has already informed
stakeholders that as part of the Demand Curve reset process it is now initiating, it plans on
requesting proposals to consider a 4 or 5 year periodicity in addition to the current 3-year
process, and approaches to enhance the projection of the likely Energy and Ancillary Services
revenues of the proxy plant used for setting the curves. With the input from the independent
Demand Curve reset consultant, the NYISO plans on evaluating with stakeholders potential rule
changes that could enhance price signals. This evaluation and any proposal would also consider
revisions to the NCZ Study and the process and timing for the creation of new Localities. The
NYISO believes that there are benefits to the entire system that are appropriate to pursue at this
time and could be achieved in time for the setting of the next ICAP Demand Curves.
The NYISO sought and considered, and continues to seek and consider, the input of the MMU as it evaluates and develops proposals and market design concepts that are described in this report and works with stakeholders to identify projects to consider in 2016. The MMU was given an opportunity to review and comment on this report.
Because the NYISO and its stakeholders have undertaken steps to consider important
issues including rules that could enhance price signals, the stakeholder process should be allowed
to continue to work. The analysis and prioritization in the stakeholder process is perhaps the best
indicator of where value may be achieved for the market. Accordingly, the NYISO respectfully
requests that the Commission not issue a further compliance obligation to pursue development of
specific rules.
33 Also on the potential 2016 projects for stakeholders to consider is the MMU’s proposal, which
the MMU proposes for “scoping” in the 2014 State of the Market Report and during the February
Technical Conference: internal capacity Deliverability rights for transmission upgrades into a local area.
See Post Technical Conference Comments of Potomac Economics, Ltd., New York ISO Market
Monitoring Unit, Docket No. AD14-6-000 (March 26, 2014) at 11; see also, 2014 State of the Market Report at xi, 64-65, 102. The MMU has suggested considering creating a dynamic and efficient
framework for reflecting locational planning requirements in the capacity market to better enable the
market to provide locational signals in the future, by granting internal capacity deliverability rights for AC Transmission between zones when AC transmission is upgraded into a local area. The State of the Market report has not indicated this as a priority item. At this stage, the NYISO believes it would require further information in order to assess its potential.
Hon. Kimberly D. Bose, Secretary June 1, 2015
Page 16
V.SERVICE
This filing will be posted on the NYISO’s website at www.nyiso.com. In addition, the
NYISO will e-mail an electronic link to this filing to the official representative of each party to
this proceeding, to each of its customers, to each participant on its stakeholder committees, to the
New York Public Service Commission, and to the New Jersey Board of Public Utilities.
VI.CONCLUSION
Wherefore, for the foregoing reasons, the New York Independent System Operator, Inc. respectfully requests that the Commission accept this Informational Report.
Respectfully submitted,
/s/ Gloria Kavanah
Gloria Kavanah
Counsel for the
New York Independent System Operator, Inc.
cc:Michael Bardee
Gregory Berson
Anna Cochrane
Morris Margolis
David Morenoff
Daniel Nowak
Kathleen Schnorf
Jamie Simler
Kevin Siqveland
Capacity Zone
(Locality)
Elimination
Mariann Wilczek
Capacity Market Products
New York Independent System Operator
Joint MIWG/ICAP Working Group
October 30, 2014
NYISO, Rensselaer, NY
© 2014 New York Independent System Operator, Inc. All Rights Reserved.


Problem Statement
Discuss whether there should be a mechanism to
eliminate a Locality, and if so, market design
concepts to eliminate capacity zones
The Services Tariff uses the term “Locality” to define
established capacity zones
The purpose of this presentation is to solicit
stakeholder feedback
© 2014 New York Independent System Operator, Inc. All Rights Reserved.2
Why do we have Capacity Markets ?
Benefits
Ensure resource adequacy
Provide a market signal for investment
Recover a portion of fixed costs not recoverable in Energy and Ancillary Services Markets
Capacity zones (“Localities”) recognize the value of capacity in the
area.
More focused price signal where capacity is needed Help to address transmission system constraints Long term investment signal
• New - Locate
• Existing - Maintain or increase capability
© 2014 New York Independent System Operator, Inc. All Rights Reserved.3
Localities
The Services Tariff has the set of rules for the
triennial process to determine if a new Locality is
needed and the steps by which it is created (see
Appendix Slides)
The tariff is silent on the elimination of a Locality
© 2014 New York Independent System Operator, Inc. All Rights Reserved.4
Stakeholder Discussion
Do we need to eliminate Capacity Zones ?
G-J, J, K
Suggested Topics
Elimination of a Locality
• Price convergence
• Elimination of a deliverability constraint
• Effect on Offer Floor of units subject to buyer-side mitigation
• Effect on planning processes
• Timing issues
Comments beyond today’s meeting can be sent to
Debbie Eckels (deckels@nyiso.com)
© 2014 New York Independent System Operator, Inc. All Rights Reserved.5


© 2014 New York Independent System Operator, Inc. All Rights Reserved.6
Background for New Capacity Zones
FERC Filings and Orders
June 30, 2009 - FERC Order accepting the deliverability rules directed the NYISO and the NYTOs to
jointly file a proposal to create a new capacity zone.
January 4, 2011 - NYTOs and NYISO filed proposed criteria and considerations to govern the
evaluation and potential creation of new capacity zones.
September 8, 2011 - FERC issued an order which directed the NYISO to file tariff provisions to
specify the process for evaluating, identifying and, if necessary, establishing new capacity zones.
November 7, 2011 - NYISO filed the tariff sheets containing the specific detail.
August 30, 2012 - FERC issued an order accepting the November 2011 filing and made the tariff
revisions by which new capacity zones would be identified and created effective as of January 9,
2012.
June 29, 2012 - NYISO submitted a filing proposing buyer-side and supplier-side ICAP market power
mitigation rules to apply to any newly created capacity zones.
June 6, 2013 - FERC issued an order conditionally accepting the proposed mitigation rules, subject
to a compliance filing.
July 8, 2013 - NYISO filed in compliance with the June 2012 order.
August 23, 2014 - FERC issued a delegated letter order accepting the July 8, 2013 compliance filing.
© 2014 New York Independent System Operator, Inc. All Rights Reserved.7
Process to Define New Capacity Zones
Rules
The Services Tariff Section 5.16 describes the required steps to identify and propose a New Capacity Zone
(NCZ) and Section 5.14 describes how an NCZ is factored into the triennial ICAP Demand Curve reset
process.
The NYISO is required to
•Commence a triennial NCZ Study in the calendar year preceding the calendar year in which the NYISO is required to file the
ICAP Demand Curves (ICAP Demand Curve Reset Filing Year).
•Review with the stakeholders by October 1 of that preceding year the inputs and the assumptions to be used in the NCZ Study.
•Complete the NCZ Study by January 15 of the ICAP Demand Curve Reset Filing Year.
Filings
The Services Tariff requires the NYISO to make one of two types of filings on or before March 31 of each ICAP
Demand Curve Reset Filing Year.
• “[i]f the NCZ Study does not identify a constrained Highway interface, the ISO shall file with the Commission the
ISO’s determination that the NCZ Study did not indicate that any New Capacity Zone is required pursuant to this process, along with a report of the results of the NCZ Study.”
• Propose a New Capacity Zone if the NCZ Study identifies a constrained Highway interface into one of more Load
Zones, including identify the boundary of one or more NCZs and file tariff revisions to implement new NCZ(s) along with the NCZ Study results.
Process Timing
The steps were designed so that the NYISO’s filing to propose an NCZ would be made in time for it to be
considered as part of and concurrent with the periodic review of the ICAP Demand Curves for existing
Localities and the NYCA,
Pursuant to the timing in the Services Tariff, the ICAP Demand Curves for an NCZ would be effective at the
same time other revised ICAP Demand Curves; and in time for all ICAP market activities (e.g. setting the
LCRs, import rights processes) for the first Capability Year after it is proposed and accepted.)
© 2014 New York Independent System Operator, Inc. All Rights Reserved.8
Capacity Zone
(Locality)
Predefine & Eliminate
Mariann Wilczek
Capacity Market Products
New York Independent System Operator
ICAP Working Group
November 17, 2014
NYISO, Rensselaer, NY
© 2014 New York Independent System Operator, Inc. All Rights Reserved.
Objectives
Discuss whether capacity zones should be
predefined and, if so, market design concepts to
predefine capacity zones
Continue discussion whether capacity zones should
be eliminated and, if so, market design concepts to
eliminate capacity zones
© 2014 New York Independent System Operator, Inc. All Rights Reserved.2
Request from October 30 MIWG
Stakeholders requested a presentation on how PJM
and ISO-NE eliminate capacity zones
Stakeholders recognized that this request was in the context of markets
that had different capacity zone constructs
The following slides provide a brief overview of how
PJM predefines and eliminates capacity zones
ISO-NE will be presented at a future ICAP Working Group meeting
© 2014 New York Independent System Operator, Inc. All Rights Reserved.3
PJM - Locational Deliverability Area
Locational Deliverability Area (LDA) - Reliability Assurance Agreement
Sub regions used to evaluate locational constraints. LDAs include EDC zones, sub-zones and
combination of zones. A Zone is an area within the PJM Region or such areas that may be
combined as a result of mergers and acquisitions; or added as a result of the expansion of the
boundaries of the PJM Region. A Zone will include any Non-Zone Network Load located outside the PJM Region that is served from inside a particular Zone.
Limited ability to import capacity due to physical limitations of the transmission system, voltage
limitations or stability limitations.
There are currently 27 LDAs.
PJM will analyze the need for an addition of an LDA - Manual 14b
RTEP Market Efficiency Analysis - constrained facilities will be identified(persistent congestion on
a 500kV or above facility or interface) for multiple years beyond the next Base Residual Auction
RTEP Long Term Planning - Future constrained facilities or clusters of facilities are identified
utilizing the long term planning analysis. Potential facilities are screened using thresholds that are utilized in the RTEP long-term planning studies. This analysis is updated annually based on
approved RTEP upgrades. 500 kV and above facilities that advance more than three years between RTEP cycles are identified for further consideration. If the driver for a 500 kV facility advancing
more than three years is linked to a specific event (e.g. significant generation retirement), it may
require further analysis.
Once a facility has been identified utilizing the above methods, distribution factor analysis is
utilized to determine the specific busses included in the analyzed LDA.
The sequence of evaluating areas of differing size involves nesting small sub-areas into larger
areas and finally areas into larger geographical areas of Locational Deliverability Area (LDA).
Any other party may propose to PJM a new LDA and they will study
PJM required to file with FERC if a new LDA (or aggregate of LDAs) is warranted
Sources - PJM Schedule 10.1 of Reliability Assurance Agreement, PJM Manuals 14b PJM Region Transmission Planning Process, Manual 20 - PJM
Resource Adequacy Analysis, Manual 18 - PJM Capacity Market, Manual 35 - PJM Definitions
© 2014 New York Independent System Operator, Inc. All Rights Reserved.4
PJM - Load Deliverability Study (CETO/CETL)
Manual 18 - PJM Capacity Market
The process of determining the Installed Reserve Margin (IRM) that meets the PJM reliability criterion
assumes that the internal RTO transmission is adequate and any generation can be delivered to any
load without transmission constraints. This process helps in determining the minimum possible IRM
for the RTO. However, since transmission may have limitations, after IRM is determined a Load
Deliverability analysis is conducted. The RTO is divided into different sub-regions for this analysis.
These sub-regions are referred to as Locational Deliverability Areas (LDAs) in the Reliability Pricing
Model.
The first step in the Load Deliverability analysis is to determine the transmission import capability
required for each LDA to meet the area reliability criterion of Loss of Load Expectation of one
occurrence in 25 years. This import capability requirement is called Capacity Emergency Transfer
Objective (CETO), expressed in megawatts and valued as unforced capacity. The standard generation reliability evaluation model is used to determine CETO.
The second step in Load Deliverability analysis is to determine the transmission import capability
limit for each LDA using the transmission analysis models. For this analysis, a Transmission Upgrade
including transmission facilities at voltages of 500 kV or higher that is in an approved Regional
Transmission Expansion Plan (“Backbone Transmission”) will be included in the system model only
if it satisfies the project development milestones set forth in the tariff. This import capability limit is
called Capacity Emergency Transfer Limit (CETL), expressed in megawatts and valued as unforced
capacity.
If CETL value is less than CETO value, transmission upgrades are planned under the Regional
Transmission Expansion Planning Process (RTEPP). However, higher than anticipated load growth and unanticipated retirements may result in the CETL value being less than CETO value with no lead time to build transmission upgrades to increase CETL value. These conditions could result in
locational constraints in the RTO.
Sources - PJM Schedule 10.1 of Reliability Assurance Agreement, PJM Manuals 14b PJM Region Transmission Planning Process, Manual 20
- PJM Resource Adequacy Analysis, Manual 18 - PJM Capacity Market, Manual 35 - PJM Definitions
© 2014 New York Independent System Operator, Inc. All Rights Reserved.
5
PJM - Locational Constraints
Locational Constraints are localized intra-PJM capacity import capability limitations (low CETL
margin over CETO) that are caused by transmission facility limitations or voltage limitations that are identified for a Delivery Year in the PJM Regional Transmission Expansion Planning Process (RTEPP) prior to each Base Residual Auction. Such locational constraints are included in the RPM to
recognize and to quantify the locational value of capacity within the PJM region.
An LDA is modeled if:
LDA has CETL < 1.15 CETO
LDA had locational price adder in any of three immediately preceding Base Residual Auctions
LDA is likely to have a locational price adder based on a PJM analysis using historic offer price
levels
LDA is EMAAC, SWMAAC, and MAAC
An LDA that does not meet the criteria above may be modeled if PJM identifies reliability
concerns with LDA
LDAs modeled in a Base Residual Auction are modeled in the Incremental Auctions for the
Delivery Year
A Reliability Requirement and a Variable Resource Requirement Curve will be established for each
constrained LDA to be modeled in the RPM Base Residual Auction.
Capacity Import Limits
First modeled in 2017/2018 year that will limit the delivery of capacity from external source
zones
Sources - PJM Schedule 10.1 of Reliability Assurance Agreement, PJM Manuals 14b PJM Region Transmission Planning Process, Manual 20
- PJM Resource Adequacy Analysis, Manual 18 - PJM Capacity Market, Manual 35 - PJM Definitions
© 2014 New York Independent System Operator, Inc. All Rights Reserved.6
PJM - LDAs
Mitigation
VRR Curves
Locational Requirements
© 2014 New York Independent System Operator, Inc. All Rights Reserved.7
NYISO - Predefine Possible Options
Pursue an incremental approach first
Based on the tariff’s current deliverability construct
• Look at what constraints are likely to bind or where there are likely to be
export constrained zones
The MMU has proposed a dynamic process - Discussion at
August 20, 2014 and November 14 ICAP WG meetings
Complicated to define
Complicated to administer
Requires significant changes to the current capacity market PJM approach
© 2014 New York Independent System Operator, Inc. All Rights Reserved.8
NYISO - Eliminate Possible Options
Actual or projected price convergence with the NYCA
clearing price
Deliverability Constraints are Eliminated
No need to eliminate as prices will converge or nearly
converge
© 2014 New York Independent System Operator, Inc. All Rights Reserved.9
Potential Triggers for Elimination
of a Capacity Zone
Actual or projected price convergence with the NYCA clearing price
What period of time - past or future or both
• How many months, consecutive ?
• Studies performed that the prices converge in a period in the future ?
• Does the IRM/LCR setting process impact the convergence ? Upcoming Market Events
• Transmission builds and enhancements - how far ahead, base case
inclusion rules
• Resource retirements/additions
• What is retiring/being added ? When ?
• Should Mothballs and ICAP Ineligible be considered ?
• How to look forward without Demand Curves for those periods How to look at Price Convergence
• Planning Studies
• Deliverability study, IRM/LCR study, a combination of planning studies or other study ?
• How far out is the study horizon ?
© 2014 New York Independent System Operator, Inc. All Rights Reserved.10
Triggers for Zone Elimination (cont)
Deliverability Constraints are Eliminated
What MW threshold is required to cause elimination
• Incremental MW of interface deliverability capability have been added to
eliminate all likelihood that the interface will become constrained within the horizon period ?
• Compare amount of incremental interface capability to what ?
• What about Generator retirements/additions?
Planning Horizon
• What is the time required to show the deliverability constraint has been
adequately relieved ?
•5 years ? 10 years ? Other ?
• Baseline , inclusion rules ?
• Scenarios
© 2014 New York Independent System Operator, Inc. All Rights Reserved.
11
Alternative Position
No need to eliminate as prices will converge or nearly
converge
Other analysis to support
Changes to the IRM/LCR processes and/or DCR Export constrained zone
© 2014 New York Independent System Operator, Inc. All Rights Reserved.
12
Potential Issues to Elimination
Mitigated Units (buyer-side and supplier-side)
Buyer -side (BSM)
• If a mitigated unit is no longer in a mitigated zone is it no longer
subject to an Offer Floor ?
• What if the eliminated zone becomes a mitigated capacity zone in
the future ?
• New units could enter the newly eliminated zone and not be
mitigated and others still mitigated
• Continuation of BSM without the associated Locality creates a
disconnect and unlikely the mitigated unit will come out of
mitigation
Supplier-side (Pivotal Supplier)
• Are business decisions affected by the uncertainty of whether or
not this might apply
© 2014 New York Independent System Operator, Inc. All Rights Reserved.
13
Potential Issues to Elimination (con’t)
CY deliverability study , impacts to SDU cost allocations,
built or not built
Import Rights analysis Tariff rule changes Software issues
© 2014 New York Independent System Operator, Inc. All Rights Reserved.
14
Timing
When and how frequently is the periodic planning study or
other analyses done?
Seasonal
Annual
With NCZ study in a DCR year
Should elimination be coupled with examination of other new
zones or a reconfiguration of an existing one
What time frame does the elimination become effective ?
© 2014 New York Independent System Operator, Inc. All Rights Reserved.
15
Studies and Analyses Impacted
Impacts
What type of impacts
Consumer impacts CRP, RNA
Do market based or backstop solutions impact the elimination
of a zone ?
• If so, how ?
Interconnection, Class Year and Deliverability Studies MMA BSM determinations linked to CY Studies
Timing of studies for zone elimination may conflict with
existing studies; e.g., DCR and IRM/LCR Studies
© 2014 New York Independent System Operator, Inc. All Rights Reserved.
16
Next Steps
Elimination
Provide highlights of ISO-NE
Continue stakeholder discussions on elimination concepts into
2015
© 2014 New York Independent System Operator, Inc. All Rights Reserved.
17
© 2014 New York Independent System Operator, Inc. All Rights Reserved.
18

Treatment of Zone K Export
Constraints into the G-J
Locality :
Market Design Concept
Randy Wyatt
Capacity Market Products
New York Independent System Operator
MIWG/ICAPWG
December 18, 2014
NYISO, Rensselaer, NY
© 2014 New York Independent System Operator, Inc. All Rights Reserved.


Background: How did we get here?
The NYISO Tariff provides for the creation of import
constrained zones (Localities)
Tariff prescribed triennial process
New Capacity Zone (NCZ )Study / Highway deliverability constraint test MST §5.16.2 - “In determining the New Capacity Zone Boundary, the ISO
shall consider the extent to which incremental Capacity in individually
constrained Load Zones could impact the reliability and security of the
other constrained Load Zones, taking into account interface capability between the constrained load zones.” (emphasis added)
Other than the above, the tariff is silent on treatment of export constraints
into a Locality
On April 30, 2013 the NYISO filed with FERC to create a G-J NCZ
• K was not included in the NCZ boundary based on reliability analysis, ( MST
§5.16.2 )
•2013 BPWG Process identified MDCP for modeling export constraints in the
ICAP Auction
© 2014 New York Independent System Operator, Inc. All Rights Reserved.
FERC Tech Conference
The purpose of the conference was to discuss
whether or not to model Load Zone K export-
constraints in future Demand Curve reset
proceedings.
NYISO presented transmission security
analysis and resource adequacy analysis
material that demonstrates a 300 MW export
limit from K to GHI
MMU and stakeholder comments support
valuing K capacity reliability benefits in the
new Locality
© 2014 New York Independent System Operator, Inc. All Rights Reserved.
11/25/14 FERC Order
Resulting from the FERC Technical
Conference
FERC’s order
Directed the NYISO to work with stakeholders “to explore
whether a proposal can be developed that could reduce
the cost of procuring capacity while meeting the NYISO LOLE objective.”
Directed the NYISO to “explore the issues and evaluate
the proposals discussed at the conference, including the
MMU’s recommendations, through its stakeholder
process and file an informational report with the Commission by June 1, 2015.”
“[A]gree[d] with NYISO that it is premature to require it to file tariff language by June 1, 2015.”
© 2014 New York Independent System Operator, Inc. All Rights Reserved.


Pricing Hierarchy Rules
Hierarchy rules link Market-Clearing Price (MCP) outcomes in
the auctions
If NYC MCP < G-J* MCP, set NYC MCP = G-J* MCP If G-J MCP < ROS MCP, set G-J MCP = ROS MCP If LI MCP < ROS MCP, set LI MCP = ROS MCP
Rest of State
* G-J Locality
consists of the Lower
Lower
Hudson
Valley
New York City
Long Island
Hudson Valley
(Zones G-I) and New York City (Zone J)
© 2014 New York Independent System Operator, Inc. All Rights Reserved.
Capacity Market Mechanics: Background
Conduct and solve Spot auctions for all Demand Curve “regions”
(i.e., the 3 Localities and the NYCA), MW that clear above a
Locality’s Locational Minimum Installed Capacity Requirement
(LCR) are automatically “offered” to satisfy LSEs’ additional
minimum requirements as follows
Zone J MW that clear above requirements are offered in the G-
J Locality.
Zone K MW and G-J Locality MW that clear above
requirements are offered in NYCA.
Resale of the MW that cleared above LCRs offsets the cost to
load in the Locality
Revenue to ICAP Suppliers in Localities where MW cleared
above requirements is not impacted by the resale
© 2014 New York Independent System Operator, Inc. All Rights Reserved.
NYISO’s Proposed Market Design Concept
Originally presented at FERC Tech Conference
NYISO conceptual design elements
One export constrained zone: Load Zone K Set up rules to ensure equivalent results to a
simultaneous solution
• Determination of a cap on Zone K capacity that could be
used to satisfy the G-J LCR
• Model Zone K export caps in the Spot Auction
• This cap would stay fixed in the Spot auction
• Explore mitigation rules and subsequent settlement rules
© 2014 New York Independent System Operator, Inc. All Rights Reserved.
Market Design Concept:
Auction Mechanics for Treatment of
Export Constraints into a Locality
Solve the auction as we do today, apply hierarchal
pricing rules to result in a simultaneous auction
outcome, with an additional step
Offer the MW that clear above the Zone K LCR, up
to the K export limit MW, into the G-J auction at a
zero price
Offer the remaining MW that clear in K above the
Zone K LCR (i.e., those above the export limit) into
NYCA at a zero price
Clear NYCA same as today
© 2014 New York Independent System Operator, Inc. All Rights Reserved.
Questions and Comments
The NYISO is seeking comments on
the treatment of Zone K export
constraints
Additional comments, beyond those
received at today’s presentation,
should be sent to
DEckels@NYISO.com by January 7,
2015
© 2014 New York Independent System Operator, Inc. All Rights Reserved.
Next Steps
January - review feedback from
stakeholders re: Treatment of Zone K
Export Constraints
February - Continue discussions with
stakeholders including stakeholder
feedback and alternative approaches
© 2014 New York Independent System Operator, Inc. All Rights Reserved.
© 2014 New York Independent System Operator, Inc. All Rights Reserved.
This Numeric Example has been posted on February 19, 2015 with the December 18, 2014 MIWG Materials to accompany
the NYISO presentation entitled: "Treatment of Zone K Export Constraints into the G‐J Locality: Market Design Concept"
RequirementsLI LSENYC LSELHV LSEROS LSETotalsRequirementsLI LSENYC LSELHV LSEROS LSETotals
LI Zone60000006000LI Zone60000006000
NYC Zone0100000010000NYC Zone0100000010000
GHIJ Zone0105004500015000GHIJ Zone0105004500015000
NYCA (TD) Zone65001100050001750040000NYCA (TD) Zone65001100050001750040000
GHI Zone0500450005000GHI Zone0500450005000
ROS Zone5005005001750019000ROS Zone5005005001750019000
SupplyLINYCLHVGHIJ TotalROSNYCA TotalSupplyLINYCLHVGHIJ Total ROS
Base Case7000110005500165001750041000Base Case70001100055001650017500
Base Case ‐ LI with 1000MW of Excess over LCR Rqmt., 500MW in Excess of NYCA IRM Rqmt. Export Case ‐ 300MW (Export Limit) of LI Excess to G‐J, LI LSE's Receive G‐J $
LINYCGHIJNYCALI LSE ‐> GHIJLINYCGHIJ NYCA
Clearing Prices$7$18$12$6Clearing Prices$7$18$10$6
LocationLINYCLHVROSTotalsLocationLINYCLHVROSTotals
Paid to Generators$49,000,000$198,000,000$66,000,000$105,000,000$418,000,000Paid to Generators$49,000,000$198,000,000 $55,000,000 $105,000,000 $407,000,000
LI Requirement60000006000LI Requirement60000006000
LI Excess10000001000LI Excess10000001000
LI Purchased70000007000LI Purchased70000007000
NYC Requirement0100000010000NYC Requirement0100000010000
LI ‐> J Export00000LI ‐> J Export00000
NYC Excess01000001000NYC Excess01000001000
NYC Purchased0110000011000NYC Purchased0110000011000
GHIJ Requirement0105004500015000GHIJ Requirement0105004500015000
LI‐> GHIJ Export00000LI‐> GHIJ Export‐3002109000
GHIJ Excess0105045001500GHIJ Excess0105045001500
GHIJ Purchased0115504950016500GHIJ Purchased‐300117605040016500
GHI Purchased0550495005500GHI Purchased‐300760504005500
NYCA Requirement65001100050001750040000NYCA Requirement65001100050001750040000
NYCA Excess162.5275125437.51000NYCA Excess162.5275125437.51000
NYCA Purchased6662.511275512517937.541000NYCA Purchased6662.511275512517937.541000
ROS Purchased‐337.5‐27517517937.517500ROS Purchased‐37.5‐4858517937.517500
Total Costs to LoadTotal Costs to Load
LI$49,000,000$0$0$0$49,000,000LI$49,000,000$0$0$0
NYC$0$198,000,000$0$0$198,000,000NYC$0$198,000,000$0$0
GHI$0$6,600,000$59,400,000$0$66,000,000GHI($3,000,000)$7,600,000$50,400,000$0
ROS($2,025,000)($1,650,000)$1,050,000$107,625,000$105,000,000ROS($225,000)($2,910,000)$510,000$107,625,000
Total$46,975,000$202,950,000$60,450,000$107,625,000$418,000,000$418,000,000Total$45,775,000$202,690,000$50,910,000$107,625,000$407,000,000
The prices and quantities used in the example are not actual values but are approximated to show relative magnitudes for the purpose of this illustration.


2013 State of the Market Report
Recommendation to Enhance Locational
Pricing in the Capacity Market
Pallas LeeVanSchaick
NYISO Market Monitoring Unit
Potomac Economics
Installed Capacity Working Group
August 20, 2014


Introduction
• Additional details were requested about Recommendation #1 in
the 2013 SOM Report, which was to:
Create a dynamic and efficient framework for reflecting
locational planning requirements, including:
a) Pre-defining interfaces/zones to satisfy planning reqs
b) Granting financial capacity transfer rights for Tx upgrades
c) Set demand curves to minimize cost to satisfy planning reqs
• This presentation covers:
Concerns with current capacity market framework
Principles and objectives of an enhanced framework
Key elements of an enhanced framework for (a), (b), & (c)
An alternative concept for (a) & (c)
- 2 -
Current Capacity Market Framework:
Overview of Concerns
• The following slides discuss five concerns with the current rules:
1) The delay in the creation of an NCZ in SENY has contributed
to an increase in overall costs for loads in recent years;
2) Prices are inconsistent with the value of resources in each
zone, leading to over-procurement in low-value areas;
3) Transmission projects are not compensated for their value in
the capacity market, undermining incentives for investment;
4) If additional retirements lead to resource adequacy issues
outside SENY, the capacity market will not provide efficient
signals for investment; and
5) The capacity market does not provide incentives for helping
resolve transmission security issues, although these have
become increasing prevalent in recent RNAs.
- 3 -
Current Capacity Market Framework:
Effects of Delay in Creation of NCZ in SENY
• Resource Adequacy & Transmission Security issues for UPNY-
SENY have long been identified in planning studies.
• The slow process for creating the G-J Locality has:
Contributed to the 21 percent decline in Lower Hudson Valley
unforced capacity from Summer 2006 to Summer 2013;
Led to years of inflated LCRs and capacity prices for NYC (e.g.,
3 percent increase in LCR $47/kW for 2013/14);
Erected inefficient barriers to entry in Zones A to F where new
resources would be subject to a more stringent Highway
Deliverability Test; and
Contributed to a dramatic change in capacity prices for the Lower
Hudson Valley from 2013/14 to 2014/15 (instead of gradual one).
• Under the current process, a new NCZ would be created 2 to 4
years after similar problems would emerge in the future.
- 4 -
Current Capacity Market Framework:
Prices Not Consistent with Reliability Value
• The reliability value of adding resources in each area could be
more efficiently reflected in the Demand Curves or the LCRs.
Capacity prices are not consistent with the LOLE impact of
additional capacity in each area (in the scenario below where each area is at its LCR/IRM). Note, as Zone K capacity rises above the LCR, LOLE impact falls more quickly than in other areas.
2013 SOM Table 7: Cost of Improving Reliability from Additional Capacity
Monthly DemandAnnual Change inAnnual Cost of
Curve ReferenceLOLE from 100 MW1 Percent LOLE
Point ($/kW-mo)Capacity AdditionImprovement
Locality(1)(2)=(1)/(2)
G-J Locality$12.140.9%$12 Million
NYCA$8.840.3%$27 Million
Zone J (New York City)$18.551.0%$17 Million
Current Capacity Market Framework:
Under-Compensating Transmission Investment
• The current market rules provide no capacity payments to most
internal transmission facilities.
However, transmission investment can significantly reduce the
cost of maintaining adequate installed reserve margins.
- Transmission provides a benefit in capacity market
comparable to generation.
This may lead to under-investment in transmission.
• New generation projects may be able to interconnect in a
manner that increases TTC on key interfaces.
However, this may require additional expenditures.
Hence, generators may forego opportunities to increase TTC,
since they receive no compensation in the capacity market.
Current Capacity Market Framework:
Effects of Future Retirements
• Future retirements could change the distribution of resources
dramatically, which could increase the importance of interfaces
not currently addressed in the capacity market.
Example: Retiring Ginna & Huntley would lead to resource
adequacy violations in western New York.
- The result of those events under the current market rules
would be an increase in the IRM and/or LCRs.
• Even if necessary NCZs are eventually created, the lengthy and
uncertain process will not provide efficient market incentives
when critical resource adequacy needs arise in the future.
Investors will not have incentives to enter until after these
issues become critical and costly.
Current Capacity Market Framework:
Lack of Incentive to Resolve Tx Security Issues
• Inter-zonal transmission security violations could arise before
resource adequacy violations.
This could occur even for an area modeled in the capacity
market (e.g., RNA identifies violations into the G-J Locality).
A Regulated Solution might become necessary before the
capacity market can incent new entry.
• Retirement/mothball requests by 115kV units outside SENY
have led recent RNAs to identify Tx security violations.
The NYISO markets do not recognize the value of maintaining
115kV reliability and security.
Resources on the 115kV system often have fewer economies
of scale than higher voltage units. This may lead them to
retire sooner and/or enter into costly RSSA contracts.
- 8 -
Enhanced Capacity Market Framework:
Introduction
• We recommend enhancements consistent with these principles:
Create interfaces and capacity zones based on where resources
are needed to satisfy planning reliability criteria.
Compensate resources (incl. transmission) consistent with
their value in satisfying NYISO planning reliability criteria.
• Such enhancements would provide the following benefits:
Increase incentives to entry for facilities that increase
transmission capability.
Reduce overall cost to load by procuring capacity from
resources most economic for satisfying planning criteria.
Provide more certainty to investors about how emerging
reliability needs will affect capacity prices in the future.
Elements of an Enhanced Framework:
Introduction
• There may be many ways to satisfy the design principles described
above. This presentation discusses:
Elements of two potential enhanced market designs to illustrate
how concerns with the current market might be addressed:
- One design would pre-define Capacity Market Interfaces
(slides 11-22) - For each interface, this would include:
• Defining the downstream capacity zone
• Defining the Fungible Area in the capacity zone
• Treatment of Non-Fungible Area(s) in the capacity zone
• Placement of the Demand Curve for the capacity zone
- An alternative design concept is discussed (slides 26-27).
Compensating transmission for its capacity value (slides 23-25).
Elements of an Enhanced Framework:
Pre-Define Capacity Market Interfaces
• Capacity markets exist to provide the “missing money” needed
to satisfy resource adequacy and transmission security criteria.
• Interfaces modeled in capacity market should be derived from
the associated planning assessments, including:
RNA interfaces that bind into capacity-short areas during
MARS LOL events. (See possible interfaces in Appendix A)
• Benefits of pre-defined Capacity Market Interfaces:
Satisfies planning criteria at lowest possible cost;
Ensures price separation occurs when capacity is more
valuable in one region; and
Provides more certainty to investors by helping them predict
how reliability needs will affect future capacity prices.
- 11 -
Elements of an Enhanced Framework:
Identify Capacity Zones
• For each Capacity Market Interface, there is a downstream
capacity zone where resources can be placed to satisfy needs
without increasing loading on interface. (see list of possible
zones in Appendix B)
• Ideally, price separation should occur when the effect of
downstream capacity on the NYCA LOLE is different from the
effect of upstream capacity.
The amount of price separation should be proportional to the
extent that the Capacity Market Interface binds limiting flows
to the capacity-short area during MARS LOL events (for the
As-found system).
Elements of an Enhanced Framework:
Identify Fungible Area in Each Capacity Zone
• Within a particular capacity zone, transmission constraints may
limit the deliverability of capacity from some areas.
However, capacity in such export-limited areas still may
provide some reliability benefit.
• To set efficient capacity prices, it is important to distinguish
between Fungible Areas and Non-Fungible Areas.
The Fungible Area includes zones where resources can
provide relief that is roughly equivalent to the Proximate Zone
(i.e., zone closest to a particular Capacity Market Interface).
Example: For capacity zone G to K, it is possible that:
- The Fungible Area would include Zones G to J; and
- The Non-Fungible Area would include that Zone K.
Elements of an Enhanced Framework:
Identify Fungible Area in Each Capacity Zone
• Transparent and objective criteria for classifying areas as
fungible or non-fungible is beneficial because it:
Facilitates pricing rules that compensate resources in
proportion to the reliability benefit they provide; and
Enables prospective investors to predict how retirements and
other market developments will affect future clearing prices.
• Such criteria could include a process whereby:
1) The As-found system is moved to 0.1 LOLE by scaling load;
2) For a capacity zone, MWs are shifted from the Proximate
Zone to another zone until:
- LOLE increases to 0.105; or
- MW shifted equals 10% of capacity zone load.
- 14 -
Elements of an Enhanced Framework:
Non-Fungible Areas - Export Limits
• For load zones that are not in the Fungible Area for a particular
Capacity Market Interface:
Export Limit would limit sales from each Non-Fungible Area.
• In the capacity auction:
The Export Limit would be applied relative to the peak load;
Before Export Limit is reached, the value of capacity in a
Non-Fungible Area is the same as the Fungible Area; and
Once Export Limit is reached, the value of capacity in a Non-
Fungible Area would be discounted using a Benefit Ratio.
• The process for identifying a Non-Fungible Area and deriving
an Export Limit would be similar to the NYISO evaluation of
Zone K (although it was based on the As-found system).
- 15 -
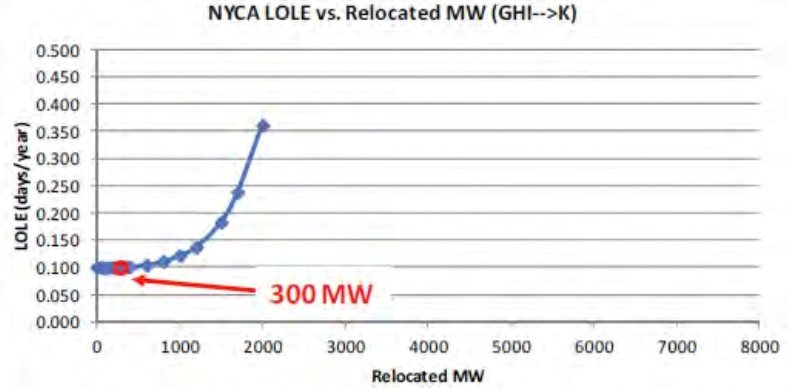
Elements of an Enhanced Framework:
Non-Fungible Areas - Export Limits
Slide 10 in NYISO Presentation at Zone K Tech Conference
Elements of an Enhanced Framework:
Non-Fungible Areas - Benefit Ratios
• Non-Fungible Areas provide reliability benefit to the extent that
additional capacity relieves the Capacity Market Interface.
The benefit is inversely proportional to the extent of binding
constraints in MARS LOL events (when the Capacity Market
Interface is also limiting flows into the capacity-short area).
The price of capacity should be discounted accordingly.
• A Benefit Ratio could be used to clear and to discount the
clearing price in the spot auction. (Appendix C discusses
possible ways to calculate a Benefit Ratio.)
Example: if Zone K exports bind in 40% of LOL events when
interfaces into capacity zone G to K also bind:
- Zone K Benefit Ratio would be 60%, and the last 100 MW in
Zone K would satisfy 60 MW of G to K requirement.
- 17 -
Elements of an Enhanced Framework:
Non-Fungible Areas - Clearing the Spot Auction
• Spot Auctions should clear such that the reliability value of
Non-Fungible Areas is accurately reflected in clearing prices.
• In each capacity zone, offers would be cleared from lowest to
highest until intersection with demand curve.
Offer MWs & prices evaluated as current market for capacity:
- In the Fungible Area; and
- In the Non-Fungible Area until Export Limit is reached.
After Export Limit is reached:
- Offer MWs multiplied by Benefit Ratio; and
- Offer prices divided by Benefit Ratio.
• This is illustrated in Appendix D.
Elements of an Enhanced Framework:
Demand Curve Parameters
• The current rules do not ensure that relative capacity prices are
efficient. To illustrate, suppose that adding 100 MW in:
Zone 1 lowers LOLE by 0.010 where the price is $120/kW-yr.
Zone 2 lowers LOLE by 0.005 where the price is $100/kW-yr.
In this example, the price of improving reliability by 0.01 is
$20 million/year in Zone 2 and $12 million/year in Zone 1.
- Hence, prices are too high in Zone 2 and too low in Zone 1.
• Ideally, demand curves should be set such that capacity prices
reflect the reliability value of additional capacity in each zone.
All areas would have the same ratio of: (a) capacity price to
(b) rate of change in LOLE per MW.
This way, 1 MW in a $10/kW-month zone would provide
twice the benefit of 1 MW in a $5/kW-month zone.
- 19 -
Elements of an Enhanced Framework:
Demand Curve Parameters
• Pricing consistent with value would have several implications:
More capacity would be attracted to zones with a low Net
CONE and where capacity provides greater benefit; and
Less capacity would be attracted to zones with a high Net
CONE and where capacity provides lesser benefit.
Overall, capacity market costs would fall because each dollar
of investment would provide more reliability.
Elements of an Enhanced Framework:
Demand Curve Parameters
• In the demand curve reset, the NYISO could:
Create a Procurement Target to be used in place of the LCR.
- The Procurement Target would be adjusted at the same time
as other demand curve parameters rather than annually.
Define each demand curve (including a Procurement Target, a
Reference Point, and a Zero Cross Point) such that:
- All Proximate Zones have same ratio of: (a) capacity price to
(b) rate of change in LOLE/MW of additional capacity,
- When each capacity zone is at 100% of its Excess Level; and
- When each capacity zone is at X% of its Excess Level
(where X is a pre-defined margin moderately above the
Excess Level).
Elements of an Enhanced Framework:
Inter-zonal Transmission Security
• If the demand curve for each capacity zone is set relative to the
Procurement Target as described, the zone may not satisfy
inter-zonal transmission security criteria. In this case, a second
demand curve could be modeled for the capacity zone with:
Procurement Target raised until criteria met at excess level.
- This would give the security-constrained capacity zone a
higher ratio of: (a) capacity price to (b) rate of change in
LOLE per MW of additional capacity.
- This would allow for downward adjustments in the
Procurement Targets for all other capacity zones.
For any Non-Fungible Area, the Export Limit should be set to
reflect transfer capability for the relevant N-1-1 scenario and
the Benefit Ratio should equal 0.
Elements of an Enhanced Framework:
Financial Capacity Transfer Rights
• The current market rules provide no capacity payments to
internal transmission facilities.
However, transmission investment can significantly reduce the
cost of maintaining adequate installed reserve margins.
- Transmission makes existing resources more deliverable and
reduces the effects of contingencies.
This may lead to under-investment in transmission.
• Ideally, transmission should receive capacity compensation to
the extent it provides a service comparable to installed capacity.
Compensation should be based on the amount by which
installed capacity requirements are reduced by the facility.
Elements of an Enhanced Framework:
Financial Capacity Transfer Rights
• Efficient compensation for a transmission facility requires
quantifying:
1) The effect on the TTC of one or more interfaces from adding/
removing a facility.
2) The marginal effect of a change in TTC on LOLE for the As-
found system.
3) The value of reliability in $s per unit of LOLE implied by the
placement of the demand curves.
• Efficient compensation = (1) × (2) × (3)
Elements of an Enhanced Framework:
Financial Capacity Transfer Rights
• Some generation affects the TTCs of interfaces in the RNA.
The 2014 RNA (pages D-11 & D-12) provides a list of
Dynamic Limits, which are interface TTCs that depend on the
commitment status of individual generators.
Example: Two Dunkirk units raise the Dysinger East interface
TTC by 750+ MW.
• It would also be appropriate to compensate (or charge)
individual generators for their impact on interface TTC.
Such compensation would provide incentives to interconnect
at points that increase the deliverability of other generators.
Such charges would be more efficient than assigning SDU
costs, since these can be a barrier to efficient investment if the
SDU costs are higher than the value of the upgrade.
- 25 -
Alternate Capacity Market Framework
• An alternative approach (to the one discussed in earlier slides)
would consist of:
1) Developing a single capacity demand curve for all areas
expressed in $/unit of change in LOLE (rather than $/kW in a
particular location).
2) Running MARS studies on the “As-cleared” system in each
Spot Auction to estimate the marginal effect on LOLE from
cleared MW for each zone.
Cleared capacity resource payment (in $/MW) = (1) × (2).
Alternate Capacity Market Framework
• Advantages over the approach discussed earlier:
Capacity prices in each zone more accurately reflect the value
of capacity, since this alternative approach uses fewer
intermediate calculations and approximations.
May be less resource-intensive than the process of defining
capacity zones, Fungible Areas, Benefit Ratios, etc.
- However, some of these would still be necessary to account
for inter-zonal transmission security.
• Disadvantages:
Spot auction becomes more resource-intensive, and it may be
impractical to allow most resources to offer > $0.
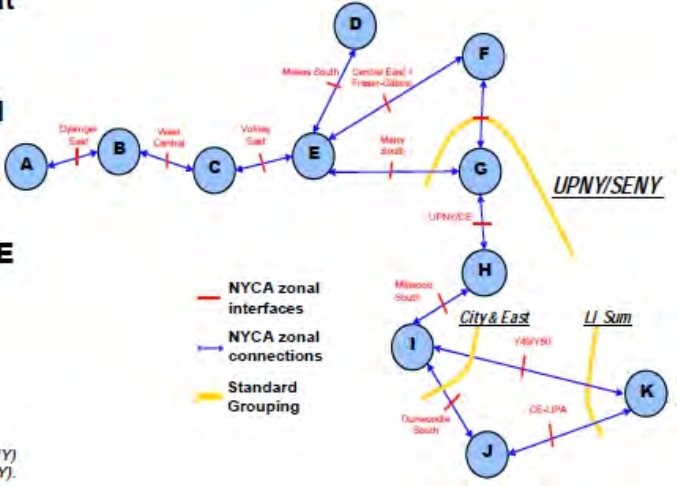
Appendix A: Pre-Define Capacity Market Interfaces
Slide 6 in NYISO Zone K Tech Conference Presentation
Appendix B: Identify Capacity Zones
List of Potential Capacity Zones
Capacity Market Interface(s):Capacity Zone:
Dysinger EastZones B - K
West CentralZones C - K
Volney EastZones D - K
Moses SouthZones A - C, E - K
CE GroupZones F - K
UPNY-SENYZones G - K
UPNY-CEZones H - K
Millwood SouthZones I - K
City & East (group)Zones J, K
Dunwoodie SouthZone J
Y49/Y50Zone K
Appendix C: Elements of an Enhanced Framework:
Non-Fungible Areas - Benefit Ratios
• At least two methods might be used to calculate Benefit Ratios.
Both start with a base case scenario where the Non-Fungible
Area is at the Export Limit.
1) Delta LOLE Comparison Method: Calculate LOLE for:
Sensitivity Case 1: +X MW in upstream region;
Sensitivity Case 2: +X MW in Fungible Area; and
Sensitivity Case 3: +X MW in Non-Fungible Area.
Benefit Ratio = (LOLE1 - LOLE3) ÷ (LOLE1 - LOLE2)
X could be based on size of demand curve unit
Appendix C: Elements of an Enhanced Framework:
Non-Fungible Areas - Benefit Ratios
2) Binding Constraint Frequency Method:
Run one MARS case where X MW is added to the base case
in the Non-Fungible Area.
Analyze the configuration of binding constraints relative to
capacity short areas during MARS LOL events.
•For both methods, the Benefit Ratio could be calculated from
more than one value for X.
•The second method would be less resource intensive.
Appendix D: Elements of an Enhanced Framework
Non-Fungible Areas - Clearing the Spot Auction
$12
Offers - Not Export LimitedOffers in Fungible Area
Offers - Export LimitedOffers in Non-Fungible Area -Not Export Limited
$10Export LimitOffers in Non-Fungible Area -Benefit Ratio Adjusted
Demand Curve
$8Clearing Price in Fungible Area if
Benefit Ratio Adjusted Offers Excluded
$6Clearing Price inClearing Price in
Non-Fungible AreaFungible Area
$4
$2
$0
5.566.51313.51414.515
Offers in Non-Fungible Area (GW)Supply of Offers in Capacity Zone (GW)
Compliance with FERC Order
on Technical Conference re:
Treatment of Zone K Export
Constraints into the G-J
Locality
Randy Wyatt
Capacity Market Products
New York Independent System Operator
ICAPWG
February 24, 2015
NYISO, Rensselaer, NY
© 2000 - 2015 New York Independent System Operator, Inc. All Rights Reserved.
DRAFT - FOR DISCUSSION PURPOSES ONLY
Objective: In Compliance with the November
25, 2014 FERC Order on the (February 25,
2014) Technical Conference:
Explore with stakeholders “whether a proposal can be
developed that could reduce the cost of procuring capacity
while meeting the NYISO LOLE objective.”[emphasis added]:
and
“[E]xplore the issues and evaluate the proposals discussed
at the conference, including the MMU’s recommendations,
through its stakeholder process and file an informational
report with the Commission by June 1, 2015.”
To facilitate exploration and evaluation, this presentation groups
by issue proposals discussed at the Technical Conference.
© 2000 - 2015 New York Independent System Operator, Inc. All Rights Reserved.
DRAFT - FOR DISCUSSION PURPOSES ONLY
Proposals Raised During the Tech Conference
Treatment of Zone K Export Constraint Limits in NYISO G-J Demand
Curves
Accurately reflect the reliability benefits of Zone K excess in SENY and NYCA
Monitor export constraints for each DCR to determine if Zone K should be added to boundary of G-J
Locality
Recognize the reliability and transmission security benefits that Zone K can provide the NCZ
Evaluate to what extent any export constrained zone in the NYISO should be allowed to sell capacity in
any other zone
Evaluate alternative LCR methodologies that
better reflect the export constraint constraints
more accurately reflect the reliability value of capacity resources in different areas, or
considers a deliverability-based methodology for the LCRs associated with new Localities
Evaluate rules to achieve price convergence or eliminate Localities
Assess improved methodologies for modeling deliverability constraints
and identify deliverability constraint triggers that warrant pre-definition of
capacity zones
Seek tariff amendments to include a detailed description of tests/metrics to be used in establishing NCZ
boundaries
Consider developing a Capacity Deliverability Right for Transmission
Expansion increasing the deliverability of the constrained interface
© 2000 - 2015 New York Independent System Operator, Inc. All Rights Reserved.
DRAFT - FOR DISCUSSION PURPOSES ONLY
Status of Discussions
MMU discussions at August 20, and
November 14, 2014 ICAPWG meetings
clarifying SOM recommendations re: An
Enhanced Capacity Market Framework:
Dynamic locational requirements
Fungibility and treatment of export constraints
Procurement Targets to be used in place of the LCR
Requires significant changes to current capacity market Complicated to define and administer key elements
© 2000 - 2015 New York Independent System Operator, Inc. All Rights Reserved.
DRAFT - FOR DISCUSSION PURPOSES ONLY
Status of Discussions (continued)
NYISO led discussions at ICAPWG and
MIWG meetings regarding market design
concepts for:
Capacity Zone Elimination - October 30, 2014 ICAPWG
• Is there a need to eliminate?
• Zone elimination objectives and challenges
Capacity Zone Predefine and Eliminate - November 17,
2014, ICAPWG
• Discussed whether there is a need to predefine and eliminate
capacity zones, and if there is, discuss design concepts for each
• Reviewed how PJM predefines and eliminates zones
• NYISO possible options for predefine and eliminate
• Potential triggers and issues to be addressed for zone elimination
© 2000 - 2015 New York Independent System Operator, Inc. All Rights Reserved.
DRAFT - FOR DISCUSSION PURPOSES ONLY
Status of Discussions (continued)
NYISO led discussions at December 18
MIWG regarding market design concepts
for the “Treatment of Zone K Export
Constraints into the G-J Locality”
Reviewed existing pricing hierarchal rules and auction
mechanics
Proposed to solve the ICAP Spot Auction as we do today,
with an additional step
• Count the MW that clear above the Zone K LCR, up to the K export
limit MW, toward the G-J requirement, and count the remaining MW
that clear in K above the Zone K LCR (i.e., those above the export
limit) toward the NYCA requirement
© 2000 - 2015 New York Independent System Operator, Inc. All Rights Reserved.
DRAFT - FOR DISCUSSION PURPOSES ONLY
Status of Discussions (continued)
NYISO is in the process of creating a task
force to review within the ICAPWG the
current LCR determination process for
localities
The Task Force was discussed with the Operating
Committing meeting on January 15, 2015
© 2000 - 2015 New York Independent System Operator, Inc. All Rights Reserved.
DRAFT - FOR DISCUSSION PURPOSES ONLY
Process Steps for Evaluating Technical
Conference Proposals
March 18 ICAPWG - Stakeholders can present
export constrained zone modeling concepts
Objective
Preferred approach and alternatives Numeric example
Benefits and detriments
April 30 ICAPWG: Continue stakeholder
discussions
June 1, 2015 - NYISO to submit informational
report to FERC
© 2000 - 2015 New York Independent System Operator, Inc. All Rights Reserved.
DRAFT - FOR DISCUSSION PURPOSES ONLY
© 2000 - 2015 New York Independent System Operator, Inc. All Rights Reserved.
DRAFT - FOR DISCUSSION PURPOSES ONLY
IRM/LCR Process & Dynamics
Presented to Joint ICAP/MIWG/PRLWG Mee;ng
January 29, 2015
by
Mark Younger
Hudson Energy Economics, LLC
Background
• The NYISO presented their analysis on the
required LCRs for the 2015/2016 capability year
at this month’s OC mee;ng
• This engendered substan;al discussion about
what was driving the LCR numbers and whether
the methodology needs to be revised.
• The NYISO agreed to coordinate a discussion
about the exis;ng IRM/LCR seYng methodology
and a review of whether the methodology should
be revised.
LCR Driving Factors?
• During the discussion, some par;es proposed
that under the exis;ng IRM/LCR methodology
adding capacity to a zone will cause the zones
LCR to increase
• I noted that changes in UDR elec;ons could
impact the LCR calcula;ons
• A number of par;es raised the concern that it is
cri;cal to understand how specific drivers impact
the LCR determina;on for each Sub-‐Zone
The Need To Analyze the Current
Methodology
• The first step to determining whether the IRM/
LCR seYng methodology should be revised is to
get a beaer understanding of how the process
responds to changes to the system
• MPs are significantly hampered in geYng this
understanding because most of the data is
appropriately confiden;al
• Only the NYISO is in a posi;on to perform the
analysis
Proposed Analysis
• I have developed some simple sensi;vi;es to
provide beaer understanding of how the exis;ng
process works and the factors that will affect it
• The intent of the analysis is to provide
informa;on on how discrete system changes will
affect the IRM/LCR values in the different zones
under the exis;ng methodology
• With the analysis results we can get a beaer
understanding of the current IRM/LCR
methodology and whether those results indicate
a need to revise the methodology
Proposed Analysis (cont’d)
• Start with the final database for the IRM/LCR that
was approved for 2015/2016
• Each Sensi;vity is a discrete change to the final
database
• Run a complete TAN-‐45 analysis for each of the
sensi;vi;es to determine the IRM and then apply
the LCR calcula;on process for each of the
Capacity Zones
• Report the resul;ng IRM and LCRs for each
sensi;vity
Sensi;vi;es
• Add a 500 MW generic generator to NYC with
the generator EFORd set at the Zone J average
• Add a 500 MW generic generator to Zones G -
I with the generator EFORd set at the LHV
average
• Reduce UDR elec;ons into NYC by 300 MW
• Increase UDR elec;ons into NYC by 300 MW
• Model the TOTs Projects
LCR Process
Review
Dana Walters
Director Economic and Reliability Planning
New York Independent System Operator
LCR Task Force
March 5, 2015
NYISO, Krey Corporate Center
© 2000 - 2015 New York Independent System Operator, Inc. All Rights Reserved.
DRAFT - FOR DISCUSSION PURPOSES ONLY

Administrative
Introductions
Approach to Meeting
Provide a starting reference for task force
members for consistent understanding of
objectives, issues, and processes
Discuss background information
Discuss expressed concerns with LCR process
Discuss existing processes
Discuss topics for next meeting, but don’t discuss
specifics of alternatives or solutions at this
meeting
Discuss meeting schedule
© 2000 - 2015 New York Independent System Operator, Inc. All Rights Reserved.
DRAFT - FOR DISCUSSION PURPOSES ONLY
Issue Statement
Some stakeholders have expressed
concerns with the existing Locational
Capacity Requirements (LCRs)
process because:
When load decreases and resources increase, then
requirements in G-I may increase
If the requirements increase, then Load Serving Entities
(LSEs) need to buy more capacity.
This seems counter-intuitive when new resources are
available to respond to a need.
© 2000 - 2015 New York Independent System Operator, Inc. All Rights Reserved.
DRAFT - FOR DISCUSSION PURPOSES ONLY
Background of Request
NYISO was asked by the Operating Committee to
work with the ICAP WG to take the lead in
considering an alternative process to calculate
LCRs to address the concerns raised
NYISO extended to stakeholders an invitation to
participate on a LCR Task Force to consider the
issue
NYISO is coordinating the effort to scope the
request, consider alternatives and perform
analysis of potential viable options, as resources
permit
© 2000 - 2015 New York Independent System Operator, Inc. All Rights Reserved.
DRAFT - FOR DISCUSSION PURPOSES ONLY
Installed Reserve Margin
A Power Grid requires Installed Reserve Margin
(IRM) to operate its generating fleet and provide
customers with reliable service
There are infinite ways to calculate the LSE
obligations to provide for the IRM and LCRs
In NY, the Transmission Owners (TOs) reached an
agreement to balance the obligation for the IRM
between the upstate (north of NYC; Zones A-I) LSEs
and the downstate LSEs (NYC & LI; Zones J & K)
Roughly 50% of the peak electrical demand in NY is
in Zones A-I and 50% in J & K
© 2000 - 2015 New York Independent System Operator, Inc. All Rights Reserved.
DRAFT - FOR DISCUSSION PURPOSES ONLY
Background of Unified Methodology
Unified Methodology is a two step process
Step 1 (referred to as the Tan 45 method): Develop a curve with
varying IRM versus locational requirements in Zones J & K,
where all points on the curve will provide a one day in ten year
(0.1) Loss of Load Expectation (LOLE)
Use a 45 degree line to intersect the curve and provide a 50%
balance point
Step 1 is administered by NYSRC
Step 2 (LCR Method): Starting with the IRM as a reference,
determine the locational requirements of Zones J & K and the G-
J Locality
Step 2 is administered by NYISO
Both steps use the GE Multi-Area Reliability
Simulation (MARS) program, which uses a Monte
Carlo probabilistic simulation to evaluate the LOLE
© 2000 - 2015 New York Independent System Operator, Inc. All Rights Reserved.
DRAFT - FOR DISCUSSION PURPOSES ONLY
Creation of New G-J Locality
NYISO was directed by FERC to create a new
Locality based on the outcome of study
NYISO created the G-J Locality
An LCR has to be established for each Locality, so
the NYISO developed a process to calculate the G-J
requirement without impacting the existing Tan 45
process
© 2000 - 2015 New York Independent System Operator, Inc. All Rights Reserved.
DRAFT - FOR DISCUSSION PURPOSES ONLY
© 2000 - 2015 New York Independent System Operator, Inc. All Rights Reserved.
DRAFT - FOR DISCUSSION PURPOSES ONLY

Setting of the IRM and LCRs
The Basic Process
Greg Drake
Supervisor - Resource Adequacy
New York Independent System Operator
ICAP WG Task Force for LCR Review
March 5, 2015
NYISO , Rensselaer, NY
© 2015 New York Independent System Operator, Inc. All Rights Reserved.
DRAFT - FOR DISCUSSION PURPOSES ONLY
Objectives
Basic understanding of the NYSRC’s
process for setting the IRM1
Basic understanding of the NYISO’s
process for setting the LCRs2
The LCR process starts with the completed
base case database for the IRM.
1.To find NYSRC Policy 5-8 go to Documents/Policies at http://www.nysrc.org.
2.To find NYISO LCR Calculation Process go to NYISO website at nyiso.com and look
under Market Data/ICAP/Reference Documents/LCR_Calculation_Process
© 2015 New York Independent System Operator, Inc. All Rights Reserved.
DRAFT - FOR DISCUSSION PURPOSES ONLY
IRM Process - Background
The IRM study3 occurs over a calendar year
for an upcoming Capability Year (May-
April)
NYISO populates data and performs
simulations under guidance of NYSRC’s
ICS.
The NYISO is a technical resource for the
NYSRC
3. To find present and past IRM reports go to Documents/Reports at http://www.nysrc.org.
© 2015 New York Independent System Operator, Inc. All Rights Reserved.
DRAFT - FOR DISCUSSION PURPOSES ONLY
IRM Process - Background
IRM answers the question of how much
ICAP is needed to meet the peak load.
The year is simulated at least 1,000
times to give a Loss of Load
Expectation (LOLE).
Capacity is adjusted so that over the
1,000 iterations, the LOLE comes out to
the NYSRC criterion of 0.100 days/year.
© 2015 New York Independent System Operator, Inc. All Rights Reserved.
DRAFT - FOR DISCUSSION PURPOSES ONLY
IRM Process - Load Inputs
The load forecast is based on previous year
actual plus forecast growth (TO/NYISO agreement)
The forecast represents a 50% chance the actual load is higher
(50/50 forecast)
Uncertainty of load due to weather is
studied.
Each 1,000 iteration case is run against seven load levels with
various probabilities.
For example, one of the levels could indicate the load if there
was only a 6% probability of being above that load (94/6
forecast).
Each load level can have its own historic
hourly load shape.
We currently use 3 shapes.
© 2015 New York Independent System Operator, Inc. All Rights Reserved.
DRAFT - FOR DISCUSSION PURPOSES ONLY
Load Forecast Uncertainty
LFU Model
Load Forecast Uncertainty Models
Multiplier Zones A-E Zones F&GZones H&I Con Ed (J) LIPA (K)
0.00620.85500.82450.78930.84490.7971
0.06060.90210.88300.85000.89290.8677
0.24170.95100.94200.91230.93970.9364
0.38301.00001.00000.97410.98311.0000
0.24171.04741.05541.03291.02021.0554
0.06061.09161.10671.08561.04811.0996
0.00621.13091.15241.12891.06351.1295
LFU Distributions
0.450
0.400
0.350
0.300
0.250
0.200
0.150
0.100
0.050
0.000
0.7800.8200.8600.9000.9400.9801.0201.0601.1001.1401.180
JKZones H&IZones A-EZones F&G
© 2015 New York Independent System Operator, Inc. All Rights Reserved.
DRAFT - FOR DISCUSSION PURPOSES ONLY
IRM Process, Load Inputs-continued
Reasons for using different load shapes:
Historically, years where the peak was around the 90/10
forecast (higher load level), the hourly load shapes were
peaked.
• By peaked, we mean that the number of days whose peaks are near
to the peak day were small
• The shapes chosen are based on a conservative year, a peaked year,
and a typical year
Even though there are seven load levels,
risk (LOLE events) occurs only in the top
four bins.
© 2015 New York Independent System Operator, Inc. All Rights Reserved.
DRAFT - FOR DISCUSSION PURPOSES ONLY
IRM Process - Capacity Inputs
5 years of historical performance is used to predict
future availability of thermal and large hydro
generators.
Wind and solar use one year of production data.
Run of river hydro uses a plot of monthly output based on
history
The simulation program uses a Monte Carlo
methodology to probabilistically generate hourly
outage patterns for thermal units for each of the
1,000 iterations.
Special Case Resources (SCRs) are modeled based
on registrations and are derated based on tested
and historic performance.
© 2015 New York Independent System Operator, Inc. All Rights Reserved.
DRAFT - FOR DISCUSSION PURPOSES ONLY
IRM Process - Other Inputs
We model interface limits between Zones and
between Areas4 (line and bubble diagram).
Unforced Deliverability Rights (UDR) facilities, to
the extent they have not elected to return them for
the upcoming Capability Year (i.e., notification to
NYISO by August 1) are modeled as contracts.
Contract levels on UDRs are considered confidential
Any tie capacity left (after contracts) is available for emergency
assistance
4. Current computing capabilities do not support use of a power flow model in GE MARS.
© 2015 New York Independent System Operator, Inc. All Rights Reserved.
DRAFT - FOR DISCUSSION PURPOSES ONLY
IRM Process - Other Inputs
We model the Emergency Operator Procedures
(EOPs) that can be employed during a system
emergency.
Such as: Voltage reductions, Emergency Demand
Response Program (EDRP), Public Appeals, voluntary industrial curtailments, and operating reserves.
Finally, we can ask for emergency assistance from
our neighbors.
We model neighboring interconnected Control Areas of
PJM (classic footprint), New England, Ontario and Quebec
© 2015 New York Independent System Operator, Inc. All Rights Reserved.
DRAFT - FOR DISCUSSION PURPOSES ONLY
Transmission System Representation for Year 2015 - Summer Emergency Ratings (MW) 6/30/2014
IRM 2015/ICS
10/01/2014
Final Review
1850
IESO
(Ontario)
Hydro
Quebec
1912(HQ)
1,000
Cedars
1
300
1200
100
1,500
190D
03250/3200/
3003140/3035/
16002920
F
Phase 2 Highgate
250
0
Vermont
1400
800
NY / NE
1300
1700Dysinger
East
1999
A
B
Moses South
West13002650
Volney East
Central
1999
E
1300C5650
1999
3475
1999
Marcy
South
G
Central MA
1400 → ← 1400
800
W estern MA
Athens-
Gilboa
New England
2200/1575/
950600
550
16001700
4800/4725/600
4640/4485/1999
Zone A Group 2300/1550/
775
PJM
Central
550
2005700
1015
300
CE Group
300
8400
4310→ ← 3400
UPNY-CE
5210
H
Millwood South
1999
8450
UPNY-SENY800
Connecticut
5150
330
Norwalk
CT
428
PJM
West
5500
7500
850
PJM South
6500West
PJM Mid-Atlantic
PJM East
0
See Next Slide
I
530
1999
Dunwoodie
South
City & EastLI Sum
51601525 → ← 297/260/144
428/388
1290
K
330Cross Sound
4400Controllable Line
235660
NYCA zonal interfaces
NYCA zonal connections
External connections
1,500 Dynamic internal transfer limits 1,500 NYCA internal transfer limits
1,500External transfer limits
Neptune Controllable
JLine
510/ 403/283
← 199
LI West
Standard Grouping
Grouping used for monitoring
X NYCA zone
X “Dummy” zone for analysis
© 2015 New York Independent System Operator, Inc. All Rights Reserved.
DRAFT - FOR DISCUSSION PURPOSES ONLY
Transmission System Representation for Year 2015 - Summer Emergency Ratings (MW)
PJM-SENY MARS Model
6/30/2014
Joint interface to
monitor flow balance
PJMNYCA
1000
RECO
10001000
1000/600/
1000
G
0
H
I
1000/600/
500/400
J
1000
PJM
East
0
500/400
1000
815
A Line + VFT
HTP
Dummy
Zone (J2)0
815Dummy
Zone (J3)
500
Dummy
660Zone (J4)0
815/700/500/200660
K
660
Neptune Controllable Line
(PJM East to RECO) + (PJM East to J2) + (PJM East to J3) + (PJM East to J4) = 3075 MW
© 2015 New York Independent System Operator, Inc. All Rights Reserved.
DRAFT - FOR DISCUSSION PURPOSES ONLY
IRM Process - One Curve Point
If, after utilizing all means possible to meet
the peak load, there is still a shortage, a
loss of load event is registered.
A single load level LOLE value is the
expected loss of load events per year at this
level.
The final LOLE is arrived at by multiplying each load level
probability times its result and adding the seven values.
The model is re-run varying the amount of
capacity removed until 0.100 LOLE is met.
NYCA currently has excess capacity
© 2015 New York Independent System Operator, Inc. All Rights Reserved.
DRAFT - FOR DISCUSSION PURPOSES ONLY
IRM Process - Multiple Curve Points
Capacity upstate has a different statewide
LOLE impact than capacity downstate.
Where and how the capacity is adjusted
affects the final results.
The IRM-LCR curve (next slide) shows the
relationship of the tradeoffs between
statewide and J&K locality values (all points
are at criteria).
The NYSRC technical report indicates the
IRM at the knee (or tan 45) of the curve.
© 2015 New York Independent System Operator, Inc. All Rights Reserved.
DRAFT - FOR DISCUSSION PURPOSES ONLY
Figure 3-2 NYCA Locational Requirements vs. Statewide Requirements
New York City [IRM = 17.3%, MLCR = 83.4%]
90
88
86
84
82
80
1415
y = 0.3686x2 - 13.621x + 208.77
R² = 0.9999
1617181920 In stalled R eserve Margin (%)
© 2015 New York Independent System Operator, Inc. All Rights Reserved.
DRAFT - FOR DISCUSSION PURPOSES ONLY
Long Island [IRM = 17.3%, MLCR = 103.7]
112
110
y = 0.4114x2 - 15.313x + 245.47
108R² = 0.9999
106
104
102
100
14151617181920
In stalled R eserve Margin (%)
© 2015 New York Independent System Operator, Inc. All Rights Reserved.
DRAFT - FOR DISCUSSION PURPOSES ONLY
LCR Process - Background
The IRM study shows indicative LCR
values for Zones J & K. Actual LCR
values are found during the LCR study.
The LCR Study starts with the completed IRM database
The LCR values must also comply with
the LOLE criteria.
A separate IRM-LCR curve is not
created since the IRM value is a fixed
input to the LCR study.
© 2015 New York Independent System Operator, Inc. All Rights Reserved.
DRAFT - FOR DISCUSSION PURPOSES ONLY
LCR Process - Input Changes
The load forecast is updated between
the time of the IRM and LCR studies.
Other material changes5 could also be
incorporated.
The resulting LCRs could look different than the
ones shown in IRM.
5. Material capability changes are individual changes that would increase or decrease generation, CRIS MW, or transmission transfer capability by 200 MW or greater.
© 2015 New York Independent System Operator, Inc. All Rights Reserved.
DRAFT - FOR DISCUSSION PURPOSES ONLY
LCR Process - Steps
At the established IRM study point:
Reset all capacity to Zones J & K. to their ‘as found’
condition.
Shift capacity from Zone J to upstate zones (A, C, and D)
until the LOLE criteria is met.
Reset the capacity from J and shift from Zone K.
Reset the capacity from K and shift from J & K based on
ratios found above. This sets the recommendation for
the J and K LCRs.
Reset J’s capacity and freeze K’s at the above found LCR
level.
Shift capacity from G-J. The remaining capacity divided
by the G-J peak load is the proposed G-J LCR6.
6. The LCR values are rounded to the nearest 0.5% and the LOLE is verified to satisfy LOLE criteria
© 2015 New York Independent System Operator, Inc. All Rights Reserved.
DRAFT - FOR DISCUSSION PURPOSES ONLY
Numerical Example7 of LCR Calculations
Setting of Zones J and K LCRs (example)
MWsStartingAfter ShiftPeak LoadMargin
ZonesShifted:J Ratio:K Ratio:CapacityCapacityForecast%
Shift J alone500105001000011929
Shift K alone400600056005539
=500/(400+500)=400/(400+500)
Ratios found:0.55555560.4444444
Shift J and K700
Final J388.9=700*0.561050010111.11192984.8%
Final K311.1=700*0.4460005688.95539102.7%
Setting LCRs for the G -J Locality (example)
MWsStartingAfter ShiftPeak LoadMargin
ZonesShifted:J Ratio:K Ratio:CapacityCapacityForecast%
Shift G - J70515425147201634090.1%
Fixed Shift of K:311.160005688.95539102.7%
7. All capacity values are in ICAP
© 2015 New York Independent System Operator, Inc. All Rights Reserved.
DRAFT - FOR DISCUSSION PURPOSES ONLY
Numerical Example8 of LCR Calculations
After 600 MW Unit Addition in Zone G
Setting of Zones J and K LCRs (example)
MWsStartingAfter ShiftPeak LoadMarginInitial Case
ZonesShifted:J Ratio:K Ratio:CapacityCapacityForecast%Margin(%)
Shift J alone60010500990011929
Shift K alone500600055005539
Ratios found:0.5454550.454545
Shift J and K900
Final J490.91050010009.11192983.9%84.8%
Final K409.160005590.95539100.9%102.7%
Setting LCRs for the G -J Locality (example)
MWsStartingAfter ShiftPeak LoadMargin
ZonesShifted:J Ratio:K Ratio:CapacityCapacityForecast%
Shift G - J90516025151201634092.5%90.1%
Fixed Shift of K:409.160005590.95539100.9%102.7%
8. All capacity values are in ICAP
© 2015 New York Independent System Operator, Inc. All Rights Reserved.
DRAFT - FOR DISCUSSION PURPOSES ONLY


The New York Independent System Operator (NYISO) is a not-for-profit
corporation that began operations in 1999. The NYISO operates New York’s
bulk electricity grid, administers the state’s wholesale electricity markets, and
provides comprehensive reliability planning for state’s bulk electricity system.
__________________________________________________________
www.nyiso.com
© 2015 New York Independent System Operator, Inc. All Rights Reserved.
DRAFT - FOR DISCUSSION PURPOSES ONLY
LCR Process Review:
Next Steps
Dana Walters
Director Economic and Reliability Planning
New York Independent System Operator
LCR Task Force
March 5, 2015
NYISO, Krey Corporate Center
© 2000 - 2015 New York Independent System Operator, Inc. All Rights Reserved.
DRAFT - FOR DISCUSSION PURPOSES ONLY
Scope
Discuss stakeholder concerns with the
current process
Discuss viable options to explore
Strictly from the LCR perspective
Whether it would be beneficial to involve IRM
© 2000 - 2015 New York Independent System Operator, Inc. All Rights Reserved.
DRAFT - FOR DISCUSSION PURPOSES ONLY
Concerns with changing the
LCR process
If the LCR increases in G-I, but the other
Localities and NYCA minimum
requirements decrease, stakeholders’
views of the change may vary.
There is only one variable in the LCR
process after the application of the Tan 45
process (trade-offs for LSEs south of
UPNY/SENY)
© 2000 - 2015 New York Independent System Operator, Inc. All Rights Reserved.
DRAFT - FOR DISCUSSION PURPOSES ONLY
Stakeholder Suggestion
Suggestion: As opposed to TAN45
optimizing b/w Zone J vs K and letting G-J
“fall out” as a result; TAN45 optimizing b/w
Zone K vs G-J and let J “fall out” as a
result. In this manner Zone J is partially
optimized through G-J.
Issue: We would need to decide how to
optimize and what quantities to add/deduct
by individual Zone (G, H, I, J). Optimization
may not result in minimum requirements
for an individual Zone.
© 2000 - 2015 New York Independent System Operator, Inc. All Rights Reserved.
DRAFT - FOR DISCUSSION PURPOSES ONLY
Stakeholder Concerns: Inter-relationship with IRM
process
Some possible LCR process revisions might not
be possible without the IRM process being
changed prior to or concurrent with a change to
the LCR process
Changing the IRM process is a more complicated
issue and will raise other issues, most notably the
IRM is under the jurisdiction of the NYSRC
© 2000 - 2015 New York Independent System Operator, Inc. All Rights Reserved.
DRAFT - FOR DISCUSSION PURPOSES ONLY
© 2000 - 2015 New York Independent System Operator, Inc. All Rights Reserved.
DRAFT - FOR DISCUSSION PURPOSES ONLY
Objective of LCR Methodology Review:
Possible Alternatives
Dana Walters
Dir. Reliability and Economic Planning
New York Independent System Operator
LCR Task Force
April 8, 2015
KCC
© 2000 - 2015 New York Independent System Operator, Inc. All Rights Reserved.
DRAFT - FOR DISCUSSION PURPOSES ONLY
Current Process
NYSRC: Determine Installed Reserve Margin
(IRM), where the IRM maintains reliability and
establishes balance between the upstate and
downstate requirements per Policy 5
NYISO: There are multiple possible
approaches to determine the Locational
Minimum Installed Capacity Requirements
(LCRs)
The NYISO has been using Policy 5 as a
guide for the methodology to establish the
LCRs
© 2000 - 2015 New York Independent System Operator, Inc. All Rights Reserved.
DRAFT - FOR DISCUSSION PURPOSES ONLY
Possible Alternatives
(Subject to maintaining LOLE of 0.1 and the IRM determined by NYSRC)
Continue with current methodology
Minimize Cost: Explore methodologies to set LCRs
for J, K and G-J with the objective of minimizing
the NYCA-wide capacity procurement costs
Minimize total MW: Explore methodologies to set
LCRs for J, K and G-J with the objective of
minimizing the NYCA-wide MW requirement
Lowest Possible G-J: Retain J and K “as found”
and determine the minimum G-J
Other ideas
© 2000 - 2015 New York Independent System Operator, Inc. All Rights Reserved.
DRAFT - FOR DISCUSSION PURPOSES ONLY
© 2000 - 2015 New York Independent System Operator, Inc. All Rights Reserved.
DRAFT - FOR DISCUSSION PURPOSES ONLY