Howard H. Shafferman
Direct: 202.661.2205
Fax: 202.626.9036
hhs@ballardspahr.com
May 11, 2012
By Electronic Filing
Hon. Kimberly D. Bose, Secretary
Federal Energy Regulatory Commission
888 First Street, N.E.
Washington, D.C. 20426
Subject:
Midwest Independent Transmission System Operator, Inc. and
International Transmission Company d/b/a ITCTransmission, Docket
No. ER11-1844-000, PUBLIC Version of Testimony of New York
Independent System Operator, Inc. Witness Wesley J. Yeomans
Dear Ms. Bose:
The New York Independent System Operator, Inc. submits by electronic filing the
PUBLIC version of the attached Prepared Direct and Answering Testimony of Wesley J.
Yeomans (Exhibit NYI-1 for identification), with verification.
The testimony has been served on all parties as required by Rule 2010 of the Commission’s
Rules of Practice and Procedure. In addition, two three-hole punched chambers copies are
being provided to Presiding Administrative Law Judge Steven Sterner, along
with a summary of the testimony.
Very truly yours,
/s/ Howard H. Shafferman
Howard H. Shafferman
Cc: Parties of Record
Vintricia Alexander. (Law Clerk to Judge Sterner)
HHS/
DMEAST #15031566 v1
Atlanta
|
Baltimore
|
Bethesda
|
Denver
|
Las Vegas
|
Los Angeles
|
New Jersey
|
Philadelphia
|
Phoenix
|
Salt Lake City
|
San Diego
Washington, DC
|
Wilmington
|
DOCKET NO. ER11-1844
EXHIBIT NO. NYI-1
UNITED STATES OF AMERICA
BEFORE THE
FEDERAL ENERGY REGULATORY COMMISSION
Midwest Independent Transmission System
Operator, Inc. and
Docket No. ER11-1844-000
International Transmission Company d/b/a
ITCTransmission
SUMMARY OF TESTIMONY OF WESLEY J. YEOMANS (EXHIBIT NYI-1)
Mr. Yeomans is Vice President of Operations for the New York Independent System
Operator, Inc. (“NYISO”).
By submitting testimony addressing the merits of the MISO/ITC filing, the NYISO is not
conceding that the Commission has legal authority under the Federal Power Act to accept the
MISO/ITC filing, that the Commission has made the findings necessary to permit the NYISO to
recover PAR-related charges it receives from MISO from the NYISO’s customers, or that the
collection of any or all the proposed charges - under any circumstance - is just and reasonable
and not unduly discriminatory or preferential.
In Section III of his testimony, Mr. Yeomans provides an introduction to phase angle
regulators (“PARs”) and transmission loading relief procedures (“TLRs”) (page 3, line 21
through page 9, line 2). Each is a key concept in this proceeding, and in the testimony of NYISO
witnesses. Mr. Yeomans explains the function of PARs (page 3, line 22 through page 4, line 20),
and provides an overview of the history of the PARs at issue in this proceeding (the
“Replacement PARs”) and the failed PAR (the “Original PAR”) that they replaced, as well as the
PARs (the “Hydro One PARs”) on the Ontario side of the Michigan-Ontario interface (the
DMEAST #15024062 v1
“MI/ON Interface”)1 (page 4, line 22 through page 5, line 14). He then explains TLRs, and how
they are implemented (page 5, line 16 through page 7, line 23), and the importance of accurate
modeling of the MI/ON PARs in the NERC Interchange Distribution Calculator (page 8, line 2
through page 9, line 2).
In Section IV of his testimony, Mr. Yeomans responds to the claims of the Midwest
Independent Transmission System Operator, Inc. (“MISO”) and the International Transmission
Company (“ITC”) regarding the expected effectiveness of the MI/ON PARs in fully mitigating
Lake Erie unscheduled power flow (or “loop flow”) (page 9, line 4 through page 10, line 17).
Mr. Yeomans notes that neither MISO nor ITC submitted studies or workpapers supporting the
claimed effectiveness of the MI/ON PARs (page 10, lines 1 through 7), and that the PARs on all
four transmission lines connecting Michigan and Ontario have never been in service at the same
time (page 10, lines 9 through 17).
In Section V of his testimony, Mr. Yeomans addresses the operating rules for the MI/ON
PARs agreed to by MISO and the Independent Electricity System Operator (Ontario) (“IESO”)
in 2011 (page 10, line 19 through page 13, line 3). The MISO-IESO “Operating Instruction”
provides a operational target that actual power flows over the MI/ON Interface are to be
maintained within a +/-200 MW “Control Band” of the power flows that have been scheduled
over the MI/ON Interface to the maximum extent practical (page 11, line 15 through page 12,
line 10). Mr. Yeomans provides data showing that without any control by the MI/ON PARs, the
flows were within that Control Band about one-half of the time over the past year (page 12, line
12 through page 13, line 3).
1
The Replacement PARs and the Hydro One PARs are referred to collectively in NYISO testimony as the
“MI/ON PARs.”
DMEAST #15024062 v1
2
Section VI of Mr. Yeomans’ testimony explains that, despite the proposal of MISO/ITC
to collect more than half of the cost of the Replacement PARs from NYISO and PJM customers,
MISO and ITC do not propose to assume an obligation to serve those customers (page 13, line 5
through page 16, line 16). MISO asserts that NYISO and PJM customers will be required to pay
the proposed PAR charges even when the Replacement PARs or Hydro One PARs are out of
service (page 13, line 9 through page 15, line 17). ITC disclaims any service obligation
whatsoever (page 15, lines 19 through 27). Mr. Yeomans indicates that in order to be permitted
to charge NYISO and PJM customers for the costs of the Replacement PARs, MISO and ITC
should be required to meet the performance expectations created in the their direct testimony;
namely, that the MI/ON PARs will fully mitigate unscheduled Lake Erie power flows in at least
74% of all hours, and reduce unscheduled power flows by at least 600 MW at times when the
MI/ON PARs are not able to fully mitigate those flows (page 16, lines 2 through 16).
In Section VII, Mr. Yeomans explains that the MISO-IESO Operating Instruction does
not require MISO and IESO to operate the MI/ON PARs to mitigate 600 MW of unscheduled
power flows at time when those flows exceed the +/-200 MW Control Band (page 16, line 18
through page 19, line 23).
Section VIII reviews provisions of the MISO-IESO Operating Instruction that permit
MISO and IESO to favor their own customers and interests, versus those of NYISO and PJM
(page 20, line 1 through page 23, line 22). The operating instruction provides protections to
MISO and IESO that are not available, or not available on an equivalent basis, to NYISO and
PJM (page 20, lines 3 through 17). This disparity applies in cases of control area emergencies
(page 20, line 19 through page 22, line 8), and in cases of unforeseen operational or market
outcomes (page 22, line 10 through page 23, line 8). Further, proposed Attachment SS-1 to the
DMEAST #15024062 v1
3
MISO tariff allows MISO to temporarily suspend normal operations of the MI/ON PARs in the
event of anomalous MISO market results related to the MI/ON PARs, without according similar
rights to NYISO or PJM for anomalous market results in their respective markets (page 23, lines
10 through 22).
Section IX reviews the outage history of the PARs at the MI/ON Interface from 2001 to
the present (page 23, line 24 through page 31, line 3). The Original PAR and the Hydro One
PARs have experienced significant operational difficulties during that period (page 23, line 25
through page 27, line 17). Indeed, when the Replacement PARs were placed into service on
April 5, 2012, not all of the Hydro One PARs were in service, and the history of the MI/ON
PARs indicates that they are prone to failure (page 27, line 19 through page 29, line 12). Mr.
Yeomans explains that this calls into serious question the MISO/ITC claim that the MI/ON PARs
can control Lake Erie unscheduled power flows by 600 MW and for 74 percent of the time (page
29, line 14 through page 30, line 10). Notably, ITC chose a different manufacturer for the
Replacement PARs from the one utilized for the Original PAR and the Hydro One PARs that
have experienced significant failures (page 30, line 8 through page 31, line 3).
Mr. Yeomans evaluates, in Section X of his testimony, the ability of the MI/ON PARs to
mitigate Lake Erie unscheduled power flows when one or more of the Hydro One PARs is out of
service (page 31, line 5 through page 39, line 16). He reviews a series of examples and diagrams
illustrating why the ability to mitigate unscheduled power flows is limited, and reviews
admissions by MISO that the ability to mitigate will be reduced (page 31, line 8 through page 37,
line 2). Based his review of data for prior recent periods when the MI/ON PARs were not in
operation, and for the first month of operations of the MI/ON PARs with one of the Hydro One
PARs out of service, it appears that the performance of the available PARs has not improved
DMEAST #15024062 v1
4
upon the performance that the NYISO recorded for periods when the MI/ON PARs were not
available (page 37, line 4 through page 38, line 15). The Replacement PARs are not capable of
mitigating Lake Erie unscheduled power flows if they are operated without any of the Hydro
PARs in operation (page 39, lines 1 through 16).
In Section XI, Mr. Yeomans explains that all interconnected facilities benefit neighbors
(page 39, line 18 through page 40, line 18). PARs are not a “special class” of transmission
facilities of extraordinary value; they are no different from other transmission facilities that
provide mutual transmission security benefits for neighboring ISOs/RTOs (page 39, line 18
through page 40, line 6). Finally, the Replacement PARs do not provide unique benefits that no
other PARs can provide (page 40, lines 10 through 18).
DMEAST #15024062 v1
5
Docket No. ER11-1844
PUBLIC
Exhibit NYI-1
Page 1 of 42
UNITED STATES OF AMERICA
BEFORE THE
FEDERAL ENERGY REGULATORY COMMISSION
Midwest Independent Transmission System
Operator, Inc. and
Docket No. ER11-1844-000
International Transmission Company d/b/a
ITCTransmission
TESTIMONY OF WESLEY J. YEOMANS
1
I.
SUMMARY OF TESTIMONY
2
A summary precedes my testimony.
3
4
II.
WITNESS IDENTITY AND QUALIFICATIONS
5
Q.
Please state your name, title and business address.
6
A.
My name is Wesley J. Yeomans. I am the Vice President of Operations for the New
7
York Independent System Operator, Inc. (“NYISO”). My business address is 10
8
Krey Boulevard, Rensselaer, NY 12144.
9
10
Q.
Please describe your educational background and work experience.
11
A.
I received my Bachelor of Science degree in Electrical Engineering from Clarkson
12
University in 1984, and a Masters in Business Administration from Syracuse
13
University in 1990. I joined the NYISO in 2009 as its Director of Operations. I was
14
promoted to Vice President of Operations in September of 2011. Prior to joining the
15
NYISO, I worked for Niagara Mohawk Power Corporation and National Grid for
16
twenty-five years. My areas of responsibility at Niagara Mohawk and National Grid
17
included transmission planning analysis, management of bulk power operations,
DMEAST #14919964 v13
Docket No. ER11-1844
Exhibit NYI-1
Page 2 of 42
1
wholesale energy commitment and procurement of supply, and meeting the
2
transmission owner and Load Serving Entity responsibilities of the NYISO OATT.
3
4
Q.
Have you previously testified in regulatory proceedings?
5
A.
Yes. I testified in New York State Public Service Commission proceedings and in
6
the Niagara Mohawk Open Access Transmission Tariff losses proceeding in Docket
7
No. OA96-194.
8
9
Q.
What topics do you address in your testimony?
10
A.
My direct testimony:
11
(i) provides an introduction to phase angle regulators (“PARs”) and transmission
12
loading relief (“TLR”) (see page 3);
13
(ii) addresses claims of the Midwest Independent Transmission System Operator,
14
Inc. (“MISO”) and the International Transmission Company (“ITC”) regarding
15
expected effectiveness of the PARs on the Michigan-Ontario interface (the “MI/ON
16
PARs”) (see page 9);
17
(iii) discusses the operating agreement between MISO and the Independent
18
Electricity System Operator (Ontario) (“IESO”) (see page 10);
19
(iv) describes MISO and ITC’s refusal to assume an obligation to serve NYISO or
20
PJM customers are asked to pay for more than half of the cost of the PARs at issue in
21
this proceeding (the “Replacement PARs”) (see page 13);
22
(v) discusses the absence of an operating agreement requirement that MISO and
23
IESO operate the MI/ON PARs to mitigate 600MW of unscheduled power flows at
Docket No. ER11-1844
Exhibit NYI-1
Page 3 of 42
1
times when those flows exceed the Control Band in their operating agreement (see
2
page 16);
3
(vi) explains the manner in which the operating agreement permits MISO and IESO
4
to favor their own customers and interests (see page 20);
5
(vii) reviews the outage history of the PARs at the Michigan-Ontario interface (the
6
“MI/ON Interface”) (see page 23);
7
(viii) assesses the ability of the MI/ON PARs to mitigate Lake Erie unscheduled
8
power flows when one or more of the PARs on the Ontario side of the MI/ON
9
Interface (the “Hydro One PARs”) is out of service (see page 31); and
10
(ix) explains that all interconnected facilities benefit neighbors (see page 39).
11
12
Q.
In what context are you addressing these topics?
13
A.
By submitting testimony addressing the merits of the MISO/ITC filing, the NYISO is
14
not conceding that the Commission has legal authority under the Federal Power Act
15
to accept the MISO/ITC filing, that the Commission has made the findings necessary
16
to permit the NYISO to recover PAR-related charges it receives from MISO from the
17
NYISO’s customers, or that the collection of any or all the proposed charges - under
18
any circumstance - is just and reasonable and not unduly discriminatory or
19
preferential.
20
21
III.
INTRODUCTION TO PARs AND TRANSMISSION LOADING RELIEF
22
Q.
Could you please explain generically what phase angle regulators are, and what
23
they do?
24
A.
Real power flows are transmitted across transmission lines by creating a phase angle
Docket No. ER11-1844
Exhibit NYI-1
Page 4 of 42
1
difference. It is possible to introduce a phase angle difference on a specific path with
2
a phase angle regulating transformer (“PAR”). A PAR creates a phase angle shift
3
along one path through adjustments to the windings of the transformer. By
4
introducing a phase angle shift on a particular path, the distribution of total power on
5
the PAR and across parallel paths can be adjusted. By taking taps on a PAR, the
6
phase angle can be modified on this controlled path; hence, the flow can be increased
7
or decreased, shifting the displaced MW flow to/from other parallel paths. The
8
amount of taps can be limited by transmission constraints created when increased
9
flow is forced upon other circuits.
10
11
Q.
Which PARs are most relevant to this proceeding?
12
A.
The PARs located on the four major transmission lines (the J5D, L4D, L51D and
13
B3N lines) that interconnect the State of Michigan and Ontario, Canada.
14
15
Q.
In plain English, what happens when a “tap” is taken on a PAR?
16
A.
When a tap is taken on one of the PARs identified above, a relatively large
17
(50MW+) quantity of power is diverted from the path over which it would,
18
otherwise, have flowed. Because PARs affect power flows in a “chunky” manner, it
19
is not possible to “tune” the PARs to achieve the precisely desired quantity of power
20
flow over a transmission line.
21
22
Q.
Please provide a brief history of the ITC and Hydro One PARs.
23
A.
In 2002, the International Transmission Company (“ITC”) installed a PAR at its
Docket No. ER11-1844
Exhibit NYI-1
Page 5 of 42
1
Bunce Creek substation on the B3N line in Michigan (the “Original PAR”). The
2
Original PAR failed in March of 2003. In this proceeding, ITC is asking the
3
Commission to require New York and PJM customers to pay for more than half of
4
the cost of a pair of “Replacement PARs” that ITC installed at its Bunce Creek
5
substation on the B3N circuit to replace the Original PAR. The Replacement PARs
6
entered service on April 5, 2012.
7
8
In order to significantly affect unscheduled Lake Erie power flows, ITC’s
9
Replacement PARs must operate in coordination with three PARs that are owned by
10
Hydro One Networks, Inc. (“Hydro One”) that are located in Ontario, Canada on the
11
J5D, L4D and L51D circuits. The three PARs that Hydro One owns are referred to
12
collectively in my testimony as the “Hydro One PARs.” The Replacement PARs
13
and the Hydro One PARs are all referred to collectively in this testimony as the
14
“MI/ON PARs.”
15
16
Q.
What are Transmission Loading Relief procedures?
17
A.
Transmission Loading Relief or “TLR” is a procedure that Balancing Authorities
18
such as the NYISO, Midwest ISO (“MISO”), the Independent Electricity System
19
Operator (Ontario) (“IESO”), and PJM Interconnection, L.L.C. (“PJM”) use to
20
address power flows that are causing reliability impacts on their transmission
21
systems. It permits Balancing Authorities to request the curtailment or removal of
22
inter-Control Area transactions that have a substantial impact on a particular
23
transmission constraint that presents a reliability risk.
Docket No. ER11-1844
Exhibit NYI-1
Page 6 of 42
1
2
Q.
How is TLR implemented?
3
A.
TLR is implemented via the North American Electric Reliability Corporation’s
4
(“NERC’s”) Interchange Distribution Calculator (“IDC”). The IDC is a database
5
that identifies inter-Control Area transactions that have a 5% or greater impact
6
(distribution factor) on the transmission constraint that TLR is being requested to
7
address. The IDC identifies all scheduled inter-Control Area transactions that have
8
the requisite 5% or greater impact. The Balancing Authority that requires relief
9
specifies the amount of relief it requires, and may request that the transactions the
10
IDC identifies be curtailed (intra-hour) or removed (at the top of the next hour). The
11
IDC then identifies proposed pro rata reductions to all of the transactions that have a
12
5% or greater impact on the transmission constraint that are necessary to achieve the
13
requested level of relief. The IDC then transmits the pro rata transaction reductions
14
to each of the Balancing Authorities that are participants in the transactions that need
15
to be curtailed or removed to provide the requested relief. The pro rata reductions
16
identified by the IDC are then implemented by the Balancing Authorities that receive
17
the TLR.1
18
19
Q.
Please provide a simplified example of how a TLR is implemented.
20
A.
Assume a NYISO transmission line is being significantly affected by Lake Erie
21
unscheduled power flows. NYISO determines that it requires 100 MW of relief to
1 Balancing Authorities that receive TLR requests to apply pro rata reductions to inter-Control Area
transactions are not required to implement the requested reductions, but they ordinarily do so and expect
reciprocal treatment from other Balancing Authorities when they are the issuer of a TLR request.
Docket No. ER11-1844
Exhibit NYI-1
Page 7 of 42
1
protect its transmission facility from overheating (to address a thermal constraint).
2
NYISO’s transmission system operators query the NERC IDC and the IDC identifies
3
a total of five non-firm transactions that have impacts of 5% or greater on the
4
particular New York transmission line that requires relief. They are:
5
1.
200 MW IESO export to MISO that has a 40% distribution factor on the
6
transmission constraint 200 MW * 40% = 80 MW max relief
7
2.
100 MW IESO export to MISO that has a 40% distribution factor on the
8
transmission constraint 100 MW * 40% = 40 MW max relief
9
3.
100 MW MISO export to PJM that has a 30% distribution factor on the
10
transmission constraint 100 MW * 30% = 30 MW max relief
11
4.
100 MW MISO export to PJM that has a 30% distribution factor on the
12
transmission constraint 100 MW * 30% = 30 MW max relief
13
5.
200 MW PJM export to NYISO that has a 10% distribution factor on the
14
transmission constraint 200 MW * 10% = 20 MW max relief
15
The total available relief = 200 MW, requested relief = 100 MW. To achieve the
16
requested relief, the IDC would apply a 50% pro rata reduction to each of the five
17
identified transactions and issue notices to IESO, MISO, NYISO and PJM informing
18
the Balancing Authorities of the TLR request and of the reductions.
19
20
Depending on the urgency of the needed relief, NYISO could use the IDC to request
21
curtailment (in hour) or removal (at the top of the next hour).2
The requests would
22
be sent to the relevant Balancing Authorities, which would be responsible for
23
implementing them.
2 The transactions that the IDC identifies for potential in-hour curtailment could be different from the
transactions that would be available for removal at the top of the next hour. For simplicity, the example
assumes that the set of transactions identified in the IDC remains the same for several hours, so they are
available for curtailment and would still be available for removal at the top of the next hour.
Docket No. ER11-1844
Exhibit NYI-1
Page 8 of 42
1
2
Q.
In what way is the NERC IDC modeling of transactions scheduled over the
3
MI/ON PARs at the MI/ON Interface different from the IDC’s modeling of
4
transactions scheduled at the IESO/NYISO, NYISO/PJM and PJM/MISO
5
interfaces?
6
A.
When IESO sets the MI/ON PARs to “Regulated Mode” in the NERC IDC model,
7
the MI/ON Interface will be modeled in the IDC as perfectly controlling loop flow.
8
In other words, power flows in the model will exactly equal the MISO/IESO
9
scheduled interchange. This will be the case even when the MI/ON PARs are not, in
10
fact, perfectly conforming actual power flows to scheduled power flows.
11
12
Q.
How is the modeling of the MI/ON PARs in the NERC IDC relevant to the
13
practical implementation of TLR?
14
A.
When the MI/ON PARs are set to Regulated Mode in the NERC IDC, the NERC
15
IDC model will not identify transactions scheduled over the MI/ON PARs as
16
contributing to unscheduled power flows that are impacting transmission constraints
17
in the Balancing Authorities around Lake Erie. The modeling of other Lake Erie
18
transactions will be similarly affected. In other words, the IDC model will represent
19
power flows as conforming to schedules, without regard to what is actually
20
happening in the real world.
21
22
For this reason, it is very important for MISO and IESO to timely and accurately
23
reflect the correct scheduling mode for the MI/ON PARs in the NERC IDC.
24
Otherwise, NYISO, PJM and other Balancing Authorities’ ability to use TLR to
Docket No. ER11-1844
Exhibit NYI-1
Page 9 of 42
1
remove transactions that are adversely impacting reliability in their Balancing
2
Authority Areas could be artificially limited and cause adverse reliability impacts.
3
4
IV.
MISO AND ITC CLAIMS REGARDING EXPECTED EFFECTIVENESS OF
5
THE MI/ON PARs
6
Q.
What impact do the witnesses of the MISO and ITC claim the operation of
7
ITC’s Replacement PARs, in coordination with the Hydro One PARs, will have
8
on unscheduled Lake Erie power flows?
9
A.
MISO witnesses state in their testimony (see Webb/Chatterjee testimony at 23, 26
10
and 31, and Mallinger testimony at 19-20) that the Replacement PARs, operating in
11
coordination with the Hydro One PARs, are “expected to fully mitigate Lake Erie
12
loop flows approximately 74% of the time,” (Mallinger at 19) and “during the period
13
of time when the Michigan-Ontario PARs are not able to maintain actual flows equal
14
to scheduled flows, the Michigan-Ontario PARs will still provide a 600 MW offset
15
of potential circulation flows.” (Mallinger at 20).
16
17
MISO witness Mallinger provided greater detail regarding the assertions in his
18
testimony in his response to data request NYISO/MISO 2-3(c) (Exhibit NYI-2):
19
Loop flow is defined as the difference between scheduled flow and actual
20
flow across an interface. By measuring Lake Erie loop flow at the
21
Michigan-Ontario interface, actual flow will be compared with MISO-
22
IESO scheduled flow. Where a deviation exists, this represents Lake Erie
23
loop flow. It is expected that operation of the New PARs and the Hydro
24
One PARs will maintain actual flow equal to scheduled flow within a
25
bandwidth for approximately 74% of the time. For the remaining 26% of
26
the time, the New PARs and the Hydro One PARs will still provide 600
27
MW of loop flow control.
28
Docket No. ER11-1844
Exhibit NYI-1
Page 10 of 42
1
Q.
Has MISO or ITC provided any studies or analysis supporting the claims in
2
their Direct Testimony that the MI/ON PARs will control up to 600 MW of
3
unscheduled Lake Erie unscheduled power flow?
4
A.
No. Neither MISO nor ITC submitted studies supporting the claimed effectiveness
5
of the MI/ON PARs with their Direct Testimony. No MISO or ITC witness
6
identified such a study as one of the workpapers or documents supporting their
7
Direct Testimony.
8
9
Q.
Can MISO, ITC, the IESO or Hydro One rely on its real-world experience
10
operating the MI/ON PARs to conclude that their 74%/600 MW expectation is
11
reasonable?
12
A.
No. Although some of the MI/ON PARs have been in place for over a decade,
13
MISO, ITC, IESO and Hydro One have never managed to have the PARs on all four
14
transmission lines in service at the same time. If Hydro One’s L4D PAR returns to
15
service on May 18, 2012 (IESO’s sixth proposed return-to-service date), it will be
16
the first opportunity for MISO, ITC, IESO and Hydro One to gather actual data on
17
the MI/ON PARs’ real-world effectiveness.
18
19
V.
THE MISO/IESO OPERATING AGREEMENT AND THE ±200 MW
20
CONTROL BAND
21
Q.
Has an operating agreement for the MI/ON PARs been executed between MISO
22
and the IESO?
23
A.
Yes. MISO and the IESO have mutually agreed upon a set of operating instructions
24
for the MI/ON PARs entitled “Operation of the Michigan-Ontario Tie Lines and
25
Associated Facilities,” with an effective date of August 8, 2011 (the “MISO/IESO
26
Operating Instruction”). The MISO/IESO Operating Instruction was submitted to
Docket No. ER11-1844
Exhibit NYI-1
Page 11 of 42
1
the United States Department of Energy (“DOE”) for informational purposes as Tab
2
3 (at page 50 of Exhibit NYI-3) of ITC’s August 9, 2011 filing of “Supplemental
3
Reply Comments” in DOE Docket No. PP-230-4. The Supplemental Reply
4
Comments, including all attachments, are Exhibit NYI-3 to my testimony.
5
6
As Tab 2 of the Supplemental Reply Comments, ITC “submitted for filing” with
7
DOE an Amended and Restated Interconnection Facilities Agreement (“2011
8
Facilities Agreement”) between Hydro One and ITC (at page 18 of Exhibit NYI-3).
9
ITC’s supplemental reply comments states (at 3) that Schedule I to the 2011
10
Facilities Agreement (at page 45 of Exhibit NYI-3) “sets forth the agreed upon
11
standard to which actual flows will match scheduled flows on the Michigan-Ontario
12
facilities after the new PARs go into operation…. That standard is consistent with
13
the standard set forth in Section 3.0 of the [MISO/IESO Operating Instruction].”
14
15
Q.
Does the MISO/IESO Operating Instruction describe how the MI/ON PARs will
16
be operated?
17
A.
Yes.
18
19
Q.
Does the MISO/IESO Operating Instruction provide a target to which IESO
20
and MISO seek to operate the MI/ON PARs?
21
A.
Yes. Section 3.0 of the MISO/IESO Operating Instruction (at page 52 of Exhibit
22
NYI-3) states IESO and MISO will operate the MI/ON PARs so actual power flows
23
over the MI/ON Interface are maintained within a +/-200 MW “Control Band” of the
24
power flows that have been scheduled over the MI/ON Interface to the maximum
Docket No. ER11-1844
Exhibit NYI-1
Page 12 of 42
1
extent practical considering operational feasibility, safety, equipment limitations and
2
regulatory and statutory requirement.” The “Control Band” is defined in Section 2.0
3
of the Operating Instruction as a “maximum targeted Interface Deviation of ±200
4
MW, maintained within practical considerations.”
5
6
According to Section 2.0 of the Operating Instruction (at page 51 of Exhibit NYI-3),
7
to the extent that the MI/ON Interface “is within operational limitations and retains
8
the ability to maintain the Interface Deviation within the Control Band,” the Interface
9
will be considered to be in “Regulated Mode.” I discuss the significance of
10
“Regulated Mode” later in my testimony.
11
12
Q.
Were the MI/ON PARs operated to better conform actual power flows to
13
schedule power flows from January 1, 2011 to March 31, 2012?
14
A.
No.
15
16
Q.
For the 2011 calendar year, and from April 1, 2011 to March 31, 2012, what
17
percentage of the time does the NYISO estimate flows over the MI/ON Interface
18
were within ±200 MW of the interface schedule?
19
A.
As indicated in Exhibit NYI-4, for the twelve months ending March 31, 2012,
20
NYISO estimates3
that MI/ON Interface Flow was within ±200 MW of MI/ON
21
Interface schedule in 49.41% of hours. For the twelve months ending December 31,
22
2011, the corresponding figure was 48.50% of hours. So, even when the MI/ON
3 NYISO’s estimate was prepared using the difference between scheduled and actual power flows, measured at
the NYISO’s border with IESO. The difference between scheduled and actual power flows at the MI/ON
Interface should be very similar to the difference between scheduled and actual power flows at the
Ontario/New York border.
Docket No. ER11-1844
Exhibit NYI-1
Page 13 of 42
1
PARs are not operating to conform actual power flows to scheduled power flows, it
2
is reasonable to expect that the ±200 MW Control Band specified in the MISO/IESO
3
Operating Instruction will be achieved nearly 50% of the time.
4
5
VI.
MISO AND ITC DO NOT PROPOSE TO ASSUME AN OBLIGATION TO
6
SERVE THE NYISO OR PJM CUSTOMERS THAT THEY ARE ASKING
7
THE COMMISSION TO REQUIRE TO PAY FOR MORE THAN HALF OF
8
THE COST OF THE REPLACEMENT PARs
9
Q.
Do the MISO’s proposed tariff revisions require MISO and IESO to actually
10
achieve the 74%/600 MW control as a prerequisite to collecting the costs of the
11
Replacement PARs from NYISO and PJM customers?
12
A.
No.
13
14
Q.
Are MISO and ITC proposing to assume any service obligation to the NYISO
15
and PJM customers that they propose to charge for the Replacement PARS in
16
connection with their repeated claims that the MI/ON PARs “will fully mitigate
17
Lake Erie loop flow approximately 74% of the time and will mitigate it by
18
approximately 600 MW the remainder?”
19
A.
No. Despite the fact that the testimony of MISO witnesses Mallinger (at 19),
20
Chatterjee (at 26, 31) and Zwergel (at 8) repeatedly state “[t]he MI/ON PARs “will
21
fully mitigate Lake Erie loop flow approximately 74% of the time and will mitigate
22
it by approximately 600 MW the remainder” (Chatterjee at 26), in response to
23
discovery requests, MISO and ITC have indicated that they are not proposing to
24
actually be held to meeting this operating standard, or to meeting any operating
25
standard, in order to collect the charges proposed in this proceeding. MISO and ITC
26
state that their proposed tariff revisions will require customers in New York and PJM
27
to pay for the Replacement PARs even when the Replacement PARs are not in
28
service, or when one or more of the Hydro One PARs are not available.
Docket No. ER11-1844
Exhibit NYI-1
Page 14 of 42
1
2
Q.
What did MISO say about the obligation it will have to serve the NYISO and
3
PJM customers that MISO proposes to charge for the cost of the Replacement
4
PARs?
5
A.
In data request NYTO/MISO 1-9 (Exhibit NYI-5), the NYTOs asked:
6
If the current rate filing is approved please explain any and all service
7
obligations that either MISO or ITC will have to NYISO and any
8
circumstances under which MISO or ITC could have financial liability to the
9
NYISO related to the operation of the Replacement PARs or lack thereof.
10
MISO responded:
11
…MISO responds that approval of the current rate filing will not affect or
12
alter MISO’s existing service obligations as defined under Section 38 of the
13
MISO Tariff and related agreements identified therein. MISO’s current
14
limitation of liability provisions under its Tariff (Section 10) and related
15
agreements are unaffected by the current rate filing. At present, NYISO is
16
not a MISO Transmission Owner, Transmission Customer, or Market
17
Participant, and MISO does not have service obligations to NYISO related to
18
these categories.
19
In NYISO/MISO 3-3 (Exhibit NYI-6), the NYISO asked:
20
Should the Commission ultimately accept MISO’s proposed tariff revisions
21
and require NYISO customers and PJM customers to pay for a portion of the
22
cost of ITC’s Replacement PARs:
23
a.
Will the MISO and/or ITC be subject to an obligation to provide
24
reliable service to NYISO customers and PJM customers that are not
25
otherwise MISO customers?
26
i. If so, please identify any/all laws, regulations, FERC precedent
27
and/or court precedent relied on to prepare Recipient’s response to
28
NYISO/MISO 3-3a.
29
b.
Identify and explain the nature of any and all service obligations
30
MISO and/or ITC will become subject to with regard to the NYISO
31
customers and PJM customers that are not otherwise MISO customers.
32
i. For each service obligation MISO and/or ITC will assume, identify
33
any/all laws, regulations, FERC precedent and/or court precedent
34
relied on to prepare Recipient’s response to NYISO/MISO 3-3b.
Docket No. ER11-1844
Exhibit NYI-1
Page 15 of 42
1
MISO responded:
2
No. See response to NYISO TO/MISO 1-9 which has already been provided
3
to NYISO on February 14, 2012.
4
5
In addition to the above data requests, NYISO asked MISO a series of data requests
6
about whether NYISO and PJM customers would still be required to pay for the
7
Replacement PARs when the Replacement PARs are not in-service (NYISO/MISO
8
3-4, 3-5), or when the Hydro One PARs are out of service (NYISO/MISO 3-6, 3-7)4
9
(these data requests are collected as Exhibit NYI-7), MISO responded to all of the
10
referenced data requests on a consolidated basis in its response to NYISO/MISO 3-4
11
(Exhibit NYI-8) as follows:
12
Yes. MISO is obligated to charge the rates set forth in its Tariff. See MISO
13
14
Sections 205 and 206 of the Federal Power Act. See also, Midwest
15
Independent Transmission System Operator, Inc., 133 FERC ¶61,275 (2010),
16
reh’g pending; Midwest Independent Transmission System Operator,Inc.,
17
134 FERC ¶61,185 (2011).
18
19
Q.
What did ITC say about the obligation it will have to serve the NYISO and PJM
20
customers that MISO proposes to charge for the cost of the Replacement PARs?
21
A.
The NYTOs asked ITC in data request NYTO/ITC 1-14:
22
Q:
Please describe what service obligation ITC would have to the
23
NYISO or any NYTO to the extent the NYISO or any NYTO is required to
24
pay for any portion of the Replacement PARs.
25
ITC responded (see Exhibit NYI-9):
26
A:
As far as ITC knows, none. This question should be addressed to
27
MISO.
4 I address the importance of the Hydro One PARs on pages 31 through 39 of my Direct Testimony.
Docket No. ER11-1844
Exhibit NYI-1
Page 16 of 42
1
2
Q.
Do you think it would be appropriate for the Commission to require MISO and
3
ITC to meet the 74%/600MW performance expectation they propose in their
4
testimony in order to be permitted to charge NYISO and PJM customers for the
5
Replacement PARs?
6
A.
Yes, MISO and ITC should be required to meet the performance expectations they
7
create in their Direct Testimony. In particular, MISO and ITC should be required to
8
prove that the operation of the MI/ON PARs “fully mitigates” unscheduled Lake
9
Erie power flows in at least 74% of all hours, and reduces Lake Erie unscheduled
10
power flows by at least 600 MW at times when the MI/ON PARs are not able to
11
fully mitigate unscheduled Lake Erie power flows.
12
13
Q.
Do you think MISO and ITC should be required to file tariff revisions that
14
define their obligation to serve NYISO and PJM customers?
15
A.
Yes, if the Commission permits the collection of the proposed charges, which the
16
NYISO believes would be contrary to the Federal Power Act.
17
18
VII.
MISO AND IESO ARE NOT REQUIRED TO OPERATE THE MI/ON PARs
19
TO MITIGATE 600MW OF UNSCHEDULED POWER FLOWS AT TIMES
20
WHEN UNSCHEDULED POWER FLOWS EXCEED THE CONTROL BAND
21
Q.
Does the MISO/IESO Operating Instruction specify how MISO and IESO will
22
operate the MI/ON PARs when flow is outside the ±200 MW Control Band?
23
A.
Yes. Section 3.4.4 of the Operating Instruction (at page 53 of Exhibit NYI-3) says,
24
“In Non-Regulated Mode, the interface will be controlled to its applicable interface
25
limits. Actions (e.g. TLR’s, generation re-dispatch, reconfiguration, etc.) will not be
26
taken solely to return the Interface Deviation to within the regulating capability of
27
the PARs.” I interpret this language as indicating that the MI/ON Interface will be
Docket No. ER11-1844
Exhibit NYI-1
Page 17 of 42
1
operated to ensure it remains within applicable reliability limits. The language does
2
not clearly require MISO and IESO to operate the MI/ON PARs to mitigate 600 MW
3
of loop flow at times when the PARs are in Non-Regulated Mode. The NYISO is
4
not aware of any regulatory obligation that requires MISO, ITC, IESO or Hydro One
5
to operate the MI/ON PARs to mitigate 600 MW of loop flow at times when the
6
PARs are in Non-Regulated Mode.
7
8
Q.
What is “Non-Regulated Mode?”
9
A.
Section 2.0 of the Operating Instruction (at page 51 of Exhibit NYI-3) states that
10
“Non-Regulated Mode” means that: “[t]he [MI/ON] Interface has reached Max Tap
11
[i.e., the MI/ON PARs have reached the maximum ability to control flow, in either
12
direction] and the Interface Deviation [i.e., the difference between the Interface Flow
13
and the Interface Schedule] is exceeding or expected to exceed the Control Band
14
[i.e., the maximum targeted Interface Deviation of ±200 MW].”
15
16
Q.
Under Section 2.0 of the MISO/IESO Operating Instruction, when will MISO
17
and IESO set the MI/ON PARs to Non-Regulated Mode in the North American
18
Electric Reliability Company’s Interchange Distribution Calculator?
19
A.
MISO and IESO have indicated that they are required to place the MI/ON PARs in
20
Non-Regulated Mode in the NERC’s IDC whenever the MI/ON PARs have reached
21
Max Tap and cannot hold, or are not expected to be able to maintain, the Interface
22
Deviation within the +/-200MW Control Band.
23
24
On October 13, 2011, MISO and IESO jointly filed comments at the United States
Docket No. ER11-1844
Exhibit NYI-1
Page 18 of 42
1
Department of Energy (DOE) explaining how the MI/ON PARs would be operated
2
and when the MI/ON PARs would be placed in Non-Regulated Mode (see Exhibit
3
NYI-10). In their comments (at 4-7), MISO and IESO explained:
4
Specifically, the [MISO/IESO Operating Instruction] now provides that the
5
PARs are to be operated such that the difference between the Interface Flow
6
and the Interface Schedule is maintained within ±200 MW to the maximum
7
extent practical, while staying within all applicable operational limitations.
8
More simply, this change requires MISO and IESO to implement all practical
9
actions necessary to keep loop flow within the ±200 MW bandwidth, as long
10
as operational limitations of the PARs (or surrounding transmission system)
11
allow. The [operating instruction] now reduces the prospect of periods where
12
loop flow is not actively being controlled and resolves the challenges related
13
to the NERC TLR process.
14
*
*
*
15
The [operating instruction] seeks to implement the existing IDC
16
requirements
The two primary regulation statuses are fairly
17
straightforward (regulate or non-regulate). What becomes more difficult and
18
complicated is the determination of the transition between regulation statuses,
19
or exactly when the PARs are no longer able to fully control flows across the
20
interface.
21
The [operating instruction] uses the terminology that has historically been
22
used in the industry to describe this situation, or “Max Tap”. Conceptually, it
23
is relatively easy to understand that this would apply when a PAR, or all
24
PARs in a set, has reached the physical limitation of the PAR(s). In actuality,
25
however the situation is more complex, particularly when addressing a
26
coordinated set of PARs - as in this case. In situations where a set of PARs
27
are being coordinated not only to control overall flow, but to distribute flows
28
across the various local transmission elements interconnecting the PARs, a
29
local transmission system limitation may become the factor limiting the
30
ability of the PARs to continue regulating flows. In other words, there may
31
[sic] situations where tap range on any given PAR (or PARs) are “available”
32
(have not been used up), but cannot be utilized because doing so would result
33
in an overload on the local or underlying transmission system. Given the
34
various configuration changes (transmission outages, PAR outages,
35
transmission reconfigurations, etc.) that will occur, it is simply not possible to
36
exactly define all of the operational situations which may end up limiting the
37
PARs ability to control flow over the Ontario/Michigan interface. The
38
[operating instruction] recognizes this reality by generally defining the “Max
39
Tap” state as those operating situations where the “Interface,” defined as all 4
40
transmission circuits (and all 5 PARS), can no longer be controlled
In fact,
Docket No. ER11-1844
Exhibit NYI-1
Page 19 of 42
1
a Max Tap condition will occur any time MISO and IESO are unable to
2
control power flows to closely (within the Control Band) match schedules at
3
the Ontario/Michigan interface.
4
Taken together, the provisions of the [operating instruction] require that
5
MISO and IESO take actions to regulate loop flow for as long as possible.
6
When that ability is exhausted, and loop flow exceeds (or is expected to
7
exceed) ±200MW, the IDC status flag will be set to “Non-Regulate”.
8
I have omitted the footnotes from these comments.
9
10
Q.
If the PARS are in Non-Regulated Mode, are MISO and IESO required to move
11
the PARs in order to return the flow to within the ±200 MW bandwidth?
12
A.
No, that does not appear to be the case. Section 3.4.4 of the Operating Instruction
13
does not require MISO and IESO to take affirmative actions to return the flow to
14
within the ±200 MW bandwidth when the PARs have been placed in Non-Regulated
15
Mode.
16
17
Q.
Does the MISO-IESO Operating Instruction require MISO and IESO to
18
operate the MI/ON PARs to control 600 MW of Lake Erie unscheduled power
19
flows when the PARs are in Non-Regulated Mode?
20
A.
No. In Non-Regulated Mode, MISO and IESO need only control the MI/ON PARs
21
to “applicable interface limits.” I interpret this language as indicating that the
22
MI/ON Interface will be operated to ensure it remains within applicable reliability
23
limits.
24
Docket No. ER11-1844
Exhibit NYI-1
Page 20 of 42
1
VIII.
THE MI/ON PAR OPERATING INSTRUCTION PERMITS MISO AND IESO
2
TO FAVOR THEIR OWN CUSTOMERS AND INTERESTS
3
Q.
Under the MISO-IESO Operating Instruction, which entities are responsible
4
for operating the MI/ON PARs?
5
A.
Section 1.0 of the Operating Instruction (page 50 of Exhibit NYI-3) states that MISO
6
“will direct actions regarding the Michigan-Ontario interconnection facilities in
7
Michigan.” Section 1.0 also states that IESO “directs the operation of the
8
Interconnection Facilities in Ontario.” That section also states that “MISO and IESO
9
will jointly coordinate operation of the Interconnection Facilities in accordance with
10
this document regardless of the location or the status at any time of any of the
11
Interconnection Facilities.”
12
13
Q.
Do NYISO or PJM get a “vote” in any operating decisions regarding the MI/ON
14
PARs?
15
A.
No. The MISO-IESO Operating Instruction, in a limited number of circumstances,
16
requires MISO and IESO to consult with NYISO and PJM, but the ultimate decision-
17
making authority rests with MISO and IESO in every case.
18
19
Q.
Does the MISO-IESO Operating Instruction require or permit MISO and IESO
20
to operate the MI/ON PARs in a manner that favors MISO, IESO, and their
21
customers?
22
A.
Yes. Several subsections of Section 3.0 of the Operating Instruction (pages 52-54 of
23
Exhibit NYI-3) provide protections to the MISO and IESO that are not available to
24
NYISO and PJM, or that are not available on an equivalent basis to NYISO and
25
PJM.
26
Docket No. ER11-1844
Exhibit NYI-1
Page 21 of 42
1
Section 3.4.2 of the Operating Instruction provides “[i]n order to prevent an
2
emergency in MISO or Ontario, PARs may be adjusted such that the Interface
3
Deviation exceeds the Control Band providing other actions are utilized first, time
4
permitting.” There is no reciprocal provision that permits NYISO or PJM to request
5
MISO and IESO to operate the PARs to prevent emergencies in New York or PJM.
6
7
Section 3.5.1 of the Operating Instruction provides “[i]f the emergency is within
8
MISO or Ontario, the PARs may be adjusted up to Max Tap utilizing emergency
9
thermal limits as appropriate….. If emergencies are declared in both MISO and
10
Ontario, tap positions for the PARs shall be set in the position(s) that best mitigates,
11
or assists with the mitigation of, the overall scope of the emergencies in both areas
12
and that achieves, to the extent practical, a fair sharing of relief requirements
13
between the areas.”
14
15
A different set of rules apply to emergencies that occur in PJM or New York. Those
16
rules are in Section 3.5.2 of the Operating Instruction. Section 3.5.2.1 of the
17
Operating Instruction provides that if the emergency is outside of MISO and Ontario,
18
the PARs may be operated to assist with the emergency only after, among other
19
things, the non-MISO or Ontario parties (such as NYISO or PJM) have “taken all
20
mitigating steps except voltage reduction and shedding of firm load” to address the
21
problem.” For emergencies within MISO or Ontario, Section 3.5.1 does not impose
22
the same mitigation obligation on MISO or IESO.
23
Docket No. ER11-1844
Exhibit NYI-1
Page 22 of 42
1
Section 3.5.2 of the Operating Instruction provides that, for emergencies outside of
2
MISO or Ontario, “[t]he type of assistance shall be agreed upon and directed by
3
MISO and the IESO.” Accordingly, MISO and IESO retain full discretion to decide
4
(a) if they will operate the MI/ON PARs to provide relief in response to a NYISO or
5
PJM request, and (b) the degree or extent of relief they will provide.
6
7
The operating instruction does not put NYISO and PJM on an equal footing with
8
MISO and IESO.
9
10
Q.
Does the MISO-IESO Operating Instruction provide for suspension of normal
11
operation of the MI/ON PARs to protect MISO and/or IESO customers?
12
A.
Yes. Section 4.0 of the MISO-IESO Operating Instruction (pages 54-55 of Exhibit
13
NYI-3) recognizes that “normal operation of the PARs may result in unforeseen
14
operational or market outcomes within MISO or the IESO.” It also states that:
15
“Depending on the nature of the event, the most appropriate or only mitigating action
16
may be to suspend normal operation of the PARs, i.e. change the Interface Control
17
Mode from Regulated Mode to Bypass Mode.” “Bypass Mode” is defined in Section
18
3.0 as the state in which the PARs are physically bypassed or where in-service PARs
19
are at or near neutral tap and MISO and IESO are not attempting to control flows to
20
the Interface Schedule. Section 4.0 provides that if MISO and IESO agree to
21
suspend normal operations, “[n]ormal operations of the PARs will remain suspended
22
until mutual agreement is reached to restore them to Regulated Mode or regulatory
23
action occurs and a subsequent resolution plan developed and implemented.” While
Docket No. ER11-1844
Exhibit NYI-1
Page 23 of 42
1
suspension of normal PAR operation “[i]n the case of anomalous market outcomes in
2
either jurisdiction, will only occur after consultation with other affected markets,”
3
MISO and IESO retain ultimate decision making authority, as explained above.
4
5
Q.
Does the MISO-IESO Operating Instruction provide for potential suspension of
6
the normal operation of the MI/ON PARs in circumstances in which operation
7
of the PARs causes anomalous market results in NYISO or PJM?
8
A.
No.
9
10
Q.
Do the MISO’s proposed tariff revisions include a proposal to permit MISO to
11
suspend the operation of the MI/ON PARs when its markets are being adversely
12
impacted?
13
A.
Yes. MISO’s proposed Attachment SS-1 to the MISO’s tariff would permit MISO to
14
temporarily suspend normal operation of the MI/ON PARs “in the event there are
15
anomalous Midwest ISO market results related to the PARs controlling the
16
Michigan-Ontario Interface.”
17
18
Q.
Do the MISO’s proposed tariff revisions permit MISO to suspend the operation
19
of the MI/ON PARs when the NYISO or PJM markets are being adversely
20
impacted by the MI/ON PARs operation?
21
A.
Proposed Attachment SS-1 only addresses anomalous market results in the MISO’s
22
markets. It does not provide similar rights to NYISO or PJM.
23
24
IX.
THE OUTAGE HISTORY OF THE PARS AT THE MI/ON INTERFACE
25
Q.
Have you reviewed the outage history of the PARs at the MI/ON Interface?
26
A.
Yes. I have reviewed a number of NERC, NPCC and other similar third-party
Docket No. ER11-1844
Exhibit NYI-1
Page 24 of 42
1
reports that discuss outages of the MI/ON PARs occurring from 2001 to the present.
2
I have attached a summary of these reports as Exhibit NYI-11. My reliance on these
3
reports was necessary because: (i) IESO’s response to NYISO/IESO 3-1 (see
4
Exhibit NYI-12) indicated IESO has no PAR outage records for periods before
5
January 1, 2006, (ii) ITC’s response to NYISO/ITC 5-1 (see Exhibit NYI-13)
6
provided no details about the availability of the Hydro One PARs during the
7
pertinent period; (iii) Detroit Edison’s response to NYISO/DTE 3-1 (see Exhibit
8
NYI-14) indicated that it had no knowledge with respect to whether one or more
9
Hydro One PARs were out-of-service during the time period when the Original PAR
10
was in service.
11
12
Q.
Has the Hydro One PAR on the L4D circuit experienced any operational
13
difficulties since it was constructed in 2001?
14
A.
Yes.
15
16
Q.
What difficulties were experienced?
17
A.
As described in the MAAC-ECAR-NPCC Study Committee 2001 Summer MEN
18
Interregional Transmission System Reliability Assessment, May 2001 (“MEN 2001
19
Assessment”) (at page 40 of Exhibit NYI-15)5, the L4D PAR failed a factory test in
20
March 2001, before it was placed in service. The subsequent MAAC-ECAR-NPCC
21
Study Committee 2002 Summer MEN Interregional Transmission System Reliability
5
The cited language occurs at page 36 in the numbering of the original document.
Docket No. ER11-1844
Exhibit NYI-1
Page 25 of 42
1
Assessment, May 2002 (“MEN 2002 Assessment”) (at page 34 of Exhibit NYI-16),6
2
indicated that “Transformer testing failures have impacted the Lambton PARs, L51D
3
and L4D….”
4
5
Q.
Was the L4D PAR placed in service in 2002?
6
A.
No. As explained in the Northeast Power Coordinating Council (“NPCC”)
7
Reliability Assessment For Summer 2003, issued in May 2003 (“NPCC 2003
8
Summer Assessment”) (at page 21 of Exhibit NYI-17), the installation of the L4D
9
PAR was not expected to be completed until the end of August 2003.
10
11
Q.
Did the L4D PAR enter service in August 2003?
12
A.
No. As reflected in the NPCC Reliability Assessment For Summer 2004, issued in
13
May 2004 (the “NPCC 2004 Summer Assessment”) (at page 24 of Exhibit NYI-18),
14
as of May 2004, the L4D PAR, despite earlier predictions, had still not been
15
installed, but was expected to be installed by the end of September 2004.
16
17
Q.
Did the L4D PAR enter service in September 2004?
18
A.
No. As reflected in the NPCC Reliability Assessment For Summer 2005, issued in
19
April 2005, (at page 25 of Exhibit NYI-19), the L4D PAR was finally placed in
20
service in February 2005.
21
6
The cited language occurs at page 30 in the numbering of the original document.
Docket No. ER11-1844
Exhibit NYI-1
Page 26 of 42
1
Q.
Has the L4D PAR remained in service from February 2005 to the present?
2
A.
No. IESO’s response to NYISO/IESO 1-5 (Exhibit NYI-20) indicates that the L4D
3
PAR went out of service on December 17, 2011. As described in the “Michigan-
4
Ontario Interface Notice” issued by MISO on March 23, 2012, attached as Exhibit
5
NYI-21 hereto, in “late 2011, Hydro One removed the L4D [PAR] from service due
6
to early indications of an electrical issue with the PAR. Testing on the L4D PAR
7
will continue through mid-May
” The response to NYISO/IESO 4-1, attached as
8
Exhibit NYI-22 hereto, states that the “current scheduled return date for the L4D
9
PAR is May 18, 2012.” However, this is the sixth in a series of projected return
10
dates, each of which has turned out to be incorrect. See Exhibit NYI-23.
11
12
Q.
Did the Hydro One PAR on the L51D circuit (the “L51D PAR”) experience any
13
operational difficulties from 2001 to the present?
14
A.
Yes. As described in the MEN 2001 Assessment, in April 2001, the in-service L51D
15
PAR was automatically removed from service for an internal fault (see Exhibit NYI-
16
15 at page 40).7
According to the MEN 2002 Assessment, because of failure of
17
some of the PARs and delays in restoring them to service, only the Keith-Waterman
18
230 kV J5D interconnection PAR [(the “J5D PAR”)] was represented in the 2002
19
analysis (see Exhibit NYI-16 at page 35).8
20
7
The cited language occurs at page 36 in the numbering of the original document.
8
The cited language occurs at page 9 in the numbering of the original document.
Docket No. ER11-1844
Exhibit NYI-1
Page 27 of 42
1
Q.
When did the L51D PAR return to service?
2
A.
The records the NYISO reviewed do not clearly address when the problems with the
3
L51D PAR were addressed and the PAR returned to service. A 2004 NYISO
4
summer operating report indicated that the L51D was “available” for the summer of
5
2004.
6
7
Q.
Did the PAR originally installed by ITC on the B3N circuit (i.e., the Original
8
PAR) experience any operational difficulties during this period?
9
A.
Yes. As explained in the NPCC 2003 Summer Assessment, the Original PAR was
10
forced from service in March 2003, with an unknown return date (see Exhibit NYI-
11
17 at page 21). According to the NPCC 2004 Summer Assessment, a tower on the
12
B3N circuit was also damaged in April 2003 (see Exhibit NYI-18 at page 24). The
13
NPCC Reliability Assessment For Winter 2006-2007, issued in November 2006
14
(“NPCC Winter 2006-2007 Assessment”) (see Exhibit NYI-24 at page 22) stated that
15
the B3N circuit was returned to service in November 2006 without a phase shifter.
16
We now know that it took ITC nine years to get replacements for the Original PAR
17
into service.
18
19
Q.
When the Replacement PARs were placed into service on April 5, 2012, were all
20
of the other MI/ON PARs in service?
21
A.
No. As indicated above, when the Replacement PARs went into service, the L4D
22
PAR remained out of service. As of the date of this testimony, the L4D PAR still
23
has not returned to service.
24
Docket No. ER11-1844
Exhibit NYI-1
Page 28 of 42
1
Q.
Over the past nine years, have the Hydro One PARs been subjected to the
2
operational stresses that would result from their being employed to conform
3
actual power flows to scheduled power flows on the MI/ON Interface?
4
A.
No. As stated in the IESO’s response to NYISO/IESO 2-2(a) and (b) (Exhibit NYI-
5
25), the Hydro One PARs have not been operated in “Regulated Mode” (i.e., to
6
attempt to control loop flow across the MI/ON Interface) during the period from
7
April 1, 2003 through February 15, 2012. In fact, MISO and IESO did not begin
8
attempting to use the available MI/ON PARs better conform actual power flows to
9
scheduled power flows at the MI/ON Interface until April 5, 2012, as the MISO
10
announcement in Exhibit NYI-26 indicates.
11
12
Q.
How would you sum up the outage history of the PARs at the MI/ON Interface?
13
A.
The history of the MI/ON PARs indicates that they are prone to failure. Since 2001
14
there has continuously been at least one PAR out-of-service at the MI/ON Interface.
15
According to IESO’s response to NYISO/IESO 2-2 (Exhibit NYI-25), prior to April
16
5, 2012, IESO never attempted to operate the three Hydro One PARs (when
17
operable) to conform actual power flows to scheduled power flows at the MI/ON
18
Interface, due to lack of an operating agreement with MISO. In over a decade of
19
operating history, MISO and ITC have never managed to achieve simultaneous PAR
20
control of all four lines at the MI/ON Interface. Prior to April 5, 2012, it does not
21
appear that the MI/ON PARs had ever been operated to conform actual power flows
22
to scheduled power flows.
23
24
Q.
Is there any indication in the testimony submitted by MISO or ITC in this
25
proceeding that the MI/ON PARs can control Lake Erie unscheduled power
Docket No. ER11-1844
Exhibit NYI-1
Page 29 of 42
1
flows by 600 MW and for 74 percent of the time, if the Commission takes into
2
account reasonably anticipated outages of the PARs?
3
A.
No. Mr. Mallinger’s testimony (at 19-20) appears to assume that all of the MI/ON
4
PARs will be available 24 hours/day, 7 days/week, 365 days/year. Mr. Mallinger’s
5
estimate of the MI/ON PARs expected effectiveness in controlling Lake Erie
6
unscheduled power flows did not appear to take MI/ON PAR outages into account.
7
8
Q.
How would you assess the likelihood of keeping all of the MI/ON PARs in
9
service simultaneously for extended periods of time?
10
A.
Given the PAR operating history I recount above, and the fact that the IESO PARs
11
have not been actively operated to control power flows for years, there is no reason
12
to expect the pattern of forced MI/ON PAR outages will not continue.
13
14
Q.
So what impact does that have on MISO’s and ITC’s claims that the PARs will
15
control unscheduled power flows 74% of the time, and will reduce unscheduled
16
power flows by 600MW at times when they are not able to fully control Lake
17
Erie unscheduled power flows?
18
A.
This calls into serious question the validity of the claim that the MI/ON PARs can
19
control Lake Erie unscheduled power flows by 600 MW and for 74 percent of the
20
time, because the claim is based on all five MI/ON PARs being in service to control
21
all four circuits in the MI/ON Interface. Below I explain why the ability to control
22
power flows at the MI/ON Interface is extremely limited when only three of the four
23
transmission lines at the interface are PAR controlled.
24
Docket No. ER11-1844
Exhibit NYI-1
Page 30 of 42
1
Q.
Is there any other information NYISO has uncovered that supports NYISO’s
2
concern that some or all of the PARs at the MI/ON Interface are likely to prove
3
unreliable?
4
A.
Yes. ITC’s decision to change the PAR manufacturer when it constructed the ITC
5
PARs to replace the failed Original PAR appears to be consistent with the concerns I
6
have raised regarding the expected long-term availability of the MI/ON PARs.
7
8
Q.
By what entity was the failed Original PAR manufactured?
9
A.
As indicated in Exhibit NYI-27, ITC’s response to NYISO/ITC 5-4, the Original
10
PAR was manufactured by ABB.
11
12
Q.
Did ITC choose a different manufacturer for the Replacement PARs?
13
A.
Yes.
REDACTED
14
REDACTED
15
16
Q.
In the aftermath of the failure of the Original PAR, did ITC’s chief executive
17
officer offer an assessment of the MI/ON PARs’ operation?
18
A.
Yes,
REDACTED
19
REDACTED
20
21
Q.
REDACTED
22
A.
REDACTED
23
REDACTED
24
REDACTED
25
Docket No. ER11-1844
Exhibit NYI-1
Page 31 of 42
R
Q.
E
REDACTED
3
A.
4
5
X.
ABILITY OF THE MI/ON PARS TO MITIGATE LAKE ERIE
6
UNSCHEDULED POWER FLOWS WHEN ONE OR MORE OF THE
7
HYDRO ONE PARS IS OUT OF SERVICE
8
Q.
Please explain the ability of the MI/ON PARs to mitigate Lake Erie
9
unscheduled power flows when one or more of the Hydro One PARs is out of
10
service.
11
A.
I have prepared a series of examples and diagrams to provide the requested
12
explanation. By way of background, Lake Erie loop flow is measured by taking the
13
difference between scheduled transactions and actual power flow across an interface.
14
All four of my examples build upon the assumption that there would be 450MW of
15
actual unscheduled power flows across the MI/ON Interface if all four of the
16
transmission lines that comprise the MI/ON Interface are permitted to free flow. In
17
my examples, “positive” Lake Erie loop flows denote a clockwise direction of power
18
flow and “negative” flows denote counter-clockwise power flows.
19
20
In the examples, Lake Erie loop flow is measured across the Ontario/New York
21
(ON/NY) interface. The examples assume that no External Transactions are
22
scheduled across the MI/ON or ON/NY interfaces. Assuming that zero transactions
23
are scheduled across the MI/ON and ON/NY interfaces, Lake Erie loop flow should
24
be approximately equal to the actual power flow across the MI/ON Interface.
25
Docket No. ER11-1844
Exhibit NYI-1
Page 32 of 42
1
Q.
Please explain your first example and the corresponding diagram.
2
A.
Exhibit NYI-30 illustrates the power flow with none of the four MI/ON PARs being
3
operated to affect power flows. In this example, power flows freely across all four
4
Ontario-Michigan ties following the laws of physics as generation serves load and
5
transactions are scheduled between control areas (other than MI/ON and ON/NY).
6
The actual, unscheduled power flow across the MI/ON Interface is equal to 450MW
7
in a positive direction, which reflects 450MW of clockwise Lake Erie loop flow.
8
9
Q.
What circumstance is described in your second example and illustrated in the
10
corresponding diagram?
11
A.
Exhibit NYI-31 assumes that all four of the MI/ON PARs are in service and that the
12
PARs are able to “perfectly” match flows to schedules. In this example, the PARs
13
prevent the 450MW of Lake Erie loop flow that would otherwise flow across the
14
MI/ON Interface (the MI/ON PARs conform the actual power flows to the zero MW
15
schedule between the two regions). As I explained in the introductory section of my
16
Direct Testimony, and explain in greater detail below, PARs impact power flows in a
17
“chunky” manner, so the assumption of “perfect” control is not realistic, even under
18
optimal conditions.
19
20
Q.
What circumstance is described in your third example and illustrated in the
21
corresponding diagram?
22
A.
Exhibit NYI-32 illustrates the limited ability to control loop flow with all MI/ON
23
PARs available and being operated to conform actual power flows to scheduled
24
power flows, with the exception of Hydro One’s L4D PAR, which is unavailable or
Docket No. ER11-1844
Exhibit NYI-1
Page 33 of 42
1
bypassed in this example. If MISO and IESO operate the PARs on the other three
2
transmission lines at the MI/ON Interface to hold zero flow across those three ties,
3
then approximately 400MW of actual, unscheduled power flow will occur on the free
4
flowing L4D tie. The net result is 400MW of clockwise Lake Erie loop flow.
5
6
In other words, in the third example, if three out of the four ties at the MI/ON
7
Interface are perfectly matching flow (0MW) to schedule (0MW), but the fourth tie
8
is free flowing, only 50MW of Lake Erie loop flow would be prevented. In order to
9
more closely conform actual power flows to scheduled power flows at the MI/ON
10
Interface, it would be necessary for the available PARs on the other three circuits to
11
move away from zero flow and actively generate counter flow.
12
13
Q.
What circumstance is described in your fourth example and illustrated in the
14
corresponding diagram?
15
Exhibit NYI-33 further illustrates the limited ability to control loop flow with PARs
16
available on only three out of the four ties at the MI/ON Interface. The fourth
17
example again assumes that the L4D PAR is unavailable, but assumes more
18
aggressive operation of the three available PARs. If MISO and IESO operate the
19
PARs on the other three transmission lines at the MI/ON Interface to induce counter
20
flow across those three ties to reduce Lake Erie Loop Flow it is theoretically possible
21
to reduce the Lake Erie Loop Flow by 200MW. The 200MW reduction would be
22
accomplished by operating the three available PARs to introduce 950MW of
23
counter-clockwise counter flow. However, operating the three available PARs to
Docket No. ER11-1844
Exhibit NYI-1
Page 34 of 42
1
introduce counter flow will result in increased clockwise power flow across the free-
2
flowing L4D tie. As the three PARs are operated to introduce counter flow across
3
the three PAR-controlled ties, the L4D tie will see ever-increasing clockwise power
4
flows. Eventually, the actual flow across the free-flowing L4D tie will increase to
5
the point it will exceed the line’s normal thermal rating, which is 1200MW.
6
7
Q.
Is there reason to believe that the actual ability to mitigate unscheduled Lake
8
Erie power flow would be less than the 200MW estimated in the fourth
9
example?
10
A.
Yes. Practically speaking, I expect the actual limit to which MISO and IESO would
11
operate would be well below the 1200 MW limit used in the fourth example. Before
12
the counter flow became large enough to cause an overload on the L4D tie, there
13
would likely be an overload for the loss of a circuit onto an adjacent circuit that
14
would limit the PAR movements. The applicable criteria to which MISO and IESO
15
(and NYISO and PJM) operate require that no circuit is overloaded as the result of
16
the loss of any other transmission line. This is commonly referred to as operating to
17
an “n-1” standard. It is reasonable to assume that limits on controlling loop flow
18
with one PAR out of service will be a result of network contingency constraints
19
rather than PAR equipment ratings or PAR tap range restrictions. If the limit to
20
which MISO and IESO must operate is lower than the 1200 MW thermal limit for
21
the L4D tie used in my fourth example, the available counter-flow would be reduced,
22
and the ability to prevent Lake Erie loop flow would be lower than the 200MW
23
estimated in the example.
24
Docket No. ER11-1844
Exhibit NYI-1
Page 35 of 42
1
Q.
Has MISO provided information in response to data requests, or otherwise,
2
regarding the feasibility of mitigating Lake Erie unscheduled power flows when
3
one or more of the Hydro One PARs is out of service?
4
A.
Yes. MISO responded to that issue, as pursued in NYISO/MISO 1-18 through 1-21
5
(Exhibit NYI-34), on a consolidated basis in its response to NYISO/MISO 1-19
6
(Exhibit NYI-34), stating:
7
Unavailability of one or more of the MI/ON PARs is one of many operational
8
factors that may affect the overall ability of the MI/ON PARs to conform
9
actual power flows to scheduled power flows.
10
a.
There have been no equipment and/or system conditions identified
11
that would make conforming actual power flows to scheduled power flows
12
impractical (e.g.. overall control ability reduced to near zero), and operating
13
agreements do not specifically address this condition.
14
b.
While MISO expects the effectiveness of the MI/ON PARs will vary
15
as equipment status and/or system conditions change, there have been no
16
studies performed that quantify the effectiveness of the MI/ON PARs for any
17
sub-optimal condition (e.g., all PARs and Transmission elements in service).
18
19
Q.
Has MISO performed any studies to test the expected operational effectiveness
20
of the MI/ON PARs when one or more of the lines that comprise the interface
21
are free flowing?
22
A.
In NYISO/MISO 3-1, the NYISO posed questions regarding the impact on loop flow
23
control achievable by the MI/ON PARs under a number of scenarios reflecting
24
various combinations of PAR outages. Initially, MISO objected on the basis that “it
25
requires MISO witnesses to create studies that do not already exist.” In its
26
subsequent response reserving objections (Exhibit NYI-35), MISO stated:
27
MISO agrees that the effectiveness of the MI/ON PARs will vary as
28
equipment status and/or system conditions change but MISO is unable to
29
respond to the various hypothetical scenarios posed in NYISO/MISO 3-1 as
30
MISO has already stated in response to NYISO/MISO 1-19 (i.e., there have
31
been no studies performed that quantify the effectiveness of the MI/ON PARs
32
for any sub-optimal condition).
Docket No. ER11-1844
Exhibit NYI-1
Page 36 of 42
1
2
Q.
Did MISO issue a “Michigan-Ontario Interface Notice” on March 23, 2012 that
3
indicated MISO’s expectation of the effectiveness of the MI/ON PARs while the
4
L4D PAR is out of service?
5
A.
Yes. The Notice (Exhibit NYI-21) states:
6
Coordinated interface operations without the L4D PAR in service will reduce
7
the overall capability to control loop flow by an estimated 40-50%, which
8
significantly reduces the time that the interface will be fully regulated (loop
9
flow exceeds collective ability of remaining PARs to control flow).
10
11
Q.
Did MISO also supplement its response to data request NYISO/MISO 3-1?
12
A.
Yes. MISO supplemented its response to NYISO/MISO 3-1 on April 6, 2012
13
(Exhibit NYI-35). MISO’s supplement added the following information:
14
Kevin Frankeny further explains that, based upon his professional judgment
15
and experience, MISO believes that with the Hydro One L4D PAR out of
16
service, overall capacity to reduce loop flows will decline so MISO would
17
expect the MI/ON PARs to fully mitigate loop flows 40-50% of the time.
18
However, the MI/ON PARs will still be able to mitigate Lake Erie loop flow
19
by approximately 300-350 MW.
20
For the reasons explained above, Mr. Frankeny’s estimate of the ability of the
21
MI/ON PARs to control flow when one of the four transmission lines that comprise
22
the MI/ON Interface is free flowing appears optimistic.
23
24
Q.
Did the supplemental response to NYISO/MISO 3-1 offer any studies or
25
analysis to support Mr. Frankeny’s estimate?
26
A.
No. Accordingly, I must assume that the earlier MISO responses to NYISO/MISO
27
1-19 and NYISO/MISO 3-1 still stand: that “there have been no studies performed
28
that quantify the effectiveness of the MI/ON PARs for any sub-optimal condition.”
29
To the extent that MISO or ITC produce a study or refined estimate of the
Docket No. ER11-1844
Exhibit NYI-1
Page 37 of 42
1
effectiveness in sub-optimal conditions, I reserve the right to supplement my
2
testimony to respond to that study or refined estimate.
3
4
Q.
What does actual data since April 5, 2012 indicate about the degree to which the
5
available MI/ON PARs are controlling unscheduled Lake Erie power flows?
6
A.
Because MISO and IESO propose to operate the PARs to a ±200 MW Control Band,
7
the NYISO compared how often the MI/ON PARs were within the Control Band
8
over the period from April 5, 2012 to May 5, 2012 (a very small sample, but it is all
9
the NYISO has to work with), to the frequency with which the MI/ON Interface was
10
within the +/-200MW Control Band over the period April 1, 2011 to March 31,
11
2012. From April 5, 2012 to May 5, 2012, NYISO estimates that MI/ON Interface
12
Flow was within ±200 MW of MI/ON Interface schedule in 56.6% of hours (see
13
Exhibit NYI-36).9
14
15
As indicated in Exhibit NYI-4, for the twelve months ending March 31, 2012,
16
NYISO estimates that MI/ON Interface Flow was within ±200 MW of MI/ON
17
Interface schedule in 49.41% of hours. While the performance for the April 5, 2012
18
to May 5, 2012 period exceeds the average performance for the year starting April 1,
19
2011, it is not outside the expected range of results. As shown in Exhibit NYI-4: (i)
20
for the seven months commencing July 1, 2011 and ending January 31, 2012, MI/ON
21
Interface flow was within ±200 MW of MI/ON Interface schedule in 57.5% of hours;
9
NYISO’s estimate was prepared using the difference between scheduled and actual power flows,
measured at the NYISO’s border with IESO. The difference between scheduled and actual power flows at the
MI/ON Interface should be very similar to the difference between scheduled and actual power flows at the
Ontario/New York border.
Docket No. ER11-1844
Exhibit NYI-1
Page 38 of 42
1
(ii) in October 2011, MI/ON Interface flow was within ±200 MW of MI/ON
2
Interface schedule in 75.7% of hours.
3
4
In the MISO’s supplemental response to NYISO/MISO 3-1, MISO asserted (on the
5
basis of Mr. Frankeny’s professional judgment) that it expects the MI/ON PARs,
6
operating without the L4D PAR, to “fully mitigate loop flows 40-50% of the time.”
7
I am not certain how Mr. Frankeny would define “fully mitigate,” but assuming that
8
this phrase means that MI/ON Interface flow is controlled to within ±10 MW of
9
MI/ON Interface schedule, this control was achieved in only 3% of hours during the
10
April 5 - May 5, 2012 time period (see Exhibit NYI-36).
11
12
Based on the NYISO’s review of one months’ operating data with the L4D PAR out
13
of service, it appears the performance of three available MI/ON PARs has not
14
improved upon the performance that the NYISO recorded for periods when the
15
MI/ON PARs were not available.
16
Docket No. ER11-1844
Exhibit NYI-1
Page 39 of 42
1
Q.
Are the Replacement PARs capable of mitigating Lake Erie unscheduled power
2
flows if they are operated in isolation - i.e., without any of the Hydro One PARs
3
in Operation?
4
A.
No. MISO witness Chatterjee admits as much (on page 7 of his testimony) when he
5
indicates that MISO and ITC’s proposed cost allocation is based on using all of the
6
MI/ON PARs—both ITC’s Replacement PARs and the Hydro One PARs—to better
7
conform actual power flows to scheduled power flows at the MI/ON Interface.
8
9
Q.
What has ITC said about the capability of its PARs, operated in isolation?
10
A.
While ITC asserts in its response to NYTO/ITC 1-86 (Exhibit NYI-37) that “[s]ome
11
loop flow mitigation could occur by operating the [Replacement] … PARs in
12
isolation of the operation of the Ontario PARs on the interface,” ITC admits that “the
13
results would be sub-optimal,” and more fundamentally, that this type of scenario
14
would “be contrary to NERC compliance requirements.” ITC’s Replacement PARs
15
cannot be effectively operated to mitigate unscheduled power flows without the
16
assistance of the Hydro One PARs.
17
18
XI.
ALL INTERCONNECTED FACILITIES BENEFIT NEIGHBORS
19
Q.
Do PARs constitute some sort of “special class” of transmission facilities of
20
extraordinary value?
21
A.
No. PARs do not constitute a “special class” of transmission facilities of
22
extraordinary value. There are many types of transmission facilities that provide
23
mutual transmission security benefits to neighboring ISOs/RTOs. Interconnected
24
transmission facilities, including free flowing transmission lines, provide mutual
25
transmission security benefits to neighboring ISOs/RTOs. These mutual
Docket No. ER11-1844
Exhibit NYI-1
Page 40 of 42
1
transmission security benefits can include: (1) reduced post contingency power
2
flows; (2) improved pre and post contingency transmission voltage performance;
3
(3) improved dynamic and steady state transmission stability performance;
4
(4) improved post disturbance frequency response; (5) opportunities for reserve
5
sharing protocols; and (6) opportunities for emergency power purchases. None of
6
these mutual transmission security benefits require a PAR.
7
8
Q.
Do ITC’s Replacement PARs provide unique benefits that no other PARs
9
provide?
10
A.
No. As I explain above, the Replacement PARs, operated in isolation, would be of
11
little value to anyone. When (if) ITC’s Replacement PARs are operated in
12
conjunction with all three of the Hydro One PARs, they may better conform actual
13
power flows to scheduled power flows at the MI/ON Interface.10
The fact that the
14
stated purpose of the MI/ON PARs is to conform actual power flows to scheduled
15
power flows is not unique. The ABC and JK PARs at the New York/PJM border are
16
operated to perform a similar function. PARs that are operated to conform flows to
17
schedules, will tend to reduce loop flows, that characteristic is not unique to the
18
Replacement PARs or the MI/ON PARs.11
19
10 NYISO witness Robert Pike addresses if, whether, and under what circumstances the NYISO would benefit
if the MI/ON PARs are successfully operated to better conform flows to schedules at the MI/ON Interface.
11 NYISO witness Zachary Smith also addresses this claim in his direct testimony.
Docket No. ER11-1844
Exhibit NYI-1
Page 41 of 42
1
XII. CONCLUSION
2
Q.
Does this conclude your testimony?
3
A.
Yes.
Docket No. ER11-1844
Exhibit NYI-1
Page 42 of 42
DOCKET NO. ER11-1844
EXHIBIT NO. NYI-2
Docket No. ER11-1844
Exhibit No. NYI-2
Page 1 of 2
NYISO/MISO 2-3. Does the scheduling of external transactions (imports, exports, wheels
through) between and among the balancing areas that surround Lake Erie affect Lake Erie loop
flow?
a. If so, how does the scheduling of external transactions between and among the
balancing areas that surround Lake Erie affect Lake Erie loop flow?
b. Will the operation of the PARs at the interface between Michigan and Ontario (MISO
and IESO), including both the Replacement PARs and the Hydro One PARs affect
the Lake Erie loop flow impacts, if any, of external transactions?
c. If the answer to NYISO/MISO 2-3, sub-part b is “yes,” how will the operation of the
PARs at the interface between Michigan and Ontario (MISO and IESO), including
both the Replacement PARs and the Hydro One PARs affect the Lake Erie loo flow
impacts of external transactions?
Response:
a.
MISO’s response to NYISO/MISO 1-16 data request describes the Regional Power
Control Device Study that was issued in June 2011. One section evaluated correlations between
operation of existing PARs and Lake Erie Circulation (LEC) flow as well as other factors that
affect LEC. These other factors included correlations between scheduled interchange and LEC.
The study evaluated the correlations of PJM-NYISO, IESO-MISO, IESO-NYISO and PJM-
MISO scheduled interchange versus LEC. While none of these four scenarios show significant
or strong correlations by themselves, these scheduled interchanges on the four interfaces do not
occur in isolation from each other. By summing all of the average hourly interchanges on the
four interfaces while taking into account the sign convention of scheduled interchange, a
correlation analysis found a significant negative correlation of -.6562.
The study group concluded that there are two explanations for this high correlation. First, there
are instances where scheduled interchange on an interface is not that great but summing all
interfaces produces high scheduled interchanges that coincides with high LEC. Second, LEC is
measuring the combined impact of all scheduled interchange on all interfaces, not just one at a
time. Because of the direction selected to measure LEC (clockwise flow around Lake Erie is
positive), a negative correlation exists and has a larger magnitude than the correlation of each
scenario.
b.
Yes. The operation of the PARs at the interface between Michigan and Ontario (MISO
and IESO), including both the New PARs and the Hydro One PARs does affect the Lake Erie
loop flow impacts of external transactions between and among the balancing areas that surround
Lake Erie.
c.
Loop flow is defined as the difference between scheduled flow and actual flow across an
interface. By measuring Lake Erie loop flow at the Michigan-Ontario interface, actual flow will
be compared with MISO-IESO scheduled flow. Where a deviation exists, this represents Lake
Erie loop flow. It is expected that operation of the New PARs and the Hydro One PARs will
maintain actual flow equal to scheduled flow within a bandwidth for approximately 74% of the
Docket No. ER11-1844
Exhibit No. NYI-2
Page 2 of 2
time. For the remaining 26% of the time, the New PARs and the Hydro One PARs will still
provide 600 MW of loop flow control.
Sponsored by:
Tom Mallinger
DOCKET NO. ER11-1844
EXHIBIT NO. NYI-3
Docket No. ER11-1844
Exhibit No. NYI-3
Page 1 of 63
Docket No. ER11-1844
Exhibit No. NYI-3
Page 2 of 63
Docket No. ER11-1844
Exhibit No. NYI-3
Page 3 of 63
Docket No. ER11-1844
Exhibit No. NYI-3
Page 4 of 63
Docket No. ER11-1844
Exhibit No. NYI-3
Page 5 of 63
Docket No. ER11-1844
Exhibit No. NYI-3
Page 6 of 63
Docket No. ER11-1844
Exhibit No. NYI-3
Page 7 of 63
Docket No. ER11-1844
Exhibit No. NYI-3
Page 8 of 63
Docket No. ER11-1844
Exhibit No. NYI-3
Page 9 of 63
Docket No. ER11-1844
Exhibit No. NYI-3
Page 10 of 63
Docket No. ER11-1844
Exhibit No. NYI-3
Page 11 of 63
Docket No. ER11-1844
Exhibit No. NYI-3
Page 12 of 63
Docket No. ER11-1844
Exhibit No. NYI-3
Page 13 of 63
Docket No. ER11-1844
Exhibit No. NYI-3
Page 14 of 63
Docket No. ER11-1844
Exhibit No. NYI-3
Page 15 of 63
Docket No. ER11-1844
Exhibit No. NYI-3
Page 16 of 63
Docket No. ER11-1844
Exhibit No. NYI-3
Page 17 of 63
Docket No. ER11-1844
Exhibit No. NYI-3
Page 18 of 63
Docket No. ER11-1844
Exhibit No. NYI-3
Page 19 of 63
Docket No. ER11-1844
Exhibit No. NYI-3
Page 20 of 63
Docket No. ER11-1844
Exhibit No. NYI-3
Page 21 of 63
Docket No. ER11-1844
Exhibit No. NYI-3
Page 22 of 63
Docket No. ER11-1844
Exhibit No. NYI-3
Page 23 of 63
Docket No. ER11-1844
Exhibit No. NYI-3
Page 24 of 63
Docket No. ER11-1844
Exhibit No. NYI-3
Page 25 of 63
Docket No. ER11-1844
Exhibit No. NYI-3
Page 26 of 63
Docket No. ER11-1844
Exhibit No. NYI-3
Page 27 of 63
Docket No. ER11-1844
Exhibit No. NYI-3
Page 28 of 63
Docket No. ER11-1844
Exhibit No. NYI-3
Page 29 of 63
Docket No. ER11-1844
Exhibit No. NYI-3
Page 30 of 63
Docket No. ER11-1844
Exhibit No. NYI-3
Page 31 of 63
Docket No. ER11-1844
Exhibit No. NYI-3
Page 32 of 63
Docket No. ER11-1844
Exhibit No. NYI-3
Page 33 of 63
Docket No. ER11-1844
Exhibit No. NYI-3
Page 34 of 63
Docket No. ER11-1844
Exhibit No. NYI-3
Page 35 of 63
Docket No. ER11-1844
Exhibit No. NYI-3
Page 36 of 63
Docket No. ER11-1844
Exhibit No. NYI-3
Page 37 of 63
Docket No. ER11-1844
Exhibit No. NYI-3
Page 38 of 63
Docket No. ER11-1844
Exhibit No. NYI-3
Page 39 of 63
Docket No. ER11-1844
Exhibit No. NYI-3
Page 40 of 63
Docket No. ER11-1844
Exhibit No. NYI-3
Page 41 of 63
Docket No. ER11-1844
Exhibit No. NYI-3
Page 42 of 63
Docket No. ER11-1844
Exhibit No. NYI-3
Page 43 of 63
Docket No. ER11-1844
Exhibit No. NYI-3
Page 44 of 63
Docket No. ER11-1844
Exhibit No. NYI-3
Page 45 of 63
Docket No. ER11-1844
Exhibit No. NYI-3
Page 46 of 63
Docket No. ER11-1844
Exhibit No. NYI-3
Page 47 of 63
Docket No. ER11-1844
Exhibit No. NYI-3
Page 48 of 63
Docket No. ER11-1844
Exhibit No. NYI-3
Page 49 of 63
Docket No. ER11-1844
Exhibit No. NYI-3
Page 50 of 63
Docket No. ER11-1844
Exhibit No. NYI-3
Page 51 of 63
MISO-IESO-C02-R0
2.0
DEFINITIONS
Circuit Target Flow(s) - The desired power flow (MW) on a specific circuit(s) of the Interface.
Control Band - The maximum targeted Interface Deviation of ± 200 MW, maintained within
practical considerations.
Interface Deviation - The difference between the Interface Flow and the Interface Schedule.
Interface - Collectively, the four circuits that comprise the Ontario-Michigan interconnection
(J5D, L4D, L51D, B3N).
Interface Control Mode(s)
Regulated Mode - The Interface is within operational limitations and retains the ability
to maintain the Interface Deviation within the Control Band, as described in Section 3.4.1
Non-Regulated Mode - The Interface has reached Max Tap and the Interface Deviation
is exceeding or expected to exceed the Control Band.
Bypass Mode - The Interface is in the Bypass Mode when the PARs are either:
a) Physically bypassed or;
b) In-service PARs are at or near neutral tap and no attempt is being made to control
to the Interface Schedule. The PARs may be adjusted as necessary to respect
System Operating Limits
(“SOLs”) of the Interface and Local Interface
Facilities.
Interface Flow - The power flow (MW) on the Interface, including a net direction.
Interface Schedule - The net total of the approved interchange across the Interface, as well as
emergency interchange implemented by MISO and the IESO.
Local Interface Facilities - MISO or IESO transmission facilities that meet any of the following
criteria:
a) Facilities that directly comprise the Interface, or;
b) Equipment at the terminal stations of the Interface, or;
c) Transmission circuits that emanate from the terminal stations of the Interface, or;
d) Other facilities associated with the Interface that are directly and significantly affected by
the distribution of flows between the circuits that comprise the Interface, as noted below:
IESO - transmission circuits that emanate from Lauzon TS
MISO - Transmission facilities in the eastern Detroit / Port Huron area(s).
Max Tap - The Interface (PARs collectively) has reached the maximum ability to control flow,
in either direction.
Page 2 of 10
Docket No. ER11-1844
Exhibit No. NYI-3
Page 52 of 63
Docket No. ER11-1844
Exhibit No. NYI-3
Page 53 of 63
Docket No. ER11-1844
Exhibit No. NYI-3
Page 54 of 63
Docket No. ER11-1844
Exhibit No. NYI-3
Page 55 of 63
Docket No. ER11-1844
Exhibit No. NYI-3
Page 56 of 63
Docket No. ER11-1844
Exhibit No. NYI-3
Page 57 of 63
Docket No. ER11-1844
Exhibit No. NYI-3
Page 58 of 63
Docket No. ER11-1844
Exhibit No. NYI-3
Page 59 of 63
Docket No. ER11-1844
Exhibit No. NYI-3
Page 60 of 63
Docket No. ER11-1844
Exhibit No. NYI-3
Page 61 of 63
Docket No. ER11-1844
Exhibit No. NYI-3
Page 62 of 63
Docket No. ER11-1844
Exhibit No. NYI-3
Page 63 of 63
DOCKET NO. ER11-1844
EXHIBIT NO. NYI-4
Docket No. ER11-1844
Exhibit No. NYI-4
Page 1 of 375
Difference Between Scheduled
and Actual Power Flows,
Date
measured at the NYISO IESO
Border
4/1/2011 0:00
583.66
4340
Hours within Bandwidth
4/1/2011 1:00
508.59
49.41% Percent of Hours within Bandwidth
4/1/2011 2:00
436.05
4/1/2011 3:00
469.84
4/1/2011 4:00
451.48
4/1/2011 5:00
315.04
4/1/2011 6:00
-10.23
4/1/2011 7:00
119.04
4/1/2011 8:00
213.43
4/1/2011 9:00
244.03
4/1/2011 10:00
298.02
4/1/2011 11:00
183.40
4/1/2011 12:00
158.07
4/1/2011 13:00
-79.58
4/1/2011 14:00
-158.34
4/1/2011 15:00
-158.62
4/1/2011 16:00
-151.36
4/1/2011 17:00
16.69
4/1/2011 18:00
94.88
4/1/2011 19:00
177.06
4/1/2011 20:00
122.74
4/1/2011 21:00
-24.36
4/1/2011 22:00
46.41
4/1/2011 23:00
370.92
4/2/2011 0:00
531.25
4/2/2011 1:00
639.78
4/2/2011 2:00
449.40
4/2/2011 3:00
427.22
4/2/2011 4:00
452.35
4/2/2011 5:00
435.50
4/2/2011 6:00
275.26
4/2/2011 7:00
208.51
4/2/2011 8:00
202.95
4/2/2011 9:00
211.54
4/2/2011 10:00
286.98
4/2/2011 11:00
264.05
4/2/2011 12:00
379.08
4/2/2011 13:00
281.31
4/2/2011 14:00
418.92
4/2/2011 15:00
568.64
4/2/2011 16:00
457.09
Docket No. ER11-1844
Exhibit No. NYI-4
Page 2 of 375
4/2/2011 17:00
469.07
4/2/2011 18:00
423.74
4/2/2011 19:00
443.56
4/2/2011 20:00
200.88
4/2/2011 21:00
-32.81
4/2/2011 22:00
423.23
4/2/2011 23:00
212.82
4/3/2011 0:00
214.55
4/3/2011 1:00
216.03
4/3/2011 2:00
193.37
4/3/2011 3:00
291.07
4/3/2011 4:00
321.20
4/3/2011 5:00
445.16
4/3/2011 6:00
469.50
4/3/2011 7:00
424.50
4/3/2011 8:00
250.69
4/3/2011 9:00
262.32
4/3/2011 10:00
295.37
4/3/2011 11:00
207.30
4/3/2011 12:00
335.61
4/3/2011 13:00
320.60
4/3/2011 14:00
205.64
4/3/2011 15:00
62.81
4/3/2011 16:00
89.91
4/3/2011 17:00
117.79
4/3/2011 18:00
102.29
4/3/2011 19:00
323.42
4/3/2011 20:00
327.90
4/3/2011 21:00
127.22
4/3/2011 22:00
206.00
4/3/2011 23:00
257.37
4/4/2011 0:00
175.91
4/4/2011 1:00
302.05
4/4/2011 2:00
278.56
4/4/2011 3:00
404.51
4/4/2011 4:00
278.47
4/4/2011 5:00
71.76
4/4/2011 6:00
-23.79
4/4/2011 7:00
223.58
4/4/2011 8:00
1.87
4/4/2011 9:00
167.84
4/4/2011 10:00
8.34
4/4/2011 11:00
-133.83
4/4/2011 12:00
-218.81
4/4/2011 13:00
-174.60
4/4/2011 14:00
-152.49
4/4/2011 15:00
-268.38
Docket No. ER11-1844
Exhibit No. NYI-4
Page 3 of 375
4/4/2011 16:00
-248.26
4/4/2011 17:00
-231.83
4/4/2011 18:00
-203.89
4/4/2011 19:00
-215.36
4/4/2011 20:00
-277.90
4/4/2011 21:00
-213.04
4/4/2011 22:00
146.35
4/4/2011 23:00
291.25
4/5/2011 0:00
300.23
4/5/2011 1:00
113.00
4/5/2011 2:00
3.14
4/5/2011 3:00
-76.24
4/5/2011 4:00
32.35
4/5/2011 5:00
109.11
4/5/2011 6:00
-127.55
4/5/2011 7:00
119.78
4/5/2011 8:00
114.94
4/5/2011 9:00
-180.46
4/5/2011 10:00
-95.10
4/5/2011 11:00
-191.56
4/5/2011 12:00
-336.66
4/5/2011 13:00
-143.60
4/5/2011 14:00
-200.84
4/5/2011 15:00
80.11
4/5/2011 16:00
-28.22
4/5/2011 17:00
-33.78
4/5/2011 18:00
5.05
4/5/2011 19:00
252.86
4/5/2011 20:00
33.55
4/5/2011 21:00
155.15
4/5/2011 22:00
233.44
4/5/2011 23:00
317.18
4/6/2011 0:00
395.39
4/6/2011 1:00
370.84
4/6/2011 2:00
262.29
4/6/2011 3:00
217.05
4/6/2011 4:00
231.40
4/6/2011 5:00
213.97
4/6/2011 6:00
360.94
4/6/2011 7:00
250.55
4/6/2011 8:00
310.16
4/6/2011 9:00
132.75
4/6/2011 10:00
38.68
4/6/2011 11:00
-242.83
4/6/2011 12:00
-36.60
4/6/2011 13:00
70.37
4/6/2011 14:00
-66.20
Docket No. ER11-1844
Exhibit No. NYI-4
Page 4 of 375
4/6/2011 15:00
-76.82
4/6/2011 16:00
27.17
4/6/2011 17:00
-72.32
4/6/2011 18:00
-33.02
4/6/2011 19:00
-35.58
4/6/2011 20:00
95.06
4/6/2011 21:00
47.30
4/6/2011 22:00
126.16
4/6/2011 23:00
309.60
4/7/2011 0:00
338.12
4/7/2011 1:00
248.87
4/7/2011 2:00
302.26
4/7/2011 3:00
220.57
4/7/2011 4:00
150.24
4/7/2011 5:00
101.12
4/7/2011 6:00
-1.96
4/7/2011 7:00
87.54
4/7/2011 8:00
167.70
4/7/2011 9:00
102.09
4/7/2011 10:00
-65.70
4/7/2011 11:00
3.30
4/7/2011 12:00
-96.91
4/7/2011 13:00
-61.70
4/7/2011 14:00
-90.98
4/7/2011 15:00
-22.09
4/7/2011 16:00
13.29
4/7/2011 17:00
161.75
4/7/2011 18:00
305.78
4/7/2011 19:00
101.71
4/7/2011 20:00
-37.85
4/7/2011 21:00
111.70
4/7/2011 22:00
191.06
4/7/2011 23:00
412.94
4/8/2011 0:00
322.40
4/8/2011 1:00
314.75
4/8/2011 2:00
339.29
4/8/2011 3:00
278.18
4/8/2011 4:00
225.54
4/8/2011 5:00
21.48
4/8/2011 6:00
-120.96
4/8/2011 7:00
-18.34
4/8/2011 8:00
85.59
4/8/2011 9:00
-37.63
4/8/2011 10:00
-10.99
4/8/2011 11:00
40.67
4/8/2011 12:00
41.24
4/8/2011 13:00
-23.46
Docket No. ER11-1844
Exhibit No. NYI-4
Page 5 of 375
4/8/2011 14:00
127.23
4/8/2011 15:00
124.84
4/8/2011 16:00
484.23
4/8/2011 17:00
564.98
4/8/2011 18:00
618.20
4/8/2011 19:00
698.92
4/8/2011 20:00
458.47
4/8/2011 21:00
372.88
4/8/2011 22:00
404.43
4/8/2011 23:00
390.58
4/9/2011 0:00
329.75
4/9/2011 1:00
330.05
4/9/2011 2:00
330.02
4/9/2011 3:00
391.91
4/9/2011 4:00
410.75
4/9/2011 5:00
313.54
4/9/2011 6:00
159.10
4/9/2011 7:00
215.80
4/9/2011 8:00
212.33
4/9/2011 9:00
88.94
4/9/2011 10:00
333.76
4/9/2011 11:00
295.05
4/9/2011 12:00
336.58
4/9/2011 13:00
62.88
4/9/2011 14:00
120.56
4/9/2011 15:00
220.69
4/9/2011 16:00
453.56
4/9/2011 17:00
387.75
4/9/2011 18:00
465.70
4/9/2011 19:00
597.78
4/9/2011 20:00
604.22
4/9/2011 21:00
569.86
4/9/2011 22:00
461.15
4/9/2011 23:00
192.11
4/10/2011 0:00
344.80
4/10/2011 1:00
653.98
4/10/2011 2:00
519.27
4/10/2011 3:00
506.66
4/10/2011 4:00
634.98
4/10/2011 5:00
562.89
4/10/2011 6:00
550.65
4/10/2011 7:00
430.97
4/10/2011 8:00
473.82
4/10/2011 9:00
568.92
4/10/2011 10:00
491.53
4/10/2011 11:00
492.62
4/10/2011 12:00
160.84
Docket No. ER11-1844
Exhibit No. NYI-4
Page 6 of 375
4/10/2011 13:00
246.00
4/10/2011 14:00
-27.45
4/10/2011 15:00
16.28
4/10/2011 16:00
69.17
4/10/2011 17:00
94.16
4/10/2011 18:00
115.68
4/10/2011 19:00
145.32
4/10/2011 20:00
96.19
4/10/2011 21:00
403.48
4/10/2011 22:00
429.80
4/10/2011 23:00
208.41
4/11/2011 0:00
80.09
4/11/2011 1:00
404.26
4/11/2011 2:00
368.58
4/11/2011 3:00
242.90
4/11/2011 4:00
237.87
4/11/2011 5:00
278.39
4/11/2011 6:00
106.18
4/11/2011 7:00
308.98
4/11/2011 8:00
73.23
4/11/2011 9:00
63.27
4/11/2011 10:00
232.53
4/11/2011 11:00
220.31
4/11/2011 12:00
304.80
4/11/2011 13:00
188.81
4/11/2011 14:00
382.22
4/11/2011 15:00
141.12
4/11/2011 16:00
87.37
4/11/2011 17:00
88.63
4/11/2011 18:00
35.96
4/11/2011 19:00
284.11
4/11/2011 20:00
366.51
4/11/2011 21:00
31.73
4/11/2011 22:00
328.49
4/11/2011 23:00
339.59
4/12/2011 0:00
329.02
4/12/2011 1:00
419.09
4/12/2011 2:00
393.89
4/12/2011 3:00
389.08
4/12/2011 4:00
365.15
4/12/2011 5:00
191.60
4/12/2011 6:00
-10.42
4/12/2011 7:00
385.77
4/12/2011 8:00
349.92
4/12/2011 9:00
374.44
4/12/2011 10:00
452.32
4/12/2011 11:00
300.08
Docket No. ER11-1844
Exhibit No. NYI-4
Page 7 of 375
4/12/2011 12:00
75.50
4/12/2011 13:00
360.98
4/12/2011 14:00
367.42
4/12/2011 15:00
345.93
4/12/2011 16:00
300.07
4/12/2011 17:00
325.48
4/12/2011 18:00
286.31
4/12/2011 19:00
488.51
4/12/2011 20:00
115.79
4/12/2011 21:00
126.93
4/12/2011 22:00
276.17
4/12/2011 23:00
383.58
4/13/2011 0:00
324.06
4/13/2011 1:00
268.23
4/13/2011 2:00
222.16
4/13/2011 3:00
197.98
4/13/2011 4:00
148.24
4/13/2011 5:00
61.94
4/13/2011 6:00
-13.13
4/13/2011 7:00
151.72
4/13/2011 8:00
466.37
4/13/2011 9:00
519.71
4/13/2011 10:00
208.43
4/13/2011 11:00
411.00
4/13/2011 12:00
265.52
4/13/2011 13:00
348.01
4/13/2011 14:00
199.81
4/13/2011 15:00
224.11
4/13/2011 16:00
240.51
4/13/2011 17:00
306.55
4/13/2011 18:00
314.80
4/13/2011 19:00
274.22
4/13/2011 20:00
375.58
4/13/2011 21:00
275.43
4/13/2011 22:00
241.56
4/13/2011 23:00
338.17
4/14/2011 0:00
221.45
4/14/2011 1:00
245.28
4/14/2011 2:00
199.27
4/14/2011 3:00
317.69
4/14/2011 4:00
274.70
4/14/2011 5:00
15.92
4/14/2011 6:00
-171.69
4/14/2011 7:00
-291.24
4/14/2011 8:00
-158.32
4/14/2011 9:00
42.18
4/14/2011 10:00
145.33
Docket No. ER11-1844
Exhibit No. NYI-4
Page 8 of 375
4/14/2011 11:00
593.10
4/14/2011 12:00
469.55
4/14/2011 13:00
644.93
4/14/2011 14:00
404.77
4/14/2011 15:00
189.65
4/14/2011 16:00
167.31
4/14/2011 17:00
-135.01
4/14/2011 18:00
1.15
4/14/2011 19:00
137.63
4/14/2011 20:00
93.11
4/14/2011 21:00
186.95
4/14/2011 22:00
-7.48
4/14/2011 23:00
153.52
4/15/2011 0:00
323.54
4/15/2011 1:00
390.26
4/15/2011 2:00
369.56
4/15/2011 3:00
302.94
4/15/2011 4:00
224.83
4/15/2011 5:00
173.21
4/15/2011 6:00
-53.86
4/15/2011 7:00
-85.51
4/15/2011 8:00
20.76
4/15/2011 9:00
192.26
4/15/2011 10:00
316.41
4/15/2011 11:00
107.45
4/15/2011 12:00
105.71
4/15/2011 13:00
209.75
4/15/2011 14:00
110.10
4/15/2011 15:00
167.37
4/15/2011 16:00
58.00
4/15/2011 17:00
119.51
4/15/2011 18:00
223.63
4/15/2011 19:00
321.57
4/15/2011 20:00
333.50
4/15/2011 21:00
260.25
4/15/2011 22:00
296.75
4/15/2011 23:00
267.58
4/16/2011 0:00
387.59
4/16/2011 1:00
237.09
4/16/2011 2:00
109.82
4/16/2011 3:00
300.87
4/16/2011 4:00
240.59
4/16/2011 5:00
306.65
4/16/2011 6:00
188.14
4/16/2011 7:00
268.47
4/16/2011 8:00
281.78
4/16/2011 9:00
232.35
Docket No. ER11-1844
Exhibit No. NYI-4
Page 9 of 375
4/16/2011 10:00
429.24
4/16/2011 11:00
372.16
4/16/2011 12:00
522.16
4/16/2011 13:00
323.64
4/16/2011 14:00
172.61
4/16/2011 15:00
254.72
4/16/2011 16:00
209.01
4/16/2011 17:00
189.07
4/16/2011 18:00
228.07
4/16/2011 19:00
119.65
4/16/2011 20:00
308.90
4/16/2011 21:00
105.22
4/16/2011 22:00
393.05
4/16/2011 23:00
194.71
4/17/2011 0:00
114.82
4/17/2011 1:00
137.44
4/17/2011 2:00
206.40
4/17/2011 3:00
164.11
4/17/2011 4:00
138.37
4/17/2011 5:00
306.14
4/17/2011 6:00
239.63
4/17/2011 7:00
186.84
4/17/2011 8:00
201.42
4/17/2011 9:00
286.53
4/17/2011 10:00
289.46
4/17/2011 11:00
267.79
4/17/2011 12:00
258.20
4/17/2011 13:00
211.07
4/17/2011 14:00
141.94
4/17/2011 15:00
276.30
4/17/2011 16:00
99.09
4/17/2011 17:00
175.32
4/17/2011 18:00
91.11
4/17/2011 19:00
229.59
4/17/2011 20:00
236.35
4/17/2011 21:00
243.70
4/17/2011 22:00
281.90
4/17/2011 23:00
212.88
4/18/2011 0:00
143.62
4/18/2011 1:00
214.88
4/18/2011 2:00
160.57
4/18/2011 3:00
241.19
4/18/2011 4:00
150.43
4/18/2011 5:00
171.67
4/18/2011 6:00
130.91
4/18/2011 7:00
212.47
4/18/2011 8:00
254.83
Docket No. ER11-1844
Exhibit No. NYI-4
Page 10 of 375
4/18/2011 9:00
311.32
4/18/2011 10:00
428.98
4/18/2011 11:00
354.14
4/18/2011 12:00
449.21
4/18/2011 13:00
595.03
4/18/2011 14:00
456.64
4/18/2011 15:00
459.18
4/18/2011 16:00
475.04
4/18/2011 17:00
552.89
4/18/2011 18:00
368.56
4/18/2011 19:00
295.23
4/18/2011 20:00
106.18
4/18/2011 21:00
273.14
4/18/2011 22:00
525.71
4/18/2011 23:00
429.51
4/19/2011 0:00
287.62
4/19/2011 1:00
218.29
4/19/2011 2:00
39.85
4/19/2011 3:00
127.00
4/19/2011 4:00
120.10
4/19/2011 5:00
106.72
4/19/2011 6:00
133.86
4/19/2011 7:00
147.14
4/19/2011 8:00
230.09
4/19/2011 9:00
147.50
4/19/2011 10:00
102.63
4/19/2011 11:00
-83.84
4/19/2011 12:00
-343.50
4/19/2011 13:00
-355.03
4/19/2011 14:00
-262.51
4/19/2011 15:00
-352.48
4/19/2011 16:00
-189.70
4/19/2011 17:00
-360.30
4/19/2011 18:00
-96.53
4/19/2011 19:00
-72.85
4/19/2011 20:00
91.38
4/19/2011 21:00
-116.50
4/19/2011 22:00
-310.62
4/19/2011 23:00
-253.30
4/20/2011 0:00
-43.18
4/20/2011 1:00
-49.90
4/20/2011 2:00
-115.51
4/20/2011 3:00
0.32
4/20/2011 4:00
207.25
4/20/2011 5:00
248.50
4/20/2011 6:00
194.98
4/20/2011 7:00
460.26
Docket No. ER11-1844
Exhibit No. NYI-4
Page 11 of 375
4/20/2011 8:00
418.87
4/20/2011 9:00
316.04
4/20/2011 10:00
504.40
4/20/2011 11:00
377.61
4/20/2011 12:00
380.20
4/20/2011 13:00
234.14
4/20/2011 14:00
183.87
4/20/2011 15:00
104.79
4/20/2011 16:00
135.68
4/20/2011 17:00
154.20
4/20/2011 18:00
66.81
4/20/2011 19:00
71.57
4/20/2011 20:00
93.76
4/20/2011 21:00
-17.90
4/20/2011 22:00
-64.63
4/20/2011 23:00
72.96
4/21/2011 0:00
-17.24
4/21/2011 1:00
15.34
4/21/2011 2:00
-175.93
4/21/2011 3:00
-169.10
4/21/2011 4:00
-107.24
4/21/2011 5:00
19.59
4/21/2011 6:00
196.42
4/21/2011 7:00
220.58
4/21/2011 8:00
14.78
4/21/2011 9:00
142.79
4/21/2011 10:00
228.48
4/21/2011 11:00
250.54
4/21/2011 12:00
54.24
4/21/2011 13:00
49.94
4/21/2011 14:00
53.21
4/21/2011 15:00
3.41
4/21/2011 16:00
251.39
4/21/2011 17:00
324.58
4/21/2011 18:00
334.27
4/21/2011 19:00
435.74
4/21/2011 20:00
475.33
4/21/2011 21:00
480.15
4/21/2011 22:00
595.53
4/21/2011 23:00
446.89
4/22/2011 0:00
449.84
4/22/2011 1:00
519.21
4/22/2011 2:00
232.67
4/22/2011 3:00
215.64
4/22/2011 4:00
324.01
4/22/2011 5:00
199.25
4/22/2011 6:00
243.30
Docket No. ER11-1844
Exhibit No. NYI-4
Page 12 of 375
4/22/2011 7:00
133.42
4/22/2011 8:00
63.49
4/22/2011 9:00
-82.39
4/22/2011 10:00
-61.14
4/22/2011 11:00
157.23
4/22/2011 12:00
16.53
4/22/2011 13:00
-10.89
4/22/2011 14:00
195.79
4/22/2011 15:00
216.77
4/22/2011 16:00
204.69
4/22/2011 17:00
172.15
4/22/2011 18:00
422.27
4/22/2011 19:00
401.93
4/22/2011 20:00
83.40
4/22/2011 21:00
188.19
4/22/2011 22:00
194.04
4/22/2011 23:00
380.45
4/23/2011 0:00
421.72
4/23/2011 1:00
165.00
4/23/2011 2:00
238.53
4/23/2011 3:00
173.31
4/23/2011 4:00
226.73
4/23/2011 5:00
211.90
4/23/2011 6:00
133.17
4/23/2011 7:00
160.03
4/23/2011 8:00
255.00
4/23/2011 9:00
369.23
4/23/2011 10:00
382.10
4/23/2011 11:00
460.39
4/23/2011 12:00
300.20
4/23/2011 13:00
288.07
4/23/2011 14:00
345.80
4/23/2011 15:00
20.62
4/23/2011 16:00
95.43
4/23/2011 17:00
11.23
4/23/2011 18:00
61.59
4/23/2011 19:00
133.16
4/23/2011 20:00
85.33
4/23/2011 21:00
-106.02
4/23/2011 22:00
-36.61
4/23/2011 23:00
-21.82
4/24/2011 0:00
238.64
4/24/2011 1:00
162.68
4/24/2011 2:00
132.76
4/24/2011 3:00
199.88
4/24/2011 4:00
200.60
4/24/2011 5:00
218.93
Docket No. ER11-1844
Exhibit No. NYI-4
Page 13 of 375
4/24/2011 6:00
85.20
4/24/2011 7:00
130.49
4/24/2011 8:00
240.03
4/24/2011 9:00
273.16
4/24/2011 10:00
372.28
4/24/2011 11:00
551.97
4/24/2011 12:00
510.28
4/24/2011 13:00
412.61
4/24/2011 14:00
313.74
4/24/2011 15:00
351.16
4/24/2011 16:00
336.56
4/24/2011 17:00
210.10
4/24/2011 18:00
288.20
4/24/2011 19:00
374.75
4/24/2011 20:00
264.05
4/24/2011 21:00
278.33
4/24/2011 22:00
499.41
4/24/2011 23:00
332.12
4/25/2011 0:00
465.31
4/25/2011 1:00
276.19
4/25/2011 2:00
-68.99
4/25/2011 3:00
13.53
4/25/2011 4:00
-26.45
4/25/2011 5:00
122.58
4/25/2011 6:00
113.92
4/25/2011 7:00
114.00
4/25/2011 8:00
231.47
4/25/2011 9:00
335.46
4/25/2011 10:00
657.97
4/25/2011 11:00
466.55
4/25/2011 12:00
524.88
4/25/2011 13:00
630.11
4/25/2011 14:00
317.26
4/25/2011 15:00
478.12
4/25/2011 16:00
572.00
4/25/2011 17:00
481.35
4/25/2011 18:00
547.94
4/25/2011 19:00
365.30
4/25/2011 20:00
461.27
4/25/2011 21:00
548.99
4/25/2011 22:00
460.23
4/25/2011 23:00
373.79
4/26/2011 0:00
475.09
4/26/2011 1:00
418.68
4/26/2011 2:00
197.35
4/26/2011 3:00
266.93
4/26/2011 4:00
203.68
Docket No. ER11-1844
Exhibit No. NYI-4
Page 14 of 375
4/26/2011 5:00
168.32
4/26/2011 6:00
-8.53
4/26/2011 7:00
210.69
4/26/2011 8:00
203.01
4/26/2011 9:00
197.78
4/26/2011 10:00
321.45
4/26/2011 11:00
213.48
4/26/2011 12:00
303.48
4/26/2011 13:00
372.45
4/26/2011 14:00
484.87
4/26/2011 15:00
494.49
4/26/2011 16:00
554.25
4/26/2011 17:00
511.68
4/26/2011 18:00
452.34
4/26/2011 19:00
478.13
4/26/2011 20:00
321.21
4/26/2011 21:00
377.14
4/26/2011 22:00
206.35
4/26/2011 23:00
68.12
4/27/2011 0:00
253.20
4/27/2011 1:00
416.61
4/27/2011 2:00
383.59
4/27/2011 3:00
220.20
4/27/2011 4:00
474.61
4/27/2011 5:00
443.43
4/27/2011 6:00
291.68
4/27/2011 7:00
47.32
4/27/2011 8:00
148.71
4/27/2011 9:00
293.82
4/27/2011 10:00
340.25
4/27/2011 11:00
273.13
4/27/2011 12:00
370.78
4/27/2011 13:00
428.16
4/27/2011 14:00
433.84
4/27/2011 15:00
554.13
4/27/2011 16:00
478.84
4/27/2011 17:00
521.67
4/27/2011 18:00
659.91
4/27/2011 19:00
711.17
4/27/2011 20:00
674.86
4/27/2011 21:00
478.26
4/27/2011 22:00
419.44
4/27/2011 23:00
361.38
4/28/2011 0:00
569.16
4/28/2011 1:00
349.39
4/28/2011 2:00
285.62
4/28/2011 3:00
338.91
Docket No. ER11-1844
Exhibit No. NYI-4
Page 15 of 375
4/28/2011 4:00
238.89
4/28/2011 5:00
99.33
4/28/2011 6:00
162.38
4/28/2011 7:00
163.48
4/28/2011 8:00
78.82
4/28/2011 9:00
123.17
4/28/2011 10:00
142.15
4/28/2011 11:00
97.94
4/28/2011 12:00
296.32
4/28/2011 13:00
269.64
4/28/2011 14:00
247.11
4/28/2011 15:00
86.81
4/28/2011 16:00
-42.50
4/28/2011 17:00
-146.86
4/28/2011 18:00
-235.50
4/28/2011 19:00
83.73
4/28/2011 20:00
110.32
4/28/2011 21:00
-85.98
4/28/2011 22:00
-100.57
4/28/2011 23:00
85.30
4/29/2011 0:00
117.10
4/29/2011 1:00
-89.54
4/29/2011 2:00
-97.62
4/29/2011 3:00
-164.09
4/29/2011 4:00
-230.20
4/29/2011 5:00
-286.58
4/29/2011 6:00
-455.15
4/29/2011 7:00
-424.62
4/29/2011 8:00
-277.12
4/29/2011 9:00
-232.81
4/29/2011 10:00
-224.70
4/29/2011 11:00
-222.88
4/29/2011 12:00
-345.46
4/29/2011 13:00
-316.23
4/29/2011 14:00
-335.30
4/29/2011 15:00
-440.97
4/29/2011 16:00
-341.69
4/29/2011 17:00
-161.66
4/29/2011 18:00
-95.83
4/29/2011 19:00
-90.58
4/29/2011 20:00
-52.33
4/29/2011 21:00
-183.03
4/29/2011 22:00
-151.78
4/29/2011 23:00
70.00
4/30/2011 0:00
110.17
4/30/2011 1:00
102.56
4/30/2011 2:00
285.30
Docket No. ER11-1844
Exhibit No. NYI-4
Page 16 of 375
4/30/2011 3:00
230.69
4/30/2011 4:00
258.32
4/30/2011 5:00
220.09
4/30/2011 6:00
142.86
4/30/2011 7:00
293.24
4/30/2011 8:00
255.53
4/30/2011 9:00
230.50
4/30/2011 10:00
338.04
4/30/2011 11:00
459.86
4/30/2011 12:00
343.43
4/30/2011 13:00
302.28
4/30/2011 14:00
151.16
4/30/2011 15:00
135.50
4/30/2011 16:00
150.95
4/30/2011 17:00
267.42
4/30/2011 18:00
304.75
4/30/2011 19:00
241.74
4/30/2011 20:00
303.41
4/30/2011 21:00
149.57
4/30/2011 22:00
236.06
4/30/2011 23:00
371.02
5/1/2011 0:00
259.30
5/1/2011 1:00
278.13
5/1/2011 2:00
-77.54
5/1/2011 3:00
-66.92
5/1/2011 4:00
-52.03
5/1/2011 5:00
33.97
5/1/2011 6:00
69.50
5/1/2011 7:00
163.32
5/1/2011 8:00
-52.63
5/1/2011 9:00
205.18
5/1/2011 10:00
202.53
5/1/2011 11:00
246.55
5/1/2011 12:00
243.96
5/1/2011 13:00
270.18
5/1/2011 14:00
250.52
5/1/2011 15:00
249.43
5/1/2011 16:00
343.89
5/1/2011 17:00
376.45
5/1/2011 18:00
497.11
5/1/2011 19:00
540.83
5/1/2011 20:00
236.66
5/1/2011 21:00
199.61
5/1/2011 22:00
20.27
5/1/2011 23:00
322.91
5/2/2011 0:00
168.04
5/2/2011 1:00
116.26
Docket No. ER11-1844
Exhibit No. NYI-4
Page 17 of 375
5/2/2011 2:00
235.16
5/2/2011 3:00
125.71
5/2/2011 4:00
114.18
5/2/2011 5:00
70.66
5/2/2011 6:00
2.68
5/2/2011 7:00
62.99
5/2/2011 8:00
381.40
5/2/2011 9:00
369.08
5/2/2011 10:00
604.09
5/2/2011 11:00
242.05
5/2/2011 12:00
231.72
5/2/2011 13:00
185.65
5/2/2011 14:00
223.43
5/2/2011 15:00
198.97
5/2/2011 16:00
246.77
5/2/2011 17:00
263.45
5/2/2011 18:00
165.88
5/2/2011 19:00
155.95
5/2/2011 20:00
439.71
5/2/2011 21:00
350.81
5/2/2011 22:00
268.90
5/2/2011 23:00
288.73
5/3/2011 0:00
328.55
5/3/2011 1:00
311.57
5/3/2011 2:00
396.21
5/3/2011 3:00
412.23
5/3/2011 4:00
500.55
5/3/2011 5:00
552.17
5/3/2011 6:00
214.62
5/3/2011 7:00
444.94
5/3/2011 8:00
361.82
5/3/2011 9:00
346.32
5/3/2011 10:00
397.09
5/3/2011 11:00
423.75
5/3/2011 12:00
330.48
5/3/2011 13:00
241.26
5/3/2011 14:00
153.87
5/3/2011 15:00
129.64
5/3/2011 16:00
54.80
5/3/2011 17:00
17.06
5/3/2011 18:00
-54.82
5/3/2011 19:00
41.36
5/3/2011 20:00
124.57
5/3/2011 21:00
236.00
5/3/2011 22:00
35.11
5/3/2011 23:00
331.10
5/4/2011 0:00
356.70
Docket No. ER11-1844
Exhibit No. NYI-4
Page 18 of 375
5/4/2011 1:00
303.51
5/4/2011 2:00
235.64
5/4/2011 3:00
130.60
5/4/2011 4:00
221.58
5/4/2011 5:00
178.22
5/4/2011 6:00
-85.73
5/4/2011 7:00
71.32
5/4/2011 8:00
142.00
5/4/2011 9:00
143.06
5/4/2011 10:00
33.06
5/4/2011 11:00
-93.70
5/4/2011 12:00
-72.84
5/4/2011 13:00
-100.25
5/4/2011 14:00
-164.88
5/4/2011 15:00
-125.47
5/4/2011 16:00
-126.76
5/4/2011 17:00
-175.89
5/4/2011 18:00
-7.03
5/4/2011 19:00
-17.26
5/4/2011 20:00
229.68
5/4/2011 21:00
185.01
5/4/2011 22:00
-132.00
5/4/2011 23:00
-143.61
5/5/2011 0:00
-56.80
5/5/2011 1:00
146.06
5/5/2011 2:00
-23.37
5/5/2011 3:00
9.04
5/5/2011 4:00
-30.67
5/5/2011 5:00
149.46
5/5/2011 6:00
138.28
5/5/2011 7:00
203.16
5/5/2011 8:00
253.91
5/5/2011 9:00
342.93
5/5/2011 10:00
-23.50
5/5/2011 11:00
68.98
5/5/2011 12:00
129.07
5/5/2011 13:00
121.73
5/5/2011 14:00
-33.16
5/5/2011 15:00
-33.66
5/5/2011 16:00
-185.54
5/5/2011 17:00
-274.07
5/5/2011 18:00
-141.53
5/5/2011 19:00
-36.41
5/5/2011 20:00
225.25
5/5/2011 21:00
228.48
5/5/2011 22:00
207.89
5/5/2011 23:00
136.41
Docket No. ER11-1844
Exhibit No. NYI-4
Page 19 of 375
5/6/2011 0:00
96.59
5/6/2011 1:00
233.92
5/6/2011 2:00
168.47
5/6/2011 3:00
192.73
5/6/2011 4:00
237.91
5/6/2011 5:00
230.12
5/6/2011 6:00
79.11
5/6/2011 7:00
-83.38
5/6/2011 8:00
-37.77
5/6/2011 9:00
-133.06
5/6/2011 10:00
-182.94
5/6/2011 11:00
-130.45
5/6/2011 12:00
-103.37
5/6/2011 13:00
-60.16
5/6/2011 14:00
-83.88
5/6/2011 15:00
-51.28
5/6/2011 16:00
-99.29
5/6/2011 17:00
-8.56
5/6/2011 18:00
339.63
5/6/2011 19:00
438.88
5/6/2011 20:00
295.44
5/6/2011 21:00
254.51
5/6/2011 22:00
144.25
5/6/2011 23:00
88.62
5/7/2011 0:00
180.93
5/7/2011 1:00
402.71
5/7/2011 2:00
331.11
5/7/2011 3:00
210.09
5/7/2011 4:00
258.21
5/7/2011 5:00
302.06
5/7/2011 6:00
332.83
5/7/2011 7:00
383.93
5/7/2011 8:00
302.85
5/7/2011 9:00
271.08
5/7/2011 10:00
413.50
5/7/2011 11:00
485.83
5/7/2011 12:00
387.19
5/7/2011 13:00
193.31
5/7/2011 14:00
140.34
5/7/2011 15:00
124.18
5/7/2011 16:00
153.95
5/7/2011 17:00
189.24
5/7/2011 18:00
128.70
5/7/2011 19:00
220.27
5/7/2011 20:00
446.56
5/7/2011 21:00
268.60
5/7/2011 22:00
310.50
Docket No. ER11-1844
Exhibit No. NYI-4
Page 20 of 375
5/7/2011 23:00
372.27
5/8/2011 0:00
436.60
5/8/2011 1:00
373.78
5/8/2011 2:00
371.95
5/8/2011 3:00
230.37
5/8/2011 4:00
203.26
5/8/2011 5:00
120.79
5/8/2011 6:00
82.24
5/8/2011 7:00
85.46
5/8/2011 8:00
282.00
5/8/2011 9:00
190.38
5/8/2011 10:00
410.27
5/8/2011 11:00
311.94
5/8/2011 12:00
251.16
5/8/2011 13:00
154.84
5/8/2011 14:00
164.31
5/8/2011 15:00
304.95
5/8/2011 16:00
254.91
5/8/2011 17:00
344.13
5/8/2011 18:00
257.01
5/8/2011 19:00
193.79
5/8/2011 20:00
213.18
5/8/2011 21:00
218.67
5/8/2011 22:00
135.47
5/8/2011 23:00
222.92
5/9/2011 0:00
198.63
5/9/2011 1:00
178.22
5/9/2011 2:00
233.46
5/9/2011 3:00
154.07
5/9/2011 4:00
154.35
5/9/2011 5:00
68.66
5/9/2011 6:00
52.65
5/9/2011 7:00
-48.57
5/9/2011 8:00
-131.59
5/9/2011 9:00
-245.60
5/9/2011 10:00
-246.51
5/9/2011 11:00
-187.11
5/9/2011 12:00
-129.16
5/9/2011 13:00
-121.08
5/9/2011 14:00
-12.33
5/9/2011 15:00
1.14
5/9/2011 16:00
-2.97
5/9/2011 17:00
-46.62
5/9/2011 18:00
-13.21
5/9/2011 19:00
-96.49
5/9/2011 20:00
55.46
5/9/2011 21:00
-69.80
Docket No. ER11-1844
Exhibit No. NYI-4
Page 21 of 375
5/9/2011 22:00
-60.71
5/9/2011 23:00
-18.49
5/10/2011 0:00
199.19
5/10/2011 1:00
102.63
5/10/2011 2:00
336.70
5/10/2011 3:00
370.24
5/10/2011 4:00
317.30
5/10/2011 5:00
271.92
5/10/2011 6:00
35.95
5/10/2011 7:00
92.13
5/10/2011 8:00
-50.87
5/10/2011 9:00
-225.87
5/10/2011 10:00
-216.68
5/10/2011 11:00
-172.63
5/10/2011 12:00
-13.60
5/10/2011 13:00
-58.57
5/10/2011 14:00
-113.08
5/10/2011 15:00
-59.03
5/10/2011 16:00
26.37
5/10/2011 17:00
-10.60
5/10/2011 18:00
-2.04
5/10/2011 19:00
23.35
5/10/2011 20:00
-198.99
5/10/2011 21:00
-242.53
5/10/2011 22:00
-191.74
5/10/2011 23:00
141.98
5/11/2011 0:00
-47.63
5/11/2011 1:00
116.74
5/11/2011 2:00
287.74
5/11/2011 3:00
287.51
5/11/2011 4:00
390.97
5/11/2011 5:00
378.88
5/11/2011 6:00
219.80
5/11/2011 7:00
248.88
5/11/2011 8:00
129.70
5/11/2011 9:00
147.89
5/11/2011 10:00
141.77
5/11/2011 11:00
44.64
5/11/2011 12:00
3.10
5/11/2011 13:00
-292.52
5/11/2011 14:00
-267.13
5/11/2011 15:00
-299.92
5/11/2011 16:00
-128.89
5/11/2011 17:00
-171.56
5/11/2011 18:00
47.81
5/11/2011 19:00
-70.74
5/11/2011 20:00
-0.59
Docket No. ER11-1844
Exhibit No. NYI-4
Page 22 of 375
5/11/2011 21:00
-115.86
5/11/2011 22:00
-241.00
5/11/2011 23:00
-402.64
5/12/2011 0:00
-209.06
5/12/2011 1:00
5.65
5/12/2011 2:00
284.36
5/12/2011 3:00
276.69
5/12/2011 4:00
370.86
5/12/2011 5:00
341.09
5/12/2011 6:00
39.10
5/12/2011 7:00
46.97
5/12/2011 8:00
51.10
5/12/2011 9:00
50.52
5/12/2011 10:00
229.50
5/12/2011 11:00
225.03
5/12/2011 12:00
111.80
5/12/2011 13:00
41.85
5/12/2011 14:00
-26.43
5/12/2011 15:00
-84.83
5/12/2011 16:00
-39.67
5/12/2011 17:00
-24.10
5/12/2011 18:00
61.44
5/12/2011 19:00
106.95
5/12/2011 20:00
77.74
5/12/2011 21:00
-127.15
5/12/2011 22:00
-290.02
5/12/2011 23:00
-60.36
5/13/2011 0:00
-36.58
5/13/2011 1:00
-71.70
5/13/2011 2:00
-4.30
5/13/2011 3:00
37.62
5/13/2011 4:00
13.76
5/13/2011 5:00
-127.19
5/13/2011 6:00
-159.24
5/13/2011 7:00
-59.44
5/13/2011 8:00
-144.34
5/13/2011 9:00
-128.55
5/13/2011 10:00
-194.06
5/13/2011 11:00
-76.54
5/13/2011 12:00
-86.53
5/13/2011 13:00
-208.47
5/13/2011 14:00
-228.16
5/13/2011 15:00
-183.82
5/13/2011 16:00
-134.57
5/13/2011 17:00
-22.07
5/13/2011 18:00
126.44
5/13/2011 19:00
72.03
Docket No. ER11-1844
Exhibit No. NYI-4
Page 23 of 375
5/13/2011 20:00
-74.31
5/13/2011 21:00
-25.98
5/13/2011 22:00
54.89
5/13/2011 23:00
128.57
5/14/2011 0:00
316.79
5/14/2011 1:00
406.51
5/14/2011 2:00
237.67
5/14/2011 3:00
225.45
5/14/2011 4:00
212.21
5/14/2011 5:00
231.39
5/14/2011 6:00
352.78
5/14/2011 7:00
122.30
5/14/2011 8:00
72.37
5/14/2011 9:00
126.43
5/14/2011 10:00
58.46
5/14/2011 11:00
2.71
5/14/2011 12:00
84.21
5/14/2011 13:00
202.73
5/14/2011 14:00
251.70
5/14/2011 15:00
292.25
5/14/2011 16:00
277.70
5/14/2011 17:00
282.40
5/14/2011 18:00
259.65
5/14/2011 19:00
219.85
5/14/2011 20:00
280.81
5/14/2011 21:00
293.07
5/14/2011 22:00
431.53
5/14/2011 23:00
412.99
5/15/2011 0:00
133.11
5/15/2011 1:00
57.99
5/15/2011 2:00
170.50
5/15/2011 3:00
245.99
5/15/2011 4:00
63.96
5/15/2011 5:00
161.01
5/15/2011 6:00
151.10
5/15/2011 7:00
278.72
5/15/2011 8:00
235.73
5/15/2011 9:00
183.92
5/15/2011 10:00
201.28
5/15/2011 11:00
260.11
5/15/2011 12:00
442.52
5/15/2011 13:00
321.87
5/15/2011 14:00
362.39
5/15/2011 15:00
256.20
5/15/2011 16:00
323.33
5/15/2011 17:00
267.23
5/15/2011 18:00
411.79
Docket No. ER11-1844
Exhibit No. NYI-4
Page 24 of 375
5/15/2011 19:00
373.95
5/15/2011 20:00
375.65
5/15/2011 21:00
211.68
5/15/2011 22:00
321.86
5/15/2011 23:00
422.36
5/16/2011 0:00
139.26
5/16/2011 1:00
248.89
5/16/2011 2:00
93.06
5/16/2011 3:00
27.63
5/16/2011 4:00
-72.67
5/16/2011 5:00
-168.41
5/16/2011 6:00
-80.88
5/16/2011 7:00
65.37
5/16/2011 8:00
129.67
5/16/2011 9:00
294.88
5/16/2011 10:00
551.40
5/16/2011 11:00
502.21
5/16/2011 12:00
418.70
5/16/2011 13:00
284.01
5/16/2011 14:00
357.51
5/16/2011 15:00
360.19
5/16/2011 16:00
335.33
5/16/2011 17:00
302.44
5/16/2011 18:00
325.04
5/16/2011 19:00
543.65
5/16/2011 20:00
311.22
5/16/2011 21:00
264.51
5/16/2011 22:00
245.16
5/16/2011 23:00
327.58
5/17/2011 0:00
275.25
5/17/2011 1:00
353.27
5/17/2011 2:00
257.43
5/17/2011 3:00
290.95
5/17/2011 4:00
173.55
5/17/2011 5:00
175.95
5/17/2011 6:00
133.20
5/17/2011 7:00
67.57
5/17/2011 8:00
138.01
5/17/2011 9:00
377.50
5/17/2011 10:00
448.49
5/17/2011 11:00
510.18
5/17/2011 12:00
365.61
5/17/2011 13:00
317.36
5/17/2011 14:00
212.42
5/17/2011 15:00
192.43
5/17/2011 16:00
254.62
5/17/2011 17:00
295.55
Docket No. ER11-1844
Exhibit No. NYI-4
Page 25 of 375
5/17/2011 18:00
320.32
5/17/2011 19:00
311.52
5/17/2011 20:00
245.90
5/17/2011 21:00
148.70
5/17/2011 22:00
154.31
5/17/2011 23:00
65.51
5/18/2011 0:00
105.87
5/18/2011 1:00
145.11
5/18/2011 2:00
154.02
5/18/2011 3:00
269.39
5/18/2011 4:00
140.57
5/18/2011 5:00
165.47
5/18/2011 6:00
-32.25
5/18/2011 7:00
80.39
5/18/2011 8:00
63.68
5/18/2011 9:00
94.30
5/18/2011 10:00
109.24
5/18/2011 11:00
196.40
5/18/2011 12:00
299.72
5/18/2011 13:00
393.60
5/18/2011 14:00
337.32
5/18/2011 15:00
334.66
5/18/2011 16:00
279.91
5/18/2011 17:00
311.99
5/18/2011 18:00
319.43
5/18/2011 19:00
401.89
5/18/2011 20:00
388.88
5/18/2011 21:00
332.14
5/18/2011 22:00
248.21
5/18/2011 23:00
193.96
5/19/2011 0:00
119.84
5/19/2011 1:00
245.61
5/19/2011 2:00
328.39
5/19/2011 3:00
379.32
5/19/2011 4:00
256.02
5/19/2011 5:00
194.55
5/19/2011 6:00
127.84
5/19/2011 7:00
50.11
5/19/2011 8:00
87.00
5/19/2011 9:00
-77.64
5/19/2011 10:00
-21.86
5/19/2011 11:00
152.47
5/19/2011 12:00
385.44
5/19/2011 13:00
123.56
5/19/2011 14:00
-252.78
5/19/2011 15:00
-9.87
5/19/2011 16:00
101.07
Docket No. ER11-1844
Exhibit No. NYI-4
Page 26 of 375
5/19/2011 17:00
274.47
5/19/2011 18:00
384.44
5/19/2011 19:00
230.88
5/19/2011 20:00
314.10
5/19/2011 21:00
171.33
5/19/2011 22:00
234.26
5/19/2011 23:00
272.62
5/20/2011 0:00
175.22
5/20/2011 1:00
401.39
5/20/2011 2:00
464.65
5/20/2011 3:00
422.60
5/20/2011 4:00
465.04
5/20/2011 5:00
316.59
5/20/2011 6:00
434.26
5/20/2011 7:00
266.63
5/20/2011 8:00
387.97
5/20/2011 9:00
340.25
5/20/2011 10:00
377.16
5/20/2011 11:00
152.37
5/20/2011 12:00
210.32
5/20/2011 13:00
219.83
5/20/2011 14:00
361.96
5/20/2011 15:00
136.06
5/20/2011 16:00
123.67
5/20/2011 17:00
121.20
5/20/2011 18:00
193.72
5/20/2011 19:00
352.41
5/20/2011 20:00
276.54
5/20/2011 21:00
326.98
5/20/2011 22:00
433.03
5/20/2011 23:00
347.69
5/21/2011 0:00
515.71
5/21/2011 1:00
532.14
5/21/2011 2:00
503.07
5/21/2011 3:00
392.58
5/21/2011 4:00
390.56
5/21/2011 5:00
370.82
5/21/2011 6:00
500.58
5/21/2011 7:00
436.82
5/21/2011 8:00
352.12
5/21/2011 9:00
249.07
5/21/2011 10:00
362.68
5/21/2011 11:00
562.95
5/21/2011 12:00
562.97
5/21/2011 13:00
312.96
5/21/2011 14:00
388.50
5/21/2011 15:00
403.78
Docket No. ER11-1844
Exhibit No. NYI-4
Page 27 of 375
5/21/2011 16:00
396.20
5/21/2011 17:00
511.25
5/21/2011 18:00
554.36
5/21/2011 19:00
576.78
5/21/2011 20:00
535.19
5/21/2011 21:00
764.81
5/21/2011 22:00
322.24
5/21/2011 23:00
372.27
5/22/2011 0:00
212.11
5/22/2011 1:00
393.16
5/22/2011 2:00
351.25
5/22/2011 3:00
252.12
5/22/2011 4:00
151.07
5/22/2011 5:00
-85.57
5/22/2011 6:00
248.70
5/22/2011 7:00
112.06
5/22/2011 8:00
-11.09
5/22/2011 9:00
-33.44
5/22/2011 10:00
6.69
5/22/2011 11:00
202.93
5/22/2011 12:00
67.08
5/22/2011 13:00
172.60
5/22/2011 14:00
264.20
5/22/2011 15:00
218.64
5/22/2011 16:00
267.78
5/22/2011 17:00
181.07
5/22/2011 18:00
322.96
5/22/2011 19:00
343.20
5/22/2011 20:00
361.53
5/22/2011 21:00
347.64
5/22/2011 22:00
153.79
5/22/2011 23:00
119.61
5/23/2011 0:00
20.57
5/23/2011 1:00
224.47
5/23/2011 2:00
133.00
5/23/2011 3:00
209.71
5/23/2011 4:00
126.99
5/23/2011 5:00
174.81
5/23/2011 6:00
231.82
5/23/2011 7:00
56.71
5/23/2011 8:00
-23.64
5/23/2011 9:00
202.84
5/23/2011 10:00
79.16
5/23/2011 11:00
96.10
5/23/2011 12:00
-106.92
5/23/2011 13:00
156.27
5/23/2011 14:00
2.13
Docket No. ER11-1844
Exhibit No. NYI-4
Page 28 of 375
5/23/2011 15:00
-162.21
5/23/2011 16:00
-89.57
5/23/2011 17:00
9.86
5/23/2011 18:00
111.85
5/23/2011 19:00
162.50
5/23/2011 20:00
199.53
5/23/2011 21:00
4.45
5/23/2011 22:00
-32.78
5/23/2011 23:00
-39.59
5/24/2011 0:00
-91.34
5/24/2011 1:00
55.75
5/24/2011 2:00
68.04
5/24/2011 3:00
122.82
5/24/2011 4:00
208.58
5/24/2011 5:00
193.79
5/24/2011 6:00
-18.89
5/24/2011 7:00
-73.55
5/24/2011 8:00
-186.39
5/24/2011 9:00
-19.44
5/24/2011 10:00
-158.99
5/24/2011 11:00
-259.36
5/24/2011 12:00
-397.20
5/24/2011 13:00
5.63
5/24/2011 14:00
-58.06
5/24/2011 15:00
-15.90
5/24/2011 16:00
13.28
5/24/2011 17:00
122.90
5/24/2011 18:00
24.05
5/24/2011 19:00
386.12
5/24/2011 20:00
281.44
5/24/2011 21:00
172.73
5/24/2011 22:00
171.79
5/24/2011 23:00
229.81
5/25/2011 0:00
552.17
5/25/2011 1:00
560.83
5/25/2011 2:00
420.32
5/25/2011 3:00
400.95
5/25/2011 4:00
484.91
5/25/2011 5:00
499.85
5/25/2011 6:00
557.28
5/25/2011 7:00
215.90
5/25/2011 8:00
156.36
5/25/2011 9:00
79.00
5/25/2011 10:00
103.19
5/25/2011 11:00
189.14
5/25/2011 12:00
252.31
5/25/2011 13:00
380.77
Docket No. ER11-1844
Exhibit No. NYI-4
Page 29 of 375
5/25/2011 14:00
247.44
5/25/2011 15:00
303.43
5/25/2011 16:00
115.97
5/25/2011 17:00
107.60
5/25/2011 18:00
42.49
5/25/2011 19:00
23.97
5/25/2011 20:00
-114.67
5/25/2011 21:00
-117.17
5/25/2011 22:00
274.55
5/25/2011 23:00
315.34
5/26/2011 0:00
473.44
5/26/2011 1:00
538.27
5/26/2011 2:00
514.58
5/26/2011 3:00
429.74
5/26/2011 4:00
271.28
5/26/2011 5:00
216.53
5/26/2011 6:00
153.39
5/26/2011 7:00
223.10
5/26/2011 8:00
276.31
5/26/2011 9:00
234.53
5/26/2011 10:00
298.87
5/26/2011 11:00
67.85
5/26/2011 12:00
199.41
5/26/2011 13:00
115.54
5/26/2011 14:00
92.28
5/26/2011 15:00
185.51
5/26/2011 16:00
179.68
5/26/2011 17:00
-62.55
5/26/2011 18:00
133.26
5/26/2011 19:00
246.19
5/26/2011 20:00
301.37
5/26/2011 21:00
226.34
5/26/2011 22:00
263.96
5/26/2011 23:00
207.78
5/27/2011 0:00
394.11
5/27/2011 1:00
345.43
5/27/2011 2:00
258.39
5/27/2011 3:00
155.82
5/27/2011 4:00
206.56
5/27/2011 5:00
315.75
5/27/2011 6:00
301.38
5/27/2011 7:00
379.57
5/27/2011 8:00
288.46
5/27/2011 9:00
370.92
5/27/2011 10:00
417.14
5/27/2011 11:00
562.18
5/27/2011 12:00
531.14
Docket No. ER11-1844
Exhibit No. NYI-4
Page 30 of 375
5/27/2011 13:00
108.64
5/27/2011 14:00
149.57
5/27/2011 15:00
426.75
5/27/2011 16:00
76.78
5/27/2011 17:00
-101.56
5/27/2011 18:00
-153.05
5/27/2011 19:00
12.33
5/27/2011 20:00
90.03
5/27/2011 21:00
167.14
5/27/2011 22:00
286.57
5/27/2011 23:00
614.63
5/28/2011 0:00
627.86
5/28/2011 1:00
885.91
5/28/2011 2:00
802.63
5/28/2011 3:00
737.40
5/28/2011 4:00
761.26
5/28/2011 5:00
613.61
5/28/2011 6:00
773.83
5/28/2011 7:00
796.71
5/28/2011 8:00
427.43
5/28/2011 9:00
406.49
5/28/2011 10:00
504.26
5/28/2011 11:00
486.92
5/28/2011 12:00
215.45
5/28/2011 13:00
248.76
5/28/2011 14:00
211.09
5/28/2011 15:00
315.71
5/28/2011 16:00
434.80
5/28/2011 17:00
384.13
5/28/2011 18:00
623.84
5/28/2011 19:00
541.79
5/28/2011 20:00
598.78
5/28/2011 21:00
513.53
5/28/2011 22:00
647.35
5/28/2011 23:00
679.27
5/29/2011 0:00
408.48
5/29/2011 1:00
475.85
5/29/2011 2:00
455.91
5/29/2011 3:00
427.10
5/29/2011 4:00
484.21
5/29/2011 5:00
533.41
5/29/2011 6:00
679.97
5/29/2011 7:00
616.30
5/29/2011 8:00
420.19
5/29/2011 9:00
415.13
5/29/2011 10:00
506.08
5/29/2011 11:00
473.69
Docket No. ER11-1844
Exhibit No. NYI-4
Page 31 of 375
5/29/2011 12:00
208.64
5/29/2011 13:00
458.53
5/29/2011 14:00
552.96
5/29/2011 15:00
654.25
5/29/2011 16:00
630.50
5/29/2011 17:00
666.13
5/29/2011 18:00
613.30
5/29/2011 19:00
517.03
5/29/2011 20:00
666.73
5/29/2011 21:00
672.39
5/29/2011 22:00
645.23
5/29/2011 23:00
578.82
5/30/2011 0:00
631.13
5/30/2011 1:00
707.47
5/30/2011 2:00
703.16
5/30/2011 3:00
802.22
5/30/2011 4:00
727.40
5/30/2011 5:00
644.35
5/30/2011 6:00
863.70
5/30/2011 7:00
513.09
5/30/2011 8:00
481.50
5/30/2011 9:00
526.01
5/30/2011 10:00
544.66
5/30/2011 11:00
431.61
5/30/2011 12:00
280.20
5/30/2011 13:00
177.09
5/30/2011 14:00
360.89
5/30/2011 15:00
222.54
5/30/2011 16:00
116.86
5/30/2011 17:00
-181.03
5/30/2011 18:00
-175.72
5/30/2011 19:00
232.29
5/30/2011 20:00
264.67
5/30/2011 21:00
136.16
5/30/2011 22:00
242.84
5/30/2011 23:00
369.65
5/31/2011 0:00
430.24
5/31/2011 1:00
530.65
5/31/2011 2:00
267.32
5/31/2011 3:00
415.51
5/31/2011 4:00
381.35
5/31/2011 5:00
352.19
5/31/2011 6:00
436.50
5/31/2011 7:00
403.29
5/31/2011 8:00
285.03
5/31/2011 9:00
35.01
5/31/2011 10:00
-104.49
Docket No. ER11-1844
Exhibit No. NYI-4
Page 32 of 375
5/31/2011 11:00
-225.38
5/31/2011 12:00
-100.50
5/31/2011 13:00
-360.94
5/31/2011 14:00
-233.41
5/31/2011 15:00
-302.85
5/31/2011 16:00
-139.82
5/31/2011 17:00
-122.47
5/31/2011 18:00
164.73
5/31/2011 19:00
-15.72
5/31/2011 20:00
223.04
5/31/2011 21:00
156.94
5/31/2011 22:00
282.72
5/31/2011 23:00
442.23
6/1/2011 0:00
96.27
6/1/2011 1:00
-232.76
6/1/2011 2:00
-258.70
6/1/2011 3:00
38.51
6/1/2011 4:00
178.05
6/1/2011 5:00
207.15
6/1/2011 6:00
278.52
6/1/2011 7:00
266.19
6/1/2011 8:00
-298.85
6/1/2011 9:00
-107.41
6/1/2011 10:00
-139.64
6/1/2011 11:00
89.59
6/1/2011 12:00
220.81
6/1/2011 13:00
259.92
6/1/2011 14:00
556.87
6/1/2011 15:00
874.64
6/1/2011 16:00
899.32
6/1/2011 17:00
695.58
6/1/2011 18:00
455.70
6/1/2011 19:00
757.27
6/1/2011 20:00
770.59
6/1/2011 21:00
629.59
6/1/2011 22:00
639.11
6/1/2011 23:00
532.61
6/2/2011 0:00
155.65
6/2/2011 1:00
36.44
6/2/2011 2:00
-6.28
6/2/2011 3:00
231.40
6/2/2011 4:00
186.63
6/2/2011 5:00
220.47
6/2/2011 6:00
285.89
6/2/2011 7:00
339.37
6/2/2011 8:00
520.78
6/2/2011 9:00
451.52
Docket No. ER11-1844
Exhibit No. NYI-4
Page 33 of 375
6/2/2011 10:00
381.72
6/2/2011 11:00
165.81
6/2/2011 12:00
221.29
6/2/2011 13:00
240.27
6/2/2011 14:00
239.81
6/2/2011 15:00
97.81
6/2/2011 16:00
371.43
6/2/2011 17:00
181.03
6/2/2011 18:00
353.82
6/2/2011 19:00
454.73
6/2/2011 20:00
341.13
6/2/2011 21:00
36.12
6/2/2011 22:00
188.17
6/2/2011 23:00
23.02
6/3/2011 0:00
111.01
6/3/2011 1:00
223.22
6/3/2011 2:00
414.51
6/3/2011 3:00
484.95
6/3/2011 4:00
594.69
6/3/2011 5:00
491.37
6/3/2011 6:00
393.63
6/3/2011 7:00
508.05
6/3/2011 8:00
384.57
6/3/2011 9:00
240.79
6/3/2011 10:00
384.63
6/3/2011 11:00
304.06
6/3/2011 12:00
271.76
6/3/2011 13:00
513.92
6/3/2011 14:00
641.83
6/3/2011 15:00
672.46
6/3/2011 16:00
636.70
6/3/2011 17:00
486.73
6/3/2011 18:00
595.44
6/3/2011 19:00
503.46
6/3/2011 20:00
477.17
6/3/2011 21:00
381.72
6/3/2011 22:00
500.88
6/3/2011 23:00
486.02
6/4/2011 0:00
691.57
6/4/2011 1:00
524.25
6/4/2011 2:00
430.74
6/4/2011 3:00
456.96
6/4/2011 4:00
263.50
6/4/2011 5:00
253.35
6/4/2011 6:00
246.89
6/4/2011 7:00
331.19
6/4/2011 8:00
338.22
Docket No. ER11-1844
Exhibit No. NYI-4
Page 34 of 375
6/4/2011 9:00
242.84
6/4/2011 10:00
-32.71
6/4/2011 11:00
-95.15
6/4/2011 12:00
44.31
6/4/2011 13:00
-160.50
6/4/2011 14:00
-78.82
6/4/2011 15:00
-103.47
6/4/2011 16:00
26.38
6/4/2011 17:00
10.22
6/4/2011 18:00
-95.91
6/4/2011 19:00
41.19
6/4/2011 20:00
28.34
6/4/2011 21:00
-50.07
6/4/2011 22:00
-14.63
6/4/2011 23:00
312.38
6/5/2011 0:00
203.19
6/5/2011 1:00
362.45
6/5/2011 2:00
354.59
6/5/2011 3:00
679.26
6/5/2011 4:00
505.00
6/5/2011 5:00
554.26
6/5/2011 6:00
719.58
6/5/2011 7:00
557.63
6/5/2011 8:00
506.33
6/5/2011 9:00
361.15
6/5/2011 10:00
74.52
6/5/2011 11:00
-119.55
6/5/2011 12:00
-143.48
6/5/2011 13:00
-70.77
6/5/2011 14:00
-148.96
6/5/2011 15:00
-288.26
6/5/2011 16:00
-252.00
6/5/2011 17:00
-224.77
6/5/2011 18:00
-107.48
6/5/2011 19:00
173.90
6/5/2011 20:00
169.56
6/5/2011 21:00
163.64
6/5/2011 22:00
409.98
6/5/2011 23:00
470.15
6/6/2011 0:00
673.65
6/6/2011 1:00
515.45
6/6/2011 2:00
599.43
6/6/2011 3:00
530.96
6/6/2011 4:00
703.35
6/6/2011 5:00
605.79
6/6/2011 6:00
586.10
6/6/2011 7:00
465.92
Docket No. ER11-1844
Exhibit No. NYI-4
Page 35 of 375
6/6/2011 8:00
276.85
6/6/2011 9:00
334.99
6/6/2011 10:00
218.49
6/6/2011 11:00
125.71
6/6/2011 12:00
-95.60
6/6/2011 13:00
-25.87
6/6/2011 14:00
4.41
6/6/2011 15:00
71.88
6/6/2011 16:00
116.83
6/6/2011 17:00
122.24
6/6/2011 18:00
258.05
6/6/2011 19:00
170.43
6/6/2011 20:00
-4.92
6/6/2011 21:00
-53.39
6/6/2011 22:00
-143.52
6/6/2011 23:00
162.96
6/7/2011 0:00
266.08
6/7/2011 1:00
487.95
6/7/2011 2:00
403.71
6/7/2011 3:00
190.36
6/7/2011 4:00
263.88
6/7/2011 5:00
328.81
6/7/2011 6:00
187.97
6/7/2011 7:00
-82.98
6/7/2011 8:00
20.25
6/7/2011 9:00
5.29
6/7/2011 10:00
-246.88
6/7/2011 11:00
-462.26
6/7/2011 12:00
18.23
6/7/2011 13:00
-163.80
6/7/2011 14:00
-488.88
6/7/2011 15:00
61.48
6/7/2011 16:00
-279.91
6/7/2011 17:00
-368.99
6/7/2011 18:00
-161.95
6/7/2011 19:00
-186.91
6/7/2011 20:00
-282.16
6/7/2011 21:00
-309.27
6/7/2011 22:00
-256.83
6/7/2011 23:00
-282.18
6/8/2011 0:00
-346.24
6/8/2011 1:00
-135.04
6/8/2011 2:00
-194.04
6/8/2011 3:00
-102.90
6/8/2011 4:00
-16.93
6/8/2011 5:00
-15.97
6/8/2011 6:00
76.07
Docket No. ER11-1844
Exhibit No. NYI-4
Page 36 of 375
6/8/2011 7:00
-73.37
6/8/2011 8:00
64.14
6/8/2011 9:00
-256.26
6/8/2011 10:00
-609.41
6/8/2011 11:00
-570.11
6/8/2011 12:00
-502.88
6/8/2011 13:00
-700.25
6/8/2011 14:00
-546.36
6/8/2011 15:00
-428.18
6/8/2011 16:00
-505.94
6/8/2011 17:00
-475.35
6/8/2011 18:00
-526.93
6/8/2011 19:00
-519.31
6/8/2011 20:00
-478.85
6/8/2011 21:00
-672.36
6/8/2011 22:00
-319.65
6/8/2011 23:00
-373.73
6/9/2011 0:00
-78.07
6/9/2011 1:00
-10.92
6/9/2011 2:00
81.70
6/9/2011 3:00
304.24
6/9/2011 4:00
341.97
6/9/2011 5:00
155.06
6/9/2011 6:00
271.68
6/9/2011 7:00
200.92
6/9/2011 8:00
127.64
6/9/2011 9:00
113.40
6/9/2011 10:00
107.07
6/9/2011 11:00
354.31
6/9/2011 12:00
222.19
6/9/2011 13:00
626.27
6/9/2011 14:00
509.35
6/9/2011 15:00
793.35
6/9/2011 16:00
720.45
6/9/2011 17:00
700.93
6/9/2011 18:00
792.03
6/9/2011 19:00
836.53
6/9/2011 20:00
661.97
6/9/2011 21:00
726.89
6/9/2011 22:00
856.19
6/9/2011 23:00
519.77
6/10/2011 0:00
424.20
6/10/2011 1:00
453.19
6/10/2011 2:00
695.69
6/10/2011 3:00
649.36
6/10/2011 4:00
661.10
6/10/2011 5:00
546.61
Docket No. ER11-1844
Exhibit No. NYI-4
Page 37 of 375
6/10/2011 6:00
379.94
6/10/2011 7:00
318.02
6/10/2011 8:00
454.80
6/10/2011 9:00
297.41
6/10/2011 10:00
351.85
6/10/2011 11:00
191.71
6/10/2011 12:00
301.99
6/10/2011 13:00
386.41
6/10/2011 14:00
347.34
6/10/2011 15:00
283.50
6/10/2011 16:00
432.22
6/10/2011 17:00
375.03
6/10/2011 18:00
393.69
6/10/2011 19:00
493.75
6/10/2011 20:00
491.57
6/10/2011 21:00
210.73
6/10/2011 22:00
196.92
6/10/2011 23:00
143.80
6/11/2011 0:00
246.79
6/11/2011 1:00
410.36
6/11/2011 2:00
356.66
6/11/2011 3:00
253.13
6/11/2011 4:00
459.48
6/11/2011 5:00
267.88
6/11/2011 6:00
276.53
6/11/2011 7:00
505.69
6/11/2011 8:00
424.06
6/11/2011 9:00
254.26
6/11/2011 10:00
249.70
6/11/2011 11:00
373.82
6/11/2011 12:00
381.96
6/11/2011 13:00
377.97
6/11/2011 14:00
351.94
6/11/2011 15:00
508.70
6/11/2011 16:00
506.39
6/11/2011 17:00
294.50
6/11/2011 18:00
269.68
6/11/2011 19:00
327.02
6/11/2011 20:00
355.72
6/11/2011 21:00
226.13
6/11/2011 22:00
295.59
6/11/2011 23:00
419.15
6/12/2011 0:00
390.81
6/12/2011 1:00
453.35
6/12/2011 2:00
369.63
6/12/2011 3:00
224.48
6/12/2011 4:00
398.23
Docket No. ER11-1844
Exhibit No. NYI-4
Page 38 of 375
6/12/2011 5:00
411.28
6/12/2011 6:00
440.70
6/12/2011 7:00
480.45
6/12/2011 8:00
377.44
6/12/2011 9:00
426.12
6/12/2011 10:00
404.62
6/12/2011 11:00
444.36
6/12/2011 12:00
479.35
6/12/2011 13:00
499.92
6/12/2011 14:00
312.15
6/12/2011 15:00
466.10
6/12/2011 16:00
361.53
6/12/2011 17:00
483.75
6/12/2011 18:00
462.82
6/12/2011 19:00
344.18
6/12/2011 20:00
369.15
6/12/2011 21:00
269.52
6/12/2011 22:00
243.65
6/12/2011 23:00
296.86
6/13/2011 0:00
342.59
6/13/2011 1:00
226.65
6/13/2011 2:00
290.32
6/13/2011 3:00
249.86
6/13/2011 4:00
323.92
6/13/2011 5:00
200.27
6/13/2011 6:00
304.73
6/13/2011 7:00
274.99
6/13/2011 8:00
94.65
6/13/2011 9:00
17.09
6/13/2011 10:00
53.38
6/13/2011 11:00
170.77
6/13/2011 12:00
72.33
6/13/2011 13:00
39.29
6/13/2011 14:00
-90.38
6/13/2011 15:00
-149.76
6/13/2011 16:00
-60.30
6/13/2011 17:00
-136.10
6/13/2011 18:00
-56.29
6/13/2011 19:00
37.95
6/13/2011 20:00
-82.20
6/13/2011 21:00
-59.22
6/13/2011 22:00
225.59
6/13/2011 23:00
377.73
6/14/2011 0:00
387.69
6/14/2011 1:00
463.36
6/14/2011 2:00
425.05
6/14/2011 3:00
158.24
Docket No. ER11-1844
Exhibit No. NYI-4
Page 39 of 375
6/14/2011 4:00
21.40
6/14/2011 5:00
277.63
6/14/2011 6:00
573.98
6/14/2011 7:00
334.58
6/14/2011 8:00
212.39
6/14/2011 9:00
135.38
6/14/2011 10:00
190.00
6/14/2011 11:00
79.51
6/14/2011 12:00
-0.93
6/14/2011 13:00
142.65
6/14/2011 14:00
11.60
6/14/2011 15:00
-6.57
6/14/2011 16:00
-28.42
6/14/2011 17:00
41.34
6/14/2011 18:00
185.46
6/14/2011 19:00
126.48
6/14/2011 20:00
204.99
6/14/2011 21:00
133.06
6/14/2011 22:00
186.60
6/14/2011 23:00
529.72
6/15/2011 0:00
366.82
6/15/2011 1:00
403.04
6/15/2011 2:00
115.72
6/15/2011 3:00
172.91
6/15/2011 4:00
63.55
6/15/2011 5:00
197.04
6/15/2011 6:00
615.29
6/15/2011 7:00
525.73
6/15/2011 8:00
453.35
6/15/2011 9:00
470.91
6/15/2011 10:00
459.57
6/15/2011 11:00
360.94
6/15/2011 12:00
313.26
6/15/2011 13:00
425.38
6/15/2011 14:00
340.59
6/15/2011 15:00
341.30
6/15/2011 16:00
370.26
6/15/2011 17:00
347.79
6/15/2011 18:00
310.73
6/15/2011 19:00
301.14
6/15/2011 20:00
341.05
6/15/2011 21:00
175.70
6/15/2011 22:00
274.36
6/15/2011 23:00
565.64
6/16/2011 0:00
617.37
6/16/2011 1:00
542.06
6/16/2011 2:00
465.15
Docket No. ER11-1844
Exhibit No. NYI-4
Page 40 of 375
6/16/2011 3:00
395.99
6/16/2011 4:00
476.60
6/16/2011 5:00
668.64
6/16/2011 6:00
689.41
6/16/2011 7:00
706.88
6/16/2011 8:00
389.92
6/16/2011 9:00
265.48
6/16/2011 10:00
342.93
6/16/2011 11:00
509.86
6/16/2011 12:00
479.64
6/16/2011 13:00
498.04
6/16/2011 14:00
383.45
6/16/2011 15:00
505.22
6/16/2011 16:00
511.89
6/16/2011 17:00
501.98
6/16/2011 18:00
377.16
6/16/2011 19:00
441.44
6/16/2011 20:00
435.55
6/16/2011 21:00
384.07
6/16/2011 22:00
446.50
6/16/2011 23:00
496.21
6/17/2011 0:00
411.31
6/17/2011 1:00
492.64
6/17/2011 2:00
422.20
6/17/2011 3:00
497.59
6/17/2011 4:00
300.19
6/17/2011 5:00
234.79
6/17/2011 6:00
444.39
6/17/2011 7:00
259.17
6/17/2011 8:00
192.20
6/17/2011 9:00
161.93
6/17/2011 10:00
267.59
6/17/2011 11:00
174.22
6/17/2011 12:00
444.06
6/17/2011 13:00
292.65
6/17/2011 14:00
347.52
6/17/2011 15:00
304.38
6/17/2011 16:00
158.45
6/17/2011 17:00
193.23
6/17/2011 18:00
272.68
6/17/2011 19:00
334.76
6/17/2011 20:00
187.00
6/17/2011 21:00
78.42
6/17/2011 22:00
326.55
6/17/2011 23:00
287.44
6/18/2011 0:00
237.76
6/18/2011 1:00
339.75
Docket No. ER11-1844
Exhibit No. NYI-4
Page 41 of 375
6/18/2011 2:00
386.94
6/18/2011 3:00
340.94
6/18/2011 4:00
247.95
6/18/2011 5:00
187.42
6/18/2011 6:00
533.35
6/18/2011 7:00
373.60
6/18/2011 8:00
50.62
6/18/2011 9:00
160.76
6/18/2011 10:00
423.53
6/18/2011 11:00
334.53
6/18/2011 12:00
310.94
6/18/2011 13:00
515.59
6/18/2011 14:00
539.21
6/18/2011 15:00
601.59
6/18/2011 16:00
561.87
6/18/2011 17:00
448.42
6/18/2011 18:00
292.03
6/18/2011 19:00
374.80
6/18/2011 20:00
456.64
6/18/2011 21:00
339.01
6/18/2011 22:00
366.00
6/18/2011 23:00
434.26
6/19/2011 0:00
302.22
6/19/2011 1:00
421.34
6/19/2011 2:00
641.65
6/19/2011 3:00
475.71
6/19/2011 4:00
509.83
6/19/2011 5:00
396.95
6/19/2011 6:00
345.28
6/19/2011 7:00
361.15
6/19/2011 8:00
514.98
6/19/2011 9:00
575.41
6/19/2011 10:00
489.32
6/19/2011 11:00
88.46
6/19/2011 12:00
173.97
6/19/2011 13:00
76.62
6/19/2011 14:00
194.85
6/19/2011 15:00
108.11
6/19/2011 16:00
209.23
6/19/2011 17:00
146.07
6/19/2011 18:00
311.86
6/19/2011 19:00
312.63
6/19/2011 20:00
261.60
6/19/2011 21:00
258.94
6/19/2011 22:00
414.33
6/19/2011 23:00
255.83
6/20/2011 0:00
213.83
Docket No. ER11-1844
Exhibit No. NYI-4
Page 42 of 375
6/20/2011 1:00
352.24
6/20/2011 2:00
497.82
6/20/2011 3:00
470.31
6/20/2011 4:00
622.33
6/20/2011 5:00
461.43
6/20/2011 6:00
348.37
6/20/2011 7:00
360.91
6/20/2011 8:00
107.57
6/20/2011 9:00
149.73
6/20/2011 10:00
86.66
6/20/2011 11:00
121.95
6/20/2011 12:00
81.16
6/20/2011 13:00
179.38
6/20/2011 14:00
542.14
6/20/2011 15:00
477.76
6/20/2011 16:00
382.21
6/20/2011 17:00
253.60
6/20/2011 18:00
154.92
6/20/2011 19:00
177.22
6/20/2011 20:00
269.25
6/20/2011 21:00
161.67
6/20/2011 22:00
144.37
6/20/2011 23:00
63.41
6/21/2011 0:00
329.09
6/21/2011 1:00
327.80
6/21/2011 2:00
454.51
6/21/2011 3:00
482.58
6/21/2011 4:00
349.00
6/21/2011 5:00
169.74
6/21/2011 6:00
305.34
6/21/2011 7:00
395.40
6/21/2011 8:00
69.79
6/21/2011 9:00
-61.55
6/21/2011 10:00
-155.49
6/21/2011 11:00
-87.40
6/21/2011 12:00
174.08
6/21/2011 13:00
251.87
6/21/2011 14:00
146.10
6/21/2011 15:00
178.03
6/21/2011 16:00
84.38
6/21/2011 17:00
133.86
6/21/2011 18:00
39.64
6/21/2011 19:00
-48.79
6/21/2011 20:00
145.05
6/21/2011 21:00
71.04
6/21/2011 22:00
252.39
6/21/2011 23:00
32.93
Docket No. ER11-1844
Exhibit No. NYI-4
Page 43 of 375
6/22/2011 0:00
232.54
6/22/2011 1:00
36.83
6/22/2011 2:00
-24.52
6/22/2011 3:00
35.10
6/22/2011 4:00
30.05
6/22/2011 5:00
122.86
6/22/2011 6:00
224.94
6/22/2011 7:00
0.27
6/22/2011 8:00
-158.81
6/22/2011 9:00
-168.02
6/22/2011 10:00
-18.60
6/22/2011 11:00
188.81
6/22/2011 12:00
-168.98
6/22/2011 13:00
-106.22
6/22/2011 14:00
-332.91
6/22/2011 15:00
-252.20
6/22/2011 16:00
-233.79
6/22/2011 17:00
-306.24
6/22/2011 18:00
-164.82
6/22/2011 19:00
37.22
6/22/2011 20:00
130.75
6/22/2011 21:00
362.98
6/22/2011 22:00
322.62
6/22/2011 23:00
268.40
6/23/2011 0:00
357.61
6/23/2011 1:00
411.09
6/23/2011 2:00
272.13
6/23/2011 3:00
282.40
6/23/2011 4:00
156.22
6/23/2011 5:00
170.73
6/23/2011 6:00
216.95
6/23/2011 7:00
119.69
6/23/2011 8:00
10.64
6/23/2011 9:00
8.19
6/23/2011 10:00
71.62
6/23/2011 11:00
265.93
6/23/2011 12:00
373.50
6/23/2011 13:00
543.76
6/23/2011 14:00
333.06
6/23/2011 15:00
250.18
6/23/2011 16:00
261.75
6/23/2011 17:00
311.88
6/23/2011 18:00
298.63
6/23/2011 19:00
153.21
6/23/2011 20:00
215.43
6/23/2011 21:00
60.27
6/23/2011 22:00
202.51
Docket No. ER11-1844
Exhibit No. NYI-4
Page 44 of 375
6/23/2011 23:00
185.07
6/24/2011 0:00
247.48
6/24/2011 1:00
276.83
6/24/2011 2:00
321.46
6/24/2011 3:00
324.50
6/24/2011 4:00
306.89
6/24/2011 5:00
170.00
6/24/2011 6:00
289.33
6/24/2011 7:00
182.30
6/24/2011 8:00
183.80
6/24/2011 9:00
224.25
6/24/2011 10:00
275.58
6/24/2011 11:00
249.11
6/24/2011 12:00
278.15
6/24/2011 13:00
380.47
6/24/2011 14:00
143.56
6/24/2011 15:00
234.50
6/24/2011 16:00
322.77
6/24/2011 17:00
402.17
6/24/2011 18:00
261.70
6/24/2011 19:00
393.25
6/24/2011 20:00
281.08
6/24/2011 21:00
269.14
6/24/2011 22:00
420.67
6/24/2011 23:00
339.29
6/25/2011 0:00
362.18
6/25/2011 1:00
409.13
6/25/2011 2:00
374.94
6/25/2011 3:00
505.72
6/25/2011 4:00
357.67
6/25/2011 5:00
463.86
6/25/2011 6:00
204.89
6/25/2011 7:00
412.37
6/25/2011 8:00
297.81
6/25/2011 9:00
299.38
6/25/2011 10:00
207.30
6/25/2011 11:00
195.89
6/25/2011 12:00
177.82
6/25/2011 13:00
142.26
6/25/2011 14:00
130.65
6/25/2011 15:00
56.71
6/25/2011 16:00
39.31
6/25/2011 17:00
43.15
6/25/2011 18:00
56.98
6/25/2011 19:00
28.78
6/25/2011 20:00
169.62
6/25/2011 21:00
52.06
Docket No. ER11-1844
Exhibit No. NYI-4
Page 45 of 375
6/25/2011 22:00
231.37
6/25/2011 23:00
305.95
6/26/2011 0:00
219.24
6/26/2011 1:00
351.31
6/26/2011 2:00
375.45
6/26/2011 3:00
337.29
6/26/2011 4:00
364.56
6/26/2011 5:00
417.88
6/26/2011 6:00
426.55
6/26/2011 7:00
455.25
6/26/2011 8:00
276.04
6/26/2011 9:00
336.25
6/26/2011 10:00
281.10
6/26/2011 11:00
-4.89
6/26/2011 12:00
-178.10
6/26/2011 13:00
-167.71
6/26/2011 14:00
17.28
6/26/2011 15:00
-112.24
6/26/2011 16:00
-158.08
6/26/2011 17:00
-121.79
6/26/2011 18:00
56.15
6/26/2011 19:00
27.31
6/26/2011 20:00
111.05
6/26/2011 21:00
109.60
6/26/2011 22:00
333.53
6/26/2011 23:00
387.22
6/27/2011 0:00
457.42
6/27/2011 1:00
372.69
6/27/2011 2:00
411.84
6/27/2011 3:00
266.35
6/27/2011 4:00
301.30
6/27/2011 5:00
233.94
6/27/2011 6:00
300.95
6/27/2011 7:00
102.40
6/27/2011 8:00
142.69
6/27/2011 9:00
129.68
6/27/2011 10:00
90.79
6/27/2011 11:00
-31.59
6/27/2011 12:00
41.44
6/27/2011 13:00
-34.68
6/27/2011 14:00
-71.91
6/27/2011 15:00
-91.84
6/27/2011 16:00
18.79
6/27/2011 17:00
127.16
6/27/2011 18:00
15.26
6/27/2011 19:00
135.05
6/27/2011 20:00
98.64
Docket No. ER11-1844
Exhibit No. NYI-4
Page 46 of 375
6/27/2011 21:00
-110.43
6/27/2011 22:00
-158.25
6/27/2011 23:00
76.12
6/28/2011 0:00
186.26
6/28/2011 1:00
276.51
6/28/2011 2:00
377.26
6/28/2011 3:00
304.75
6/28/2011 4:00
302.26
6/28/2011 5:00
344.71
6/28/2011 6:00
385.42
6/28/2011 7:00
10.52
6/28/2011 8:00
-189.37
6/28/2011 9:00
-250.73
6/28/2011 10:00
-278.56
6/28/2011 11:00
-163.74
6/28/2011 12:00
-63.75
6/28/2011 13:00
-92.52
6/28/2011 14:00
-104.05
6/28/2011 15:00
45.46
6/28/2011 16:00
132.05
6/28/2011 17:00
303.12
6/28/2011 18:00
372.73
6/28/2011 19:00
353.33
6/28/2011 20:00
567.72
6/28/2011 21:00
561.10
6/28/2011 22:00
566.12
6/28/2011 23:00
359.00
6/29/2011 0:00
362.97
6/29/2011 1:00
248.59
6/29/2011 2:00
176.61
6/29/2011 3:00
108.05
6/29/2011 4:00
126.58
6/29/2011 5:00
153.99
6/29/2011 6:00
286.42
6/29/2011 7:00
159.74
6/29/2011 8:00
51.53
6/29/2011 9:00
142.56
6/29/2011 10:00
271.55
6/29/2011 11:00
420.89
6/29/2011 12:00
567.75
6/29/2011 13:00
158.88
6/29/2011 14:00
173.05
6/29/2011 15:00
305.33
6/29/2011 16:00
205.16
6/29/2011 17:00
366.14
6/29/2011 18:00
246.14
6/29/2011 19:00
234.32
Docket No. ER11-1844
Exhibit No. NYI-4
Page 47 of 375
6/29/2011 20:00
231.32
6/29/2011 21:00
44.25
6/29/2011 22:00
202.94
6/29/2011 23:00
336.26
6/30/2011 0:00
404.10
6/30/2011 1:00
383.22
6/30/2011 2:00
252.83
6/30/2011 3:00
189.87
6/30/2011 4:00
162.29
6/30/2011 5:00
187.31
6/30/2011 6:00
549.79
6/30/2011 7:00
409.16
6/30/2011 8:00
87.74
6/30/2011 9:00
216.17
6/30/2011 10:00
11.98
6/30/2011 11:00
-63.09
6/30/2011 12:00
0.59
6/30/2011 13:00
-18.02
6/30/2011 14:00
226.87
6/30/2011 15:00
141.63
6/30/2011 16:00
150.89
6/30/2011 17:00
102.52
6/30/2011 18:00
335.85
6/30/2011 19:00
152.53
6/30/2011 20:00
200.30
6/30/2011 21:00
174.45
6/30/2011 22:00
245.05
6/30/2011 23:00
257.24
7/1/2011 0:00
302.41
7/1/2011 1:00
389.42
7/1/2011 2:00
148.89
7/1/2011 3:00
68.64
7/1/2011 4:00
92.73
7/1/2011 5:00
211.63
7/1/2011 6:00
136.01
7/1/2011 7:00
81.70
7/1/2011 8:00
54.69
7/1/2011 9:00
123.00
7/1/2011 10:00
263.45
7/1/2011 11:00
481.36
7/1/2011 12:00
573.28
7/1/2011 13:00
502.60
7/1/2011 14:00
331.22
7/1/2011 15:00
298.26
7/1/2011 16:00
231.42
7/1/2011 17:00
285.61
7/1/2011 18:00
368.95
Docket No. ER11-1844
Exhibit No. NYI-4
Page 48 of 375
7/1/2011 19:00
390.67
7/1/2011 20:00
554.15
7/1/2011 21:00
572.21
7/1/2011 22:00
307.48
7/1/2011 23:00
226.52
7/2/2011 0:00
167.82
7/2/2011 1:00
91.02
7/2/2011 2:00
73.61
7/2/2011 3:00
348.68
7/2/2011 4:00
238.90
7/2/2011 5:00
95.50
7/2/2011 6:00
60.87
7/2/2011 7:00
-149.91
7/2/2011 8:00
333.60
7/2/2011 9:00
32.11
7/2/2011 10:00
82.85
7/2/2011 11:00
281.49
7/2/2011 12:00
307.12
7/2/2011 13:00
222.91
7/2/2011 14:00
337.66
7/2/2011 15:00
218.24
7/2/2011 16:00
273.96
7/2/2011 17:00
400.43
7/2/2011 18:00
337.23
7/2/2011 19:00
489.46
7/2/2011 20:00
403.85
7/2/2011 21:00
390.08
7/2/2011 22:00
366.92
7/2/2011 23:00
333.16
7/3/2011 0:00
33.34
7/3/2011 1:00
95.72
7/3/2011 2:00
171.39
7/3/2011 3:00
256.07
7/3/2011 4:00
278.29
7/3/2011 5:00
271.99
7/3/2011 6:00
288.91
7/3/2011 7:00
266.43
7/3/2011 8:00
470.95
7/3/2011 9:00
61.44
7/3/2011 10:00
-145.62
7/3/2011 11:00
-195.25
7/3/2011 12:00
-183.95
7/3/2011 13:00
-291.72
7/3/2011 14:00
-338.10
7/3/2011 15:00
171.69
7/3/2011 16:00
348.77
7/3/2011 17:00
408.45
Docket No. ER11-1844
Exhibit No. NYI-4
Page 49 of 375
7/3/2011 18:00
191.26
7/3/2011 19:00
260.19
7/3/2011 20:00
213.31
7/3/2011 21:00
193.71
7/3/2011 22:00
16.40
7/3/2011 23:00
41.44
7/4/2011 0:00
32.64
7/4/2011 1:00
24.34
7/4/2011 2:00
-79.76
7/4/2011 3:00
21.11
7/4/2011 4:00
62.51
7/4/2011 5:00
-113.29
7/4/2011 6:00
-88.26
7/4/2011 7:00
185.88
7/4/2011 8:00
126.82
7/4/2011 9:00
-150.55
7/4/2011 10:00
-23.25
7/4/2011 11:00
111.33
7/4/2011 12:00
107.13
7/4/2011 13:00
166.82
7/4/2011 14:00
146.39
7/4/2011 15:00
345.61
7/4/2011 16:00
569.43
7/4/2011 17:00
395.37
7/4/2011 18:00
271.59
7/4/2011 19:00
217.81
7/4/2011 20:00
354.29
7/4/2011 21:00
305.88
7/4/2011 22:00
216.67
7/4/2011 23:00
32.85
7/5/2011 0:00
158.58
7/5/2011 1:00
280.36
7/5/2011 2:00
159.54
7/5/2011 3:00
39.65
7/5/2011 4:00
-16.37
7/5/2011 5:00
256.94
7/5/2011 6:00
343.83
7/5/2011 7:00
46.25
7/5/2011 8:00
-44.13
7/5/2011 9:00
-78.23
7/5/2011 10:00
-44.03
7/5/2011 11:00
-110.38
7/5/2011 12:00
-9.54
7/5/2011 13:00
9.01
7/5/2011 14:00
214.94
7/5/2011 15:00
249.29
7/5/2011 16:00
172.46
Docket No. ER11-1844
Exhibit No. NYI-4
Page 50 of 375
7/5/2011 17:00
176.88
7/5/2011 18:00
313.58
7/5/2011 19:00
196.37
7/5/2011 20:00
221.87
7/5/2011 21:00
83.01
7/5/2011 22:00
121.23
7/5/2011 23:00
185.84
7/6/2011 0:00
-140.08
7/6/2011 1:00
13.04
7/6/2011 2:00
-203.13
7/6/2011 3:00
-200.26
7/6/2011 4:00
-162.08
7/6/2011 5:00
-1.22
7/6/2011 6:00
365.18
7/6/2011 7:00
139.78
7/6/2011 8:00
169.57
7/6/2011 9:00
271.02
7/6/2011 10:00
398.24
7/6/2011 11:00
372.92
7/6/2011 12:00
64.67
7/6/2011 13:00
119.01
7/6/2011 14:00
-55.02
7/6/2011 15:00
48.94
7/6/2011 16:00
109.76
7/6/2011 17:00
68.15
7/6/2011 18:00
191.45
7/6/2011 19:00
446.01
7/6/2011 20:00
554.23
7/6/2011 21:00
541.12
7/6/2011 22:00
474.74
7/6/2011 23:00
577.14
7/7/2011 0:00
329.00
7/7/2011 1:00
397.97
7/7/2011 2:00
466.25
7/7/2011 3:00
514.69
7/7/2011 4:00
581.63
7/7/2011 5:00
547.37
7/7/2011 6:00
517.46
7/7/2011 7:00
527.66
7/7/2011 8:00
491.93
7/7/2011 9:00
499.23
7/7/2011 10:00
333.22
7/7/2011 11:00
198.70
7/7/2011 12:00
305.90
7/7/2011 13:00
271.01
7/7/2011 14:00
429.84
7/7/2011 15:00
42.71
Docket No. ER11-1844
Exhibit No. NYI-4
Page 51 of 375
7/7/2011 16:00
-47.14
7/7/2011 17:00
156.58
7/7/2011 18:00
192.15
7/7/2011 19:00
579.01
7/7/2011 20:00
707.56
7/7/2011 21:00
509.67
7/7/2011 22:00
392.34
7/7/2011 23:00
261.09
7/8/2011 0:00
261.03
7/8/2011 1:00
145.66
7/8/2011 2:00
68.73
7/8/2011 3:00
69.88
7/8/2011 4:00
213.15
7/8/2011 5:00
138.84
7/8/2011 6:00
314.40
7/8/2011 7:00
198.95
7/8/2011 8:00
236.81
7/8/2011 9:00
105.74
7/8/2011 10:00
-52.24
7/8/2011 11:00
-44.68
7/8/2011 12:00
70.52
7/8/2011 13:00
176.55
7/8/2011 14:00
208.49
7/8/2011 15:00
298.15
7/8/2011 16:00
135.99
7/8/2011 17:00
396.00
7/8/2011 18:00
53.18
7/8/2011 19:00
178.11
7/8/2011 20:00
91.75
7/8/2011 21:00
292.25
7/8/2011 22:00
211.66
7/8/2011 23:00
188.53
7/9/2011 0:00
17.98
7/9/2011 1:00
-45.25
7/9/2011 2:00
25.70
7/9/2011 3:00
120.79
7/9/2011 4:00
13.98
7/9/2011 5:00
-40.41
7/9/2011 6:00
-134.24
7/9/2011 7:00
187.18
7/9/2011 8:00
194.75
7/9/2011 9:00
-15.82
7/9/2011 10:00
-111.96
7/9/2011 11:00
-50.72
7/9/2011 12:00
-90.05
7/9/2011 13:00
-144.40
7/9/2011 14:00
195.91
Docket No. ER11-1844
Exhibit No. NYI-4
Page 52 of 375
7/9/2011 15:00
168.26
7/9/2011 16:00
212.36
7/9/2011 17:00
285.64
7/9/2011 18:00
280.74
7/9/2011 19:00
307.79
7/9/2011 20:00
86.13
7/9/2011 21:00
311.18
7/9/2011 22:00
230.63
7/9/2011 23:00
8.71
7/10/2011 0:00
53.25
7/10/2011 1:00
-125.39
7/10/2011 2:00
-112.10
7/10/2011 3:00
-116.49
7/10/2011 4:00
24.97
7/10/2011 5:00
30.44
7/10/2011 6:00
11.38
7/10/2011 7:00
-106.96
7/10/2011 8:00
19.08
7/10/2011 9:00
-326.17
7/10/2011 10:00
-387.66
7/10/2011 11:00
-182.83
7/10/2011 12:00
24.36
7/10/2011 13:00
77.22
7/10/2011 14:00
139.19
7/10/2011 15:00
22.14
7/10/2011 16:00
-109.13
7/10/2011 17:00
-124.81
7/10/2011 18:00
-19.46
7/10/2011 19:00
126.67
7/10/2011 20:00
270.23
7/10/2011 21:00
163.56
7/10/2011 22:00
114.41
7/10/2011 23:00
-114.76
7/11/2011 0:00
94.65
7/11/2011 1:00
120.06
7/11/2011 2:00
140.29
7/11/2011 3:00
106.81
7/11/2011 4:00
260.31
7/11/2011 5:00
175.40
7/11/2011 6:00
173.81
7/11/2011 7:00
247.00
7/11/2011 8:00
181.45
7/11/2011 9:00
59.90
7/11/2011 10:00
4.82
7/11/2011 11:00
299.46
7/11/2011 12:00
173.70
7/11/2011 13:00
385.33
Docket No. ER11-1844
Exhibit No. NYI-4
Page 53 of 375
7/11/2011 14:00
264.99
7/11/2011 15:00
393.44
7/11/2011 16:00
197.56
7/11/2011 17:00
153.63
7/11/2011 18:00
262.06
7/11/2011 19:00
286.97
7/11/2011 20:00
410.52
7/11/2011 21:00
371.12
7/11/2011 22:00
279.07
7/11/2011 23:00
315.59
7/12/2011 0:00
287.18
7/12/2011 1:00
406.03
7/12/2011 2:00
299.70
7/12/2011 3:00
305.74
7/12/2011 4:00
313.84
7/12/2011 5:00
289.97
7/12/2011 6:00
54.85
7/12/2011 7:00
-182.16
7/12/2011 8:00
-142.11
7/12/2011 9:00
-176.38
7/12/2011 10:00
-280.77
7/12/2011 11:00
-559.67
7/12/2011 12:00
-401.96
7/12/2011 13:00
-279.19
7/12/2011 14:00
-539.89
7/12/2011 15:00
-570.20
7/12/2011 16:00
-421.49
7/12/2011 17:00
-443.76
7/12/2011 18:00
-282.12
7/12/2011 19:00
73.98
7/12/2011 20:00
131.24
7/12/2011 21:00
85.13
7/12/2011 22:00
31.97
7/12/2011 23:00
-14.58
7/13/2011 0:00
-30.22
7/13/2011 1:00
148.60
7/13/2011 2:00
108.13
7/13/2011 3:00
92.54
7/13/2011 4:00
118.91
7/13/2011 5:00
107.46
7/13/2011 6:00
100.42
7/13/2011 7:00
10.90
7/13/2011 8:00
124.68
7/13/2011 9:00
52.35
7/13/2011 10:00
-92.88
7/13/2011 11:00
-121.92
7/13/2011 12:00
-187.29
Docket No. ER11-1844
Exhibit No. NYI-4
Page 54 of 375
7/13/2011 13:00
-179.43
7/13/2011 14:00
19.91
7/13/2011 15:00
-64.51
7/13/2011 16:00
-24.76
7/13/2011 17:00
5.46
7/13/2011 18:00
221.58
7/13/2011 19:00
369.15
7/13/2011 20:00
307.75
7/13/2011 21:00
246.79
7/13/2011 22:00
252.51
7/13/2011 23:00
219.59
7/14/2011 0:00
368.99
7/14/2011 1:00
483.24
7/14/2011 2:00
228.68
7/14/2011 3:00
276.97
7/14/2011 4:00
85.81
7/14/2011 5:00
275.85
7/14/2011 6:00
392.13
7/14/2011 7:00
205.92
7/14/2011 8:00
333.09
7/14/2011 9:00
247.15
7/14/2011 10:00
180.13
7/14/2011 11:00
149.53
7/14/2011 12:00
260.02
7/14/2011 13:00
120.44
7/14/2011 14:00
437.39
7/14/2011 15:00
523.67
7/14/2011 16:00
545.15
7/14/2011 17:00
289.29
7/14/2011 18:00
195.45
7/14/2011 19:00
138.10
7/14/2011 20:00
343.06
7/14/2011 21:00
656.77
7/14/2011 22:00
451.29
7/14/2011 23:00
217.74
7/15/2011 0:00
200.91
7/15/2011 1:00
174.35
7/15/2011 2:00
-77.05
7/15/2011 3:00
-60.60
7/15/2011 4:00
59.76
7/15/2011 5:00
-0.75
7/15/2011 6:00
268.39
7/15/2011 7:00
198.10
7/15/2011 8:00
28.78
7/15/2011 9:00
-157.29
7/15/2011 10:00
-226.53
7/15/2011 11:00
-99.96
Docket No. ER11-1844
Exhibit No. NYI-4
Page 55 of 375
7/15/2011 12:00
65.76
7/15/2011 13:00
45.39
7/15/2011 14:00
-114.00
7/15/2011 15:00
-292.90
7/15/2011 16:00
-129.15
7/15/2011 17:00
-282.38
7/15/2011 18:00
8.37
7/15/2011 19:00
40.48
7/15/2011 20:00
130.32
7/15/2011 21:00
-127.22
7/15/2011 22:00
-75.43
7/15/2011 23:00
9.29
7/16/2011 0:00
66.19
7/16/2011 1:00
195.80
7/16/2011 2:00
148.85
7/16/2011 3:00
169.88
7/16/2011 4:00
165.76
7/16/2011 5:00
241.65
7/16/2011 6:00
194.22
7/16/2011 7:00
329.33
7/16/2011 8:00
161.90
7/16/2011 9:00
-99.72
7/16/2011 10:00
-186.03
7/16/2011 11:00
-212.91
7/16/2011 12:00
-225.55
7/16/2011 13:00
-190.72
7/16/2011 14:00
-114.84
7/16/2011 15:00
-142.77
7/16/2011 16:00
-192.47
7/16/2011 17:00
-156.93
7/16/2011 18:00
77.98
7/16/2011 19:00
91.21
7/16/2011 20:00
243.74
7/16/2011 21:00
184.13
7/16/2011 22:00
-51.65
7/16/2011 23:00
-36.39
7/17/2011 0:00
-165.29
7/17/2011 1:00
-44.79
7/17/2011 2:00
30.24
7/17/2011 3:00
12.80
7/17/2011 4:00
-58.58
7/17/2011 5:00
5.52
7/17/2011 6:00
-45.34
7/17/2011 7:00
20.48
7/17/2011 8:00
-92.85
7/17/2011 9:00
-424.56
7/17/2011 10:00
-493.60
Docket No. ER11-1844
Exhibit No. NYI-4
Page 56 of 375
7/17/2011 11:00
-558.57
7/17/2011 12:00
-315.34
7/17/2011 13:00
-368.61
7/17/2011 14:00
-372.27
7/17/2011 15:00
-463.00
7/17/2011 16:00
-410.61
7/17/2011 17:00
-237.05
7/17/2011 18:00
-107.94
7/17/2011 19:00
100.78
7/17/2011 20:00
-116.49
7/17/2011 21:00
-599.99
7/17/2011 22:00
-444.27
7/17/2011 23:00
-532.64
7/18/2011 0:00
-19.54
7/18/2011 1:00
-45.39
7/18/2011 2:00
-26.87
7/18/2011 3:00
65.81
7/18/2011 4:00
129.58
7/18/2011 5:00
43.78
7/18/2011 6:00
118.00
7/18/2011 7:00
98.01
7/18/2011 8:00
123.48
7/18/2011 9:00
14.77
7/18/2011 10:00
-90.58
7/18/2011 11:00
-114.33
7/18/2011 12:00
-49.44
7/18/2011 13:00
-31.77
7/18/2011 14:00
-10.35
7/18/2011 15:00
250.63
7/18/2011 16:00
333.91
7/18/2011 17:00
473.60
7/18/2011 18:00
391.17
7/18/2011 19:00
441.64
7/18/2011 20:00
501.14
7/18/2011 21:00
155.20
7/18/2011 22:00
79.45
7/18/2011 23:00
186.61
7/19/2011 0:00
406.32
7/19/2011 1:00
297.50
7/19/2011 2:00
190.12
7/19/2011 3:00
171.80
7/19/2011 4:00
176.23
7/19/2011 5:00
69.41
7/19/2011 6:00
335.40
7/19/2011 7:00
313.56
7/19/2011 8:00
423.27
7/19/2011 9:00
378.88
Docket No. ER11-1844
Exhibit No. NYI-4
Page 57 of 375
7/19/2011 10:00
261.98
7/19/2011 11:00
442.79
7/19/2011 12:00
149.89
7/19/2011 13:00
-174.09
7/19/2011 14:00
-368.94
7/19/2011 15:00
-192.88
7/19/2011 16:00
-106.15
7/19/2011 17:00
-30.81
7/19/2011 18:00
-10.68
7/19/2011 19:00
91.28
7/19/2011 20:00
257.60
7/19/2011 21:00
306.90
7/19/2011 22:00
76.38
7/19/2011 23:00
68.54
7/20/2011 0:00
76.92
7/20/2011 1:00
-50.12
7/20/2011 2:00
-227.02
7/20/2011 3:00
-183.72
7/20/2011 4:00
-226.21
7/20/2011 5:00
-178.56
7/20/2011 6:00
-255.00
7/20/2011 7:00
79.54
7/20/2011 8:00
160.14
7/20/2011 9:00
308.24
7/20/2011 10:00
101.45
7/20/2011 11:00
134.91
7/20/2011 12:00
-22.37
7/20/2011 13:00
-468.21
7/20/2011 14:00
-528.08
7/20/2011 15:00
-434.87
7/20/2011 16:00
-243.60
7/20/2011 17:00
-178.72
7/20/2011 18:00
57.29
7/20/2011 19:00
169.79
7/20/2011 20:00
321.05
7/20/2011 21:00
190.11
7/20/2011 22:00
462.98
7/20/2011 23:00
179.97
7/21/2011 0:00
-229.47
7/21/2011 1:00
-205.96
7/21/2011 2:00
-377.03
7/21/2011 3:00
-304.49
7/21/2011 4:00
-262.75
7/21/2011 5:00
-307.05
7/21/2011 6:00
-266.93
7/21/2011 7:00
-175.37
7/21/2011 8:00
-369.25
Docket No. ER11-1844
Exhibit No. NYI-4
Page 58 of 375
7/21/2011 9:00
-495.20
7/21/2011 10:00
-238.70
7/21/2011 11:00
-48.93
7/21/2011 12:00
239.69
7/21/2011 13:00
1.29
7/21/2011 14:00
-44.90
7/21/2011 15:00
11.71
7/21/2011 16:00
25.35
7/21/2011 17:00
-8.66
7/21/2011 18:00
231.57
7/21/2011 19:00
73.89
7/21/2011 20:00
159.99
7/21/2011 21:00
368.82
7/21/2011 22:00
150.71
7/21/2011 23:00
-193.11
7/22/2011 0:00
-365.15
7/22/2011 1:00
-282.68
7/22/2011 2:00
-141.99
7/22/2011 3:00
-130.89
7/22/2011 4:00
-81.56
7/22/2011 5:00
-205.10
7/22/2011 6:00
-190.99
7/22/2011 7:00
-121.66
7/22/2011 8:00
105.82
7/22/2011 9:00
236.09
7/22/2011 10:00
582.36
7/22/2011 11:00
541.43
7/22/2011 12:00
778.19
7/22/2011 13:00
505.49
7/22/2011 14:00
528.00
7/22/2011 15:00
709.23
7/22/2011 16:00
529.28
7/22/2011 17:00
230.55
7/22/2011 18:00
410.95
7/22/2011 19:00
501.16
7/22/2011 20:00
606.95
7/22/2011 21:00
581.76
7/22/2011 22:00
471.88
7/22/2011 23:00
405.76
7/23/2011 0:00
350.69
7/23/2011 1:00
391.43
7/23/2011 2:00
351.35
7/23/2011 3:00
300.94
7/23/2011 4:00
326.93
7/23/2011 5:00
255.36
7/23/2011 6:00
119.13
7/23/2011 7:00
167.39
Docket No. ER11-1844
Exhibit No. NYI-4
Page 59 of 375
7/23/2011 8:00
13.28
7/23/2011 9:00
77.21
7/23/2011 10:00
415.91
7/23/2011 11:00
578.90
7/23/2011 12:00
499.53
7/23/2011 13:00
418.16
7/23/2011 14:00
346.83
7/23/2011 15:00
100.52
7/23/2011 16:00
133.61
7/23/2011 17:00
263.50
7/23/2011 18:00
214.63
7/23/2011 19:00
190.97
7/23/2011 20:00
82.30
7/23/2011 21:00
210.92
7/23/2011 22:00
199.45
7/23/2011 23:00
21.11
7/24/2011 0:00
185.23
7/24/2011 1:00
60.21
7/24/2011 2:00
-21.55
7/24/2011 3:00
22.20
7/24/2011 4:00
69.32
7/24/2011 5:00
-26.15
7/24/2011 6:00
77.33
7/24/2011 7:00
173.26
7/24/2011 8:00
25.00
7/24/2011 9:00
162.78
7/24/2011 10:00
74.27
7/24/2011 11:00
220.13
7/24/2011 12:00
175.90
7/24/2011 13:00
171.57
7/24/2011 14:00
219.63
7/24/2011 15:00
30.91
7/24/2011 16:00
-116.88
7/24/2011 17:00
-218.69
7/24/2011 18:00
-195.23
7/24/2011 19:00
33.57
7/24/2011 20:00
19.90
7/24/2011 21:00
-233.79
7/24/2011 22:00
9.94
7/24/2011 23:00
-261.22
7/25/2011 0:00
-181.25
7/25/2011 1:00
-235.87
7/25/2011 2:00
-275.64
7/25/2011 3:00
-92.11
7/25/2011 4:00
-34.25
7/25/2011 5:00
-32.79
7/25/2011 6:00
-144.75
Docket No. ER11-1844
Exhibit No. NYI-4
Page 60 of 375
7/25/2011 7:00
-113.44
7/25/2011 8:00
-256.50
7/25/2011 9:00
-115.13
7/25/2011 10:00
122.18
7/25/2011 11:00
130.84
7/25/2011 12:00
56.70
7/25/2011 13:00
42.20
7/25/2011 14:00
-158.89
7/25/2011 15:00
-226.88
7/25/2011 16:00
-189.79
7/25/2011 17:00
-340.54
7/25/2011 18:00
-169.99
7/25/2011 19:00
-54.44
7/25/2011 20:00
-116.43
7/25/2011 21:00
-187.24
7/25/2011 22:00
-48.98
7/25/2011 23:00
-9.20
7/26/2011 0:00
84.51
7/26/2011 1:00
-15.97
7/26/2011 2:00
-64.58
7/26/2011 3:00
186.82
7/26/2011 4:00
292.32
7/26/2011 5:00
6.51
7/26/2011 6:00
-182.52
7/26/2011 7:00
-85.95
7/26/2011 8:00
85.59
7/26/2011 9:00
88.61
7/26/2011 10:00
12.36
7/26/2011 11:00
-96.36
7/26/2011 12:00
-231.06
7/26/2011 13:00
-62.62
7/26/2011 14:00
-110.71
7/26/2011 15:00
69.21
7/26/2011 16:00
181.99
7/26/2011 17:00
354.29
7/26/2011 18:00
400.77
7/26/2011 19:00
591.12
7/26/2011 20:00
488.06
7/26/2011 21:00
318.46
7/26/2011 22:00
411.36
7/26/2011 23:00
211.35
7/27/2011 0:00
41.35
7/27/2011 1:00
-129.33
7/27/2011 2:00
7.24
7/27/2011 3:00
17.15
7/27/2011 4:00
86.01
7/27/2011 5:00
99.72
Docket No. ER11-1844
Exhibit No. NYI-4
Page 61 of 375
7/27/2011 6:00
106.12
7/27/2011 7:00
201.83
7/27/2011 8:00
420.38
7/27/2011 9:00
511.24
7/27/2011 10:00
623.62
7/27/2011 11:00
418.60
7/27/2011 12:00
471.26
7/27/2011 13:00
246.46
7/27/2011 14:00
76.27
7/27/2011 15:00
54.69
7/27/2011 16:00
-121.25
7/27/2011 17:00
-214.23
7/27/2011 18:00
111.99
7/27/2011 19:00
165.48
7/27/2011 20:00
215.80
7/27/2011 21:00
259.77
7/27/2011 22:00
-11.06
7/27/2011 23:00
-307.64
7/28/2011 0:00
13.83
7/28/2011 1:00
-166.52
7/28/2011 2:00
-202.63
7/28/2011 3:00
-253.80
7/28/2011 4:00
-331.59
7/28/2011 5:00
-153.68
7/28/2011 6:00
-377.67
7/28/2011 7:00
-335.38
7/28/2011 8:00
-75.03
7/28/2011 9:00
-17.02
7/28/2011 10:00
-19.29
7/28/2011 11:00
-149.89
7/28/2011 12:00
-228.75
7/28/2011 13:00
-385.95
7/28/2011 14:00
-443.47
7/28/2011 15:00
-761.19
7/28/2011 16:00
-918.53
7/28/2011 17:00
-967.87
7/28/2011 18:00
-890.77
7/28/2011 19:00
-575.57
7/28/2011 20:00
-538.21
7/28/2011 21:00
-532.09
7/28/2011 22:00
-714.83
7/28/2011 23:00
-657.54
7/29/2011 0:00
-400.42
7/29/2011 1:00
-245.36
7/29/2011 2:00
-257.64
7/29/2011 3:00
-488.75
7/29/2011 4:00
-462.20
Docket No. ER11-1844
Exhibit No. NYI-4
Page 62 of 375
7/29/2011 5:00
-246.01
7/29/2011 6:00
-531.26
7/29/2011 7:00
-415.41
7/29/2011 8:00
-82.00
7/29/2011 9:00
137.83
7/29/2011 10:00
-208.57
7/29/2011 11:00
-555.84
7/29/2011 12:00
-415.19
7/29/2011 13:00
-515.83
7/29/2011 14:00
-607.06
7/29/2011 15:00
-567.57
7/29/2011 16:00
-439.76
7/29/2011 17:00
-328.71
7/29/2011 18:00
-368.93
7/29/2011 19:00
-188.84
7/29/2011 20:00
-268.31
7/29/2011 21:00
-299.27
7/29/2011 22:00
-571.26
7/29/2011 23:00
-428.72
7/30/2011 0:00
-186.96
7/30/2011 1:00
-235.93
7/30/2011 2:00
-216.92
7/30/2011 3:00
-85.33
7/30/2011 4:00
20.74
7/30/2011 5:00
-54.66
7/30/2011 6:00
162.76
7/30/2011 7:00
185.18
7/30/2011 8:00
-213.58
7/30/2011 9:00
-253.81
7/30/2011 10:00
-116.74
7/30/2011 11:00
-162.48
7/30/2011 12:00
-325.40
7/30/2011 13:00
-32.55
7/30/2011 14:00
-63.54
7/30/2011 15:00
24.46
7/30/2011 16:00
157.46
7/30/2011 17:00
68.94
7/30/2011 18:00
-82.73
7/30/2011 19:00
-49.71
7/30/2011 20:00
-43.64
7/30/2011 21:00
65.68
7/30/2011 22:00
-88.35
7/30/2011 23:00
-420.36
7/31/2011 0:00
-411.48
7/31/2011 1:00
-206.19
7/31/2011 2:00
1.93
7/31/2011 3:00
54.58
Docket No. ER11-1844
Exhibit No. NYI-4
Page 63 of 375
7/31/2011 4:00
236.97
7/31/2011 5:00
252.54
7/31/2011 6:00
142.66
7/31/2011 7:00
-17.79
7/31/2011 8:00
152.69
7/31/2011 9:00
116.60
7/31/2011 10:00
223.40
7/31/2011 11:00
168.85
7/31/2011 12:00
285.73
7/31/2011 13:00
98.25
7/31/2011 14:00
-35.57
7/31/2011 15:00
-103.75
7/31/2011 16:00
-144.10
7/31/2011 17:00
-89.52
7/31/2011 18:00
-69.02
7/31/2011 19:00
-99.96
7/31/2011 20:00
-106.35
7/31/2011 21:00
-50.56
7/31/2011 22:00
-227.84
7/31/2011 23:00
-507.06
8/1/2011 0:00
-422.55
8/1/2011 1:00
-382.07
8/1/2011 2:00
-290.67
8/1/2011 3:00
-123.52
8/1/2011 4:00
-140.83
8/1/2011 5:00
-151.06
8/1/2011 6:00
-134.89
8/1/2011 7:00
-135.40
8/1/2011 8:00
-179.04
8/1/2011 9:00
-299.71
8/1/2011 10:00
4.92
8/1/2011 11:00
276.01
8/1/2011 12:00
324.11
8/1/2011 13:00
-22.75
8/1/2011 14:00
99.51
8/1/2011 15:00
164.92
8/1/2011 16:00
161.45
8/1/2011 17:00
173.87
8/1/2011 18:00
72.12
8/1/2011 19:00
-5.40
8/1/2011 20:00
56.33
8/1/2011 21:00
-85.19
8/1/2011 22:00
66.50
8/1/2011 23:00
-172.13
8/2/2011 0:00
66.79
8/2/2011 1:00
-175.02
8/2/2011 2:00
-162.47
Docket No. ER11-1844
Exhibit No. NYI-4
Page 64 of 375
8/2/2011 3:00
-162.35
8/2/2011 4:00
-199.49
8/2/2011 5:00
-187.27
8/2/2011 6:00
-227.18
8/2/2011 7:00
-27.03
8/2/2011 8:00
52.52
8/2/2011 9:00
200.28
8/2/2011 10:00
167.59
8/2/2011 11:00
-58.49
8/2/2011 12:00
14.89
8/2/2011 13:00
-110.11
8/2/2011 14:00
-403.88
8/2/2011 15:00
-547.35
8/2/2011 16:00
-426.95
8/2/2011 17:00
-488.59
8/2/2011 18:00
-269.76
8/2/2011 19:00
-48.83
8/2/2011 20:00
-3.28
8/2/2011 21:00
-106.96
8/2/2011 22:00
-145.01
8/2/2011 23:00
-128.30
8/3/2011 0:00
-110.44
8/3/2011 1:00
69.43
8/3/2011 2:00
66.98
8/3/2011 3:00
66.41
8/3/2011 4:00
20.98
8/3/2011 5:00
-41.77
8/3/2011 6:00
-149.22
8/3/2011 7:00
-44.75
8/3/2011 8:00
-68.58
8/3/2011 9:00
62.60
8/3/2011 10:00
89.56
8/3/2011 11:00
100.87
8/3/2011 12:00
72.89
8/3/2011 13:00
77.26
8/3/2011 14:00
-21.10
8/3/2011 15:00
-438.96
8/3/2011 16:00
-787.12
8/3/2011 17:00
-980.05
8/3/2011 18:00
-618.36
8/3/2011 19:00
-423.73
8/3/2011 20:00
-151.12
8/3/2011 21:00
-147.69
8/3/2011 22:00
-121.80
8/3/2011 23:00
-218.68
8/4/2011 0:00
-61.85
8/4/2011 1:00
-117.74
Docket No. ER11-1844
Exhibit No. NYI-4
Page 65 of 375
8/4/2011 2:00
-54.52
8/4/2011 3:00
8.17
8/4/2011 4:00
10.24
8/4/2011 5:00
78.40
8/4/2011 6:00
27.77
8/4/2011 7:00
142.52
8/4/2011 8:00
-21.39
8/4/2011 9:00
-128.08
8/4/2011 10:00
-172.91
8/4/2011 11:00
-285.39
8/4/2011 12:00
-569.19
8/4/2011 13:00
-232.91
8/4/2011 14:00
-201.00
8/4/2011 15:00
-379.79
8/4/2011 16:00
-516.40
8/4/2011 17:00
-544.48
8/4/2011 18:00
-432.84
8/4/2011 19:00
-521.83
8/4/2011 20:00
-336.88
8/4/2011 21:00
-80.81
8/4/2011 22:00
-114.17
8/4/2011 23:00
-4.79
8/5/2011 0:00
59.47
8/5/2011 1:00
170.62
8/5/2011 2:00
101.33
8/5/2011 3:00
85.41
8/5/2011 4:00
155.08
8/5/2011 5:00
257.15
8/5/2011 6:00
27.43
8/5/2011 7:00
-85.06
8/5/2011 8:00
-99.81
8/5/2011 9:00
-92.95
8/5/2011 10:00
-134.18
8/5/2011 11:00
-238.75
8/5/2011 12:00
-43.14
8/5/2011 13:00
-207.58
8/5/2011 14:00
-289.44
8/5/2011 15:00
-227.97
8/5/2011 16:00
-456.49
8/5/2011 17:00
-283.38
8/5/2011 18:00
-216.33
8/5/2011 19:00
-432.61
8/5/2011 20:00
-391.56
8/5/2011 21:00
-540.88
8/5/2011 22:00
-580.38
8/5/2011 23:00
-585.40
8/6/2011 0:00
-484.90
Docket No. ER11-1844
Exhibit No. NYI-4
Page 66 of 375
8/6/2011 1:00
-262.62
8/6/2011 2:00
-43.35
8/6/2011 3:00
-40.08
8/6/2011 4:00
27.93
8/6/2011 5:00
-2.55
8/6/2011 6:00
-312.59
8/6/2011 7:00
-174.31
8/6/2011 8:00
-259.51
8/6/2011 9:00
-381.60
8/6/2011 10:00
-281.76
8/6/2011 11:00
-331.30
8/6/2011 12:00
-361.95
8/6/2011 13:00
-294.81
8/6/2011 14:00
-204.55
8/6/2011 15:00
-186.78
8/6/2011 16:00
-199.03
8/6/2011 17:00
-259.64
8/6/2011 18:00
-124.49
8/6/2011 19:00
-130.13
8/6/2011 20:00
20.50
8/6/2011 21:00
-179.23
8/6/2011 22:00
-317.74
8/6/2011 23:00
-236.33
8/7/2011 0:00
-291.65
8/7/2011 1:00
-328.63
8/7/2011 2:00
-8.17
8/7/2011 3:00
115.49
8/7/2011 4:00
263.09
8/7/2011 5:00
209.19
8/7/2011 6:00
54.27
8/7/2011 7:00
201.72
8/7/2011 8:00
82.94
8/7/2011 9:00
-20.03
8/7/2011 10:00
234.64
8/7/2011 11:00
49.98
8/7/2011 12:00
81.50
8/7/2011 13:00
103.90
8/7/2011 14:00
164.22
8/7/2011 15:00
248.53
8/7/2011 16:00
479.59
8/7/2011 17:00
348.29
8/7/2011 18:00
137.71
8/7/2011 19:00
496.77
8/7/2011 20:00
538.27
8/7/2011 21:00
373.58
8/7/2011 22:00
555.79
8/7/2011 23:00
294.35
Docket No. ER11-1844
Exhibit No. NYI-4
Page 67 of 375
8/8/2011 0:00
188.70
8/8/2011 1:00
245.10
8/8/2011 2:00
242.98
8/8/2011 3:00
217.53
8/8/2011 4:00
222.20
8/8/2011 5:00
126.25
8/8/2011 6:00
113.94
8/8/2011 7:00
176.86
8/8/2011 8:00
204.42
8/8/2011 9:00
406.53
8/8/2011 10:00
245.43
8/8/2011 11:00
127.97
8/8/2011 12:00
-13.11
8/8/2011 13:00
-95.82
8/8/2011 14:00
-158.03
8/8/2011 15:00
84.58
8/8/2011 16:00
244.16
8/8/2011 17:00
280.85
8/8/2011 18:00
292.16
8/8/2011 19:00
120.76
8/8/2011 20:00
72.52
8/8/2011 21:00
96.57
8/8/2011 22:00
-213.85
8/8/2011 23:00
-340.71
8/9/2011 0:00
48.77
8/9/2011 1:00
-17.83
8/9/2011 2:00
122.31
8/9/2011 3:00
162.71
8/9/2011 4:00
-16.42
8/9/2011 5:00
-12.65
8/9/2011 6:00
176.21
8/9/2011 7:00
96.23
8/9/2011 8:00
125.28
8/9/2011 9:00
207.39
8/9/2011 10:00
197.57
8/9/2011 11:00
-69.84
8/9/2011 12:00
-215.28
8/9/2011 13:00
-234.37
8/9/2011 14:00
-116.14
8/9/2011 15:00
-136.59
8/9/2011 16:00
0.75
8/9/2011 17:00
182.57
8/9/2011 18:00
201.52
8/9/2011 19:00
229.72
8/9/2011 20:00
353.67
8/9/2011 21:00
299.37
8/9/2011 22:00
222.81
Docket No. ER11-1844
Exhibit No. NYI-4
Page 68 of 375
8/9/2011 23:00
175.83
8/10/2011 0:00
267.28
8/10/2011 1:00
142.85
8/10/2011 2:00
19.89
8/10/2011 3:00
-72.42
8/10/2011 4:00
92.83
8/10/2011 5:00
121.30
8/10/2011 6:00
64.87
8/10/2011 7:00
131.30
8/10/2011 8:00
259.51
8/10/2011 9:00
263.25
8/10/2011 10:00
64.14
8/10/2011 11:00
-14.17
8/10/2011 12:00
55.97
8/10/2011 13:00
25.80
8/10/2011 14:00
330.84
8/10/2011 15:00
544.07
8/10/2011 16:00
274.94
8/10/2011 17:00
454.11
8/10/2011 18:00
445.43
8/10/2011 19:00
357.58
8/10/2011 20:00
481.67
8/10/2011 21:00
499.44
8/10/2011 22:00
443.90
8/10/2011 23:00
305.53
8/11/2011 0:00
160.42
8/11/2011 1:00
371.72
8/11/2011 2:00
363.29
8/11/2011 3:00
273.03
8/11/2011 4:00
248.50
8/11/2011 5:00
351.37
8/11/2011 6:00
539.48
8/11/2011 7:00
342.04
8/11/2011 8:00
235.08
8/11/2011 9:00
265.96
8/11/2011 10:00
266.43
8/11/2011 11:00
323.41
8/11/2011 12:00
192.77
8/11/2011 13:00
70.20
8/11/2011 14:00
50.25
8/11/2011 15:00
-66.06
8/11/2011 16:00
-74.22
8/11/2011 17:00
31.03
8/11/2011 18:00
73.16
8/11/2011 19:00
272.43
8/11/2011 20:00
390.64
8/11/2011 21:00
363.06
Docket No. ER11-1844
Exhibit No. NYI-4
Page 69 of 375
8/11/2011 22:00
189.82
8/11/2011 23:00
63.31
8/12/2011 0:00
-41.41
8/12/2011 1:00
188.21
8/12/2011 2:00
215.88
8/12/2011 3:00
242.84
8/12/2011 4:00
232.42
8/12/2011 5:00
41.41
8/12/2011 6:00
228.36
8/12/2011 7:00
372.55
8/12/2011 8:00
89.20
8/12/2011 9:00
118.70
8/12/2011 10:00
-35.55
8/12/2011 11:00
-28.00
8/12/2011 12:00
108.13
8/12/2011 13:00
71.03
8/12/2011 14:00
-24.58
8/12/2011 15:00
134.47
8/12/2011 16:00
168.15
8/12/2011 17:00
19.29
8/12/2011 18:00
128.19
8/12/2011 19:00
10.60
8/12/2011 20:00
-21.12
8/12/2011 21:00
-72.62
8/12/2011 22:00
-139.15
8/12/2011 23:00
-145.82
8/13/2011 0:00
-42.15
8/13/2011 1:00
154.15
8/13/2011 2:00
152.15
8/13/2011 3:00
197.00
8/13/2011 4:00
204.56
8/13/2011 5:00
187.96
8/13/2011 6:00
68.11
8/13/2011 7:00
41.85
8/13/2011 8:00
275.34
8/13/2011 9:00
266.24
8/13/2011 10:00
147.51
8/13/2011 11:00
-71.85
8/13/2011 12:00
-125.59
8/13/2011 13:00
-182.96
8/13/2011 14:00
-273.75
8/13/2011 15:00
-111.05
8/13/2011 16:00
-232.30
8/13/2011 17:00
57.04
8/13/2011 18:00
51.97
8/13/2011 19:00
281.99
8/13/2011 20:00
319.99
Docket No. ER11-1844
Exhibit No. NYI-4
Page 70 of 375
8/13/2011 21:00
261.20
8/13/2011 22:00
301.87
8/13/2011 23:00
281.55
8/14/2011 0:00
306.83
8/14/2011 1:00
388.35
8/14/2011 2:00
306.37
8/14/2011 3:00
290.40
8/14/2011 4:00
302.41
8/14/2011 5:00
348.38
8/14/2011 6:00
57.14
8/14/2011 7:00
280.38
8/14/2011 8:00
441.79
8/14/2011 9:00
411.14
8/14/2011 10:00
371.40
8/14/2011 11:00
344.66
8/14/2011 12:00
177.67
8/14/2011 13:00
83.93
8/14/2011 14:00
-16.55
8/14/2011 15:00
-73.14
8/14/2011 16:00
-199.51
8/14/2011 17:00
-23.00
8/14/2011 18:00
162.33
8/14/2011 19:00
194.36
8/14/2011 20:00
290.98
8/14/2011 21:00
269.77
8/14/2011 22:00
378.00
8/14/2011 23:00
313.77
8/15/2011 0:00
105.42
8/15/2011 1:00
117.98
8/15/2011 2:00
163.54
8/15/2011 3:00
189.63
8/15/2011 4:00
299.28
8/15/2011 5:00
537.99
8/15/2011 6:00
405.67
8/15/2011 7:00
390.53
8/15/2011 8:00
304.65
8/15/2011 9:00
178.44
8/15/2011 10:00
254.94
8/15/2011 11:00
193.60
8/15/2011 12:00
140.36
8/15/2011 13:00
69.50
8/15/2011 14:00
-137.61
8/15/2011 15:00
9.86
8/15/2011 16:00
-62.09
8/15/2011 17:00
-250.87
8/15/2011 18:00
12.70
8/15/2011 19:00
131.81
Docket No. ER11-1844
Exhibit No. NYI-4
Page 71 of 375
8/15/2011 20:00
152.46
8/15/2011 21:00
94.86
8/15/2011 22:00
229.35
8/15/2011 23:00
251.73
8/16/2011 0:00
414.82
8/16/2011 1:00
532.01
8/16/2011 2:00
385.89
8/16/2011 3:00
371.34
8/16/2011 4:00
221.96
8/16/2011 5:00
190.23
8/16/2011 6:00
339.44
8/16/2011 7:00
171.95
8/16/2011 8:00
93.87
8/16/2011 9:00
178.81
8/16/2011 10:00
78.64
8/16/2011 11:00
34.59
8/16/2011 12:00
90.05
8/16/2011 13:00
-16.55
8/16/2011 14:00
75.30
8/16/2011 15:00
34.34
8/16/2011 16:00
63.19
8/16/2011 17:00
161.64
8/16/2011 18:00
231.96
8/16/2011 19:00
280.70
8/16/2011 20:00
180.97
8/16/2011 21:00
257.36
8/16/2011 22:00
253.53
8/16/2011 23:00
264.89
8/17/2011 0:00
154.75
8/17/2011 1:00
190.10
8/17/2011 2:00
345.50
8/17/2011 3:00
212.08
8/17/2011 4:00
397.29
8/17/2011 5:00
570.35
8/17/2011 6:00
410.63
8/17/2011 7:00
498.96
8/17/2011 8:00
500.19
8/17/2011 9:00
485.20
8/17/2011 10:00
383.25
8/17/2011 11:00
339.50
8/17/2011 12:00
27.71
8/17/2011 13:00
149.91
8/17/2011 14:00
232.30
8/17/2011 15:00
271.33
8/17/2011 16:00
240.93
8/17/2011 17:00
454.04
8/17/2011 18:00
443.43
Docket No. ER11-1844
Exhibit No. NYI-4
Page 72 of 375
8/17/2011 19:00
244.23
8/17/2011 20:00
272.14
8/17/2011 21:00
99.41
8/17/2011 22:00
68.79
8/17/2011 23:00
-49.36
8/18/2011 0:00
244.12
8/18/2011 1:00
225.69
8/18/2011 2:00
226.89
8/18/2011 3:00
231.79
8/18/2011 4:00
209.38
8/18/2011 5:00
204.07
8/18/2011 6:00
75.24
8/18/2011 7:00
58.99
8/18/2011 8:00
71.16
8/18/2011 9:00
-14.28
8/18/2011 10:00
-225.52
8/18/2011 11:00
-257.38
8/18/2011 12:00
-158.52
8/18/2011 13:00
-53.21
8/18/2011 14:00
27.59
8/18/2011 15:00
-18.87
8/18/2011 16:00
9.42
8/18/2011 17:00
115.51
8/18/2011 18:00
197.80
8/18/2011 19:00
154.62
8/18/2011 20:00
226.36
8/18/2011 21:00
149.42
8/18/2011 22:00
76.76
8/18/2011 23:00
-185.37
8/19/2011 0:00
46.01
8/19/2011 1:00
158.84
8/19/2011 2:00
208.54
8/19/2011 3:00
179.52
8/19/2011 4:00
167.83
8/19/2011 5:00
187.76
8/19/2011 6:00
109.36
8/19/2011 7:00
24.37
8/19/2011 8:00
-183.07
8/19/2011 9:00
-79.93
8/19/2011 10:00
-123.06
8/19/2011 11:00
-308.31
8/19/2011 12:00
-584.35
8/19/2011 13:00
-405.02
8/19/2011 14:00
37.45
8/19/2011 15:00
97.98
8/19/2011 16:00
111.86
8/19/2011 17:00
160.08
Docket No. ER11-1844
Exhibit No. NYI-4
Page 73 of 375
8/19/2011 18:00
-291.25
8/19/2011 19:00
-192.44
8/19/2011 20:00
-87.57
8/19/2011 21:00
-279.93
8/19/2011 22:00
-68.50
8/19/2011 23:00
-169.60
8/20/2011 0:00
-84.13
8/20/2011 1:00
-34.40
8/20/2011 2:00
103.59
8/20/2011 3:00
134.23
8/20/2011 4:00
69.98
8/20/2011 5:00
73.91
8/20/2011 6:00
-36.08
8/20/2011 7:00
-150.30
8/20/2011 8:00
-141.50
8/20/2011 9:00
-251.26
8/20/2011 10:00
-249.93
8/20/2011 11:00
-271.21
8/20/2011 12:00
-354.14
8/20/2011 13:00
-198.16
8/20/2011 14:00
42.10
8/20/2011 15:00
133.02
8/20/2011 16:00
150.29
8/20/2011 17:00
334.82
8/20/2011 18:00
309.55
8/20/2011 19:00
204.74
8/20/2011 20:00
333.18
8/20/2011 21:00
141.82
8/20/2011 22:00
386.38
8/20/2011 23:00
245.65
8/21/2011 0:00
39.92
8/21/2011 1:00
114.56
8/21/2011 2:00
78.59
8/21/2011 3:00
70.13
8/21/2011 4:00
101.54
8/21/2011 5:00
141.44
8/21/2011 6:00
244.33
8/21/2011 7:00
290.54
8/21/2011 8:00
249.07
8/21/2011 9:00
213.30
8/21/2011 10:00
229.46
8/21/2011 11:00
141.84
8/21/2011 12:00
282.62
8/21/2011 13:00
293.19
8/21/2011 14:00
455.69
8/21/2011 15:00
417.60
8/21/2011 16:00
305.94
Docket No. ER11-1844
Exhibit No. NYI-4
Page 74 of 375
8/21/2011 17:00
330.21
8/21/2011 18:00
137.16
8/21/2011 19:00
404.84
8/21/2011 20:00
207.63
8/21/2011 21:00
196.26
8/21/2011 22:00
208.20
8/21/2011 23:00
142.82
8/22/2011 0:00
252.45
8/22/2011 1:00
84.29
8/22/2011 2:00
90.76
8/22/2011 3:00
181.72
8/22/2011 4:00
192.26
8/22/2011 5:00
242.77
8/22/2011 6:00
178.26
8/22/2011 7:00
199.16
8/22/2011 8:00
221.24
8/22/2011 9:00
93.02
8/22/2011 10:00
214.48
8/22/2011 11:00
164.88
8/22/2011 12:00
119.88
8/22/2011 13:00
175.66
8/22/2011 14:00
190.44
8/22/2011 15:00
273.44
8/22/2011 16:00
307.73
8/22/2011 17:00
326.55
8/22/2011 18:00
360.92
8/22/2011 19:00
372.29
8/22/2011 20:00
345.04
8/22/2011 21:00
178.09
8/22/2011 22:00
199.87
8/22/2011 23:00
53.43
8/23/2011 0:00
127.47
8/23/2011 1:00
37.20
8/23/2011 2:00
-53.81
8/23/2011 3:00
52.72
8/23/2011 4:00
100.24
8/23/2011 5:00
34.24
8/23/2011 6:00
199.04
8/23/2011 7:00
118.04
8/23/2011 8:00
13.78
8/23/2011 9:00
-73.51
8/23/2011 10:00
-13.57
8/23/2011 11:00
8.50
8/23/2011 12:00
-38.39
8/23/2011 13:00
140.92
8/23/2011 14:00
94.12
8/23/2011 15:00
481.20
Docket No. ER11-1844
Exhibit No. NYI-4
Page 75 of 375
8/23/2011 16:00
578.81
8/23/2011 17:00
501.70
8/23/2011 18:00
487.30
8/23/2011 19:00
638.53
8/23/2011 20:00
535.91
8/23/2011 21:00
411.15
8/23/2011 22:00
408.27
8/23/2011 23:00
244.42
8/24/2011 0:00
101.75
8/24/2011 1:00
238.13
8/24/2011 2:00
79.61
8/24/2011 3:00
-61.23
8/24/2011 4:00
-121.15
8/24/2011 5:00
-227.02
8/24/2011 6:00
-201.65
8/24/2011 7:00
-11.21
8/24/2011 8:00
-89.58
8/24/2011 9:00
-265.27
8/24/2011 10:00
-192.55
8/24/2011 11:00
-265.82
8/24/2011 12:00
-170.80
8/24/2011 13:00
-178.13
8/24/2011 14:00
-140.26
8/24/2011 15:00
-43.45
8/24/2011 16:00
-341.60
8/24/2011 17:00
-12.97
8/24/2011 18:00
354.74
8/24/2011 19:00
158.78
8/24/2011 20:00
73.74
8/24/2011 21:00
201.28
8/24/2011 22:00
206.63
8/24/2011 23:00
95.83
8/25/2011 0:00
-94.63
8/25/2011 1:00
-133.31
8/25/2011 2:00
-20.62
8/25/2011 3:00
-42.97
8/25/2011 4:00
-7.61
8/25/2011 5:00
79.88
8/25/2011 6:00
-67.83
8/25/2011 7:00
-9.49
8/25/2011 8:00
282.05
8/25/2011 9:00
179.48
8/25/2011 10:00
267.95
8/25/2011 11:00
452.27
8/25/2011 12:00
456.80
8/25/2011 13:00
347.60
8/25/2011 14:00
747.11
Docket No. ER11-1844
Exhibit No. NYI-4
Page 76 of 375
8/25/2011 15:00
669.41
8/25/2011 16:00
561.52
8/25/2011 17:00
604.97
8/25/2011 18:00
-50.86
8/25/2011 19:00
338.60
8/25/2011 20:00
508.88
8/25/2011 21:00
418.59
8/25/2011 22:00
332.63
8/25/2011 23:00
298.69
8/26/2011 0:00
319.57
8/26/2011 1:00
277.89
8/26/2011 2:00
272.72
8/26/2011 3:00
134.15
8/26/2011 4:00
182.29
8/26/2011 5:00
281.50
8/26/2011 6:00
116.48
8/26/2011 7:00
60.77
8/26/2011 8:00
119.83
8/26/2011 9:00
199.93
8/26/2011 10:00
-0.50
8/26/2011 11:00
17.39
8/26/2011 12:00
-170.19
8/26/2011 13:00
-100.07
8/26/2011 14:00
-142.38
8/26/2011 15:00
259.00
8/26/2011 16:00
467.90
8/26/2011 17:00
562.47
8/26/2011 18:00
293.13
8/26/2011 19:00
371.64
8/26/2011 20:00
350.71
8/26/2011 21:00
272.50
8/26/2011 22:00
418.92
8/26/2011 23:00
168.60
8/27/2011 0:00
126.94
8/27/2011 1:00
78.93
8/27/2011 2:00
153.47
8/27/2011 3:00
29.47
8/27/2011 4:00
112.13
8/27/2011 5:00
86.71
8/27/2011 6:00
264.44
8/27/2011 7:00
33.49
8/27/2011 8:00
184.74
8/27/2011 9:00
33.30
8/27/2011 10:00
11.60
8/27/2011 11:00
-254.81
8/27/2011 12:00
-438.88
8/27/2011 13:00
-469.19
Docket No. ER11-1844
Exhibit No. NYI-4
Page 77 of 375
8/27/2011 14:00
-463.50
8/27/2011 15:00
-552.96
8/27/2011 16:00
-379.24
8/27/2011 17:00
-354.46
8/27/2011 18:00
-187.94
8/27/2011 19:00
-60.10
8/27/2011 20:00
39.91
8/27/2011 21:00
-31.24
8/27/2011 22:00
-12.95
8/27/2011 23:00
-96.16
8/28/2011 0:00
-141.54
8/28/2011 1:00
-233.86
8/28/2011 2:00
-346.64
8/28/2011 3:00
-341.16
8/28/2011 4:00
-180.63
8/28/2011 5:00
-144.98
8/28/2011 6:00
-146.62
8/28/2011 7:00
-11.13
8/28/2011 8:00
199.05
8/28/2011 9:00
422.89
8/28/2011 10:00
374.29
8/28/2011 11:00
261.26
8/28/2011 12:00
219.76
8/28/2011 13:00
106.29
8/28/2011 14:00
110.22
8/28/2011 15:00
230.80
8/28/2011 16:00
307.26
8/28/2011 17:00
168.43
8/28/2011 18:00
393.43
8/28/2011 19:00
458.26
8/28/2011 20:00
293.98
8/28/2011 21:00
449.40
8/28/2011 22:00
309.89
8/28/2011 23:00
340.74
8/29/2011 0:00
237.34
8/29/2011 1:00
271.73
8/29/2011 2:00
316.40
8/29/2011 3:00
415.18
8/29/2011 4:00
593.62
8/29/2011 5:00
568.62
8/29/2011 6:00
627.20
8/29/2011 7:00
701.83
8/29/2011 8:00
458.86
8/29/2011 9:00
157.91
8/29/2011 10:00
66.00
8/29/2011 11:00
57.01
8/29/2011 12:00
-119.17
Docket No. ER11-1844
Exhibit No. NYI-4
Page 78 of 375
8/29/2011 13:00
-279.62
8/29/2011 14:00
-108.85
8/29/2011 15:00
9.60
8/29/2011 16:00
224.07
8/29/2011 17:00
179.84
8/29/2011 18:00
161.98
8/29/2011 19:00
347.42
8/29/2011 20:00
253.65
8/29/2011 21:00
323.30
8/29/2011 22:00
203.37
8/29/2011 23:00
131.24
8/30/2011 0:00
347.81
8/30/2011 1:00
411.12
8/30/2011 2:00
349.21
8/30/2011 3:00
299.63
8/30/2011 4:00
296.77
8/30/2011 5:00
240.35
8/30/2011 6:00
75.82
8/30/2011 7:00
35.68
8/30/2011 8:00
116.47
8/30/2011 9:00
-39.60
8/30/2011 10:00
-221.19
8/30/2011 11:00
-281.78
8/30/2011 12:00
-338.22
8/30/2011 13:00
-407.79
8/30/2011 14:00
-278.25
8/30/2011 15:00
-187.48
8/30/2011 16:00
-134.77
8/30/2011 17:00
5.75
8/30/2011 18:00
2.98
8/30/2011 19:00
43.59
8/30/2011 20:00
87.88
8/30/2011 21:00
56.28
8/30/2011 22:00
134.19
8/30/2011 23:00
74.22
8/31/2011 0:00
329.51
8/31/2011 1:00
433.98
8/31/2011 2:00
283.62
8/31/2011 3:00
268.48
8/31/2011 4:00
308.25
8/31/2011 5:00
385.17
8/31/2011 6:00
244.75
8/31/2011 7:00
213.14
8/31/2011 8:00
256.03
8/31/2011 9:00
84.92
8/31/2011 10:00
84.71
8/31/2011 11:00
-64.37
Docket No. ER11-1844
Exhibit No. NYI-4
Page 79 of 375
8/31/2011 12:00
-221.74
8/31/2011 13:00
-41.55
8/31/2011 14:00
-6.66
8/31/2011 15:00
26.27
8/31/2011 16:00
49.16
8/31/2011 17:00
114.72
8/31/2011 18:00
-28.83
8/31/2011 19:00
-210.43
8/31/2011 20:00
-178.10
8/31/2011 21:00
-60.88
8/31/2011 22:00
110.11
8/31/2011 23:00
69.59
9/1/2011 0:00
111.89
9/1/2011 1:00
33.22
9/1/2011 2:00
10.36
9/1/2011 3:00
-1.09
9/1/2011 4:00
-158.11
9/1/2011 5:00
27.60
9/1/2011 6:00
0.84
9/1/2011 7:00
78.90
9/1/2011 8:00
42.40
9/1/2011 9:00
-231.12
9/1/2011 10:00
-293.09
9/1/2011 11:00
-435.08
9/1/2011 12:00
-335.96
9/1/2011 13:00
-373.90
9/1/2011 14:00
-629.07
9/1/2011 15:00
-724.10
9/1/2011 16:00
-627.27
9/1/2011 17:00
-366.56
9/1/2011 18:00
-269.35
9/1/2011 19:00
-101.94
9/1/2011 20:00
-372.39
9/1/2011 21:00
-478.96
9/1/2011 22:00
-348.84
9/1/2011 23:00
-381.59
9/2/2011 0:00
51.42
9/2/2011 1:00
-25.38
9/2/2011 2:00
-28.39
9/2/2011 3:00
-31.91
9/2/2011 4:00
21.36
9/2/2011 5:00
-12.86
9/2/2011 6:00
-113.73
9/2/2011 7:00
33.28
9/2/2011 8:00
-72.31
9/2/2011 9:00
-158.93
9/2/2011 10:00
-225.25
Docket No. ER11-1844
Exhibit No. NYI-4
Page 80 of 375
9/2/2011 11:00
-126.10
9/2/2011 12:00
-176.01
9/2/2011 13:00
-233.78
9/2/2011 14:00
-242.68
9/2/2011 15:00
-268.28
9/2/2011 16:00
-110.25
9/2/2011 17:00
20.53
9/2/2011 18:00
225.57
9/2/2011 19:00
224.53
9/2/2011 20:00
-65.44
9/2/2011 21:00
-107.74
9/2/2011 22:00
-29.03
9/2/2011 23:00
311.48
9/3/2011 0:00
239.97
9/3/2011 1:00
184.70
9/3/2011 2:00
88.66
9/3/2011 3:00
156.43
9/3/2011 4:00
228.26
9/3/2011 5:00
309.77
9/3/2011 6:00
229.71
9/3/2011 7:00
362.48
9/3/2011 8:00
56.35
9/3/2011 9:00
17.40
9/3/2011 10:00
-269.78
9/3/2011 11:00
-346.40
9/3/2011 12:00
-460.07
9/3/2011 13:00
-505.69
9/3/2011 14:00
-452.96
9/3/2011 15:00
-108.53
9/3/2011 16:00
11.02
9/3/2011 17:00
30.54
9/3/2011 18:00
156.89
9/3/2011 19:00
89.01
9/3/2011 20:00
184.66
9/3/2011 21:00
327.85
9/3/2011 22:00
307.06
9/3/2011 23:00
380.61
9/4/2011 0:00
234.45
9/4/2011 1:00
78.75
9/4/2011 2:00
122.51
9/4/2011 3:00
30.28
9/4/2011 4:00
77.38
9/4/2011 5:00
12.31
9/4/2011 6:00
-55.85
9/4/2011 7:00
-48.07
9/4/2011 8:00
156.23
9/4/2011 9:00
109.23
Docket No. ER11-1844
Exhibit No. NYI-4
Page 81 of 375
9/4/2011 10:00
40.79
9/4/2011 11:00
-10.42
9/4/2011 12:00
148.74
9/4/2011 13:00
271.98
9/4/2011 14:00
460.53
9/4/2011 15:00
462.83
9/4/2011 16:00
427.26
9/4/2011 17:00
366.37
9/4/2011 18:00
356.00
9/4/2011 19:00
540.24
9/4/2011 20:00
414.16
9/4/2011 21:00
340.63
9/4/2011 22:00
506.03
9/4/2011 23:00
511.95
9/5/2011 0:00
641.74
9/5/2011 1:00
436.33
9/5/2011 2:00
302.05
9/5/2011 3:00
402.64
9/5/2011 4:00
504.56
9/5/2011 5:00
538.04
9/5/2011 6:00
308.68
9/5/2011 7:00
357.93
9/5/2011 8:00
368.98
9/5/2011 9:00
608.76
9/5/2011 10:00
514.54
9/5/2011 11:00
403.50
9/5/2011 12:00
361.14
9/5/2011 13:00
303.16
9/5/2011 14:00
274.05
9/5/2011 15:00
197.92
9/5/2011 16:00
25.63
9/5/2011 17:00
19.43
9/5/2011 18:00
144.81
9/5/2011 19:00
351.68
9/5/2011 20:00
335.69
9/5/2011 21:00
267.51
9/5/2011 22:00
393.09
9/5/2011 23:00
367.32
9/6/2011 0:00
559.70
9/6/2011 1:00
384.86
9/6/2011 2:00
389.59
9/6/2011 3:00
218.29
9/6/2011 4:00
499.42
9/6/2011 5:00
196.82
9/6/2011 6:00
64.26
9/6/2011 7:00
-27.33
9/6/2011 8:00
20.98
Docket No. ER11-1844
Exhibit No. NYI-4
Page 82 of 375
9/6/2011 9:00
85.83
9/6/2011 10:00
7.22
9/6/2011 11:00
-19.14
9/6/2011 12:00
-114.44
9/6/2011 13:00
-109.65
9/6/2011 14:00
-211.65
9/6/2011 15:00
-186.78
9/6/2011 16:00
-185.01
9/6/2011 17:00
-260.56
9/6/2011 18:00
-83.28
9/6/2011 19:00
-53.55
9/6/2011 20:00
-175.72
9/6/2011 21:00
50.41
9/6/2011 22:00
189.97
9/6/2011 23:00
357.38
9/7/2011 0:00
444.42
9/7/2011 1:00
175.14
9/7/2011 2:00
55.64
9/7/2011 3:00
254.31
9/7/2011 4:00
104.30
9/7/2011 5:00
290.39
9/7/2011 6:00
308.04
9/7/2011 7:00
191.08
9/7/2011 8:00
152.01
9/7/2011 9:00
-185.64
9/7/2011 10:00
-361.67
9/7/2011 11:00
-194.23
9/7/2011 12:00
-49.72
9/7/2011 13:00
307.18
9/7/2011 14:00
306.31
9/7/2011 15:00
434.66
9/7/2011 16:00
387.40
9/7/2011 17:00
283.18
9/7/2011 18:00
245.60
9/7/2011 19:00
246.01
9/7/2011 20:00
150.65
9/7/2011 21:00
250.30
9/7/2011 22:00
523.30
9/7/2011 23:00
331.11
9/8/2011 0:00
441.15
9/8/2011 1:00
449.61
9/8/2011 2:00
314.42
9/8/2011 3:00
290.61
9/8/2011 4:00
363.21
9/8/2011 5:00
464.20
9/8/2011 6:00
335.21
9/8/2011 7:00
115.81
Docket No. ER11-1844
Exhibit No. NYI-4
Page 83 of 375
9/8/2011 8:00
78.79
9/8/2011 9:00
80.03
9/8/2011 10:00
147.63
9/8/2011 11:00
72.96
9/8/2011 12:00
120.94
9/8/2011 13:00
57.59
9/8/2011 14:00
-27.58
9/8/2011 15:00
73.48
9/8/2011 16:00
118.68
9/8/2011 17:00
104.01
9/8/2011 18:00
236.73
9/8/2011 19:00
163.88
9/8/2011 20:00
-14.65
9/8/2011 21:00
88.88
9/8/2011 22:00
425.18
9/8/2011 23:00
378.88
9/9/2011 0:00
327.22
9/9/2011 1:00
199.99
9/9/2011 2:00
45.56
9/9/2011 3:00
-1.29
9/9/2011 4:00
-22.21
9/9/2011 5:00
-2.51
9/9/2011 6:00
146.57
9/9/2011 7:00
46.44
9/9/2011 8:00
100.95
9/9/2011 9:00
-90.70
9/9/2011 10:00
-105.00
9/9/2011 11:00
143.52
9/9/2011 12:00
141.08
9/9/2011 13:00
186.70
9/9/2011 14:00
375.03
9/9/2011 15:00
406.34
9/9/2011 16:00
304.28
9/9/2011 17:00
262.92
9/9/2011 18:00
270.48
9/9/2011 19:00
255.82
9/9/2011 20:00
201.77
9/9/2011 21:00
187.67
9/9/2011 22:00
316.44
9/9/2011 23:00
231.46
9/10/2011 0:00
391.44
9/10/2011 1:00
481.92
9/10/2011 2:00
479.02
9/10/2011 3:00
457.55
9/10/2011 4:00
368.38
9/10/2011 5:00
300.40
9/10/2011 6:00
289.13
Docket No. ER11-1844
Exhibit No. NYI-4
Page 84 of 375
9/10/2011 7:00
343.98
9/10/2011 8:00
254.82
9/10/2011 9:00
446.33
9/10/2011 10:00
282.49
9/10/2011 11:00
163.62
9/10/2011 12:00
169.10
9/10/2011 13:00
166.08
9/10/2011 14:00
216.71
9/10/2011 15:00
138.85
9/10/2011 16:00
50.60
9/10/2011 17:00
136.32
9/10/2011 18:00
74.27
9/10/2011 19:00
281.05
9/10/2011 20:00
162.68
9/10/2011 21:00
146.84
9/10/2011 22:00
451.38
9/10/2011 23:00
459.20
9/11/2011 0:00
468.75
9/11/2011 1:00
420.81
9/11/2011 2:00
437.74
9/11/2011 3:00
368.89
9/11/2011 4:00
373.25
9/11/2011 5:00
323.60
9/11/2011 6:00
332.04
9/11/2011 7:00
366.16
9/11/2011 8:00
345.57
9/11/2011 9:00
206.15
9/11/2011 10:00
141.38
9/11/2011 11:00
115.87
9/11/2011 12:00
33.09
9/11/2011 13:00
91.41
9/11/2011 14:00
-11.26
9/11/2011 15:00
-67.06
9/11/2011 16:00
-111.26
9/11/2011 17:00
-4.40
9/11/2011 18:00
59.62
9/11/2011 19:00
59.14
9/11/2011 20:00
136.24
9/11/2011 21:00
-24.64
9/11/2011 22:00
83.31
9/11/2011 23:00
91.30
9/12/2011 0:00
305.54
9/12/2011 1:00
89.78
9/12/2011 2:00
79.81
9/12/2011 3:00
-90.96
9/12/2011 4:00
-70.47
9/12/2011 5:00
164.98
Docket No. ER11-1844
Exhibit No. NYI-4
Page 85 of 375
9/12/2011 6:00
103.07
9/12/2011 7:00
31.73
9/12/2011 8:00
-130.64
9/12/2011 9:00
-111.09
9/12/2011 10:00
-145.38
9/12/2011 11:00
117.97
9/12/2011 12:00
82.26
9/12/2011 13:00
-1.18
9/12/2011 14:00
-180.62
9/12/2011 15:00
-153.67
9/12/2011 16:00
13.39
9/12/2011 17:00
-20.59
9/12/2011 18:00
336.86
9/12/2011 19:00
378.26
9/12/2011 20:00
362.68
9/12/2011 21:00
177.86
9/12/2011 22:00
207.98
9/12/2011 23:00
382.83
9/13/2011 0:00
667.32
9/13/2011 1:00
574.64
9/13/2011 2:00
395.19
9/13/2011 3:00
241.92
9/13/2011 4:00
50.46
9/13/2011 5:00
-55.76
9/13/2011 6:00
-95.79
9/13/2011 7:00
124.88
9/13/2011 8:00
143.04
9/13/2011 9:00
-79.77
9/13/2011 10:00
-179.36
9/13/2011 11:00
-10.30
9/13/2011 12:00
136.01
9/13/2011 13:00
-120.18
9/13/2011 14:00
31.88
9/13/2011 15:00
57.54
9/13/2011 16:00
143.56
9/13/2011 17:00
380.45
9/13/2011 18:00
373.32
9/13/2011 19:00
410.95
9/13/2011 20:00
91.41
9/13/2011 21:00
282.01
9/13/2011 22:00
346.36
9/13/2011 23:00
153.94
9/14/2011 0:00
311.91
9/14/2011 1:00
448.97
9/14/2011 2:00
359.42
9/14/2011 3:00
131.21
9/14/2011 4:00
33.91
Docket No. ER11-1844
Exhibit No. NYI-4
Page 86 of 375
9/14/2011 5:00
-59.37
9/14/2011 6:00
-56.70
9/14/2011 7:00
43.85
9/14/2011 8:00
114.72
9/14/2011 9:00
158.35
9/14/2011 10:00
277.89
9/14/2011 11:00
397.97
9/14/2011 12:00
398.92
9/14/2011 13:00
289.96
9/14/2011 14:00
328.80
9/14/2011 15:00
301.59
9/14/2011 16:00
351.18
9/14/2011 17:00
405.71
9/14/2011 18:00
408.00
9/14/2011 19:00
737.15
9/14/2011 20:00
671.85
9/14/2011 21:00
528.71
9/14/2011 22:00
646.32
9/14/2011 23:00
338.62
9/15/2011 0:00
506.70
9/15/2011 1:00
245.21
9/15/2011 2:00
175.26
9/15/2011 3:00
167.40
9/15/2011 4:00
281.36
9/15/2011 5:00
146.75
9/15/2011 6:00
86.35
9/15/2011 7:00
221.57
9/15/2011 8:00
153.65
9/15/2011 9:00
68.56
9/15/2011 10:00
340.76
9/15/2011 11:00
438.25
9/15/2011 12:00
214.78
9/15/2011 13:00
9.20
9/15/2011 14:00
11.30
9/15/2011 15:00
-59.31
9/15/2011 16:00
-55.79
9/15/2011 17:00
-12.96
9/15/2011 18:00
138.82
9/15/2011 19:00
186.03
9/15/2011 20:00
191.94
9/15/2011 21:00
106.65
9/15/2011 22:00
329.64
9/15/2011 23:00
243.62
9/16/2011 0:00
371.90
9/16/2011 1:00
334.07
9/16/2011 2:00
361.85
9/16/2011 3:00
300.66
Docket No. ER11-1844
Exhibit No. NYI-4
Page 87 of 375
9/16/2011 4:00
168.26
9/16/2011 5:00
212.84
9/16/2011 6:00
173.93
9/16/2011 7:00
112.97
9/16/2011 8:00
131.41
9/16/2011 9:00
195.72
9/16/2011 10:00
150.86
9/16/2011 11:00
137.05
9/16/2011 12:00
118.26
9/16/2011 13:00
54.68
9/16/2011 14:00
91.36
9/16/2011 15:00
220.45
9/16/2011 16:00
128.50
9/16/2011 17:00
224.14
9/16/2011 18:00
305.95
9/16/2011 19:00
519.49
9/16/2011 20:00
256.83
9/16/2011 21:00
354.84
9/16/2011 22:00
594.74
9/16/2011 23:00
429.63
9/17/2011 0:00
403.27
9/17/2011 1:00
376.17
9/17/2011 2:00
503.58
9/17/2011 3:00
417.19
9/17/2011 4:00
495.31
9/17/2011 5:00
338.99
9/17/2011 6:00
291.77
9/17/2011 7:00
294.89
9/17/2011 8:00
255.97
9/17/2011 9:00
168.46
9/17/2011 10:00
86.08
9/17/2011 11:00
20.10
9/17/2011 12:00
85.15
9/17/2011 13:00
77.61
9/17/2011 14:00
337.91
9/17/2011 15:00
321.56
9/17/2011 16:00
298.06
9/17/2011 17:00
202.95
9/17/2011 18:00
548.81
9/17/2011 19:00
462.37
9/17/2011 20:00
440.08
9/17/2011 21:00
322.57
9/17/2011 22:00
540.85
9/17/2011 23:00
358.74
9/18/2011 0:00
474.17
9/18/2011 1:00
358.48
9/18/2011 2:00
434.26
Docket No. ER11-1844
Exhibit No. NYI-4
Page 88 of 375
9/18/2011 3:00
420.82
9/18/2011 4:00
441.11
9/18/2011 5:00
306.22
9/18/2011 6:00
254.28
9/18/2011 7:00
356.75
9/18/2011 8:00
484.45
9/18/2011 9:00
359.05
9/18/2011 10:00
196.49
9/18/2011 11:00
177.61
9/18/2011 12:00
133.86
9/18/2011 13:00
78.01
9/18/2011 14:00
102.72
9/18/2011 15:00
57.75
9/18/2011 16:00
118.15
9/18/2011 17:00
131.63
9/18/2011 18:00
147.46
9/18/2011 19:00
64.94
9/18/2011 20:00
135.67
9/18/2011 21:00
131.17
9/18/2011 22:00
340.26
9/18/2011 23:00
267.61
9/19/2011 0:00
398.61
9/19/2011 1:00
262.33
9/19/2011 2:00
179.39
9/19/2011 3:00
180.45
9/19/2011 4:00
267.66
9/19/2011 5:00
212.64
9/19/2011 6:00
149.61
9/19/2011 7:00
357.83
9/19/2011 8:00
339.73
9/19/2011 9:00
190.06
9/19/2011 10:00
249.02
9/19/2011 11:00
307.64
9/19/2011 12:00
173.54
9/19/2011 13:00
142.32
9/19/2011 14:00
99.33
9/19/2011 15:00
66.77
9/19/2011 16:00
114.89
9/19/2011 17:00
11.17
9/19/2011 18:00
86.61
9/19/2011 19:00
102.38
9/19/2011 20:00
70.24
9/19/2011 21:00
-111.96
9/19/2011 22:00
181.28
9/19/2011 23:00
55.31
9/20/2011 0:00
308.58
9/20/2011 1:00
259.91
Docket No. ER11-1844
Exhibit No. NYI-4
Page 89 of 375
9/20/2011 2:00
188.69
9/20/2011 3:00
119.93
9/20/2011 4:00
181.29
9/20/2011 5:00
250.10
9/20/2011 6:00
91.14
9/20/2011 7:00
54.28
9/20/2011 8:00
138.81
9/20/2011 9:00
9.40
9/20/2011 10:00
31.99
9/20/2011 11:00
60.34
9/20/2011 12:00
-12.05
9/20/2011 13:00
-164.65
9/20/2011 14:00
-44.21
9/20/2011 15:00
-85.59
9/20/2011 16:00
-184.16
9/20/2011 17:00
-113.29
9/20/2011 18:00
64.54
9/20/2011 19:00
-27.95
9/20/2011 20:00
-148.59
9/20/2011 21:00
-130.69
9/20/2011 22:00
201.38
9/20/2011 23:00
224.82
9/21/2011 0:00
317.35
9/21/2011 1:00
325.77
9/21/2011 2:00
216.20
9/21/2011 3:00
34.49
9/21/2011 4:00
44.68
9/21/2011 5:00
26.98
9/21/2011 6:00
27.48
9/21/2011 7:00
95.63
9/21/2011 8:00
23.22
9/21/2011 9:00
-57.71
9/21/2011 10:00
-107.90
9/21/2011 11:00
-162.85
9/21/2011 12:00
-232.63
9/21/2011 13:00
-242.59
9/21/2011 14:00
-316.18
9/21/2011 15:00
-311.97
9/21/2011 16:00
-266.18
9/21/2011 17:00
-271.18
9/21/2011 18:00
-148.47
9/21/2011 19:00
-148.96
9/21/2011 20:00
-103.00
9/21/2011 21:00
-59.00
9/21/2011 22:00
186.57
9/21/2011 23:00
148.88
9/22/2011 0:00
439.68
Docket No. ER11-1844
Exhibit No. NYI-4
Page 90 of 375
9/22/2011 1:00
188.76
9/22/2011 2:00
29.18
9/22/2011 3:00
223.52
9/22/2011 4:00
307.33
9/22/2011 5:00
376.82
9/22/2011 6:00
239.43
9/22/2011 7:00
159.74
9/22/2011 8:00
112.34
9/22/2011 9:00
168.26
9/22/2011 10:00
412.83
9/22/2011 11:00
204.08
9/22/2011 12:00
243.63
9/22/2011 13:00
419.09
9/22/2011 14:00
280.02
9/22/2011 15:00
127.06
9/22/2011 16:00
287.37
9/22/2011 17:00
296.00
9/22/2011 18:00
366.70
9/22/2011 19:00
433.60
9/22/2011 20:00
634.61
9/22/2011 21:00
639.96
9/22/2011 22:00
439.10
9/22/2011 23:00
439.73
9/23/2011 0:00
418.37
9/23/2011 1:00
397.05
9/23/2011 2:00
359.32
9/23/2011 3:00
421.82
9/23/2011 4:00
319.66
9/23/2011 5:00
-45.39
9/23/2011 6:00
164.78
9/23/2011 7:00
144.52
9/23/2011 8:00
138.95
9/23/2011 9:00
181.09
9/23/2011 10:00
269.18
9/23/2011 11:00
130.98
9/23/2011 12:00
273.72
9/23/2011 13:00
198.96
9/23/2011 14:00
262.11
9/23/2011 15:00
230.76
9/23/2011 16:00
169.63
9/23/2011 17:00
170.36
9/23/2011 18:00
285.79
9/23/2011 19:00
191.43
9/23/2011 20:00
302.66
9/23/2011 21:00
395.32
9/23/2011 22:00
695.56
9/23/2011 23:00
683.78
Docket No. ER11-1844
Exhibit No. NYI-4
Page 91 of 375
9/24/2011 0:00
561.81
9/24/2011 1:00
270.78
9/24/2011 2:00
259.04
9/24/2011 3:00
248.64
9/24/2011 4:00
174.66
9/24/2011 5:00
170.26
9/24/2011 6:00
253.06
9/24/2011 7:00
406.23
9/24/2011 8:00
333.18
9/24/2011 9:00
173.58
9/24/2011 10:00
127.60
9/24/2011 11:00
87.19
9/24/2011 12:00
101.87
9/24/2011 13:00
120.69
9/24/2011 14:00
-90.58
9/24/2011 15:00
78.57
9/24/2011 16:00
140.20
9/24/2011 17:00
96.57
9/24/2011 18:00
224.19
9/24/2011 19:00
57.76
9/24/2011 20:00
336.70
9/24/2011 21:00
198.35
9/24/2011 22:00
248.67
9/24/2011 23:00
93.85
9/25/2011 0:00
266.67
9/25/2011 1:00
265.78
9/25/2011 2:00
339.94
9/25/2011 3:00
449.44
9/25/2011 4:00
472.65
9/25/2011 5:00
392.36
9/25/2011 6:00
317.82
9/25/2011 7:00
416.02
9/25/2011 8:00
196.93
9/25/2011 9:00
274.14
9/25/2011 10:00
280.13
9/25/2011 11:00
286.42
9/25/2011 12:00
112.70
9/25/2011 13:00
89.34
9/25/2011 14:00
212.27
9/25/2011 15:00
35.37
9/25/2011 16:00
-137.31
9/25/2011 17:00
-47.18
9/25/2011 18:00
36.85
9/25/2011 19:00
15.43
9/25/2011 20:00
101.62
9/25/2011 21:00
184.31
9/25/2011 22:00
319.87
Docket No. ER11-1844
Exhibit No. NYI-4
Page 92 of 375
9/25/2011 23:00
307.87
9/26/2011 0:00
330.62
9/26/2011 1:00
80.69
9/26/2011 2:00
282.17
9/26/2011 3:00
82.00
9/26/2011 4:00
37.15
9/26/2011 5:00
-39.49
9/26/2011 6:00
-28.77
9/26/2011 7:00
-27.75
9/26/2011 8:00
9.45
9/26/2011 9:00
-38.58
9/26/2011 10:00
-60.37
9/26/2011 11:00
150.25
9/26/2011 12:00
239.70
9/26/2011 13:00
129.17
9/26/2011 14:00
106.87
9/26/2011 15:00
278.91
9/26/2011 16:00
35.05
9/26/2011 17:00
193.94
9/26/2011 18:00
21.65
9/26/2011 19:00
110.04
9/26/2011 20:00
176.03
9/26/2011 21:00
130.97
9/26/2011 22:00
148.71
9/26/2011 23:00
289.87
9/27/2011 0:00
321.51
9/27/2011 1:00
154.89
9/27/2011 2:00
306.27
9/27/2011 3:00
329.95
9/27/2011 4:00
257.71
9/27/2011 5:00
111.06
9/27/2011 6:00
179.21
9/27/2011 7:00
-73.02
9/27/2011 8:00
36.74
9/27/2011 9:00
-40.76
9/27/2011 10:00
-101.09
9/27/2011 11:00
120.43
9/27/2011 12:00
41.68
9/27/2011 13:00
-116.62
9/27/2011 14:00
-260.66
9/27/2011 15:00
-261.48
9/27/2011 16:00
-121.55
9/27/2011 17:00
-126.54
9/27/2011 18:00
-96.89
9/27/2011 19:00
-38.82
9/27/2011 20:00
-166.65
9/27/2011 21:00
-177.49
Docket No. ER11-1844
Exhibit No. NYI-4
Page 93 of 375
9/27/2011 22:00
-91.79
9/27/2011 23:00
-61.45
9/28/2011 0:00
260.05
9/28/2011 1:00
252.37
9/28/2011 2:00
-129.28
9/28/2011 3:00
-132.07
9/28/2011 4:00
72.21
9/28/2011 5:00
-9.76
9/28/2011 6:00
-126.58
9/28/2011 7:00
-289.29
9/28/2011 8:00
-183.56
9/28/2011 9:00
-419.45
9/28/2011 10:00
-375.34
9/28/2011 11:00
-426.40
9/28/2011 12:00
-239.43
9/28/2011 13:00
-370.49
9/28/2011 14:00
-329.97
9/28/2011 15:00
-294.85
9/28/2011 16:00
-165.05
9/28/2011 17:00
-32.40
9/28/2011 18:00
24.96
9/28/2011 19:00
-175.67
9/28/2011 20:00
-166.26
9/28/2011 21:00
-91.64
9/28/2011 22:00
145.58
9/28/2011 23:00
139.94
9/29/2011 0:00
114.16
9/29/2011 1:00
201.17
9/29/2011 2:00
-89.59
9/29/2011 3:00
-135.01
9/29/2011 4:00
-153.44
9/29/2011 5:00
-39.04
9/29/2011 6:00
-124.48
9/29/2011 7:00
-219.48
9/29/2011 8:00
-304.37
9/29/2011 9:00
-357.71
9/29/2011 10:00
-459.99
9/29/2011 11:00
-542.87
9/29/2011 12:00
-549.45
9/29/2011 13:00
-414.37
9/29/2011 14:00
-300.07
9/29/2011 15:00
-231.37
9/29/2011 16:00
-381.01
9/29/2011 17:00
-323.07
9/29/2011 18:00
-314.51
9/29/2011 19:00
-294.54
9/29/2011 20:00
-335.35
Docket No. ER11-1844
Exhibit No. NYI-4
Page 94 of 375
9/29/2011 21:00
-208.39
9/29/2011 22:00
-107.09
9/29/2011 23:00
-94.73
9/30/2011 0:00
67.95
9/30/2011 1:00
133.81
9/30/2011 2:00
-62.25
9/30/2011 3:00
-159.91
9/30/2011 4:00
-236.75
9/30/2011 5:00
-353.79
9/30/2011 6:00
-355.69
9/30/2011 7:00
-293.06
9/30/2011 8:00
-221.72
9/30/2011 9:00
-41.32
9/30/2011 10:00
-11.70
9/30/2011 11:00
-78.27
9/30/2011 12:00
26.75
9/30/2011 13:00
-64.40
9/30/2011 14:00
-77.49
9/30/2011 15:00
101.31
9/30/2011 16:00
113.52
9/30/2011 17:00
207.33
9/30/2011 18:00
192.85
9/30/2011 19:00
77.54
9/30/2011 20:00
-138.82
9/30/2011 21:00
-244.50
9/30/2011 22:00
-198.71
9/30/2011 23:00
-247.68
10/1/2011 0:00
46.94
10/1/2011 1:00
67.79
10/1/2011 2:00
97.75
10/1/2011 3:00
123.42
10/1/2011 4:00
268.86
10/1/2011 5:00
351.79
10/1/2011 6:00
195.46
10/1/2011 7:00
93.97
10/1/2011 8:00
31.86
10/1/2011 9:00
-98.56
10/1/2011 10:00
-152.35
10/1/2011 11:00
-138.81
10/1/2011 12:00
-226.96
10/1/2011 13:00
-10.80
10/1/2011 14:00
-87.71
10/1/2011 15:00
-77.49
10/1/2011 16:00
-119.46
10/1/2011 17:00
-74.36
10/1/2011 18:00
-248.77
10/1/2011 19:00
-278.84
Docket No. ER11-1844
Exhibit No. NYI-4
Page 95 of 375
10/1/2011 20:00
-221.07
10/1/2011 21:00
-75.26
10/1/2011 22:00
-265.33
10/1/2011 23:00
-191.90
10/2/2011 0:00
-45.64
10/2/2011 1:00
-17.26
10/2/2011 2:00
328.45
10/2/2011 3:00
423.07
10/2/2011 4:00
431.01
10/2/2011 5:00
368.70
10/2/2011 6:00
112.42
10/2/2011 7:00
-45.12
10/2/2011 8:00
27.14
10/2/2011 9:00
19.35
10/2/2011 10:00
-79.44
10/2/2011 11:00
-23.13
10/2/2011 12:00
-137.03
10/2/2011 13:00
-50.44
10/2/2011 14:00
-1.30
10/2/2011 15:00
-59.01
10/2/2011 16:00
-95.78
10/2/2011 17:00
-142.26
10/2/2011 18:00
-43.53
10/2/2011 19:00
-104.88
10/2/2011 20:00
-115.88
10/2/2011 21:00
-159.78
10/2/2011 22:00
16.59
10/2/2011 23:00
-206.92
10/3/2011 0:00
-59.18
10/3/2011 1:00
1.72
10/3/2011 2:00
-89.62
10/3/2011 3:00
77.94
10/3/2011 4:00
148.11
10/3/2011 5:00
-162.23
10/3/2011 6:00
-246.58
10/3/2011 7:00
3.41
10/3/2011 8:00
-197.17
10/3/2011 9:00
-259.32
10/3/2011 10:00
-147.57
10/3/2011 11:00
-183.18
10/3/2011 12:00
-99.49
10/3/2011 13:00
-213.67
10/3/2011 14:00
-105.38
10/3/2011 15:00
-124.83
10/3/2011 16:00
-251.48
10/3/2011 17:00
-201.78
10/3/2011 18:00
-229.94
Docket No. ER11-1844
Exhibit No. NYI-4
Page 96 of 375
10/3/2011 19:00
-96.65
10/3/2011 20:00
-100.48
10/3/2011 21:00
-48.31
10/3/2011 22:00
263.40
10/3/2011 23:00
84.35
10/4/2011 0:00
69.71
10/4/2011 1:00
240.35
10/4/2011 2:00
229.24
10/4/2011 3:00
194.69
10/4/2011 4:00
148.20
10/4/2011 5:00
112.22
10/4/2011 6:00
49.92
10/4/2011 7:00
-33.42
10/4/2011 8:00
-74.21
10/4/2011 9:00
-207.45
10/4/2011 10:00
-179.47
10/4/2011 11:00
-271.03
10/4/2011 12:00
-166.00
10/4/2011 13:00
-211.38
10/4/2011 14:00
-218.26
10/4/2011 15:00
-204.65
10/4/2011 16:00
-262.35
10/4/2011 17:00
-259.56
10/4/2011 18:00
-127.36
10/4/2011 19:00
-83.53
10/4/2011 20:00
-250.64
10/4/2011 21:00
-198.89
10/4/2011 22:00
93.98
10/4/2011 23:00
148.33
10/5/2011 0:00
233.14
10/5/2011 1:00
282.19
10/5/2011 2:00
243.34
10/5/2011 3:00
274.07
10/5/2011 4:00
240.72
10/5/2011 5:00
243.93
10/5/2011 6:00
39.03
10/5/2011 7:00
15.76
10/5/2011 8:00
-56.42
10/5/2011 9:00
46.65
10/5/2011 10:00
-70.65
10/5/2011 11:00
-90.82
10/5/2011 12:00
-41.84
10/5/2011 13:00
5.94
10/5/2011 14:00
161.35
10/5/2011 15:00
163.49
10/5/2011 16:00
140.65
10/5/2011 17:00
144.04
Docket No. ER11-1844
Exhibit No. NYI-4
Page 97 of 375
10/5/2011 18:00
144.25
10/5/2011 19:00
-144.57
10/5/2011 20:00
-123.90
10/5/2011 21:00
-95.68
10/5/2011 22:00
52.13
10/5/2011 23:00
4.84
10/6/2011 0:00
46.45
10/6/2011 1:00
99.33
10/6/2011 2:00
216.05
10/6/2011 3:00
160.91
10/6/2011 4:00
289.77
10/6/2011 5:00
196.80
10/6/2011 6:00
73.11
10/6/2011 7:00
-27.05
10/6/2011 8:00
-22.24
10/6/2011 9:00
-72.85
10/6/2011 10:00
-109.65
10/6/2011 11:00
-50.75
10/6/2011 12:00
80.55
10/6/2011 13:00
-78.77
10/6/2011 14:00
-64.68
10/6/2011 15:00
-86.16
10/6/2011 16:00
-122.94
10/6/2011 17:00
-92.99
10/6/2011 18:00
44.15
10/6/2011 19:00
-111.34
10/6/2011 20:00
-0.46
10/6/2011 21:00
-35.03
10/6/2011 22:00
201.75
10/6/2011 23:00
243.66
10/7/2011 0:00
308.84
10/7/2011 1:00
258.98
10/7/2011 2:00
185.60
10/7/2011 3:00
284.61
10/7/2011 4:00
197.32
10/7/2011 5:00
177.75
10/7/2011 6:00
22.06
10/7/2011 7:00
-63.29
10/7/2011 8:00
-117.99
10/7/2011 9:00
-112.37
10/7/2011 10:00
-257.90
10/7/2011 11:00
-173.97
10/7/2011 12:00
-91.53
10/7/2011 13:00
-154.10
10/7/2011 14:00
-262.68
10/7/2011 15:00
-348.60
10/7/2011 16:00
-412.97
Docket No. ER11-1844
Exhibit No. NYI-4
Page 98 of 375
10/7/2011 17:00
-343.58
10/7/2011 18:00
-185.43
10/7/2011 19:00
-273.04
10/7/2011 20:00
-74.55
10/7/2011 21:00
-145.25
10/7/2011 22:00
-77.23
10/7/2011 23:00
-104.33
10/8/2011 0:00
-3.06
10/8/2011 1:00
-153.42
10/8/2011 2:00
-229.40
10/8/2011 3:00
-116.50
10/8/2011 4:00
-140.42
10/8/2011 5:00
-42.38
10/8/2011 6:00
-99.19
10/8/2011 7:00
47.57
10/8/2011 8:00
74.81
10/8/2011 9:00
-69.32
10/8/2011 10:00
-191.96
10/8/2011 11:00
-173.10
10/8/2011 12:00
-161.57
10/8/2011 13:00
-157.10
10/8/2011 14:00
-60.54
10/8/2011 15:00
-134.12
10/8/2011 16:00
-20.49
10/8/2011 17:00
17.31
10/8/2011 18:00
96.49
10/8/2011 19:00
308.36
10/8/2011 20:00
200.55
10/8/2011 21:00
187.81
10/8/2011 22:00
166.81
10/8/2011 23:00
145.93
10/9/2011 0:00
109.05
10/9/2011 1:00
289.72
10/9/2011 2:00
188.02
10/9/2011 3:00
110.79
10/9/2011 4:00
145.13
10/9/2011 5:00
145.69
10/9/2011 6:00
137.45
10/9/2011 7:00
213.20
10/9/2011 8:00
109.61
10/9/2011 9:00
-93.43
10/9/2011 10:00
-170.96
10/9/2011 11:00
-53.28
10/9/2011 12:00
-126.55
10/9/2011 13:00
-135.20
10/9/2011 14:00
-83.08
10/9/2011 15:00
-3.88
Docket No. ER11-1844
Exhibit No. NYI-4
Page 99 of 375
10/9/2011 16:00
98.75
10/9/2011 17:00
118.10
10/9/2011 18:00
317.69
10/9/2011 19:00
312.66
10/9/2011 20:00
352.00
10/9/2011 21:00
124.49
10/9/2011 22:00
179.78
10/9/2011 23:00
69.09
10/10/2011 0:00
-104.65
10/10/2011 1:00
-112.96
10/10/2011 2:00
-85.56
10/10/2011 3:00
21.23
10/10/2011 4:00
-7.39
10/10/2011 5:00
75.95
10/10/2011 6:00
-14.11
10/10/2011 7:00
42.79
10/10/2011 8:00
19.13
10/10/2011 9:00
44.73
10/10/2011 10:00
387.60
10/10/2011 11:00
318.35
10/10/2011 12:00
324.91
10/10/2011 13:00
203.47
10/10/2011 14:00
106.98
10/10/2011 15:00
160.04
10/10/2011 16:00
118.61
10/10/2011 17:00
122.74
10/10/2011 18:00
246.21
10/10/2011 19:00
152.45
10/10/2011 20:00
168.64
10/10/2011 21:00
-88.74
10/10/2011 22:00
-65.33
10/10/2011 23:00
30.64
10/11/2011 0:00
202.35
10/11/2011 1:00
255.21
10/11/2011 2:00
122.20
10/11/2011 3:00
97.20
10/11/2011 4:00
107.55
10/11/2011 5:00
-109.74
10/11/2011 6:00
-113.88
10/11/2011 7:00
-7.24
10/11/2011 8:00
127.19
10/11/2011 9:00
170.11
10/11/2011 10:00
97.61
10/11/2011 11:00
85.95
10/11/2011 12:00
66.99
10/11/2011 13:00
176.77
10/11/2011 14:00
109.89
Docket No. ER11-1844
Exhibit No. NYI-4
Page 100 of 375
10/11/2011 15:00
10.94
10/11/2011 16:00
18.21
10/11/2011 17:00
142.49
10/11/2011 18:00
255.29
10/11/2011 19:00
201.95
10/11/2011 20:00
166.36
10/11/2011 21:00
-4.30
10/11/2011 22:00
143.65
10/11/2011 23:00
128.09
10/12/2011 0:00
89.68
10/12/2011 1:00
230.12
10/12/2011 2:00
148.81
10/12/2011 3:00
122.97
10/12/2011 4:00
43.28
10/12/2011 5:00
-13.00
10/12/2011 6:00
-73.82
10/12/2011 7:00
-88.07
10/12/2011 8:00
105.06
10/12/2011 9:00
52.90
10/12/2011 10:00
20.77
10/12/2011 11:00
40.97
10/12/2011 12:00
211.21
10/12/2011 13:00
207.99
10/12/2011 14:00
128.49
10/12/2011 15:00
145.49
10/12/2011 16:00
142.27
10/12/2011 17:00
178.67
10/12/2011 18:00
207.80
10/12/2011 19:00
34.70
10/12/2011 20:00
76.12
10/12/2011 21:00
-31.29
10/12/2011 22:00
140.32
10/12/2011 23:00
114.77
10/13/2011 0:00
240.02
10/13/2011 1:00
347.29
10/13/2011 2:00
188.98
10/13/2011 3:00
201.53
10/13/2011 4:00
112.45
10/13/2011 5:00
186.04
10/13/2011 6:00
234.26
10/13/2011 7:00
182.79
10/13/2011 8:00
178.69
10/13/2011 9:00
229.49
10/13/2011 10:00
180.54
10/13/2011 11:00
176.99
10/13/2011 12:00
297.36
10/13/2011 13:00
237.89
Docket No. ER11-1844
Exhibit No. NYI-4
Page 101 of 375
10/13/2011 14:00
200.48
10/13/2011 15:00
368.01
10/13/2011 16:00
321.42
10/13/2011 17:00
481.97
10/13/2011 18:00
479.36
10/13/2011 19:00
226.56
10/13/2011 20:00
168.56
10/13/2011 21:00
58.73
10/13/2011 22:00
279.20
10/13/2011 23:00
291.49
10/14/2011 0:00
259.25
10/14/2011 1:00
80.18
10/14/2011 2:00
24.53
10/14/2011 3:00
24.98
10/14/2011 4:00
63.21
10/14/2011 5:00
12.40
10/14/2011 6:00
-96.70
10/14/2011 7:00
92.51
10/14/2011 8:00
201.19
10/14/2011 9:00
34.28
10/14/2011 10:00
-48.52
10/14/2011 11:00
-19.28
10/14/2011 12:00
-43.72
10/14/2011 13:00
-62.45
10/14/2011 14:00
-3.72
10/14/2011 15:00
-37.74
10/14/2011 16:00
67.19
10/14/2011 17:00
74.29
10/14/2011 18:00
158.37
10/14/2011 19:00
170.43
10/14/2011 20:00
163.97
10/14/2011 21:00
186.08
10/14/2011 22:00
134.39
10/14/2011 23:00
-110.81
10/15/2011 0:00
-144.28
10/15/2011 1:00
105.50
10/15/2011 2:00
183.25
10/15/2011 3:00
75.02
10/15/2011 4:00
68.04
10/15/2011 5:00
76.76
10/15/2011 6:00
-154.47
10/15/2011 7:00
-272.34
10/15/2011 8:00
-161.99
10/15/2011 9:00
38.67
10/15/2011 10:00
98.44
10/15/2011 11:00
172.43
10/15/2011 12:00
66.87
Docket No. ER11-1844
Exhibit No. NYI-4
Page 102 of 375
10/15/2011 13:00
129.90
10/15/2011 14:00
130.21
10/15/2011 15:00
123.53
10/15/2011 16:00
146.01
10/15/2011 17:00
158.78
10/15/2011 18:00
162.39
10/15/2011 19:00
104.51
10/15/2011 20:00
176.65
10/15/2011 21:00
158.29
10/15/2011 22:00
134.25
10/15/2011 23:00
4.04
10/16/2011 0:00
-11.84
10/16/2011 1:00
-22.27
10/16/2011 2:00
-0.78
10/16/2011 3:00
-98.54
10/16/2011 4:00
-40.21
10/16/2011 5:00
-4.32
10/16/2011 6:00
57.28
10/16/2011 7:00
-10.43
10/16/2011 8:00
-200.61
10/16/2011 9:00
94.50
10/16/2011 10:00
105.43
10/16/2011 11:00
155.68
10/16/2011 12:00
215.93
10/16/2011 13:00
97.12
10/16/2011 14:00
114.32
10/16/2011 15:00
50.61
10/16/2011 16:00
57.31
10/16/2011 17:00
149.85
10/16/2011 18:00
229.18
10/16/2011 19:00
242.17
10/16/2011 20:00
33.29
10/16/2011 21:00
60.81
10/16/2011 22:00
-100.51
10/16/2011 23:00
-26.92
10/17/2011 0:00
-97.18
10/17/2011 1:00
11.39
10/17/2011 2:00
28.27
10/17/2011 3:00
102.42
10/17/2011 4:00
173.70
10/17/2011 5:00
78.07
10/17/2011 6:00
8.86
10/17/2011 7:00
38.73
10/17/2011 8:00
161.90
10/17/2011 9:00
-60.96
10/17/2011 10:00
17.99
10/17/2011 11:00
89.02
Docket No. ER11-1844
Exhibit No. NYI-4
Page 103 of 375
10/17/2011 12:00
42.35
10/17/2011 13:00
144.76
10/17/2011 14:00
116.61
10/17/2011 15:00
170.29
10/17/2011 16:00
242.79
10/17/2011 17:00
148.27
10/17/2011 18:00
286.23
10/17/2011 19:00
13.58
10/17/2011 20:00
148.35
10/17/2011 21:00
16.02
10/17/2011 22:00
-21.08
10/17/2011 23:00
-160.30
10/18/2011 0:00
23.85
10/18/2011 1:00
5.10
10/18/2011 2:00
-36.56
10/18/2011 3:00
-257.34
10/18/2011 4:00
-197.17
10/18/2011 5:00
-144.88
10/18/2011 6:00
-265.74
10/18/2011 7:00
-198.52
10/18/2011 8:00
64.12
10/18/2011 9:00
-17.03
10/18/2011 10:00
-101.43
10/18/2011 11:00
-138.93
10/18/2011 12:00
-135.83
10/18/2011 13:00
-103.73
10/18/2011 14:00
89.76
10/18/2011 15:00
205.99
10/18/2011 16:00
92.76
10/18/2011 17:00
5.15
10/18/2011 18:00
84.13
10/18/2011 19:00
0.43
10/18/2011 20:00
-124.09
10/18/2011 21:00
-120.94
10/18/2011 22:00
-98.39
10/18/2011 23:00
-173.08
10/19/2011 0:00
6.84
10/19/2011 1:00
240.03
10/19/2011 2:00
205.69
10/19/2011 3:00
269.39
10/19/2011 4:00
196.64
10/19/2011 5:00
222.01
10/19/2011 6:00
-214.87
10/19/2011 7:00
-48.11
10/19/2011 8:00
97.98
10/19/2011 9:00
99.23
10/19/2011 10:00
138.89
Docket No. ER11-1844
Exhibit No. NYI-4
Page 104 of 375
10/19/2011 11:00
136.46
10/19/2011 12:00
50.98
10/19/2011 13:00
-8.79
10/19/2011 14:00
36.70
10/19/2011 15:00
-103.99
10/19/2011 16:00
-97.73
10/19/2011 17:00
-33.64
10/19/2011 18:00
-41.01
10/19/2011 19:00
127.96
10/19/2011 20:00
75.73
10/19/2011 21:00
-117.32
10/19/2011 22:00
-85.12
10/19/2011 23:00
119.14
10/20/2011 0:00
216.08
10/20/2011 1:00
-18.40
10/20/2011 2:00
65.47
10/20/2011 3:00
15.79
10/20/2011 4:00
0.66
10/20/2011 5:00
43.85
10/20/2011 6:00
-16.96
10/20/2011 7:00
31.37
10/20/2011 8:00
239.96
10/20/2011 9:00
286.27
10/20/2011 10:00
292.58
10/20/2011 11:00
185.13
10/20/2011 12:00
118.44
10/20/2011 13:00
86.27
10/20/2011 14:00
28.20
10/20/2011 15:00
-85.33
10/20/2011 16:00
-69.75
10/20/2011 17:00
87.09
10/20/2011 18:00
11.82
10/20/2011 19:00
18.46
10/20/2011 20:00
-60.08
10/20/2011 21:00
-238.33
10/20/2011 22:00
-17.46
10/20/2011 23:00
-40.20
10/21/2011 0:00
-83.69
10/21/2011 1:00
-199.02
10/21/2011 2:00
-226.31
10/21/2011 3:00
-199.23
10/21/2011 4:00
-224.72
10/21/2011 5:00
-164.44
10/21/2011 6:00
-148.00
10/21/2011 7:00
131.86
10/21/2011 8:00
21.32
10/21/2011 9:00
125.71
Docket No. ER11-1844
Exhibit No. NYI-4
Page 105 of 375
10/21/2011 10:00
101.08
10/21/2011 11:00
158.50
10/21/2011 12:00
127.98
10/21/2011 13:00
37.34
10/21/2011 14:00
68.56
10/21/2011 15:00
-59.64
10/21/2011 16:00
64.22
10/21/2011 17:00
128.12
10/21/2011 18:00
83.92
10/21/2011 19:00
101.35
10/21/2011 20:00
22.88
10/21/2011 21:00
-73.38
10/21/2011 22:00
101.24
10/21/2011 23:00
-69.39
10/22/2011 0:00
-11.73
10/22/2011 1:00
-41.37
10/22/2011 2:00
-40.36
10/22/2011 3:00
-29.96
10/22/2011 4:00
44.61
10/22/2011 5:00
7.35
10/22/2011 6:00
-70.73
10/22/2011 7:00
-176.72
10/22/2011 8:00
-175.96
10/22/2011 9:00
-147.85
10/22/2011 10:00
-122.89
10/22/2011 11:00
-31.51
10/22/2011 12:00
24.11
10/22/2011 13:00
15.91
10/22/2011 14:00
17.15
10/22/2011 15:00
150.36
10/22/2011 16:00
84.30
10/22/2011 17:00
-23.46
10/22/2011 18:00
-43.26
10/22/2011 19:00
6.22
10/22/2011 20:00
-5.11
10/22/2011 21:00
47.03
10/22/2011 22:00
42.22
10/22/2011 23:00
53.08
10/23/2011 0:00
61.43
10/23/2011 1:00
-37.42
10/23/2011 2:00
4.45
10/23/2011 3:00
-52.75
10/23/2011 4:00
-91.20
10/23/2011 5:00
-84.53
10/23/2011 6:00
-269.55
10/23/2011 7:00
-371.24
10/23/2011 8:00
-253.79
Docket No. ER11-1844
Exhibit No. NYI-4
Page 106 of 375
10/23/2011 9:00
-315.09
10/23/2011 10:00
-228.83
10/23/2011 11:00
-143.14
10/23/2011 12:00
-59.72
10/23/2011 13:00
-23.89
10/23/2011 14:00
-23.14
10/23/2011 15:00
-94.35
10/23/2011 16:00
17.24
10/23/2011 17:00
133.32
10/23/2011 18:00
131.69
10/23/2011 19:00
137.66
10/23/2011 20:00
169.40
10/23/2011 21:00
47.09
10/23/2011 22:00
172.94
10/23/2011 23:00
177.25
10/24/2011 0:00
96.32
10/24/2011 1:00
-68.32
10/24/2011 2:00
-63.85
10/24/2011 3:00
-180.28
10/24/2011 4:00
-327.72
10/24/2011 5:00
-192.24
10/24/2011 6:00
245.57
10/24/2011 7:00
385.81
10/24/2011 8:00
315.82
10/24/2011 9:00
-11.98
10/24/2011 10:00
-75.30
10/24/2011 11:00
48.58
10/24/2011 12:00
129.72
10/24/2011 13:00
53.49
10/24/2011 14:00
110.29
10/24/2011 15:00
-112.46
10/24/2011 16:00
-28.79
10/24/2011 17:00
82.84
10/24/2011 18:00
118.89
10/24/2011 19:00
145.49
10/24/2011 20:00
106.96
10/24/2011 21:00
-70.09
10/24/2011 22:00
-109.90
10/24/2011 23:00
-24.89
10/25/2011 0:00
-92.03
10/25/2011 1:00
-61.95
10/25/2011 2:00
49.73
10/25/2011 3:00
39.00
10/25/2011 4:00
56.79
10/25/2011 5:00
12.10
10/25/2011 6:00
-241.97
10/25/2011 7:00
-189.37
Docket No. ER11-1844
Exhibit No. NYI-4
Page 107 of 375
10/25/2011 8:00
-200.40
10/25/2011 9:00
-215.17
10/25/2011 10:00
-363.15
10/25/2011 11:00
88.31
10/25/2011 12:00
13.95
10/25/2011 13:00
52.19
10/25/2011 14:00
-112.01
10/25/2011 15:00
-190.37
10/25/2011 16:00
-173.33
10/25/2011 17:00
-361.44
10/25/2011 18:00
55.98
10/25/2011 19:00
96.72
10/25/2011 20:00
81.01
10/25/2011 21:00
-2.47
10/25/2011 22:00
187.19
10/25/2011 23:00
360.32
10/26/2011 0:00
220.41
10/26/2011 1:00
256.41
10/26/2011 2:00
176.27
10/26/2011 3:00
189.01
10/26/2011 4:00
167.84
10/26/2011 5:00
19.69
10/26/2011 6:00
315.09
10/26/2011 7:00
460.38
10/26/2011 8:00
529.05
10/26/2011 9:00
317.23
10/26/2011 10:00
250.66
10/26/2011 11:00
178.23
10/26/2011 12:00
204.69
10/26/2011 13:00
130.74
10/26/2011 14:00
74.85
10/26/2011 15:00
-18.57
10/26/2011 16:00
-52.26
10/26/2011 17:00
129.91
10/26/2011 18:00
140.45
10/26/2011 19:00
526.04
10/26/2011 20:00
429.90
10/26/2011 21:00
-11.30
10/26/2011 22:00
179.77
10/26/2011 23:00
186.16
10/27/2011 0:00
270.22
10/27/2011 1:00
58.45
10/27/2011 2:00
78.26
10/27/2011 3:00
-23.29
10/27/2011 4:00
-1.92
10/27/2011 5:00
-125.40
10/27/2011 6:00
61.02
Docket No. ER11-1844
Exhibit No. NYI-4
Page 108 of 375
10/27/2011 7:00
84.85
10/27/2011 8:00
106.97
10/27/2011 9:00
4.00
10/27/2011 10:00
110.28
10/27/2011 11:00
121.55
10/27/2011 12:00
198.47
10/27/2011 13:00
77.66
10/27/2011 14:00
-66.25
10/27/2011 15:00
6.96
10/27/2011 16:00
-180.34
10/27/2011 17:00
-163.99
10/27/2011 18:00
88.37
10/27/2011 19:00
-32.60
10/27/2011 20:00
169.95
10/27/2011 21:00
47.98
10/27/2011 22:00
149.20
10/27/2011 23:00
203.66
10/28/2011 0:00
310.54
10/28/2011 1:00
244.62
10/28/2011 2:00
162.99
10/28/2011 3:00
303.54
10/28/2011 4:00
366.79
10/28/2011 5:00
237.48
10/28/2011 6:00
201.75
10/28/2011 7:00
358.70
10/28/2011 8:00
247.43
10/28/2011 9:00
281.29
10/28/2011 10:00
-19.29
10/28/2011 11:00
-9.37
10/28/2011 12:00
-37.72
10/28/2011 13:00
-57.15
10/28/2011 14:00
-167.98
10/28/2011 15:00
-162.26
10/28/2011 16:00
-110.29
10/28/2011 17:00
-2.71
10/28/2011 18:00
17.07
10/28/2011 19:00
51.45
10/28/2011 20:00
-6.96
10/28/2011 21:00
113.46
10/28/2011 22:00
259.17
10/28/2011 23:00
61.27
10/29/2011 0:00
195.42
10/29/2011 1:00
113.35
10/29/2011 2:00
-37.17
10/29/2011 3:00
-43.44
10/29/2011 4:00
18.92
10/29/2011 5:00
166.00
Docket No. ER11-1844
Exhibit No. NYI-4
Page 109 of 375
10/29/2011 6:00
84.07
10/29/2011 7:00
113.71
10/29/2011 8:00
545.89
10/29/2011 9:00
439.97
10/29/2011 10:00
399.50
10/29/2011 11:00
450.07
10/29/2011 12:00
382.68
10/29/2011 13:00
370.65
10/29/2011 14:00
261.37
10/29/2011 15:00
255.80
10/29/2011 16:00
201.41
10/29/2011 17:00
182.35
10/29/2011 18:00
291.04
10/29/2011 19:00
137.71
10/29/2011 20:00
329.85
10/29/2011 21:00
384.21
10/29/2011 22:00
351.67
10/29/2011 23:00
391.01
10/30/2011 0:00
388.96
10/30/2011 1:00
338.15
10/30/2011 2:00
383.71
10/30/2011 3:00
218.34
10/30/2011 4:00
317.74
10/30/2011 5:00
404.26
10/30/2011 6:00
505.68
10/30/2011 7:00
363.09
10/30/2011 8:00
246.82
10/30/2011 9:00
326.21
10/30/2011 10:00
111.52
10/30/2011 11:00
129.78
10/30/2011 12:00
58.39
10/30/2011 13:00
-48.48
10/30/2011 14:00
-66.20
10/30/2011 15:00
-41.04
10/30/2011 16:00
-7.64
10/30/2011 17:00
-59.75
10/30/2011 18:00
66.63
10/30/2011 19:00
32.53
10/30/2011 20:00
-77.42
10/30/2011 21:00
-74.99
10/30/2011 22:00
223.86
10/30/2011 23:00
29.56
10/31/2011 0:00
-50.49
10/31/2011 1:00
-67.25
10/31/2011 2:00
-81.93
10/31/2011 3:00
-75.51
10/31/2011 4:00
9.68
Docket No. ER11-1844
Exhibit No. NYI-4
Page 110 of 375
10/31/2011 5:00
24.63
10/31/2011 6:00
196.52
10/31/2011 7:00
345.77
10/31/2011 8:00
375.17
10/31/2011 9:00
220.22
10/31/2011 10:00
218.14
10/31/2011 11:00
225.79
10/31/2011 12:00
159.40
10/31/2011 13:00
257.47
10/31/2011 14:00
300.17
10/31/2011 15:00
267.91
10/31/2011 16:00
230.14
10/31/2011 17:00
214.76
10/31/2011 18:00
0.11
10/31/2011 19:00
283.53
10/31/2011 20:00
168.89
10/31/2011 21:00
135.59
10/31/2011 22:00
-40.20
10/31/2011 23:00
-14.65
11/1/2011 0:00
54.22
11/1/2011 1:00
-116.35
11/1/2011 2:00
-217.39
11/1/2011 3:00
-325.13
11/1/2011 4:00
-370.24
11/1/2011 5:00
-111.94
11/1/2011 6:00
142.70
11/1/2011 7:00
246.81
11/1/2011 8:00
198.47
11/1/2011 9:00
127.49
11/1/2011 10:00
64.41
11/1/2011 11:00
192.01
11/1/2011 12:00
71.51
11/1/2011 13:00
151.45
11/1/2011 14:00
98.41
11/1/2011 15:00
137.81
11/1/2011 16:00
224.10
11/1/2011 17:00
322.90
11/1/2011 18:00
212.41
11/1/2011 19:00
160.95
11/1/2011 20:00
262.42
11/1/2011 21:00
226.75
11/1/2011 22:00
-9.23
11/1/2011 23:00
138.99
11/2/2011 0:00
247.20
11/2/2011 1:00
70.51
11/2/2011 2:00
6.46
11/2/2011 3:00
31.06
Docket No. ER11-1844
Exhibit No. NYI-4
Page 111 of 375
11/2/2011 4:00
101.18
11/2/2011 5:00
219.82
11/2/2011 6:00
258.28
11/2/2011 7:00
-15.78
11/2/2011 8:00
193.53
11/2/2011 9:00
131.41
11/2/2011 10:00
-216.46
11/2/2011 11:00
-127.23
11/2/2011 12:00
-230.72
11/2/2011 13:00
-178.80
11/2/2011 14:00
-80.74
11/2/2011 15:00
-51.14
11/2/2011 16:00
84.81
11/2/2011 17:00
229.79
11/2/2011 18:00
212.16
11/2/2011 19:00
226.01
11/2/2011 20:00
336.95
11/2/2011 21:00
299.80
11/2/2011 22:00
97.57
11/2/2011 23:00
114.02
11/3/2011 0:00
131.68
11/3/2011 1:00
207.83
11/3/2011 2:00
-63.63
11/3/2011 3:00
147.80
11/3/2011 4:00
269.91
11/3/2011 5:00
265.02
11/3/2011 6:00
133.48
11/3/2011 7:00
79.53
11/3/2011 8:00
91.30
11/3/2011 9:00
107.14
11/3/2011 10:00
95.22
11/3/2011 11:00
-52.36
11/3/2011 12:00
-126.40
11/3/2011 13:00
-77.00
11/3/2011 14:00
-7.22
11/3/2011 15:00
143.12
11/3/2011 16:00
97.54
11/3/2011 17:00
100.92
11/3/2011 18:00
184.20
11/3/2011 19:00
414.97
11/3/2011 20:00
35.88
11/3/2011 21:00
143.84
11/3/2011 22:00
35.19
11/3/2011 23:00
163.92
11/4/2011 0:00
151.26
11/4/2011 1:00
220.16
11/4/2011 2:00
213.51
Docket No. ER11-1844
Exhibit No. NYI-4
Page 112 of 375
11/4/2011 3:00
140.33
11/4/2011 4:00
183.88
11/4/2011 5:00
84.21
11/4/2011 6:00
-81.38
11/4/2011 7:00
4.52
11/4/2011 8:00
-6.11
11/4/2011 9:00
-97.13
11/4/2011 10:00
-174.66
11/4/2011 11:00
-109.50
11/4/2011 12:00
-49.80
11/4/2011 13:00
-170.32
11/4/2011 14:00
-247.23
11/4/2011 15:00
-204.98
11/4/2011 16:00
-180.50
11/4/2011 17:00
95.77
11/4/2011 18:00
-130.25
11/4/2011 19:00
-226.62
11/4/2011 20:00
-314.69
11/4/2011 21:00
-149.31
11/4/2011 22:00
-173.09
11/4/2011 23:00
-18.60
11/5/2011 0:00
202.00
11/5/2011 1:00
109.92
11/5/2011 2:00
116.00
11/5/2011 3:00
14.71
11/5/2011 4:00
62.28
11/5/2011 5:00
34.16
11/5/2011 6:00
63.40
11/5/2011 7:00
-87.31
11/5/2011 8:00
-152.95
11/5/2011 9:00
-230.01
11/5/2011 10:00
-416.44
11/5/2011 11:00
-388.46
11/5/2011 12:00
-347.94
11/5/2011 13:00
-145.29
11/5/2011 14:00
-123.05
11/5/2011 15:00
0.91
11/5/2011 16:00
-74.01
11/5/2011 17:00
-192.45
11/5/2011 18:00
-256.11
11/5/2011 19:00
-226.30
11/5/2011 20:00
-173.39
11/5/2011 21:00
-209.62
11/5/2011 22:00
-218.55
11/5/2011 23:00
-172.21
11/6/2011 0:00
-165.91
11/6/2011 1:00
29.56
Docket No. ER11-1844
Exhibit No. NYI-4
Page 113 of 375
11/6/2011 2:00
294.13
11/6/2011 3:00
-123.37
11/6/2011 4:00
-176.50
11/6/2011 5:00
189.12
11/6/2011 6:00
112.03
11/6/2011 7:00
104.34
11/6/2011 8:00
-1.72
11/6/2011 9:00
-85.20
11/6/2011 10:00
-19.82
11/6/2011 11:00
-2.35
11/6/2011 12:00
17.39
11/6/2011 13:00
-223.13
11/6/2011 14:00
-221.01
11/6/2011 15:00
-114.55
11/6/2011 16:00
-58.35
11/6/2011 17:00
116.61
11/6/2011 18:00
54.53
11/6/2011 19:00
-198.18
11/6/2011 20:00
-343.99
11/6/2011 21:00
-262.19
11/6/2011 22:00
-332.18
11/6/2011 23:00
-387.57
11/7/2011 0:00
-500.58
11/7/2011 1:00
-479.20
11/7/2011 2:00
-474.27
11/7/2011 3:00
-319.48
11/7/2011 4:00
-372.80
11/7/2011 5:00
-483.91
11/7/2011 6:00
-271.76
11/7/2011 7:00
-159.75
11/7/2011 8:00
-161.81
11/7/2011 9:00
-288.34
11/7/2011 10:00
-507.21
11/7/2011 11:00
-282.96
11/7/2011 12:00
-421.48
11/7/2011 13:00
-291.49
11/7/2011 14:00
-244.86
11/7/2011 15:00
-252.73
11/7/2011 16:00
-222.51
11/7/2011 17:00
-146.77
11/7/2011 18:00
-320.50
11/7/2011 19:00
-562.93
11/7/2011 20:00
-487.57
11/7/2011 21:00
-517.71
11/7/2011 22:00
-428.20
11/7/2011 23:00
-249.68
11/8/2011 0:00
-120.91
Docket No. ER11-1844
Exhibit No. NYI-4
Page 114 of 375
11/8/2011 1:00
-2.28
11/8/2011 2:00
162.96
11/8/2011 3:00
295.58
11/8/2011 4:00
371.77
11/8/2011 5:00
184.61
11/8/2011 6:00
239.39
11/8/2011 7:00
40.64
11/8/2011 8:00
-93.08
11/8/2011 9:00
-172.14
11/8/2011 10:00
-219.20
11/8/2011 11:00
-150.87
11/8/2011 12:00
-133.95
11/8/2011 13:00
-180.91
11/8/2011 14:00
-248.22
11/8/2011 15:00
-259.29
11/8/2011 16:00
-171.81
11/8/2011 17:00
-148.13
11/8/2011 18:00
-221.14
11/8/2011 19:00
-555.14
11/8/2011 20:00
-360.08
11/8/2011 21:00
-173.66
11/8/2011 22:00
-232.79
11/8/2011 23:00
55.66
11/9/2011 0:00
8.65
11/9/2011 1:00
-64.80
11/9/2011 2:00
-81.46
11/9/2011 3:00
41.70
11/9/2011 4:00
228.45
11/9/2011 5:00
191.22
11/9/2011 6:00
172.22
11/9/2011 7:00
-73.89
11/9/2011 8:00
-90.82
11/9/2011 9:00
-150.32
11/9/2011 10:00
-177.03
11/9/2011 11:00
-191.48
11/9/2011 12:00
-182.69
11/9/2011 13:00
-70.25
11/9/2011 14:00
-23.92
11/9/2011 15:00
-82.36
11/9/2011 16:00
68.40
11/9/2011 17:00
-33.80
11/9/2011 18:00
-160.94
11/9/2011 19:00
-136.82
11/9/2011 20:00
-17.27
11/9/2011 21:00
-90.96
11/9/2011 22:00
-46.52
11/9/2011 23:00
206.18
Docket No. ER11-1844
Exhibit No. NYI-4
Page 115 of 375
11/10/2011 0:00
289.98
11/10/2011 1:00
387.60
11/10/2011 2:00
203.22
11/10/2011 3:00
242.63
11/10/2011 4:00
317.10
11/10/2011 5:00
372.39
11/10/2011 6:00
354.86
11/10/2011 7:00
116.97
11/10/2011 8:00
180.84
11/10/2011 9:00
52.70
11/10/2011 10:00
13.61
11/10/2011 11:00
111.91
11/10/2011 12:00
149.20
11/10/2011 13:00
207.61
11/10/2011 14:00
319.80
11/10/2011 15:00
314.97
11/10/2011 16:00
317.17
11/10/2011 17:00
333.65
11/10/2011 18:00
216.21
11/10/2011 19:00
98.38
11/10/2011 20:00
273.21
11/10/2011 21:00
170.08
11/10/2011 22:00
69.26
11/10/2011 23:00
264.84
11/11/2011 0:00
209.73
11/11/2011 1:00
222.59
11/11/2011 2:00
183.87
11/11/2011 3:00
166.84
11/11/2011 4:00
370.60
11/11/2011 5:00
429.32
11/11/2011 6:00
708.81
11/11/2011 7:00
511.70
11/11/2011 8:00
408.64
11/11/2011 9:00
262.60
11/11/2011 10:00
106.07
11/11/2011 11:00
355.10
11/11/2011 12:00
297.70
11/11/2011 13:00
327.34
11/11/2011 14:00
308.63
11/11/2011 15:00
303.62
11/11/2011 16:00
160.30
11/11/2011 17:00
237.42
11/11/2011 18:00
23.89
11/11/2011 19:00
-0.92
11/11/2011 20:00
-0.41
11/11/2011 21:00
249.67
11/11/2011 22:00
140.57
Docket No. ER11-1844
Exhibit No. NYI-4
Page 116 of 375
11/11/2011 23:00
301.71
11/12/2011 0:00
36.45
11/12/2011 1:00
216.63
11/12/2011 2:00
223.94
11/12/2011 3:00
177.15
11/12/2011 4:00
269.19
11/12/2011 5:00
90.04
11/12/2011 6:00
204.09
11/12/2011 7:00
62.79
11/12/2011 8:00
30.55
11/12/2011 9:00
45.06
11/12/2011 10:00
-81.49
11/12/2011 11:00
-90.74
11/12/2011 12:00
-134.88
11/12/2011 13:00
-13.26
11/12/2011 14:00
20.42
11/12/2011 15:00
104.51
11/12/2011 16:00
12.04
11/12/2011 17:00
-110.95
11/12/2011 18:00
-82.26
11/12/2011 19:00
-33.57
11/12/2011 20:00
-43.75
11/12/2011 21:00
32.26
11/12/2011 22:00
272.23
11/12/2011 23:00
202.22
11/13/2011 0:00
243.92
11/13/2011 1:00
473.52
11/13/2011 2:00
688.80
11/13/2011 3:00
689.03
11/13/2011 4:00
774.33
11/13/2011 5:00
764.61
11/13/2011 6:00
681.96
11/13/2011 7:00
649.78
11/13/2011 8:00
507.86
11/13/2011 9:00
191.47
11/13/2011 10:00
102.55
11/13/2011 11:00
113.34
11/13/2011 12:00
50.40
11/13/2011 13:00
91.79
11/13/2011 14:00
41.99
11/13/2011 15:00
143.66
11/13/2011 16:00
136.19
11/13/2011 17:00
135.76
11/13/2011 18:00
4.42
11/13/2011 19:00
127.68
11/13/2011 20:00
93.84
11/13/2011 21:00
17.44
Docket No. ER11-1844
Exhibit No. NYI-4
Page 117 of 375
11/13/2011 22:00
4.04
11/13/2011 23:00
20.88
11/14/2011 0:00
216.74
11/14/2011 1:00
337.14
11/14/2011 2:00
460.07
11/14/2011 3:00
538.61
11/14/2011 4:00
561.41
11/14/2011 5:00
350.34
11/14/2011 6:00
191.74
11/14/2011 7:00
85.18
11/14/2011 8:00
97.19
11/14/2011 9:00
183.35
11/14/2011 10:00
209.15
11/14/2011 11:00
-140.15
11/14/2011 12:00
-131.81
11/14/2011 13:00
-163.62
11/14/2011 14:00
-108.57
11/14/2011 15:00
-193.50
11/14/2011 16:00
-401.09
11/14/2011 17:00
-232.74
11/14/2011 18:00
-176.25
11/14/2011 19:00
-379.52
11/14/2011 20:00
-214.12
11/14/2011 21:00
-196.32
11/14/2011 22:00
-124.24
11/14/2011 23:00
-63.42
11/15/2011 0:00
-92.16
11/15/2011 1:00
71.24
11/15/2011 2:00
26.68
11/15/2011 3:00
162.82
11/15/2011 4:00
112.69
11/15/2011 5:00
68.50
11/15/2011 6:00
108.52
11/15/2011 7:00
-89.98
11/15/2011 8:00
29.95
11/15/2011 9:00
73.59
11/15/2011 10:00
-7.63
11/15/2011 11:00
-199.26
11/15/2011 12:00
-201.89
11/15/2011 13:00
-251.38
11/15/2011 14:00
-113.97
11/15/2011 15:00
-53.75
11/15/2011 16:00
-267.32
11/15/2011 17:00
-299.71
11/15/2011 18:00
-518.26
11/15/2011 19:00
-486.54
11/15/2011 20:00
-318.63
Docket No. ER11-1844
Exhibit No. NYI-4
Page 118 of 375
11/15/2011 21:00
-90.80
11/15/2011 22:00
2.85
11/15/2011 23:00
178.18
11/16/2011 0:00
60.60
11/16/2011 1:00
79.65
11/16/2011 2:00
174.36
11/16/2011 3:00
303.19
11/16/2011 4:00
216.24
11/16/2011 5:00
43.58
11/16/2011 6:00
0.15
11/16/2011 7:00
-92.89
11/16/2011 8:00
-70.87
11/16/2011 9:00
-72.74
11/16/2011 10:00
-142.48
11/16/2011 11:00
-209.09
11/16/2011 12:00
-234.26
11/16/2011 13:00
-279.63
11/16/2011 14:00
-173.29
11/16/2011 15:00
-150.59
11/16/2011 16:00
-122.22
11/16/2011 17:00
-257.23
11/16/2011 18:00
-381.54
11/16/2011 19:00
-619.05
11/16/2011 20:00
-539.37
11/16/2011 21:00
-545.67
11/16/2011 22:00
-608.31
11/16/2011 23:00
-422.76
11/17/2011 0:00
-127.90
11/17/2011 1:00
73.48
11/17/2011 2:00
40.92
11/17/2011 3:00
137.10
11/17/2011 4:00
59.06
11/17/2011 5:00
-72.62
11/17/2011 6:00
-93.03
11/17/2011 7:00
-86.11
11/17/2011 8:00
161.66
11/17/2011 9:00
114.07
11/17/2011 10:00
2.57
11/17/2011 11:00
87.21
11/17/2011 12:00
-82.31
11/17/2011 13:00
-147.64
11/17/2011 14:00
-29.85
11/17/2011 15:00
-98.89
11/17/2011 16:00
149.76
11/17/2011 17:00
-59.70
11/17/2011 18:00
-124.84
11/17/2011 19:00
-39.51
Docket No. ER11-1844
Exhibit No. NYI-4
Page 119 of 375
11/17/2011 20:00
-103.49
11/17/2011 21:00
-234.20
11/17/2011 22:00
-513.92
11/17/2011 23:00
-306.81
11/18/2011 0:00
-32.19
11/18/2011 1:00
108.22
11/18/2011 2:00
166.56
11/18/2011 3:00
179.82
11/18/2011 4:00
291.98
11/18/2011 5:00
477.73
11/18/2011 6:00
594.60
11/18/2011 7:00
373.00
11/18/2011 8:00
169.05
11/18/2011 9:00
74.16
11/18/2011 10:00
-148.26
11/18/2011 11:00
-205.24
11/18/2011 12:00
-182.84
11/18/2011 13:00
-195.28
11/18/2011 14:00
-43.91
11/18/2011 15:00
217.97
11/18/2011 16:00
65.96
11/18/2011 17:00
-350.82
11/18/2011 18:00
-52.41
11/18/2011 19:00
28.36
11/18/2011 20:00
-19.69
11/18/2011 21:00
16.45
11/18/2011 22:00
-103.76
11/18/2011 23:00
109.64
11/19/2011 0:00
327.80
11/19/2011 1:00
330.46
11/19/2011 2:00
431.80
11/19/2011 3:00
437.37
11/19/2011 4:00
214.80
11/19/2011 5:00
176.10
11/19/2011 6:00
220.99
11/19/2011 7:00
182.49
11/19/2011 8:00
143.11
11/19/2011 9:00
-30.35
11/19/2011 10:00
-53.54
11/19/2011 11:00
-185.70
11/19/2011 12:00
-41.13
11/19/2011 13:00
-70.31
11/19/2011 14:00
-87.01
11/19/2011 15:00
-26.98
11/19/2011 16:00
14.62
11/19/2011 17:00
123.16
11/19/2011 18:00
175.76
Docket No. ER11-1844
Exhibit No. NYI-4
Page 120 of 375
11/19/2011 19:00
77.38
11/19/2011 20:00
117.58
11/19/2011 21:00
75.96
11/19/2011 22:00
43.88
11/19/2011 23:00
225.83
11/20/2011 0:00
628.79
11/20/2011 1:00
714.78
11/20/2011 2:00
725.54
11/20/2011 3:00
702.29
11/20/2011 4:00
743.91
11/20/2011 5:00
630.34
11/20/2011 6:00
582.54
11/20/2011 7:00
639.57
11/20/2011 8:00
474.06
11/20/2011 9:00
102.38
11/20/2011 10:00
24.88
11/20/2011 11:00
111.91
11/20/2011 12:00
56.69
11/20/2011 13:00
75.17
11/20/2011 14:00
-22.00
11/20/2011 15:00
94.73
11/20/2011 16:00
14.98
11/20/2011 17:00
71.23
11/20/2011 18:00
114.24
11/20/2011 19:00
132.25
11/20/2011 20:00
151.93
11/20/2011 21:00
145.62
11/20/2011 22:00
54.39
11/20/2011 23:00
-17.54
11/21/2011 0:00
173.36
11/21/2011 1:00
170.13
11/21/2011 2:00
190.75
11/21/2011 3:00
210.14
11/21/2011 4:00
138.85
11/21/2011 5:00
44.29
11/21/2011 6:00
95.65
11/21/2011 7:00
-225.68
11/21/2011 8:00
-80.08
11/21/2011 9:00
-286.63
11/21/2011 10:00
-335.64
11/21/2011 11:00
-257.85
11/21/2011 12:00
-245.31
11/21/2011 13:00
-228.08
11/21/2011 14:00
-159.38
11/21/2011 15:00
-95.20
11/21/2011 16:00
86.54
11/21/2011 17:00
-34.23
Docket No. ER11-1844
Exhibit No. NYI-4
Page 121 of 375
11/21/2011 18:00
-144.58
11/21/2011 19:00
-70.36
11/21/2011 20:00
-162.69
11/21/2011 21:00
-172.56
11/21/2011 22:00
-308.79
11/21/2011 23:00
-1.51
11/22/2011 0:00
126.09
11/22/2011 1:00
71.86
11/22/2011 2:00
149.93
11/22/2011 3:00
92.08
11/22/2011 4:00
182.76
11/22/2011 5:00
64.82
11/22/2011 6:00
65.33
11/22/2011 7:00
-254.61
11/22/2011 8:00
-180.26
11/22/2011 9:00
-155.38
11/22/2011 10:00
-99.01
11/22/2011 11:00
-105.87
11/22/2011 12:00
-30.46
11/22/2011 13:00
-23.76
11/22/2011 14:00
-67.30
11/22/2011 15:00
-89.99
11/22/2011 16:00
93.99
11/22/2011 17:00
19.45
11/22/2011 18:00
-47.28
11/22/2011 19:00
-233.29
11/22/2011 20:00
-305.16
11/22/2011 21:00
-172.04
11/22/2011 22:00
-220.57
11/22/2011 23:00
101.06
11/23/2011 0:00
-45.03
11/23/2011 1:00
-2.20
11/23/2011 2:00
-41.57
11/23/2011 3:00
121.02
11/23/2011 4:00
41.30
11/23/2011 5:00
-58.10
11/23/2011 6:00
-165.55
11/23/2011 7:00
-236.84
11/23/2011 8:00
-267.23
11/23/2011 9:00
-219.59
11/23/2011 10:00
-214.66
11/23/2011 11:00
-242.39
11/23/2011 12:00
-192.80
11/23/2011 13:00
-119.51
11/23/2011 14:00
-133.42
11/23/2011 15:00
-203.35
11/23/2011 16:00
-40.86
Docket No. ER11-1844
Exhibit No. NYI-4
Page 122 of 375
11/23/2011 17:00
-139.02
11/23/2011 18:00
-102.83
11/23/2011 19:00
-315.57
11/23/2011 20:00
-404.47
11/23/2011 21:00
-351.46
11/23/2011 22:00
-200.73
11/23/2011 23:00
-104.71
11/24/2011 0:00
160.51
11/24/2011 1:00
384.47
11/24/2011 2:00
448.71
11/24/2011 3:00
465.58
11/24/2011 4:00
395.93
11/24/2011 5:00
533.38
11/24/2011 6:00
239.60
11/24/2011 7:00
60.36
11/24/2011 8:00
34.02
11/24/2011 9:00
-103.07
11/24/2011 10:00
-196.24
11/24/2011 11:00
-223.70
11/24/2011 12:00
-204.46
11/24/2011 13:00
-84.78
11/24/2011 14:00
-75.62
11/24/2011 15:00
-190.63
11/24/2011 16:00
-46.81
11/24/2011 17:00
-121.52
11/24/2011 18:00
-186.88
11/24/2011 19:00
-140.44
11/24/2011 20:00
-140.02
11/24/2011 21:00
27.56
11/24/2011 22:00
79.05
11/24/2011 23:00
382.93
11/25/2011 0:00
372.11
11/25/2011 1:00
265.73
11/25/2011 2:00
256.43
11/25/2011 3:00
112.32
11/25/2011 4:00
91.16
11/25/2011 5:00
185.38
11/25/2011 6:00
243.97
11/25/2011 7:00
79.77
11/25/2011 8:00
-69.66
11/25/2011 9:00
-67.87
11/25/2011 10:00
-149.62
11/25/2011 11:00
-102.34
11/25/2011 12:00
-45.72
11/25/2011 13:00
-53.87
11/25/2011 14:00
-118.23
11/25/2011 15:00
-183.55
Docket No. ER11-1844
Exhibit No. NYI-4
Page 123 of 375
11/25/2011 16:00
31.59
11/25/2011 17:00
-93.11
11/25/2011 18:00
0.89
11/25/2011 19:00
-63.73
11/25/2011 20:00
-257.41
11/25/2011 21:00
-136.13
11/25/2011 22:00
-153.64
11/25/2011 23:00
80.71
11/26/2011 0:00
360.35
11/26/2011 1:00
405.74
11/26/2011 2:00
456.54
11/26/2011 3:00
433.04
11/26/2011 4:00
421.68
11/26/2011 5:00
433.59
11/26/2011 6:00
398.42
11/26/2011 7:00
290.34
11/26/2011 8:00
351.74
11/26/2011 9:00
180.02
11/26/2011 10:00
132.64
11/26/2011 11:00
50.03
11/26/2011 12:00
-78.40
11/26/2011 13:00
-84.66
11/26/2011 14:00
-74.13
11/26/2011 15:00
-11.57
11/26/2011 16:00
87.84
11/26/2011 17:00
-90.19
11/26/2011 18:00
68.44
11/26/2011 19:00
115.16
11/26/2011 20:00
167.96
11/26/2011 21:00
203.29
11/26/2011 22:00
251.05
11/26/2011 23:00
177.09
11/27/2011 0:00
107.09
11/27/2011 1:00
98.81
11/27/2011 2:00
154.16
11/27/2011 3:00
151.54
11/27/2011 4:00
108.33
11/27/2011 5:00
86.53
11/27/2011 6:00
224.07
11/27/2011 7:00
118.39
11/27/2011 8:00
153.17
11/27/2011 9:00
41.33
11/27/2011 10:00
-168.84
11/27/2011 11:00
-175.06
11/27/2011 12:00
-173.13
11/27/2011 13:00
-239.72
11/27/2011 14:00
-157.77
Docket No. ER11-1844
Exhibit No. NYI-4
Page 124 of 375
11/27/2011 15:00
-235.05
11/27/2011 16:00
-168.95
11/27/2011 17:00
-139.72
11/27/2011 18:00
22.03
11/27/2011 19:00
-73.53
11/27/2011 20:00
-19.72
11/27/2011 21:00
-164.31
11/27/2011 22:00
-339.67
11/27/2011 23:00
-124.02
11/28/2011 0:00
-121.12
11/28/2011 1:00
23.86
11/28/2011 2:00
79.84
11/28/2011 3:00
-36.38
11/28/2011 4:00
-96.78
11/28/2011 5:00
-332.85
11/28/2011 6:00
-272.69
11/28/2011 7:00
-231.19
11/28/2011 8:00
-219.00
11/28/2011 9:00
-255.98
11/28/2011 10:00
-282.80
11/28/2011 11:00
-466.44
11/28/2011 12:00
-441.35
11/28/2011 13:00
-404.16
11/28/2011 14:00
-440.90
11/28/2011 15:00
-211.92
11/28/2011 16:00
-156.77
11/28/2011 17:00
-63.63
11/28/2011 18:00
9.27
11/28/2011 19:00
103.54
11/28/2011 20:00
85.23
11/28/2011 21:00
-171.82
11/28/2011 22:00
-297.31
11/28/2011 23:00
-143.15
11/29/2011 0:00
98.50
11/29/2011 1:00
-231.01
11/29/2011 2:00
-220.31
11/29/2011 3:00
-172.90
11/29/2011 4:00
-55.62
11/29/2011 5:00
-111.13
11/29/2011 6:00
-272.84
11/29/2011 7:00
-365.99
11/29/2011 8:00
-365.03
11/29/2011 9:00
-416.18
11/29/2011 10:00
-340.52
11/29/2011 11:00
-232.91
11/29/2011 12:00
-119.02
11/29/2011 13:00
-140.06
Docket No. ER11-1844
Exhibit No. NYI-4
Page 125 of 375
11/29/2011 14:00
-147.50
11/29/2011 15:00
-160.01
11/29/2011 16:00
-278.03
11/29/2011 17:00
-376.58
11/29/2011 18:00
-182.83
11/29/2011 19:00
-289.16
11/29/2011 20:00
-127.37
11/29/2011 21:00
-198.65
11/29/2011 22:00
-493.38
11/29/2011 23:00
-332.89
11/30/2011 0:00
-214.64
11/30/2011 1:00
-31.03
11/30/2011 2:00
83.71
11/30/2011 3:00
19.48
11/30/2011 4:00
61.68
11/30/2011 5:00
11.55
11/30/2011 6:00
212.33
11/30/2011 7:00
215.52
11/30/2011 8:00
100.01
11/30/2011 9:00
-29.68
11/30/2011 10:00
-144.77
11/30/2011 11:00
-68.14
11/30/2011 12:00
27.48
11/30/2011 13:00
45.76
11/30/2011 14:00
5.99
11/30/2011 15:00
68.36
11/30/2011 16:00
120.95
11/30/2011 17:00
175.56
11/30/2011 18:00
-57.55
11/30/2011 19:00
-147.91
11/30/2011 20:00
-46.13
11/30/2011 21:00
-177.58
11/30/2011 22:00
-230.48
11/30/2011 23:00
-177.73
12/1/2011 0:00
224.04
12/1/2011 1:00
195.34
12/1/2011 2:00
36.61
12/1/2011 3:00
203.91
12/1/2011 4:00
395.48
12/1/2011 5:00
624.82
12/1/2011 6:00
874.88
12/1/2011 7:00
472.80
12/1/2011 8:00
495.68
12/1/2011 9:00
305.16
12/1/2011 10:00
-29.61
12/1/2011 11:00
-27.03
12/1/2011 12:00
44.75
Docket No. ER11-1844
Exhibit No. NYI-4
Page 126 of 375
12/1/2011 13:00
107.57
12/1/2011 14:00
33.69
12/1/2011 15:00
166.79
12/1/2011 16:00
317.77
12/1/2011 17:00
132.13
12/1/2011 18:00
7.47
12/1/2011 19:00
-58.94
12/1/2011 20:00
253.44
12/1/2011 21:00
127.95
12/1/2011 22:00
-89.77
12/1/2011 23:00
50.50
12/2/2011 0:00
-36.76
12/2/2011 1:00
59.74
12/2/2011 2:00
247.35
12/2/2011 3:00
260.95
12/2/2011 4:00
216.73
12/2/2011 5:00
9.05
12/2/2011 6:00
265.68
12/2/2011 7:00
369.02
12/2/2011 8:00
165.93
12/2/2011 9:00
97.70
12/2/2011 10:00
28.00
12/2/2011 11:00
-142.94
12/2/2011 12:00
-187.16
12/2/2011 13:00
-256.62
12/2/2011 14:00
-232.15
12/2/2011 15:00
-176.19
12/2/2011 16:00
-220.09
12/2/2011 17:00
-300.45
12/2/2011 18:00
-137.94
12/2/2011 19:00
-170.36
12/2/2011 20:00
-74.37
12/2/2011 21:00
-25.19
12/2/2011 22:00
-339.19
12/2/2011 23:00
-291.80
12/3/2011 0:00
-447.95
12/3/2011 1:00
-585.83
12/3/2011 2:00
-548.98
12/3/2011 3:00
-391.16
12/3/2011 4:00
-313.18
12/3/2011 5:00
-281.70
12/3/2011 6:00
-319.30
12/3/2011 7:00
-236.30
12/3/2011 8:00
-288.39
12/3/2011 9:00
-347.74
12/3/2011 10:00
-390.04
12/3/2011 11:00
-287.77
Docket No. ER11-1844
Exhibit No. NYI-4
Page 127 of 375
12/3/2011 12:00
-240.58
12/3/2011 13:00
-194.55
12/3/2011 14:00
-22.78
12/3/2011 15:00
-15.80
12/3/2011 16:00
-83.87
12/3/2011 17:00
-161.16
12/3/2011 18:00
-320.21
12/3/2011 19:00
-313.01
12/3/2011 20:00
-277.99
12/3/2011 21:00
-300.21
12/3/2011 22:00
-240.61
12/3/2011 23:00
-89.90
12/4/2011 0:00
-10.95
12/4/2011 1:00
-0.27
12/4/2011 2:00
60.98
12/4/2011 3:00
161.94
12/4/2011 4:00
232.49
12/4/2011 5:00
184.38
12/4/2011 6:00
330.81
12/4/2011 7:00
254.14
12/4/2011 8:00
322.74
12/4/2011 9:00
118.92
12/4/2011 10:00
138.81
12/4/2011 11:00
107.21
12/4/2011 12:00
-30.90
12/4/2011 13:00
-43.15
12/4/2011 14:00
33.97
12/4/2011 15:00
41.42
12/4/2011 16:00
-171.09
12/4/2011 17:00
-157.71
12/4/2011 18:00
-14.97
12/4/2011 19:00
38.61
12/4/2011 20:00
232.38
12/4/2011 21:00
278.92
12/4/2011 22:00
152.51
12/4/2011 23:00
-1.13
12/5/2011 0:00
292.13
12/5/2011 1:00
270.22
12/5/2011 2:00
363.33
12/5/2011 3:00
373.31
12/5/2011 4:00
434.66
12/5/2011 5:00
242.45
12/5/2011 6:00
327.91
12/5/2011 7:00
167.50
12/5/2011 8:00
99.02
12/5/2011 9:00
28.15
12/5/2011 10:00
-13.19
Docket No. ER11-1844
Exhibit No. NYI-4
Page 128 of 375
12/5/2011 11:00
-9.98
12/5/2011 12:00
-174.06
12/5/2011 13:00
-244.39
12/5/2011 14:00
-109.88
12/5/2011 15:00
-230.52
12/5/2011 16:00
-342.77
12/5/2011 17:00
-211.33
12/5/2011 18:00
-252.45
12/5/2011 19:00
-139.04
12/5/2011 20:00
-155.35
12/5/2011 21:00
-220.82
12/5/2011 22:00
-141.69
12/5/2011 23:00
136.24
12/6/2011 0:00
262.04
12/6/2011 1:00
-22.58
12/6/2011 2:00
-121.04
12/6/2011 3:00
-169.52
12/6/2011 4:00
-100.21
12/6/2011 5:00
-171.82
12/6/2011 6:00
-251.96
12/6/2011 7:00
-299.09
12/6/2011 8:00
-272.87
12/6/2011 9:00
-270.45
12/6/2011 10:00
-369.36
12/6/2011 11:00
-318.97
12/6/2011 12:00
-209.18
12/6/2011 13:00
-216.89
12/6/2011 14:00
-121.68
12/6/2011 15:00
-119.05
12/6/2011 16:00
-239.18
12/6/2011 17:00
-286.88
12/6/2011 18:00
-374.46
12/6/2011 19:00
-405.78
12/6/2011 20:00
-394.33
12/6/2011 21:00
-427.47
12/6/2011 22:00
-347.92
12/6/2011 23:00
-98.90
12/7/2011 0:00
85.26
12/7/2011 1:00
85.31
12/7/2011 2:00
99.02
12/7/2011 3:00
164.45
12/7/2011 4:00
149.47
12/7/2011 5:00
87.43
12/7/2011 6:00
-11.54
12/7/2011 7:00
-27.31
12/7/2011 8:00
28.19
12/7/2011 9:00
23.70
Docket No. ER11-1844
Exhibit No. NYI-4
Page 129 of 375
12/7/2011 10:00
89.65
12/7/2011 11:00
170.69
12/7/2011 12:00
219.87
12/7/2011 13:00
306.69
12/7/2011 14:00
262.27
12/7/2011 15:00
195.69
12/7/2011 16:00
256.44
12/7/2011 17:00
82.31
12/7/2011 18:00
-167.73
12/7/2011 19:00
-265.06
12/7/2011 20:00
-68.03
12/7/2011 21:00
-30.88
12/7/2011 22:00
-129.49
12/7/2011 23:00
-43.56
12/8/2011 0:00
-6.00
12/8/2011 1:00
-6.28
12/8/2011 2:00
87.66
12/8/2011 3:00
236.63
12/8/2011 4:00
301.36
12/8/2011 5:00
291.70
12/8/2011 6:00
72.31
12/8/2011 7:00
-3.46
12/8/2011 8:00
18.82
12/8/2011 9:00
-34.27
12/8/2011 10:00
-15.15
12/8/2011 11:00
15.84
12/8/2011 12:00
29.75
12/8/2011 13:00
-12.30
12/8/2011 14:00
141.27
12/8/2011 15:00
154.10
12/8/2011 16:00
221.93
12/8/2011 17:00
19.11
12/8/2011 18:00
-20.38
12/8/2011 19:00
18.44
12/8/2011 20:00
54.05
12/8/2011 21:00
66.22
12/8/2011 22:00
82.94
12/8/2011 23:00
74.96
12/9/2011 0:00
246.86
12/9/2011 1:00
186.77
12/9/2011 2:00
229.00
12/9/2011 3:00
274.22
12/9/2011 4:00
382.63
12/9/2011 5:00
293.46
12/9/2011 6:00
178.96
12/9/2011 7:00
92.67
12/9/2011 8:00
193.04
Docket No. ER11-1844
Exhibit No. NYI-4
Page 130 of 375
12/9/2011 9:00
157.78
12/9/2011 10:00
141.92
12/9/2011 11:00
214.58
12/9/2011 12:00
262.10
12/9/2011 13:00
142.01
12/9/2011 14:00
153.46
12/9/2011 15:00
170.32
12/9/2011 16:00
174.99
12/9/2011 17:00
157.92
12/9/2011 18:00
131.99
12/9/2011 19:00
47.30
12/9/2011 20:00
53.15
12/9/2011 21:00
20.84
12/9/2011 22:00
55.17
12/9/2011 23:00
21.29
12/10/2011 0:00
241.61
12/10/2011 1:00
378.02
12/10/2011 2:00
308.68
12/10/2011 3:00
294.55
12/10/2011 4:00
211.07
12/10/2011 5:00
68.83
12/10/2011 6:00
156.67
12/10/2011 7:00
150.67
12/10/2011 8:00
177.92
12/10/2011 9:00
135.58
12/10/2011 10:00
32.98
12/10/2011 11:00
114.59
12/10/2011 12:00
56.63
12/10/2011 13:00
-32.52
12/10/2011 14:00
19.27
12/10/2011 15:00
91.38
12/10/2011 16:00
197.04
12/10/2011 17:00
213.51
12/10/2011 18:00
166.55
12/10/2011 19:00
129.01
12/10/2011 20:00
157.95
12/10/2011 21:00
120.61
12/10/2011 22:00
367.48
12/10/2011 23:00
344.64
12/11/2011 0:00
344.91
12/11/2011 1:00
425.63
12/11/2011 2:00
456.24
12/11/2011 3:00
513.23
12/11/2011 4:00
385.96
12/11/2011 5:00
346.92
12/11/2011 6:00
288.26
12/11/2011 7:00
300.65
Docket No. ER11-1844
Exhibit No. NYI-4
Page 131 of 375
12/11/2011 8:00
207.78
12/11/2011 9:00
298.65
12/11/2011 10:00
212.97
12/11/2011 11:00
152.80
12/11/2011 12:00
130.58
12/11/2011 13:00
165.22
12/11/2011 14:00
226.43
12/11/2011 15:00
182.25
12/11/2011 16:00
228.02
12/11/2011 17:00
302.65
12/11/2011 18:00
246.48
12/11/2011 19:00
230.75
12/11/2011 20:00
245.97
12/11/2011 21:00
173.90
12/11/2011 22:00
439.28
12/11/2011 23:00
330.38
12/12/2011 0:00
374.34
12/12/2011 1:00
351.55
12/12/2011 2:00
400.05
12/12/2011 3:00
348.15
12/12/2011 4:00
473.33
12/12/2011 5:00
461.40
12/12/2011 6:00
368.09
12/12/2011 7:00
377.07
12/12/2011 8:00
557.50
12/12/2011 9:00
507.79
12/12/2011 10:00
506.29
12/12/2011 11:00
460.67
12/12/2011 12:00
494.27
12/12/2011 13:00
515.13
12/12/2011 14:00
492.01
12/12/2011 15:00
416.13
12/12/2011 16:00
448.00
12/12/2011 17:00
309.19
12/12/2011 18:00
243.51
12/12/2011 19:00
298.99
12/12/2011 20:00
352.44
12/12/2011 21:00
426.59
12/12/2011 22:00
319.08
12/12/2011 23:00
230.82
12/13/2011 0:00
429.64
12/13/2011 1:00
422.18
12/13/2011 2:00
465.84
12/13/2011 3:00
490.75
12/13/2011 4:00
555.06
12/13/2011 5:00
475.65
12/13/2011 6:00
484.88
Docket No. ER11-1844
Exhibit No. NYI-4
Page 132 of 375
12/13/2011 7:00
399.01
12/13/2011 8:00
324.26
12/13/2011 9:00
378.98
12/13/2011 10:00
351.65
12/13/2011 11:00
412.62
12/13/2011 12:00
377.92
12/13/2011 13:00
263.70
12/13/2011 14:00
243.34
12/13/2011 15:00
243.77
12/13/2011 16:00
160.63
12/13/2011 17:00
75.28
12/13/2011 18:00
41.08
12/13/2011 19:00
-19.27
12/13/2011 20:00
-74.00
12/13/2011 21:00
85.22
12/13/2011 22:00
211.36
12/13/2011 23:00
154.34
12/14/2011 0:00
237.38
12/14/2011 1:00
433.89
12/14/2011 2:00
513.64
12/14/2011 3:00
490.41
12/14/2011 4:00
596.56
12/14/2011 5:00
395.72
12/14/2011 6:00
261.92
12/14/2011 7:00
335.61
12/14/2011 8:00
292.00
12/14/2011 9:00
212.67
12/14/2011 10:00
360.38
12/14/2011 11:00
458.63
12/14/2011 12:00
476.31
12/14/2011 13:00
415.02
12/14/2011 14:00
372.86
12/14/2011 15:00
410.98
12/14/2011 16:00
321.86
12/14/2011 17:00
151.95
12/14/2011 18:00
261.16
12/14/2011 19:00
234.39
12/14/2011 20:00
-19.52
12/14/2011 21:00
55.44
12/14/2011 22:00
58.46
12/14/2011 23:00
96.65
12/15/2011 0:00
373.75
12/15/2011 1:00
487.57
12/15/2011 2:00
358.45
12/15/2011 3:00
345.12
12/15/2011 4:00
420.38
12/15/2011 5:00
274.81
Docket No. ER11-1844
Exhibit No. NYI-4
Page 133 of 375
12/15/2011 6:00
146.65
12/15/2011 7:00
0.99
12/15/2011 8:00
-105.02
12/15/2011 9:00
-157.00
12/15/2011 10:00
-155.85
12/15/2011 11:00
-91.80
12/15/2011 12:00
-35.34
12/15/2011 13:00
-112.10
12/15/2011 14:00
-187.55
12/15/2011 15:00
-69.77
12/15/2011 16:00
-323.53
12/15/2011 17:00
-694.94
12/15/2011 18:00
-335.79
12/15/2011 19:00
-245.12
12/15/2011 20:00
-192.17
12/15/2011 21:00
-262.68
12/15/2011 22:00
-280.04
12/15/2011 23:00
-109.55
12/16/2011 0:00
91.65
12/16/2011 1:00
46.47
12/16/2011 2:00
187.15
12/16/2011 3:00
169.00
12/16/2011 4:00
334.79
12/16/2011 5:00
95.56
12/16/2011 6:00
-162.50
12/16/2011 7:00
-123.61
12/16/2011 8:00
-129.35
12/16/2011 9:00
-179.04
12/16/2011 10:00
-79.30
12/16/2011 11:00
153.76
12/16/2011 12:00
155.71
12/16/2011 13:00
175.74
12/16/2011 14:00
201.08
12/16/2011 15:00
210.33
12/16/2011 16:00
354.24
12/16/2011 17:00
427.04
12/16/2011 18:00
352.85
12/16/2011 19:00
186.98
12/16/2011 20:00
93.91
12/16/2011 21:00
118.97
12/16/2011 22:00
294.82
12/16/2011 23:00
446.13
12/17/2011 0:00
594.83
12/17/2011 1:00
576.53
12/17/2011 2:00
602.28
12/17/2011 3:00
533.40
12/17/2011 4:00
343.25
Docket No. ER11-1844
Exhibit No. NYI-4
Page 134 of 375
12/17/2011 5:00
274.80
12/17/2011 6:00
258.11
12/17/2011 7:00
258.57
12/17/2011 8:00
8.10
12/17/2011 9:00
-41.09
12/17/2011 10:00
-87.93
12/17/2011 11:00
-36.21
12/17/2011 12:00
99.87
12/17/2011 13:00
92.57
12/17/2011 14:00
-8.13
12/17/2011 15:00
-96.41
12/17/2011 16:00
-90.62
12/17/2011 17:00
15.47
12/17/2011 18:00
-231.73
12/17/2011 19:00
-245.71
12/17/2011 20:00
-149.24
12/17/2011 21:00
-31.88
12/17/2011 22:00
173.93
12/17/2011 23:00
220.74
12/18/2011 0:00
541.60
12/18/2011 1:00
763.52
12/18/2011 2:00
801.37
12/18/2011 3:00
787.55
12/18/2011 4:00
647.36
12/18/2011 5:00
640.85
12/18/2011 6:00
579.65
12/18/2011 7:00
634.04
12/18/2011 8:00
461.40
12/18/2011 9:00
279.93
12/18/2011 10:00
307.66
12/18/2011 11:00
265.79
12/18/2011 12:00
304.92
12/18/2011 13:00
402.76
12/18/2011 14:00
495.21
12/18/2011 15:00
277.14
12/18/2011 16:00
164.24
12/18/2011 17:00
179.06
12/18/2011 18:00
155.51
12/18/2011 19:00
114.49
12/18/2011 20:00
223.84
12/18/2011 21:00
-1.33
12/18/2011 22:00
69.80
12/18/2011 23:00
-48.59
12/19/2011 0:00
333.39
12/19/2011 1:00
410.12
12/19/2011 2:00
383.95
12/19/2011 3:00
492.51
Docket No. ER11-1844
Exhibit No. NYI-4
Page 135 of 375
12/19/2011 4:00
485.95
12/19/2011 5:00
606.31
12/19/2011 6:00
622.57
12/19/2011 7:00
620.61
12/19/2011 8:00
419.61
12/19/2011 9:00
34.20
12/19/2011 10:00
322.02
12/19/2011 11:00
287.14
12/19/2011 12:00
330.68
12/19/2011 13:00
167.21
12/19/2011 14:00
429.90
12/19/2011 15:00
305.45
12/19/2011 16:00
278.31
12/19/2011 17:00
245.09
12/19/2011 18:00
338.74
12/19/2011 19:00
127.46
12/19/2011 20:00
67.26
12/19/2011 21:00
29.15
12/19/2011 22:00
174.50
12/19/2011 23:00
493.69
12/20/2011 0:00
284.69
12/20/2011 1:00
286.94
12/20/2011 2:00
304.63
12/20/2011 3:00
185.66
12/20/2011 4:00
221.69
12/20/2011 5:00
260.83
12/20/2011 6:00
424.11
12/20/2011 7:00
584.97
12/20/2011 8:00
401.84
12/20/2011 9:00
121.29
12/20/2011 10:00
179.77
12/20/2011 11:00
122.79
12/20/2011 12:00
115.59
12/20/2011 13:00
473.57
12/20/2011 14:00
81.91
12/20/2011 15:00
270.66
12/20/2011 16:00
148.16
12/20/2011 17:00
-72.71
12/20/2011 18:00
-113.80
12/20/2011 19:00
-79.36
12/20/2011 20:00
49.13
12/20/2011 21:00
288.20
12/20/2011 22:00
291.35
12/20/2011 23:00
280.42
12/21/2011 0:00
437.87
12/21/2011 1:00
553.45
12/21/2011 2:00
556.72
Docket No. ER11-1844
Exhibit No. NYI-4
Page 136 of 375
12/21/2011 3:00
432.44
12/21/2011 4:00
299.09
12/21/2011 5:00
93.76
12/21/2011 6:00
299.13
12/21/2011 7:00
264.01
12/21/2011 8:00
277.23
12/21/2011 9:00
328.27
12/21/2011 10:00
387.52
12/21/2011 11:00
594.40
12/21/2011 12:00
394.22
12/21/2011 13:00
579.70
12/21/2011 14:00
476.04
12/21/2011 15:00
573.50
12/21/2011 16:00
313.73
12/21/2011 17:00
83.61
12/21/2011 18:00
29.12
12/21/2011 19:00
87.46
12/21/2011 20:00
158.22
12/21/2011 21:00
-17.18
12/21/2011 22:00
89.83
12/21/2011 23:00
269.64
12/22/2011 0:00
152.63
12/22/2011 1:00
258.85
12/22/2011 2:00
144.14
12/22/2011 3:00
300.46
12/22/2011 4:00
270.47
12/22/2011 5:00
125.59
12/22/2011 6:00
19.44
12/22/2011 7:00
163.32
12/22/2011 8:00
114.88
12/22/2011 9:00
119.86
12/22/2011 10:00
44.28
12/22/2011 11:00
125.55
12/22/2011 12:00
261.71
12/22/2011 13:00
234.15
12/22/2011 14:00
282.68
12/22/2011 15:00
254.68
12/22/2011 16:00
220.45
12/22/2011 17:00
44.41
12/22/2011 18:00
241.16
12/22/2011 19:00
225.60
12/22/2011 20:00
197.50
12/22/2011 21:00
-170.80
12/22/2011 22:00
-50.65
12/22/2011 23:00
123.00
12/23/2011 0:00
193.87
12/23/2011 1:00
197.54
Docket No. ER11-1844
Exhibit No. NYI-4
Page 137 of 375
12/23/2011 2:00
208.62
12/23/2011 3:00
154.92
12/23/2011 4:00
180.57
12/23/2011 5:00
46.49
12/23/2011 6:00
86.50
12/23/2011 7:00
108.70
12/23/2011 8:00
55.32
12/23/2011 9:00
19.91
12/23/2011 10:00
20.83
12/23/2011 11:00
88.67
12/23/2011 12:00
132.48
12/23/2011 13:00
260.57
12/23/2011 14:00
279.10
12/23/2011 15:00
114.16
12/23/2011 16:00
274.67
12/23/2011 17:00
96.90
12/23/2011 18:00
81.49
12/23/2011 19:00
13.87
12/23/2011 20:00
12.76
12/23/2011 21:00
18.40
12/23/2011 22:00
159.40
12/23/2011 23:00
222.70
12/24/2011 0:00
153.39
12/24/2011 1:00
371.47
12/24/2011 2:00
463.12
12/24/2011 3:00
486.66
12/24/2011 4:00
499.79
12/24/2011 5:00
229.81
12/24/2011 6:00
188.33
12/24/2011 7:00
1.54
12/24/2011 8:00
-6.33
12/24/2011 9:00
-4.14
12/24/2011 10:00
7.85
12/24/2011 11:00
-4.76
12/24/2011 12:00
134.83
12/24/2011 13:00
209.10
12/24/2011 14:00
309.25
12/24/2011 15:00
197.70
12/24/2011 16:00
244.98
12/24/2011 17:00
184.82
12/24/2011 18:00
194.00
12/24/2011 19:00
187.62
12/24/2011 20:00
210.93
12/24/2011 21:00
85.86
12/24/2011 22:00
125.54
12/24/2011 23:00
199.99
12/25/2011 0:00
188.18
Docket No. ER11-1844
Exhibit No. NYI-4
Page 138 of 375
12/25/2011 1:00
217.50
12/25/2011 2:00
198.78
12/25/2011 3:00
126.95
12/25/2011 4:00
139.35
12/25/2011 5:00
319.88
12/25/2011 6:00
376.92
12/25/2011 7:00
362.12
12/25/2011 8:00
312.65
12/25/2011 9:00
272.21
12/25/2011 10:00
329.45
12/25/2011 11:00
103.04
12/25/2011 12:00
180.46
12/25/2011 13:00
201.12
12/25/2011 14:00
245.87
12/25/2011 15:00
201.58
12/25/2011 16:00
294.37
12/25/2011 17:00
314.11
12/25/2011 18:00
286.83
12/25/2011 19:00
288.50
12/25/2011 20:00
225.94
12/25/2011 21:00
53.75
12/25/2011 22:00
226.01
12/25/2011 23:00
345.57
12/26/2011 0:00
406.27
12/26/2011 1:00
589.56
12/26/2011 2:00
491.77
12/26/2011 3:00
322.32
12/26/2011 4:00
377.34
12/26/2011 5:00
369.34
12/26/2011 6:00
405.79
12/26/2011 7:00
253.27
12/26/2011 8:00
329.23
12/26/2011 9:00
303.57
12/26/2011 10:00
280.18
12/26/2011 11:00
234.30
12/26/2011 12:00
82.26
12/26/2011 13:00
40.63
12/26/2011 14:00
68.78
12/26/2011 15:00
31.89
12/26/2011 16:00
329.78
12/26/2011 17:00
530.08
12/26/2011 18:00
302.07
12/26/2011 19:00
206.77
12/26/2011 20:00
277.12
12/26/2011 21:00
143.25
12/26/2011 22:00
54.90
12/26/2011 23:00
86.08
Docket No. ER11-1844
Exhibit No. NYI-4
Page 139 of 375
12/27/2011 0:00
482.46
12/27/2011 1:00
436.99
12/27/2011 2:00
325.29
12/27/2011 3:00
344.93
12/27/2011 4:00
428.72
12/27/2011 5:00
627.99
12/27/2011 6:00
532.13
12/27/2011 7:00
572.71
12/27/2011 8:00
454.25
12/27/2011 9:00
412.01
12/27/2011 10:00
291.79
12/27/2011 11:00
339.55
12/27/2011 12:00
342.84
12/27/2011 13:00
347.92
12/27/2011 14:00
207.94
12/27/2011 15:00
141.52
12/27/2011 16:00
221.25
12/27/2011 17:00
426.41
12/27/2011 18:00
129.77
12/27/2011 19:00
229.91
12/27/2011 20:00
106.82
12/27/2011 21:00
190.91
12/27/2011 22:00
126.71
12/27/2011 23:00
94.41
12/28/2011 0:00
179.96
12/28/2011 1:00
198.28
12/28/2011 2:00
295.90
12/28/2011 3:00
318.70
12/28/2011 4:00
303.68
12/28/2011 5:00
318.02
12/28/2011 6:00
265.87
12/28/2011 7:00
420.53
12/28/2011 8:00
391.50
12/28/2011 9:00
333.17
12/28/2011 10:00
307.28
12/28/2011 11:00
395.28
12/28/2011 12:00
278.80
12/28/2011 13:00
248.68
12/28/2011 14:00
123.64
12/28/2011 15:00
149.52
12/28/2011 16:00
323.86
12/28/2011 17:00
261.96
12/28/2011 18:00
186.16
12/28/2011 19:00
260.14
12/28/2011 20:00
358.48
12/28/2011 21:00
106.24
12/28/2011 22:00
243.28
Docket No. ER11-1844
Exhibit No. NYI-4
Page 140 of 375
12/28/2011 23:00
190.27
12/29/2011 0:00
182.78
12/29/2011 1:00
130.24
12/29/2011 2:00
170.41
12/29/2011 3:00
173.18
12/29/2011 4:00
230.43
12/29/2011 5:00
506.99
12/29/2011 6:00
603.96
12/29/2011 7:00
594.04
12/29/2011 8:00
216.49
12/29/2011 9:00
154.02
12/29/2011 10:00
49.98
12/29/2011 11:00
173.44
12/29/2011 12:00
196.21
12/29/2011 13:00
89.29
12/29/2011 14:00
-68.88
12/29/2011 15:00
37.35
12/29/2011 16:00
111.04
12/29/2011 17:00
37.43
12/29/2011 18:00
312.88
12/29/2011 19:00
539.54
12/29/2011 20:00
567.73
12/29/2011 21:00
163.21
12/29/2011 22:00
277.22
12/29/2011 23:00
236.11
12/30/2011 0:00
60.46
12/30/2011 1:00
126.33
12/30/2011 2:00
138.59
12/30/2011 3:00
220.39
12/30/2011 4:00
99.82
12/30/2011 5:00
281.54
12/30/2011 6:00
89.31
12/30/2011 7:00
350.24
12/30/2011 8:00
288.41
12/30/2011 9:00
204.34
12/30/2011 10:00
124.92
12/30/2011 11:00
81.07
12/30/2011 12:00
89.06
12/30/2011 13:00
-24.87
12/30/2011 14:00
-13.08
12/30/2011 15:00
-61.54
12/30/2011 16:00
-148.81
12/30/2011 17:00
-75.04
12/30/2011 18:00
72.06
12/30/2011 19:00
223.34
12/30/2011 20:00
2.41
12/30/2011 21:00
-101.11
Docket No. ER11-1844
Exhibit No. NYI-4
Page 141 of 375
12/30/2011 22:00
-106.03
12/30/2011 23:00
165.20
12/31/2011 0:00
404.83
12/31/2011 1:00
111.74
12/31/2011 2:00
41.86
12/31/2011 3:00
28.12
12/31/2011 4:00
33.24
12/31/2011 5:00
120.47
12/31/2011 6:00
-90.58
12/31/2011 7:00
-171.32
12/31/2011 8:00
-208.86
12/31/2011 9:00
-2.77
12/31/2011 10:00
-47.90
12/31/2011 11:00
-5.74
12/31/2011 12:00
-104.01
12/31/2011 13:00
-67.06
12/31/2011 14:00
31.76
12/31/2011 15:00
90.44
12/31/2011 16:00
153.54
12/31/2011 17:00
266.09
12/31/2011 18:00
193.00
12/31/2011 19:00
174.52
12/31/2011 20:00
-48.77
12/31/2011 21:00
-130.08
12/31/2011 22:00
-133.33
12/31/2011 23:00
38.77
1/1/2012 0:00
165.40
1/1/2012 1:00
116.19
1/1/2012 2:00
62.52
1/1/2012 3:00
52.97
1/1/2012 4:00
-34.16
1/1/2012 5:00
12.62
1/1/2012 6:00
-19.97
1/1/2012 7:00
301.55
1/1/2012 8:00
212.90
1/1/2012 9:00
255.98
1/1/2012 10:00
196.29
1/1/2012 11:00
196.70
1/1/2012 12:00
183.42
1/1/2012 13:00
208.34
1/1/2012 14:00
143.02
1/1/2012 15:00
303.02
1/1/2012 16:00
117.71
1/1/2012 17:00
94.91
1/1/2012 18:00
157.95
1/1/2012 19:00
72.86
1/1/2012 20:00
214.52
Docket No. ER11-1844
Exhibit No. NYI-4
Page 142 of 375
1/1/2012 21:00
235.25
1/1/2012 22:00
325.32
1/1/2012 23:00
163.51
1/2/2012 0:00
196.35
1/2/2012 1:00
-1.46
1/2/2012 2:00
-260.03
1/2/2012 3:00
-222.37
1/2/2012 4:00
-212.81
1/2/2012 5:00
241.66
1/2/2012 6:00
339.42
1/2/2012 7:00
283.26
1/2/2012 8:00
481.60
1/2/2012 9:00
425.21
1/2/2012 10:00
349.07
1/2/2012 11:00
358.56
1/2/2012 12:00
230.34
1/2/2012 13:00
318.03
1/2/2012 14:00
233.38
1/2/2012 15:00
339.54
1/2/2012 16:00
178.72
1/2/2012 17:00
125.12
1/2/2012 18:00
161.95
1/2/2012 19:00
191.18
1/2/2012 20:00
20.50
1/2/2012 21:00
-223.47
1/2/2012 22:00
-283.71
1/2/2012 23:00
-231.70
1/3/2012 0:00
-38.09
1/3/2012 1:00
-153.21
1/3/2012 2:00
110.83
1/3/2012 3:00
-31.37
1/3/2012 4:00
48.29
1/3/2012 5:00
203.14
1/3/2012 6:00
289.73
1/3/2012 7:00
-140.45
1/3/2012 8:00
-252.00
1/3/2012 9:00
-318.12
1/3/2012 10:00
-350.23
1/3/2012 11:00
-415.11
1/3/2012 12:00
-319.11
1/3/2012 13:00
-184.47
1/3/2012 14:00
-35.56
1/3/2012 15:00
29.98
1/3/2012 16:00
-59.23
1/3/2012 17:00
-378.53
1/3/2012 18:00
-473.71
1/3/2012 19:00
-211.63
Docket No. ER11-1844
Exhibit No. NYI-4
Page 143 of 375
1/3/2012 20:00
-41.23
1/3/2012 21:00
30.23
1/3/2012 22:00
207.85
1/3/2012 23:00
209.25
1/4/2012 0:00
321.41
1/4/2012 1:00
423.78
1/4/2012 2:00
385.09
1/4/2012 3:00
309.53
1/4/2012 4:00
80.41
1/4/2012 5:00
290.72
1/4/2012 6:00
296.27
1/4/2012 7:00
135.24
1/4/2012 8:00
228.88
1/4/2012 9:00
118.48
1/4/2012 10:00
-261.65
1/4/2012 11:00
-132.29
1/4/2012 12:00
-299.65
1/4/2012 13:00
-185.01
1/4/2012 14:00
-173.94
1/4/2012 15:00
-248.62
1/4/2012 16:00
-327.66
1/4/2012 17:00
-570.38
1/4/2012 18:00
-441.27
1/4/2012 19:00
-504.10
1/4/2012 20:00
-250.35
1/4/2012 21:00
-206.20
1/4/2012 22:00
-35.00
1/4/2012 23:00
105.55
1/5/2012 0:00
-33.19
1/5/2012 1:00
-129.57
1/5/2012 2:00
115.92
1/5/2012 3:00
63.78
1/5/2012 4:00
-95.93
1/5/2012 5:00
-303.87
1/5/2012 6:00
-620.69
1/5/2012 7:00
-596.43
1/5/2012 8:00
-759.31
1/5/2012 9:00
-857.92
1/5/2012 10:00
-713.11
1/5/2012 11:00
-738.41
1/5/2012 12:00
-750.08
1/5/2012 13:00
-664.65
1/5/2012 14:00
-728.15
1/5/2012 15:00
-630.73
1/5/2012 16:00
-596.59
1/5/2012 17:00
-461.19
1/5/2012 18:00
-600.54
Docket No. ER11-1844
Exhibit No. NYI-4
Page 144 of 375
1/5/2012 19:00
-546.30
1/5/2012 20:00
-537.32
1/5/2012 21:00
-371.53
1/5/2012 22:00
-394.32
1/5/2012 23:00
-265.77
1/6/2012 0:00
41.48
1/6/2012 1:00
227.14
1/6/2012 2:00
293.59
1/6/2012 3:00
340.04
1/6/2012 4:00
230.67
1/6/2012 5:00
-70.69
1/6/2012 6:00
-149.51
1/6/2012 7:00
-244.00
1/6/2012 8:00
-384.66
1/6/2012 9:00
-382.03
1/6/2012 10:00
-590.18
1/6/2012 11:00
-598.40
1/6/2012 12:00
-898.29
1/6/2012 13:00
-891.47
1/6/2012 14:00
-781.93
1/6/2012 15:00
-708.31
1/6/2012 16:00
-460.83
1/6/2012 17:00
-625.54
1/6/2012 18:00
-671.53
1/6/2012 19:00
-638.74
1/6/2012 20:00
-560.97
1/6/2012 21:00
-364.37
1/6/2012 22:00
-184.27
1/6/2012 23:00
50.99
1/7/2012 0:00
293.67
1/7/2012 1:00
558.58
1/7/2012 2:00
558.78
1/7/2012 3:00
597.87
1/7/2012 4:00
583.88
1/7/2012 5:00
501.37
1/7/2012 6:00
457.61
1/7/2012 7:00
376.36
1/7/2012 8:00
83.65
1/7/2012 9:00
-76.35
1/7/2012 10:00
-187.75
1/7/2012 11:00
-258.35
1/7/2012 12:00
-271.69
1/7/2012 13:00
-224.94
1/7/2012 14:00
-239.93
1/7/2012 15:00
-169.44
1/7/2012 16:00
-276.01
1/7/2012 17:00
-116.20
Docket No. ER11-1844
Exhibit No. NYI-4
Page 145 of 375
1/7/2012 18:00
-157.73
1/7/2012 19:00
-196.39
1/7/2012 20:00
-169.82
1/7/2012 21:00
-22.35
1/7/2012 22:00
52.88
1/7/2012 23:00
13.23
1/8/2012 0:00
234.82
1/8/2012 1:00
311.47
1/8/2012 2:00
279.30
1/8/2012 3:00
268.42
1/8/2012 4:00
212.74
1/8/2012 5:00
206.46
1/8/2012 6:00
240.27
1/8/2012 7:00
226.56
1/8/2012 8:00
130.51
1/8/2012 9:00
50.79
1/8/2012 10:00
-51.49
1/8/2012 11:00
-11.41
1/8/2012 12:00
6.48
1/8/2012 13:00
12.72
1/8/2012 14:00
31.38
1/8/2012 15:00
53.65
1/8/2012 16:00
-52.30
1/8/2012 17:00
-276.90
1/8/2012 18:00
-188.89
1/8/2012 19:00
-304.44
1/8/2012 20:00
-132.24
1/8/2012 21:00
-212.97
1/8/2012 22:00
-164.47
1/8/2012 23:00
-59.47
1/9/2012 0:00
257.28
1/9/2012 1:00
167.72
1/9/2012 2:00
260.93
1/9/2012 3:00
187.40
1/9/2012 4:00
299.28
1/9/2012 5:00
206.79
1/9/2012 6:00
-89.11
1/9/2012 7:00
-217.78
1/9/2012 8:00
-277.86
1/9/2012 9:00
-324.28
1/9/2012 10:00
-272.22
1/9/2012 11:00
-87.05
1/9/2012 12:00
-146.73
1/9/2012 13:00
-111.14
1/9/2012 14:00
-217.33
1/9/2012 15:00
-207.74
1/9/2012 16:00
76.01
Docket No. ER11-1844
Exhibit No. NYI-4
Page 146 of 375
1/9/2012 17:00
-68.58
1/9/2012 18:00
-195.42
1/9/2012 19:00
-91.88
1/9/2012 20:00
-168.59
1/9/2012 21:00
-134.09
1/9/2012 22:00
-193.27
1/9/2012 23:00
-134.62
1/10/2012 0:00
160.31
1/10/2012 1:00
41.96
1/10/2012 2:00
-1.20
1/10/2012 3:00
-73.02
1/10/2012 4:00
-32.84
1/10/2012 5:00
-121.29
1/10/2012 6:00
-49.53
1/10/2012 7:00
67.22
1/10/2012 8:00
33.76
1/10/2012 9:00
-162.04
1/10/2012 10:00
-323.94
1/10/2012 11:00
-268.22
1/10/2012 12:00
-159.98
1/10/2012 13:00
-286.87
1/10/2012 14:00
-231.48
1/10/2012 15:00
-235.57
1/10/2012 16:00
-188.03
1/10/2012 17:00
-401.89
1/10/2012 18:00
-443.80
1/10/2012 19:00
-272.77
1/10/2012 20:00
-175.17
1/10/2012 21:00
-65.94
1/10/2012 22:00
-10.72
1/10/2012 23:00
78.48
1/11/2012 0:00
149.62
1/11/2012 1:00
209.69
1/11/2012 2:00
387.12
1/11/2012 3:00
354.72
1/11/2012 4:00
208.31
1/11/2012 5:00
128.69
1/11/2012 6:00
113.88
1/11/2012 7:00
108.79
1/11/2012 8:00
100.12
1/11/2012 9:00
-92.15
1/11/2012 10:00
-209.19
1/11/2012 11:00
-164.56
1/11/2012 12:00
-206.94
1/11/2012 13:00
-180.88
1/11/2012 14:00
-144.91
1/11/2012 15:00
-180.94
Docket No. ER11-1844
Exhibit No. NYI-4
Page 147 of 375
1/11/2012 16:00
-30.24
1/11/2012 17:00
-259.21
1/11/2012 18:00
-228.62
1/11/2012 19:00
-258.98
1/11/2012 20:00
-289.82
1/11/2012 21:00
-313.97
1/11/2012 22:00
-386.33
1/11/2012 23:00
-174.96
1/12/2012 0:00
79.65
1/12/2012 1:00
281.59
1/12/2012 2:00
371.04
1/12/2012 3:00
396.13
1/12/2012 4:00
319.06
1/12/2012 5:00
417.46
1/12/2012 6:00
275.10
1/12/2012 7:00
-120.97
1/12/2012 8:00
-113.73
1/12/2012 9:00
-123.74
1/12/2012 10:00
-157.97
1/12/2012 11:00
-169.81
1/12/2012 12:00
-240.01
1/12/2012 13:00
-327.13
1/12/2012 14:00
-269.73
1/12/2012 15:00
-295.64
1/12/2012 16:00
-125.57
1/12/2012 17:00
-277.44
1/12/2012 18:00
-492.16
1/12/2012 19:00
-384.61
1/12/2012 20:00
-527.53
1/12/2012 21:00
-483.51
1/12/2012 22:00
-399.83
1/12/2012 23:00
-343.25
1/13/2012 0:00
-351.62
1/13/2012 1:00
-357.06
1/13/2012 2:00
-165.18
1/13/2012 3:00
-132.07
1/13/2012 4:00
-29.98
1/13/2012 5:00
-104.01
1/13/2012 6:00
-254.91
1/13/2012 7:00
13.55
1/13/2012 8:00
365.03
1/13/2012 9:00
328.73
1/13/2012 10:00
425.03
1/13/2012 11:00
357.90
1/13/2012 12:00
241.35
1/13/2012 13:00
185.01
1/13/2012 14:00
-34.87
Docket No. ER11-1844
Exhibit No. NYI-4
Page 148 of 375
1/13/2012 15:00
-179.23
1/13/2012 16:00
9.00
1/13/2012 17:00
-175.24
1/13/2012 18:00
28.23
1/13/2012 19:00
29.41
1/13/2012 20:00
2.50
1/13/2012 21:00
126.85
1/13/2012 22:00
-197.48
1/13/2012 23:00
-91.95
1/14/2012 0:00
68.84
1/14/2012 1:00
327.64
1/14/2012 2:00
433.65
1/14/2012 3:00
387.48
1/14/2012 4:00
413.20
1/14/2012 5:00
324.82
1/14/2012 6:00
254.21
1/14/2012 7:00
251.11
1/14/2012 8:00
268.89
1/14/2012 9:00
227.06
1/14/2012 10:00
56.19
1/14/2012 11:00
68.96
1/14/2012 12:00
3.89
1/14/2012 13:00
86.28
1/14/2012 14:00
51.34
1/14/2012 15:00
170.55
1/14/2012 16:00
308.12
1/14/2012 17:00
165.08
1/14/2012 18:00
117.45
1/14/2012 19:00
86.36
1/14/2012 20:00
-15.67
1/14/2012 21:00
-37.10
1/14/2012 22:00
-43.17
1/14/2012 23:00
-136.27
1/15/2012 0:00
26.34
1/15/2012 1:00
119.85
1/15/2012 2:00
75.61
1/15/2012 3:00
180.09
1/15/2012 4:00
305.03
1/15/2012 5:00
253.61
1/15/2012 6:00
93.61
1/15/2012 7:00
17.29
1/15/2012 8:00
87.36
1/15/2012 9:00
109.34
1/15/2012 10:00
65.14
1/15/2012 11:00
43.47
1/15/2012 12:00
52.72
1/15/2012 13:00
21.67
Docket No. ER11-1844
Exhibit No. NYI-4
Page 149 of 375
1/15/2012 14:00
29.14
1/15/2012 15:00
9.11
1/15/2012 16:00
85.76
1/15/2012 17:00
153.05
1/15/2012 18:00
-24.63
1/15/2012 19:00
-123.02
1/15/2012 20:00
-62.00
1/15/2012 21:00
-43.91
1/15/2012 22:00
42.46
1/15/2012 23:00
86.18
1/16/2012 0:00
131.84
1/16/2012 1:00
213.96
1/16/2012 2:00
219.74
1/16/2012 3:00
213.12
1/16/2012 4:00
227.80
1/16/2012 5:00
571.09
1/16/2012 6:00
415.77
1/16/2012 7:00
449.66
1/16/2012 8:00
325.28
1/16/2012 9:00
288.92
1/16/2012 10:00
96.51
1/16/2012 11:00
76.08
1/16/2012 12:00
186.34
1/16/2012 13:00
127.95
1/16/2012 14:00
190.01
1/16/2012 15:00
143.62
1/16/2012 16:00
71.56
1/16/2012 17:00
78.93
1/16/2012 18:00
-114.44
1/16/2012 19:00
-94.42
1/16/2012 20:00
118.73
1/16/2012 21:00
25.05
1/16/2012 22:00
156.53
1/16/2012 23:00
386.31
1/17/2012 0:00
389.16
1/17/2012 1:00
407.17
1/17/2012 2:00
509.75
1/17/2012 3:00
564.48
1/17/2012 4:00
562.70
1/17/2012 5:00
388.95
1/17/2012 6:00
371.85
1/17/2012 7:00
169.28
1/17/2012 8:00
60.36
1/17/2012 9:00
28.62
1/17/2012 10:00
85.77
1/17/2012 11:00
86.41
1/17/2012 12:00
5.08
Docket No. ER11-1844
Exhibit No. NYI-4
Page 150 of 375
1/17/2012 13:00
-113.71
1/17/2012 14:00
-123.39
1/17/2012 15:00
-110.95
1/17/2012 16:00
-74.16
1/17/2012 17:00
5.47
1/17/2012 18:00
-115.58
1/17/2012 19:00
23.65
1/17/2012 20:00
46.54
1/17/2012 21:00
-138.72
1/17/2012 22:00
-67.93
1/17/2012 23:00
-119.91
1/18/2012 0:00
208.58
1/18/2012 1:00
51.31
1/18/2012 2:00
-1.50
1/18/2012 3:00
-130.80
1/18/2012 4:00
-222.72
1/18/2012 5:00
-159.95
1/18/2012 6:00
-207.97
1/18/2012 7:00
-303.64
1/18/2012 8:00
-318.99
1/18/2012 9:00
-251.19
1/18/2012 10:00
-70.26
1/18/2012 11:00
-53.79
1/18/2012 12:00
-54.23
1/18/2012 13:00
-88.58
1/18/2012 14:00
108.73
1/18/2012 15:00
253.76
1/18/2012 16:00
232.78
1/18/2012 17:00
-27.06
1/18/2012 18:00
61.03
1/18/2012 19:00
225.81
1/18/2012 20:00
316.96
1/18/2012 21:00
318.26
1/18/2012 22:00
262.99
1/18/2012 23:00
271.54
1/19/2012 0:00
483.76
1/19/2012 1:00
694.57
1/19/2012 2:00
654.77
1/19/2012 3:00
774.98
1/19/2012 4:00
604.83
1/19/2012 5:00
700.60
1/19/2012 6:00
662.81
1/19/2012 7:00
341.26
1/19/2012 8:00
364.36
1/19/2012 9:00
187.91
1/19/2012 10:00
221.74
1/19/2012 11:00
78.16
Docket No. ER11-1844
Exhibit No. NYI-4
Page 151 of 375
1/19/2012 12:00
223.91
1/19/2012 13:00
234.16
1/19/2012 14:00
231.07
1/19/2012 15:00
201.71
1/19/2012 16:00
-56.17
1/19/2012 17:00
-408.91
1/19/2012 18:00
-339.03
1/19/2012 19:00
47.37
1/19/2012 20:00
195.39
1/19/2012 21:00
238.89
1/19/2012 22:00
71.80
1/19/2012 23:00
183.98
1/20/2012 0:00
321.92
1/20/2012 1:00
452.29
1/20/2012 2:00
365.32
1/20/2012 3:00
278.69
1/20/2012 4:00
309.70
1/20/2012 5:00
197.49
1/20/2012 6:00
223.81
1/20/2012 7:00
-227.51
1/20/2012 8:00
55.57
1/20/2012 9:00
128.96
1/20/2012 10:00
154.81
1/20/2012 11:00
282.55
1/20/2012 12:00
297.29
1/20/2012 13:00
266.47
1/20/2012 14:00
285.31
1/20/2012 15:00
326.52
1/20/2012 16:00
273.73
1/20/2012 17:00
-1.31
1/20/2012 18:00
9.29
1/20/2012 19:00
336.96
1/20/2012 20:00
222.09
1/20/2012 21:00
290.25
1/20/2012 22:00
237.74
1/20/2012 23:00
268.11
1/21/2012 0:00
413.02
1/21/2012 1:00
451.29
1/21/2012 2:00
440.33
1/21/2012 3:00
336.33
1/21/2012 4:00
337.78
1/21/2012 5:00
302.68
1/21/2012 6:00
20.58
1/21/2012 7:00
192.71
1/21/2012 8:00
163.63
1/21/2012 9:00
146.71
1/21/2012 10:00
319.81
Docket No. ER11-1844
Exhibit No. NYI-4
Page 152 of 375
1/21/2012 11:00
324.91
1/21/2012 12:00
367.65
1/21/2012 13:00
132.66
1/21/2012 14:00
331.60
1/21/2012 15:00
393.26
1/21/2012 16:00
342.27
1/21/2012 17:00
31.58
1/21/2012 18:00
64.58
1/21/2012 19:00
94.87
1/21/2012 20:00
186.12
1/21/2012 21:00
222.06
1/21/2012 22:00
252.30
1/21/2012 23:00
188.55
1/22/2012 0:00
373.77
1/22/2012 1:00
413.81
1/22/2012 2:00
372.52
1/22/2012 3:00
435.59
1/22/2012 4:00
313.91
1/22/2012 5:00
42.30
1/22/2012 6:00
-117.39
1/22/2012 7:00
-137.90
1/22/2012 8:00
-68.38
1/22/2012 9:00
93.07
1/22/2012 10:00
158.17
1/22/2012 11:00
150.75
1/22/2012 12:00
218.93
1/22/2012 13:00
216.43
1/22/2012 14:00
311.53
1/22/2012 15:00
331.01
1/22/2012 16:00
349.93
1/22/2012 17:00
5.88
1/22/2012 18:00
79.80
1/22/2012 19:00
228.92
1/22/2012 20:00
256.60
1/22/2012 21:00
189.27
1/22/2012 22:00
377.00
1/22/2012 23:00
404.50
1/23/2012 0:00
477.13
1/23/2012 1:00
502.22
1/23/2012 2:00
430.98
1/23/2012 3:00
240.13
1/23/2012 4:00
203.75
1/23/2012 5:00
228.94
1/23/2012 6:00
387.74
1/23/2012 7:00
286.28
1/23/2012 8:00
229.11
1/23/2012 9:00
210.71
Docket No. ER11-1844
Exhibit No. NYI-4
Page 153 of 375
1/23/2012 10:00
208.16
1/23/2012 11:00
206.96
1/23/2012 12:00
52.82
1/23/2012 13:00
41.47
1/23/2012 14:00
64.70
1/23/2012 15:00
106.56
1/23/2012 16:00
139.61
1/23/2012 17:00
21.48
1/23/2012 18:00
256.68
1/23/2012 19:00
25.35
1/23/2012 20:00
57.58
1/23/2012 21:00
113.92
1/23/2012 22:00
-61.11
1/23/2012 23:00
79.44
1/24/2012 0:00
-86.28
1/24/2012 1:00
-157.96
1/24/2012 2:00
-123.00
1/24/2012 3:00
-106.42
1/24/2012 4:00
-255.61
1/24/2012 5:00
-368.62
1/24/2012 6:00
-216.64
1/24/2012 7:00
-185.66
1/24/2012 8:00
-92.95
1/24/2012 9:00
-269.61
1/24/2012 10:00
-267.21
1/24/2012 11:00
-288.45
1/24/2012 12:00
-328.51
1/24/2012 13:00
-267.52
1/24/2012 14:00
-131.05
1/24/2012 15:00
-131.03
1/24/2012 16:00
-224.80
1/24/2012 17:00
-250.36
1/24/2012 18:00
-145.89
1/24/2012 19:00
-54.49
1/24/2012 20:00
-95.65
1/24/2012 21:00
-142.41
1/24/2012 22:00
-130.43
1/24/2012 23:00
-78.46
1/25/2012 0:00
7.74
1/25/2012 1:00
-49.35
1/25/2012 2:00
74.09
1/25/2012 3:00
-0.43
1/25/2012 4:00
-32.43
1/25/2012 5:00
-83.00
1/25/2012 6:00
79.63
1/25/2012 7:00
-17.42
1/25/2012 8:00
-57.40
Docket No. ER11-1844
Exhibit No. NYI-4
Page 154 of 375
1/25/2012 9:00
-17.40
1/25/2012 10:00
-120.86
1/25/2012 11:00
-96.18
1/25/2012 12:00
-126.45
1/25/2012 13:00
-109.95
1/25/2012 14:00
-43.56
1/25/2012 15:00
-87.42
1/25/2012 16:00
-273.93
1/25/2012 17:00
-440.44
1/25/2012 18:00
-343.97
1/25/2012 19:00
-47.79
1/25/2012 20:00
27.88
1/25/2012 21:00
-57.95
1/25/2012 22:00
-55.73
1/25/2012 23:00
110.21
1/26/2012 0:00
300.96
1/26/2012 1:00
164.24
1/26/2012 2:00
113.97
1/26/2012 3:00
115.86
1/26/2012 4:00
102.91
1/26/2012 5:00
102.76
1/26/2012 6:00
273.75
1/26/2012 7:00
73.87
1/26/2012 8:00
159.17
1/26/2012 9:00
259.03
1/26/2012 10:00
265.95
1/26/2012 11:00
230.84
1/26/2012 12:00
141.50
1/26/2012 13:00
263.53
1/26/2012 14:00
229.62
1/26/2012 15:00
233.24
1/26/2012 16:00
91.36
1/26/2012 17:00
-183.24
1/26/2012 18:00
3.11
1/26/2012 19:00
-10.90
1/26/2012 20:00
177.35
1/26/2012 21:00
227.82
1/26/2012 22:00
8.28
1/26/2012 23:00
85.06
1/27/2012 0:00
280.61
1/27/2012 1:00
192.53
1/27/2012 2:00
315.36
1/27/2012 3:00
185.29
1/27/2012 4:00
177.71
1/27/2012 5:00
48.21
1/27/2012 6:00
16.85
1/27/2012 7:00
-33.65
Docket No. ER11-1844
Exhibit No. NYI-4
Page 155 of 375
1/27/2012 8:00
-169.20
1/27/2012 9:00
-86.93
1/27/2012 10:00
26.53
1/27/2012 11:00
-60.27
1/27/2012 12:00
-164.98
1/27/2012 13:00
-167.51
1/27/2012 14:00
-119.92
1/27/2012 15:00
-151.94
1/27/2012 16:00
-116.05
1/27/2012 17:00
-48.06
1/27/2012 18:00
-64.42
1/27/2012 19:00
-44.08
1/27/2012 20:00
-60.28
1/27/2012 21:00
-114.51
1/27/2012 22:00
-160.77
1/27/2012 23:00
96.75
1/28/2012 0:00
-45.32
1/28/2012 1:00
31.58
1/28/2012 2:00
215.77
1/28/2012 3:00
120.63
1/28/2012 4:00
27.22
1/28/2012 5:00
69.89
1/28/2012 6:00
293.76
1/28/2012 7:00
154.99
1/28/2012 8:00
143.28
1/28/2012 9:00
74.17
1/28/2012 10:00
-77.46
1/28/2012 11:00
-170.73
1/28/2012 12:00
-202.69
1/28/2012 13:00
-87.93
1/28/2012 14:00
-188.93
1/28/2012 15:00
-195.37
1/28/2012 16:00
-237.87
1/28/2012 17:00
-46.25
1/28/2012 18:00
-97.84
1/28/2012 19:00
-16.28
1/28/2012 20:00
-126.63
1/28/2012 21:00
-54.36
1/28/2012 22:00
93.13
1/28/2012 23:00
119.98
1/29/2012 0:00
-26.12
1/29/2012 1:00
72.23
1/29/2012 2:00
91.11
1/29/2012 3:00
154.15
1/29/2012 4:00
383.80
1/29/2012 5:00
422.96
1/29/2012 6:00
422.08
Docket No. ER11-1844
Exhibit No. NYI-4
Page 156 of 375
1/29/2012 7:00
457.06
1/29/2012 8:00
345.64
1/29/2012 9:00
281.32
1/29/2012 10:00
111.48
1/29/2012 11:00
-39.07
1/29/2012 12:00
-153.32
1/29/2012 13:00
-180.32
1/29/2012 14:00
-246.89
1/29/2012 15:00
-171.37
1/29/2012 16:00
-196.16
1/29/2012 17:00
-21.63
1/29/2012 18:00
45.26
1/29/2012 19:00
-0.71
1/29/2012 20:00
-217.78
1/29/2012 21:00
-299.49
1/29/2012 22:00
-230.81
1/29/2012 23:00
65.50
1/30/2012 0:00
89.14
1/30/2012 1:00
-33.70
1/30/2012 2:00
-35.91
1/30/2012 3:00
17.46
1/30/2012 4:00
-187.64
1/30/2012 5:00
-97.09
1/30/2012 6:00
300.79
1/30/2012 7:00
170.45
1/30/2012 8:00
227.34
1/30/2012 9:00
-94.55
1/30/2012 10:00
1.11
1/30/2012 11:00
-109.19
1/30/2012 12:00
-15.80
1/30/2012 13:00
-155.39
1/30/2012 14:00
-53.60
1/30/2012 15:00
-88.34
1/30/2012 16:00
30.41
1/30/2012 17:00
-350.02
1/30/2012 18:00
-268.51
1/30/2012 19:00
-189.58
1/30/2012 20:00
5.88
1/30/2012 21:00
-171.81
1/30/2012 22:00
-131.07
1/30/2012 23:00
119.17
1/31/2012 0:00
27.25
1/31/2012 1:00
-235.03
1/31/2012 2:00
-223.44
1/31/2012 3:00
-256.08
1/31/2012 4:00
-210.11
1/31/2012 5:00
-322.46
Docket No. ER11-1844
Exhibit No. NYI-4
Page 157 of 375
1/31/2012 6:00
-164.42
1/31/2012 7:00
-227.25
1/31/2012 8:00
-220.79
1/31/2012 9:00
-269.46
1/31/2012 10:00
-258.65
1/31/2012 11:00
-286.73
1/31/2012 12:00
-327.00
1/31/2012 13:00
-398.90
1/31/2012 14:00
-450.05
1/31/2012 15:00
-405.49
1/31/2012 16:00
-391.73
1/31/2012 17:00
-445.32
1/31/2012 18:00
-347.54
1/31/2012 19:00
-464.57
1/31/2012 20:00
-399.01
1/31/2012 21:00
-469.10
1/31/2012 22:00
-609.14
1/31/2012 23:00
-301.51
2/1/2012 0:00
-97.96
2/1/2012 1:00
-180.05
2/1/2012 2:00
-210.15
2/1/2012 3:00
-96.09
2/1/2012 4:00
-260.14
2/1/2012 5:00
-362.37
2/1/2012 6:00
-460.81
2/1/2012 7:00
-464.03
2/1/2012 8:00
-422.12
2/1/2012 9:00
-325.05
2/1/2012 10:00
-392.17
2/1/2012 11:00
-439.01
2/1/2012 12:00
-509.42
2/1/2012 13:00
-514.40
2/1/2012 14:00
-438.62
2/1/2012 15:00
-453.06
2/1/2012 16:00
-481.34
2/1/2012 17:00
-541.49
2/1/2012 18:00
-496.36
2/1/2012 19:00
-502.99
2/1/2012 20:00
-561.89
2/1/2012 21:00
-514.07
2/1/2012 22:00
-558.28
2/1/2012 23:00
-365.86
2/2/2012 0:00
-316.89
2/2/2012 1:00
-162.33
2/2/2012 2:00
-229.88
2/2/2012 3:00
-125.83
2/2/2012 4:00
-131.88
Docket No. ER11-1844
Exhibit No. NYI-4
Page 158 of 375
2/2/2012 5:00
-262.03
2/2/2012 6:00
-189.31
2/2/2012 7:00
-72.44
2/2/2012 8:00
-207.17
2/2/2012 9:00
-156.36
2/2/2012 10:00
-173.88
2/2/2012 11:00
-225.85
2/2/2012 12:00
-244.74
2/2/2012 13:00
-35.29
2/2/2012 14:00
28.30
2/2/2012 15:00
-100.60
2/2/2012 16:00
-128.93
2/2/2012 17:00
-348.49
2/2/2012 18:00
-370.39
2/2/2012 19:00
-282.84
2/2/2012 20:00
-308.40
2/2/2012 21:00
-150.80
2/2/2012 22:00
-183.66
2/2/2012 23:00
-199.13
2/3/2012 0:00
-236.80
2/3/2012 1:00
-182.42
2/3/2012 2:00
-110.91
2/3/2012 3:00
-141.32
2/3/2012 4:00
-214.51
2/3/2012 5:00
-275.77
2/3/2012 6:00
-150.08
2/3/2012 7:00
32.28
2/3/2012 8:00
-218.29
2/3/2012 9:00
-302.25
2/3/2012 10:00
-302.55
2/3/2012 11:00
-276.69
2/3/2012 12:00
-284.24
2/3/2012 13:00
-330.23
2/3/2012 14:00
-358.76
2/3/2012 15:00
-365.97
2/3/2012 16:00
-508.02
2/3/2012 17:00
-411.17
2/3/2012 18:00
-227.13
2/3/2012 19:00
-161.70
2/3/2012 20:00
-34.26
2/3/2012 21:00
-190.38
2/3/2012 22:00
-194.70
2/3/2012 23:00
-248.70
2/4/2012 0:00
-17.06
2/4/2012 1:00
77.39
2/4/2012 2:00
56.88
2/4/2012 3:00
170.07
Docket No. ER11-1844
Exhibit No. NYI-4
Page 159 of 375
2/4/2012 4:00
207.17
2/4/2012 5:00
108.70
2/4/2012 6:00
209.63
2/4/2012 7:00
114.90
2/4/2012 8:00
174.22
2/4/2012 9:00
118.62
2/4/2012 10:00
65.54
2/4/2012 11:00
62.99
2/4/2012 12:00
6.52
2/4/2012 13:00
-47.02
2/4/2012 14:00
-45.42
2/4/2012 15:00
-2.77
2/4/2012 16:00
7.84
2/4/2012 17:00
-5.30
2/4/2012 18:00
-107.91
2/4/2012 19:00
-20.26
2/4/2012 20:00
20.69
2/4/2012 21:00
-44.90
2/4/2012 22:00
-26.05
2/4/2012 23:00
161.66
2/5/2012 0:00
386.13
2/5/2012 1:00
312.74
2/5/2012 2:00
266.85
2/5/2012 3:00
207.32
2/5/2012 4:00
244.76
2/5/2012 5:00
207.49
2/5/2012 6:00
223.35
2/5/2012 7:00
297.60
2/5/2012 8:00
363.73
2/5/2012 9:00
411.56
2/5/2012 10:00
189.54
2/5/2012 11:00
4.47
2/5/2012 12:00
17.08
2/5/2012 13:00
6.78
2/5/2012 14:00
-18.45
2/5/2012 15:00
-9.63
2/5/2012 16:00
18.21
2/5/2012 17:00
137.20
2/5/2012 18:00
-1.81
2/5/2012 19:00
129.28
2/5/2012 20:00
240.66
2/5/2012 21:00
148.91
2/5/2012 22:00
108.47
2/5/2012 23:00
43.71
2/6/2012 0:00
169.08
2/6/2012 1:00
232.33
2/6/2012 2:00
240.80
Docket No. ER11-1844
Exhibit No. NYI-4
Page 160 of 375
2/6/2012 3:00
215.48
2/6/2012 4:00
186.65
2/6/2012 5:00
147.36
2/6/2012 6:00
195.64
2/6/2012 7:00
-20.73
2/6/2012 8:00
74.16
2/6/2012 9:00
61.06
2/6/2012 10:00
-245.32
2/6/2012 11:00
-269.18
2/6/2012 12:00
-174.21
2/6/2012 13:00
-82.56
2/6/2012 14:00
-127.89
2/6/2012 15:00
-174.23
2/6/2012 16:00
-104.16
2/6/2012 17:00
20.98
2/6/2012 18:00
-450.39
2/6/2012 19:00
-434.82
2/6/2012 20:00
-176.02
2/6/2012 21:00
-159.20
2/6/2012 22:00
-144.37
2/6/2012 23:00
-148.14
2/7/2012 0:00
189.59
2/7/2012 1:00
356.59
2/7/2012 2:00
314.41
2/7/2012 3:00
315.52
2/7/2012 4:00
160.19
2/7/2012 5:00
137.25
2/7/2012 6:00
130.21
2/7/2012 7:00
-93.60
2/7/2012 8:00
-142.40
2/7/2012 9:00
-200.87
2/7/2012 10:00
-405.94
2/7/2012 11:00
-398.55
2/7/2012 12:00
-413.53
2/7/2012 13:00
-319.76
2/7/2012 14:00
-301.60
2/7/2012 15:00
-347.37
2/7/2012 16:00
-334.57
2/7/2012 17:00
-209.52
2/7/2012 18:00
-416.34
2/7/2012 19:00
-263.85
2/7/2012 20:00
-119.44
2/7/2012 21:00
-256.55
2/7/2012 22:00
32.22
2/7/2012 23:00
103.63
2/8/2012 0:00
192.92
2/8/2012 1:00
245.09
Docket No. ER11-1844
Exhibit No. NYI-4
Page 161 of 375
2/8/2012 2:00
308.93
2/8/2012 3:00
229.69
2/8/2012 4:00
215.53
2/8/2012 5:00
289.12
2/8/2012 6:00
406.07
2/8/2012 7:00
294.22
2/8/2012 8:00
239.26
2/8/2012 9:00
225.22
2/8/2012 10:00
390.91
2/8/2012 11:00
284.65
2/8/2012 12:00
220.27
2/8/2012 13:00
268.09
2/8/2012 14:00
80.98
2/8/2012 15:00
6.16
2/8/2012 16:00
76.19
2/8/2012 17:00
-18.04
2/8/2012 18:00
11.52
2/8/2012 19:00
198.43
2/8/2012 20:00
43.61
2/8/2012 21:00
278.31
2/8/2012 22:00
-23.04
2/8/2012 23:00
-96.76
2/9/2012 0:00
229.65
2/9/2012 1:00
310.20
2/9/2012 2:00
351.40
2/9/2012 3:00
277.08
2/9/2012 4:00
162.53
2/9/2012 5:00
82.11
2/9/2012 6:00
278.78
2/9/2012 7:00
-9.54
2/9/2012 8:00
-5.36
2/9/2012 9:00
19.07
2/9/2012 10:00
-9.44
2/9/2012 11:00
-28.63
2/9/2012 12:00
142.90
2/9/2012 13:00
110.23
2/9/2012 14:00
125.23
2/9/2012 15:00
142.50
2/9/2012 16:00
157.29
2/9/2012 17:00
-139.26
2/9/2012 18:00
-91.79
2/9/2012 19:00
76.28
2/9/2012 20:00
160.88
2/9/2012 21:00
169.75
2/9/2012 22:00
9.47
2/9/2012 23:00
149.88
2/10/2012 0:00
162.16
Docket No. ER11-1844
Exhibit No. NYI-4
Page 162 of 375
2/10/2012 1:00
118.96
2/10/2012 2:00
150.27
2/10/2012 3:00
51.48
2/10/2012 4:00
99.60
2/10/2012 5:00
242.37
2/10/2012 6:00
151.74
2/10/2012 7:00
133.21
2/10/2012 8:00
159.43
2/10/2012 9:00
61.89
2/10/2012 10:00
-79.37
2/10/2012 11:00
-67.54
2/10/2012 12:00
-146.51
2/10/2012 13:00
-212.07
2/10/2012 14:00
-219.53
2/10/2012 15:00
-114.41
2/10/2012 16:00
-227.93
2/10/2012 17:00
-166.67
2/10/2012 18:00
-201.35
2/10/2012 19:00
-8.74
2/10/2012 20:00
206.45
2/10/2012 21:00
107.67
2/10/2012 22:00
-30.13
2/10/2012 23:00
97.68
2/11/2012 0:00
293.27
2/11/2012 1:00
421.30
2/11/2012 2:00
329.04
2/11/2012 3:00
227.37
2/11/2012 4:00
201.96
2/11/2012 5:00
194.66
2/11/2012 6:00
43.14
2/11/2012 7:00
380.94
2/11/2012 8:00
526.39
2/11/2012 9:00
482.65
2/11/2012 10:00
566.47
2/11/2012 11:00
345.68
2/11/2012 12:00
291.67
2/11/2012 13:00
318.95
2/11/2012 14:00
404.74
2/11/2012 15:00
341.62
2/11/2012 16:00
259.75
2/11/2012 17:00
200.18
2/11/2012 18:00
105.09
2/11/2012 19:00
291.49
2/11/2012 20:00
389.84
2/11/2012 21:00
353.45
2/11/2012 22:00
190.00
2/11/2012 23:00
286.55
Docket No. ER11-1844
Exhibit No. NYI-4
Page 163 of 375
2/12/2012 0:00
589.05
2/12/2012 1:00
526.23
2/12/2012 2:00
568.71
2/12/2012 3:00
657.99
2/12/2012 4:00
800.50
2/12/2012 5:00
822.28
2/12/2012 6:00
474.81
2/12/2012 7:00
401.44
2/12/2012 8:00
815.68
2/12/2012 9:00
630.46
2/12/2012 10:00
624.08
2/12/2012 11:00
678.31
2/12/2012 12:00
676.82
2/12/2012 13:00
516.06
2/12/2012 14:00
461.10
2/12/2012 15:00
289.23
2/12/2012 16:00
204.51
2/12/2012 17:00
318.80
2/12/2012 18:00
185.12
2/12/2012 19:00
195.23
2/12/2012 20:00
204.43
2/12/2012 21:00
201.88
2/12/2012 22:00
398.44
2/12/2012 23:00
330.12
2/13/2012 0:00
380.09
2/13/2012 1:00
550.00
2/13/2012 2:00
581.20
2/13/2012 3:00
520.56
2/13/2012 4:00
469.00
2/13/2012 5:00
336.11
2/13/2012 6:00
53.57
2/13/2012 7:00
30.97
2/13/2012 8:00
18.07
2/13/2012 9:00
-128.76
2/13/2012 10:00
-136.46
2/13/2012 11:00
-12.79
2/13/2012 12:00
96.06
2/13/2012 13:00
220.35
2/13/2012 14:00
133.52
2/13/2012 15:00
174.36
2/13/2012 16:00
190.33
2/13/2012 17:00
181.47
2/13/2012 18:00
215.84
2/13/2012 19:00
240.82
2/13/2012 20:00
288.82
2/13/2012 21:00
411.12
2/13/2012 22:00
356.09
Docket No. ER11-1844
Exhibit No. NYI-4
Page 164 of 375
2/13/2012 23:00
372.55
2/14/2012 0:00
480.62
2/14/2012 1:00
515.87
2/14/2012 2:00
497.26
2/14/2012 3:00
487.38
2/14/2012 4:00
452.32
2/14/2012 5:00
435.56
2/14/2012 6:00
385.33
2/14/2012 7:00
292.61
2/14/2012 8:00
125.92
2/14/2012 9:00
151.08
2/14/2012 10:00
19.03
2/14/2012 11:00
-63.48
2/14/2012 12:00
-115.78
2/14/2012 13:00
-270.81
2/14/2012 14:00
-112.64
2/14/2012 15:00
-9.75
2/14/2012 16:00
-109.06
2/14/2012 17:00
-224.54
2/14/2012 18:00
-310.08
2/14/2012 19:00
-52.50
2/14/2012 20:00
194.73
2/14/2012 21:00
107.60
2/14/2012 22:00
208.00
2/14/2012 23:00
202.49
2/15/2012 0:00
271.62
2/15/2012 1:00
107.55
2/15/2012 2:00
152.12
2/15/2012 3:00
309.94
2/15/2012 4:00
327.23
2/15/2012 5:00
110.05
2/15/2012 6:00
72.77
2/15/2012 7:00
80.41
2/15/2012 8:00
91.02
2/15/2012 9:00
203.15
2/15/2012 10:00
205.81
2/15/2012 11:00
307.90
2/15/2012 12:00
345.22
2/15/2012 13:00
140.28
2/15/2012 14:00
57.95
2/15/2012 15:00
94.48
2/15/2012 16:00
102.18
2/15/2012 17:00
107.34
2/15/2012 18:00
261.18
2/15/2012 19:00
168.15
2/15/2012 20:00
110.53
2/15/2012 21:00
70.98
Docket No. ER11-1844
Exhibit No. NYI-4
Page 165 of 375
2/15/2012 22:00
78.17
2/15/2012 23:00
210.69
2/16/2012 0:00
211.49
2/16/2012 1:00
77.62
2/16/2012 2:00
185.25
2/16/2012 3:00
266.42
2/16/2012 4:00
292.06
2/16/2012 5:00
357.50
2/16/2012 6:00
339.71
2/16/2012 7:00
223.33
2/16/2012 8:00
243.02
2/16/2012 9:00
57.13
2/16/2012 10:00
80.79
2/16/2012 11:00
226.55
2/16/2012 12:00
339.94
2/16/2012 13:00
341.87
2/16/2012 14:00
349.09
2/16/2012 15:00
303.04
2/16/2012 16:00
298.15
2/16/2012 17:00
422.66
2/16/2012 18:00
80.69
2/16/2012 19:00
308.30
2/16/2012 20:00
338.24
2/16/2012 21:00
201.44
2/16/2012 22:00
82.34
2/16/2012 23:00
66.65
2/17/2012 0:00
397.67
2/17/2012 1:00
350.36
2/17/2012 2:00
396.17
2/17/2012 3:00
311.80
2/17/2012 4:00
244.03
2/17/2012 5:00
309.18
2/17/2012 6:00
498.44
2/17/2012 7:00
244.03
2/17/2012 8:00
329.08
2/17/2012 9:00
339.67
2/17/2012 10:00
28.75
2/17/2012 11:00
147.18
2/17/2012 12:00
169.88
2/17/2012 13:00
91.49
2/17/2012 14:00
132.40
2/17/2012 15:00
52.80
2/17/2012 16:00
111.09
2/17/2012 17:00
164.18
2/17/2012 18:00
30.53
2/17/2012 19:00
194.60
2/17/2012 20:00
282.53
Docket No. ER11-1844
Exhibit No. NYI-4
Page 166 of 375
2/17/2012 21:00
422.42
2/17/2012 22:00
513.20
2/17/2012 23:00
548.09
2/18/2012 0:00
564.69
2/18/2012 1:00
478.88
2/18/2012 2:00
564.86
2/18/2012 3:00
579.38
2/18/2012 4:00
474.54
2/18/2012 5:00
456.97
2/18/2012 6:00
534.77
2/18/2012 7:00
580.86
2/18/2012 8:00
471.46
2/18/2012 9:00
361.83
2/18/2012 10:00
276.49
2/18/2012 11:00
282.33
2/18/2012 12:00
238.91
2/18/2012 13:00
190.22
2/18/2012 14:00
35.67
2/18/2012 15:00
91.83
2/18/2012 16:00
181.90
2/18/2012 17:00
353.59
2/18/2012 18:00
335.13
2/18/2012 19:00
447.71
2/18/2012 20:00
440.75
2/18/2012 21:00
410.42
2/18/2012 22:00
269.84
2/18/2012 23:00
446.17
2/19/2012 0:00
569.81
2/19/2012 1:00
473.52
2/19/2012 2:00
539.88
2/19/2012 3:00
613.80
2/19/2012 4:00
542.29
2/19/2012 5:00
430.57
2/19/2012 6:00
122.66
2/19/2012 7:00
156.98
2/19/2012 8:00
514.42
2/19/2012 9:00
520.31
2/19/2012 10:00
533.78
2/19/2012 11:00
611.13
2/19/2012 12:00
617.83
2/19/2012 13:00
570.90
2/19/2012 14:00
568.49
2/19/2012 15:00
557.42
2/19/2012 16:00
566.69
2/19/2012 17:00
431.49
2/19/2012 18:00
191.61
2/19/2012 19:00
274.00
Docket No. ER11-1844
Exhibit No. NYI-4
Page 167 of 375
2/19/2012 20:00
222.74
2/19/2012 21:00
559.41
2/19/2012 22:00
442.42
2/19/2012 23:00
402.96
2/20/2012 0:00
518.17
2/20/2012 1:00
467.35
2/20/2012 2:00
500.63
2/20/2012 3:00
468.23
2/20/2012 4:00
526.63
2/20/2012 5:00
604.24
2/20/2012 6:00
427.72
2/20/2012 7:00
400.64
2/20/2012 8:00
379.30
2/20/2012 9:00
484.48
2/20/2012 10:00
269.75
2/20/2012 11:00
313.17
2/20/2012 12:00
226.59
2/20/2012 13:00
105.79
2/20/2012 14:00
166.81
2/20/2012 15:00
231.61
2/20/2012 16:00
247.53
2/20/2012 17:00
277.67
2/20/2012 18:00
265.46
2/20/2012 19:00
656.31
2/20/2012 20:00
437.76
2/20/2012 21:00
330.91
2/20/2012 22:00
653.57
2/20/2012 23:00
556.77
2/21/2012 0:00
506.54
2/21/2012 1:00
432.11
2/21/2012 2:00
398.82
2/21/2012 3:00
484.97
2/21/2012 4:00
602.14
2/21/2012 5:00
735.77
2/21/2012 6:00
457.58
2/21/2012 7:00
466.05
2/21/2012 8:00
286.90
2/21/2012 9:00
124.26
2/21/2012 10:00
259.94
2/21/2012 11:00
335.17
2/21/2012 12:00
205.52
2/21/2012 13:00
171.08
2/21/2012 14:00
244.19
2/21/2012 15:00
218.19
2/21/2012 16:00
283.41
2/21/2012 17:00
356.20
2/21/2012 18:00
242.46
Docket No. ER11-1844
Exhibit No. NYI-4
Page 168 of 375
2/21/2012 19:00
54.48
2/21/2012 20:00
423.74
2/21/2012 21:00
327.69
2/21/2012 22:00
385.54
2/21/2012 23:00
450.28
2/22/2012 0:00
293.67
2/22/2012 1:00
376.10
2/22/2012 2:00
374.20
2/22/2012 3:00
351.56
2/22/2012 4:00
206.84
2/22/2012 5:00
216.46
2/22/2012 6:00
322.70
2/22/2012 7:00
359.74
2/22/2012 8:00
311.16
2/22/2012 9:00
279.18
2/22/2012 10:00
277.23
2/22/2012 11:00
351.23
2/22/2012 12:00
323.59
2/22/2012 13:00
369.14
2/22/2012 14:00
313.14
2/22/2012 15:00
306.27
2/22/2012 16:00
288.24
2/22/2012 17:00
258.81
2/22/2012 18:00
207.89
2/22/2012 19:00
203.19
2/22/2012 20:00
239.27
2/22/2012 21:00
244.17
2/22/2012 22:00
257.25
2/22/2012 23:00
445.79
2/23/2012 0:00
342.93
2/23/2012 1:00
257.98
2/23/2012 2:00
284.69
2/23/2012 3:00
357.87
2/23/2012 4:00
297.02
2/23/2012 5:00
326.61
2/23/2012 6:00
375.75
2/23/2012 7:00
151.93
2/23/2012 8:00
162.16
2/23/2012 9:00
166.36
2/23/2012 10:00
338.30
2/23/2012 11:00
356.43
2/23/2012 12:00
294.13
2/23/2012 13:00
263.79
2/23/2012 14:00
247.43
2/23/2012 15:00
282.19
2/23/2012 16:00
355.53
2/23/2012 17:00
330.42
Docket No. ER11-1844
Exhibit No. NYI-4
Page 169 of 375
2/23/2012 18:00
285.59
2/23/2012 19:00
483.15
2/23/2012 20:00
437.74
2/23/2012 21:00
269.21
2/23/2012 22:00
212.75
2/23/2012 23:00
290.61
2/24/2012 0:00
141.00
2/24/2012 1:00
-55.39
2/24/2012 2:00
3.03
2/24/2012 3:00
78.84
2/24/2012 4:00
231.95
2/24/2012 5:00
325.30
2/24/2012 6:00
245.57
2/24/2012 7:00
381.02
2/24/2012 8:00
239.22
2/24/2012 9:00
258.25
2/24/2012 10:00
220.93
2/24/2012 11:00
117.39
2/24/2012 12:00
54.80
2/24/2012 13:00
180.33
2/24/2012 14:00
173.87
2/24/2012 15:00
252.45
2/24/2012 16:00
194.93
2/24/2012 17:00
83.30
2/24/2012 18:00
75.64
2/24/2012 19:00
166.25
2/24/2012 20:00
248.97
2/24/2012 21:00
228.30
2/24/2012 22:00
189.16
2/24/2012 23:00
200.85
2/25/2012 0:00
115.11
2/25/2012 1:00
178.15
2/25/2012 2:00
165.30
2/25/2012 3:00
217.06
2/25/2012 4:00
246.16
2/25/2012 5:00
282.58
2/25/2012 6:00
460.12
2/25/2012 7:00
397.75
2/25/2012 8:00
485.52
2/25/2012 9:00
518.51
2/25/2012 10:00
441.00
2/25/2012 11:00
354.97
2/25/2012 12:00
316.56
2/25/2012 13:00
280.89
2/25/2012 14:00
292.21
2/25/2012 15:00
309.04
2/25/2012 16:00
349.26
Docket No. ER11-1844
Exhibit No. NYI-4
Page 170 of 375
2/25/2012 17:00
436.23
2/25/2012 18:00
415.20
2/25/2012 19:00
526.36
2/25/2012 20:00
483.51
2/25/2012 21:00
443.53
2/25/2012 22:00
390.44
2/25/2012 23:00
468.89
2/26/2012 0:00
502.08
2/26/2012 1:00
493.56
2/26/2012 2:00
544.39
2/26/2012 3:00
589.49
2/26/2012 4:00
481.34
2/26/2012 5:00
484.49
2/26/2012 6:00
632.74
2/26/2012 7:00
659.56
2/26/2012 8:00
675.97
2/26/2012 9:00
647.52
2/26/2012 10:00
553.28
2/26/2012 11:00
454.92
2/26/2012 12:00
471.14
2/26/2012 13:00
365.00
2/26/2012 14:00
332.73
2/26/2012 15:00
332.33
2/26/2012 16:00
430.57
2/26/2012 17:00
488.77
2/26/2012 18:00
303.52
2/26/2012 19:00
224.65
2/26/2012 20:00
343.08
2/26/2012 21:00
380.35
2/26/2012 22:00
494.26
2/26/2012 23:00
346.19
2/27/2012 0:00
208.29
2/27/2012 1:00
217.15
2/27/2012 2:00
217.73
2/27/2012 3:00
230.29
2/27/2012 4:00
262.32
2/27/2012 5:00
354.73
2/27/2012 6:00
159.06
2/27/2012 7:00
107.95
2/27/2012 8:00
193.97
2/27/2012 9:00
378.95
2/27/2012 10:00
295.51
2/27/2012 11:00
237.75
2/27/2012 12:00
125.33
2/27/2012 13:00
18.86
2/27/2012 14:00
69.07
2/27/2012 15:00
79.11
Docket No. ER11-1844
Exhibit No. NYI-4
Page 171 of 375
2/27/2012 16:00
23.37
2/27/2012 17:00
-45.32
2/27/2012 18:00
-31.58
2/27/2012 19:00
122.85
2/27/2012 20:00
269.22
2/27/2012 21:00
207.51
2/27/2012 22:00
-57.01
2/27/2012 23:00
52.79
2/28/2012 0:00
221.78
2/28/2012 1:00
188.39
2/28/2012 2:00
181.85
2/28/2012 3:00
244.21
2/28/2012 4:00
284.78
2/28/2012 5:00
369.08
2/28/2012 6:00
457.75
2/28/2012 7:00
288.22
2/28/2012 8:00
245.16
2/28/2012 9:00
302.44
2/28/2012 10:00
183.27
2/28/2012 11:00
175.19
2/28/2012 12:00
274.34
2/28/2012 13:00
174.30
2/28/2012 14:00
131.28
2/28/2012 15:00
191.08
2/28/2012 16:00
233.55
2/28/2012 17:00
404.57
2/28/2012 18:00
418.98
2/28/2012 19:00
338.82
2/28/2012 20:00
326.32
2/28/2012 21:00
227.14
2/28/2012 22:00
173.70
2/28/2012 23:00
230.68
2/29/2012 0:00
123.59
2/29/2012 1:00
210.93
2/29/2012 2:00
294.21
2/29/2012 3:00
295.55
2/29/2012 4:00
273.59
2/29/2012 5:00
342.49
2/29/2012 6:00
282.95
2/29/2012 7:00
-159.21
2/29/2012 8:00
221.50
2/29/2012 9:00
172.47
2/29/2012 10:00
-144.46
2/29/2012 11:00
-96.32
2/29/2012 12:00
-97.02
2/29/2012 13:00
85.61
2/29/2012 14:00
98.09
Docket No. ER11-1844
Exhibit No. NYI-4
Page 172 of 375
2/29/2012 15:00
251.29
2/29/2012 16:00
99.93
2/29/2012 17:00
275.51
2/29/2012 18:00
-50.74
2/29/2012 19:00
25.68
2/29/2012 20:00
267.45
2/29/2012 21:00
405.28
2/29/2012 22:00
327.02
2/29/2012 23:00
313.75
3/1/2012 0:00
529.26
3/1/2012 1:00
312.10
3/1/2012 2:00
346.56
3/1/2012 3:00
292.31
3/1/2012 4:00
249.49
3/1/2012 5:00
213.37
3/1/2012 6:00
197.17
3/1/2012 7:00
315.10
3/1/2012 8:00
185.91
3/1/2012 9:00
109.61
3/1/2012 10:00
89.50
3/1/2012 11:00
31.53
3/1/2012 12:00
121.86
3/1/2012 13:00
64.84
3/1/2012 14:00
83.05
3/1/2012 15:00
88.43
3/1/2012 16:00
113.95
3/1/2012 17:00
96.12
3/1/2012 18:00
63.14
3/1/2012 19:00
464.78
3/1/2012 20:00
357.20
3/1/2012 21:00
355.23
3/1/2012 22:00
424.38
3/1/2012 23:00
471.72
3/2/2012 0:00
549.41
3/2/2012 1:00
611.32
3/2/2012 2:00
511.01
3/2/2012 3:00
674.23
3/2/2012 4:00
618.55
3/2/2012 5:00
513.03
3/2/2012 6:00
516.19
3/2/2012 7:00
279.11
3/2/2012 8:00
134.70
3/2/2012 9:00
99.66
3/2/2012 10:00
28.45
3/2/2012 11:00
207.94
3/2/2012 12:00
119.05
3/2/2012 13:00
105.04
Docket No. ER11-1844
Exhibit No. NYI-4
Page 173 of 375
3/2/2012 14:00
202.49
3/2/2012 15:00
202.76
3/2/2012 16:00
198.35
3/2/2012 17:00
168.63
3/2/2012 18:00
131.65
3/2/2012 19:00
101.79
3/2/2012 20:00
283.96
3/2/2012 21:00
337.52
3/2/2012 22:00
283.84
3/2/2012 23:00
220.81
3/3/2012 0:00
340.31
3/3/2012 1:00
217.86
3/3/2012 2:00
260.29
3/3/2012 3:00
230.90
3/3/2012 4:00
381.30
3/3/2012 5:00
406.82
3/3/2012 6:00
282.35
3/3/2012 7:00
289.18
3/3/2012 8:00
360.98
3/3/2012 9:00
337.34
3/3/2012 10:00
61.44
3/3/2012 11:00
-18.14
3/3/2012 12:00
145.01
3/3/2012 13:00
-35.59
3/3/2012 14:00
26.99
3/3/2012 15:00
-244.72
3/3/2012 16:00
-190.36
3/3/2012 17:00
-65.97
3/3/2012 18:00
-83.66
3/3/2012 19:00
155.28
3/3/2012 20:00
215.47
3/3/2012 21:00
76.54
3/3/2012 22:00
95.44
3/3/2012 23:00
57.70
3/4/2012 0:00
196.05
3/4/2012 1:00
242.52
3/4/2012 2:00
201.59
3/4/2012 3:00
282.35
3/4/2012 4:00
297.73
3/4/2012 5:00
112.03
3/4/2012 6:00
107.79
3/4/2012 7:00
280.02
3/4/2012 8:00
304.59
3/4/2012 9:00
312.36
3/4/2012 10:00
156.49
3/4/2012 11:00
247.64
3/4/2012 12:00
61.32
Docket No. ER11-1844
Exhibit No. NYI-4
Page 174 of 375
3/4/2012 13:00
46.62
3/4/2012 14:00
22.32
3/4/2012 15:00
95.27
3/4/2012 16:00
75.11
3/4/2012 17:00
67.58
3/4/2012 18:00
121.00
3/4/2012 19:00
38.75
3/4/2012 20:00
137.05
3/4/2012 21:00
147.37
3/4/2012 22:00
114.11
3/4/2012 23:00
132.75
3/5/2012 0:00
374.56
3/5/2012 1:00
456.57
3/5/2012 2:00
266.31
3/5/2012 3:00
233.80
3/5/2012 4:00
242.50
3/5/2012 5:00
390.13
3/5/2012 6:00
440.36
3/5/2012 7:00
542.99
3/5/2012 8:00
465.32
3/5/2012 9:00
32.58
3/5/2012 10:00
-310.20
3/5/2012 11:00
-276.67
3/5/2012 12:00
-82.38
3/5/2012 13:00
-186.70
3/5/2012 14:00
-21.82
3/5/2012 15:00
184.61
3/5/2012 16:00
172.04
3/5/2012 17:00
155.47
3/5/2012 18:00
337.09
3/5/2012 19:00
303.51
3/5/2012 20:00
420.99
3/5/2012 21:00
193.99
3/5/2012 22:00
-92.22
3/5/2012 23:00
-141.07
3/6/2012 0:00
467.90
3/6/2012 1:00
222.45
3/6/2012 2:00
88.26
3/6/2012 3:00
354.71
3/6/2012 4:00
246.02
3/6/2012 5:00
202.27
3/6/2012 6:00
266.24
3/6/2012 7:00
-52.93
3/6/2012 8:00
144.93
3/6/2012 9:00
22.90
3/6/2012 10:00
-0.86
3/6/2012 11:00
206.57
Docket No. ER11-1844
Exhibit No. NYI-4
Page 175 of 375
3/6/2012 12:00
247.31
3/6/2012 13:00
-74.21
3/6/2012 14:00
-18.16
3/6/2012 15:00
18.85
3/6/2012 16:00
146.70
3/6/2012 17:00
131.21
3/6/2012 18:00
171.64
3/6/2012 19:00
285.50
3/6/2012 20:00
224.77
3/6/2012 21:00
377.93
3/6/2012 22:00
299.80
3/6/2012 23:00
186.54
3/7/2012 0:00
115.55
3/7/2012 1:00
125.64
3/7/2012 2:00
209.08
3/7/2012 3:00
339.14
3/7/2012 4:00
379.26
3/7/2012 5:00
304.78
3/7/2012 6:00
167.11
3/7/2012 7:00
-11.48
3/7/2012 8:00
1.00
3/7/2012 9:00
61.12
3/7/2012 10:00
99.96
3/7/2012 11:00
123.00
3/7/2012 12:00
107.73
3/7/2012 13:00
96.68
3/7/2012 14:00
180.88
3/7/2012 15:00
204.33
3/7/2012 16:00
189.72
3/7/2012 17:00
235.93
3/7/2012 18:00
158.80
3/7/2012 19:00
104.43
3/7/2012 20:00
138.78
3/7/2012 21:00
22.17
3/7/2012 22:00
-133.60
3/7/2012 23:00
-132.05
3/8/2012 0:00
-110.44
3/8/2012 1:00
-16.59
3/8/2012 2:00
-108.09
3/8/2012 3:00
-18.97
3/8/2012 4:00
177.02
3/8/2012 5:00
147.84
3/8/2012 6:00
-12.54
3/8/2012 7:00
77.72
3/8/2012 8:00
-214.60
3/8/2012 9:00
-535.54
3/8/2012 10:00
-297.35
Docket No. ER11-1844
Exhibit No. NYI-4
Page 176 of 375
3/8/2012 11:00
-307.04
3/8/2012 12:00
-229.13
3/8/2012 13:00
-500.07
3/8/2012 14:00
-313.10
3/8/2012 15:00
-309.64
3/8/2012 16:00
-125.25
3/8/2012 17:00
-74.53
3/8/2012 18:00
-205.40
3/8/2012 19:00
-230.59
3/8/2012 20:00
-322.07
3/8/2012 21:00
-254.30
3/8/2012 22:00
-90.45
3/8/2012 23:00
38.29
3/9/2012 0:00
-332.24
3/9/2012 1:00
-247.92
3/9/2012 2:00
-278.49
3/9/2012 3:00
-289.41
3/9/2012 4:00
-366.66
3/9/2012 5:00
-512.27
3/9/2012 6:00
-453.51
3/9/2012 7:00
-144.57
3/9/2012 8:00
-67.85
3/9/2012 9:00
-53.78
3/9/2012 10:00
154.86
3/9/2012 11:00
169.54
3/9/2012 12:00
139.08
3/9/2012 13:00
41.84
3/9/2012 14:00
-18.49
3/9/2012 15:00
-77.54
3/9/2012 16:00
-5.89
3/9/2012 17:00
117.48
3/9/2012 18:00
62.68
3/9/2012 19:00
-81.24
3/9/2012 20:00
-186.06
3/9/2012 21:00
-157.02
3/9/2012 22:00
-148.83
3/9/2012 23:00
-209.91
3/10/2012 0:00
-14.97
3/10/2012 1:00
139.54
3/10/2012 2:00
388.44
3/10/2012 3:00
425.48
3/10/2012 4:00
498.36
3/10/2012 5:00
475.11
3/10/2012 6:00
479.77
3/10/2012 7:00
242.18
3/10/2012 8:00
407.36
3/10/2012 9:00
264.40
Docket No. ER11-1844
Exhibit No. NYI-4
Page 177 of 375
3/10/2012 10:00
285.79
3/10/2012 11:00
178.80
3/10/2012 12:00
163.02
3/10/2012 13:00
456.11
3/10/2012 14:00
371.76
3/10/2012 15:00
326.93
3/10/2012 16:00
324.96
3/10/2012 17:00
400.17
3/10/2012 18:00
351.90
3/10/2012 19:00
159.59
3/10/2012 20:00
283.02
3/10/2012 21:00
372.82
3/10/2012 22:00
346.33
3/10/2012 23:00
293.12
3/11/2012 0:00
6.21
3/11/2012 1:00
-109.14
3/11/2012 2:00
132.93
3/11/2012 3:00
132.93
3/11/2012 4:00
290.51
3/11/2012 5:00
470.81
3/11/2012 6:00
449.21
3/11/2012 7:00
481.95
3/11/2012 8:00
510.04
3/11/2012 9:00
270.13
3/11/2012 10:00
156.95
3/11/2012 11:00
329.07
3/11/2012 12:00
302.66
3/11/2012 13:00
337.09
3/11/2012 14:00
487.87
3/11/2012 15:00
349.73
3/11/2012 16:00
183.50
3/11/2012 17:00
357.74
3/11/2012 18:00
358.89
3/11/2012 19:00
285.23
3/11/2012 20:00
348.29
3/11/2012 21:00
304.60
3/11/2012 22:00
162.52
3/11/2012 23:00
163.83
3/12/2012 0:00
148.87
3/12/2012 1:00
316.32
3/12/2012 2:00
408.40
3/12/2012 3:00
318.32
3/12/2012 4:00
419.73
3/12/2012 5:00
338.81
3/12/2012 6:00
496.63
3/12/2012 7:00
344.17
3/12/2012 8:00
257.50
Docket No. ER11-1844
Exhibit No. NYI-4
Page 178 of 375
3/12/2012 9:00
10.71
3/12/2012 10:00
84.94
3/12/2012 11:00
33.34
3/12/2012 12:00
55.87
3/12/2012 13:00
51.38
3/12/2012 14:00
270.65
3/12/2012 15:00
266.91
3/12/2012 16:00
322.70
3/12/2012 17:00
346.29
3/12/2012 18:00
169.15
3/12/2012 19:00
299.95
3/12/2012 20:00
102.97
3/12/2012 21:00
208.66
3/12/2012 22:00
193.61
3/12/2012 23:00
108.51
3/13/2012 0:00
-15.57
3/13/2012 1:00
174.88
3/13/2012 2:00
181.51
3/13/2012 3:00
50.96
3/13/2012 4:00
246.10
3/13/2012 5:00
45.77
3/13/2012 6:00
85.16
3/13/2012 7:00
332.72
3/13/2012 8:00
206.86
3/13/2012 9:00
96.92
3/13/2012 10:00
162.27
3/13/2012 11:00
223.97
3/13/2012 12:00
358.88
3/13/2012 13:00
413.18
3/13/2012 14:00
299.84
3/13/2012 15:00
334.44
3/13/2012 16:00
152.91
3/13/2012 17:00
243.77
3/13/2012 18:00
124.62
3/13/2012 19:00
207.51
3/13/2012 20:00
41.13
3/13/2012 21:00
91.05
3/13/2012 22:00
166.50
3/13/2012 23:00
29.39
3/14/2012 0:00
138.76
3/14/2012 1:00
-38.96
3/14/2012 2:00
21.58
3/14/2012 3:00
98.45
3/14/2012 4:00
112.28
3/14/2012 5:00
-14.73
3/14/2012 6:00
28.79
3/14/2012 7:00
237.08
Docket No. ER11-1844
Exhibit No. NYI-4
Page 179 of 375
3/14/2012 8:00
411.90
3/14/2012 9:00
319.60
3/14/2012 10:00
462.82
3/14/2012 11:00
473.49
3/14/2012 12:00
422.62
3/14/2012 13:00
324.64
3/14/2012 14:00
501.05
3/14/2012 15:00
512.20
3/14/2012 16:00
456.16
3/14/2012 17:00
422.44
3/14/2012 18:00
520.23
3/14/2012 19:00
524.54
3/14/2012 20:00
219.63
3/14/2012 21:00
125.98
3/14/2012 22:00
209.09
3/14/2012 23:00
12.69
3/15/2012 0:00
160.73
3/15/2012 1:00
211.77
3/15/2012 2:00
339.26
3/15/2012 3:00
454.08
3/15/2012 4:00
242.14
3/15/2012 5:00
154.84
3/15/2012 6:00
188.17
3/15/2012 7:00
393.79
3/15/2012 8:00
511.57
3/15/2012 9:00
391.25
3/15/2012 10:00
381.15
3/15/2012 11:00
318.25
3/15/2012 12:00
152.36
3/15/2012 13:00
119.00
3/15/2012 14:00
302.25
3/15/2012 15:00
487.37
3/15/2012 16:00
397.24
3/15/2012 17:00
502.20
3/15/2012 18:00
310.15
3/15/2012 19:00
268.93
3/15/2012 20:00
66.91
3/15/2012 21:00
200.97
3/15/2012 22:00
231.89
3/15/2012 23:00
367.60
3/16/2012 0:00
169.73
3/16/2012 1:00
218.64
3/16/2012 2:00
153.50
3/16/2012 3:00
147.95
3/16/2012 4:00
333.83
3/16/2012 5:00
171.71
3/16/2012 6:00
86.61
Docket No. ER11-1844
Exhibit No. NYI-4
Page 180 of 375
3/16/2012 7:00
154.35
3/16/2012 8:00
165.02
3/16/2012 9:00
108.23
3/16/2012 10:00
107.02
3/16/2012 11:00
59.73
3/16/2012 12:00
163.61
3/16/2012 13:00
209.05
3/16/2012 14:00
0.14
3/16/2012 15:00
147.94
3/16/2012 16:00
137.64
3/16/2012 17:00
81.22
3/16/2012 18:00
-51.95
3/16/2012 19:00
73.94
3/16/2012 20:00
111.41
3/16/2012 21:00
304.13
3/16/2012 22:00
297.63
3/16/2012 23:00
118.71
3/17/2012 0:00
-212.45
3/17/2012 1:00
-126.61
3/17/2012 2:00
-129.05
3/17/2012 3:00
-174.08
3/17/2012 4:00
-200.92
3/17/2012 5:00
-149.72
3/17/2012 6:00
-121.00
3/17/2012 7:00
-295.76
3/17/2012 8:00
-257.23
3/17/2012 9:00
-268.54
3/17/2012 10:00
-306.42
3/17/2012 11:00
-80.70
3/17/2012 12:00
-343.89
3/17/2012 13:00
-315.17
3/17/2012 14:00
-220.38
3/17/2012 15:00
-202.42
3/17/2012 16:00
-92.25
3/17/2012 17:00
-191.08
3/17/2012 18:00
-86.02
3/17/2012 19:00
-60.26
3/17/2012 20:00
-127.72
3/17/2012 21:00
-134.71
3/17/2012 22:00
-405.19
3/17/2012 23:00
-563.13
3/18/2012 0:00
-512.14
3/18/2012 1:00
-194.41
3/18/2012 2:00
-271.22
3/18/2012 3:00
-139.67
3/18/2012 4:00
-207.22
3/18/2012 5:00
-348.52
Docket No. ER11-1844
Exhibit No. NYI-4
Page 181 of 375
3/18/2012 6:00
-83.68
3/18/2012 7:00
-217.15
3/18/2012 8:00
-75.17
3/18/2012 9:00
-225.91
3/18/2012 10:00
-265.21
3/18/2012 11:00
-332.14
3/18/2012 12:00
-226.86
3/18/2012 13:00
-184.74
3/18/2012 14:00
-165.75
3/18/2012 15:00
-255.65
3/18/2012 16:00
-200.54
3/18/2012 17:00
-161.33
3/18/2012 18:00
-12.84
3/18/2012 19:00
125.90
3/18/2012 20:00
47.09
3/18/2012 21:00
36.03
3/18/2012 22:00
-62.71
3/18/2012 23:00
-222.21
3/19/2012 0:00
-279.03
3/19/2012 1:00
-234.02
3/19/2012 2:00
-338.61
3/19/2012 3:00
-192.05
3/19/2012 4:00
-391.02
3/19/2012 5:00
-467.36
3/19/2012 6:00
-478.21
3/19/2012 7:00
-317.90
3/19/2012 8:00
-255.70
3/19/2012 9:00
-550.92
3/19/2012 10:00
-502.57
3/19/2012 11:00
-276.34
3/19/2012 12:00
-183.04
3/19/2012 13:00
-136.49
3/19/2012 14:00
-195.37
3/19/2012 15:00
-144.86
3/19/2012 16:00
-94.97
3/19/2012 17:00
16.11
3/19/2012 18:00
48.59
3/19/2012 19:00
-97.53
3/19/2012 20:00
-272.22
3/19/2012 21:00
-397.26
3/19/2012 22:00
-590.32
3/19/2012 23:00
-544.47
3/20/2012 0:00
-353.03
3/20/2012 1:00
-294.64
3/20/2012 2:00
-120.65
3/20/2012 3:00
-190.88
3/20/2012 4:00
-303.46
Docket No. ER11-1844
Exhibit No. NYI-4
Page 182 of 375
3/20/2012 5:00
-431.25
3/20/2012 6:00
-184.34
3/20/2012 7:00
-134.37
3/20/2012 8:00
-211.78
3/20/2012 9:00
-452.65
3/20/2012 10:00
-461.66
3/20/2012 11:00
-454.92
3/20/2012 12:00
-621.98
3/20/2012 13:00
-687.35
3/20/2012 14:00
-575.57
3/20/2012 15:00
-649.14
3/20/2012 16:00
-824.42
3/20/2012 17:00
-895.68
3/20/2012 18:00
-712.85
3/20/2012 19:00
-648.43
3/20/2012 20:00
-676.32
3/20/2012 21:00
-775.59
3/20/2012 22:00
-792.16
3/20/2012 23:00
-598.52
3/21/2012 0:00
-717.28
3/21/2012 1:00
-550.81
3/21/2012 2:00
-569.28
3/21/2012 3:00
-475.50
3/21/2012 4:00
-528.89
3/21/2012 5:00
-536.41
3/21/2012 6:00
-653.19
3/21/2012 7:00
-347.65
3/21/2012 8:00
-292.64
3/21/2012 9:00
-445.99
3/21/2012 10:00
-676.24
3/21/2012 11:00
-643.75
3/21/2012 12:00
-789.55
3/21/2012 13:00
-769.23
3/21/2012 14:00
-694.92
3/21/2012 15:00
-771.57
3/21/2012 16:00
-811.35
3/21/2012 17:00
-813.05
3/21/2012 18:00
-599.72
3/21/2012 19:00
-739.57
3/21/2012 20:00
-497.78
3/21/2012 21:00
-570.01
3/21/2012 22:00
-587.88
3/21/2012 23:00
-679.70
3/22/2012 0:00
-705.50
3/22/2012 1:00
-505.76
3/22/2012 2:00
-484.16
3/22/2012 3:00
-707.16
Docket No. ER11-1844
Exhibit No. NYI-4
Page 183 of 375
3/22/2012 4:00
-606.88
3/22/2012 5:00
-621.21
3/22/2012 6:00
-534.25
3/22/2012 7:00
-553.98
3/22/2012 8:00
-478.53
3/22/2012 9:00
-800.90
3/22/2012 10:00
-682.76
3/22/2012 11:00
-889.99
3/22/2012 12:00
-852.44
3/22/2012 13:00
-766.25
3/22/2012 14:00
-659.39
3/22/2012 15:00
-724.52
3/22/2012 16:00
-807.75
3/22/2012 17:00
-789.58
3/22/2012 18:00
-808.15
3/22/2012 19:00
-888.31
3/22/2012 20:00
-912.94
3/22/2012 21:00
-863.72
3/22/2012 22:00
-681.37
3/22/2012 23:00
-845.90
3/23/2012 0:00
-700.38
3/23/2012 1:00
-760.08
3/23/2012 2:00
-879.31
3/23/2012 3:00
-767.36
3/23/2012 4:00
-801.93
3/23/2012 5:00
-918.77
3/23/2012 6:00
-533.38
3/23/2012 7:00
-531.42
3/23/2012 8:00
-635.90
3/23/2012 9:00
-758.53
3/23/2012 10:00
-872.46
3/23/2012 11:00
-646.24
3/23/2012 12:00
-343.39
3/23/2012 13:00
-537.69
3/23/2012 14:00
-431.83
3/23/2012 15:00
-390.93
3/23/2012 16:00
-489.88
3/23/2012 17:00
-342.44
3/23/2012 18:00
-268.14
3/23/2012 19:00
-305.97
3/23/2012 20:00
-437.85
3/23/2012 21:00
-408.53
3/23/2012 22:00
-632.95
3/23/2012 23:00
-620.01
3/24/2012 0:00
-779.52
3/24/2012 1:00
-704.53
3/24/2012 2:00
-597.93
Docket No. ER11-1844
Exhibit No. NYI-4
Page 184 of 375
3/24/2012 3:00
-642.64
3/24/2012 4:00
-647.26
3/24/2012 5:00
-608.00
3/24/2012 6:00
-534.56
3/24/2012 7:00
-576.90
3/24/2012 8:00
-481.12
3/24/2012 9:00
-531.00
3/24/2012 10:00
-477.18
3/24/2012 11:00
-323.47
3/24/2012 12:00
-413.87
3/24/2012 13:00
-486.95
3/24/2012 14:00
-424.35
3/24/2012 15:00
-329.21
3/24/2012 16:00
-267.52
3/24/2012 17:00
-314.11
3/24/2012 18:00
-169.92
3/24/2012 19:00
-291.17
3/24/2012 20:00
-215.56
3/24/2012 21:00
-467.51
3/24/2012 22:00
-510.38
3/24/2012 23:00
-562.10
3/25/2012 0:00
-702.14
3/25/2012 1:00
-542.35
3/25/2012 2:00
-443.35
3/25/2012 3:00
-492.91
3/25/2012 4:00
-498.54
3/25/2012 5:00
-376.70
3/25/2012 6:00
-481.53
3/25/2012 7:00
-519.04
3/25/2012 8:00
-441.10
3/25/2012 9:00
-366.67
3/25/2012 10:00
-496.73
3/25/2012 11:00
-475.92
3/25/2012 12:00
-366.19
3/25/2012 13:00
-350.58
3/25/2012 14:00
-433.14
3/25/2012 15:00
-547.46
3/25/2012 16:00
-403.11
3/25/2012 17:00
-381.07
3/25/2012 18:00
-435.88
3/25/2012 19:00
-341.04
3/25/2012 20:00
-161.84
3/25/2012 21:00
-297.83
3/25/2012 22:00
-504.95
3/25/2012 23:00
-442.28
3/26/2012 0:00
-314.23
3/26/2012 1:00
-378.92
Docket No. ER11-1844
Exhibit No. NYI-4
Page 185 of 375
3/26/2012 2:00
-509.79
3/26/2012 3:00
-566.06
3/26/2012 4:00
-515.08
3/26/2012 5:00
-545.38
3/26/2012 6:00
-547.33
3/26/2012 7:00
-660.26
3/26/2012 8:00
-761.49
3/26/2012 9:00
-464.61
3/26/2012 10:00
-619.47
3/26/2012 11:00
-688.15
3/26/2012 12:00
-778.98
3/26/2012 13:00
-505.10
3/26/2012 14:00
-541.78
3/26/2012 15:00
-464.14
3/26/2012 16:00
-615.87
3/26/2012 17:00
-739.40
3/26/2012 18:00
-563.81
3/26/2012 19:00
-558.92
3/26/2012 20:00
-402.32
3/26/2012 21:00
-278.34
3/26/2012 22:00
-505.08
3/26/2012 23:00
-343.48
3/27/2012 0:00
-258.71
3/27/2012 1:00
-132.65
3/27/2012 2:00
-380.26
3/27/2012 3:00
-430.34
3/27/2012 4:00
-493.09
3/27/2012 5:00
-681.93
3/27/2012 6:00
-629.70
3/27/2012 7:00
-528.41
3/27/2012 8:00
-434.48
3/27/2012 9:00
-444.89
3/27/2012 10:00
-597.42
3/27/2012 11:00
-759.85
3/27/2012 12:00
-739.78
3/27/2012 13:00
-826.51
3/27/2012 14:00
-826.85
3/27/2012 15:00
-747.09
3/27/2012 16:00
-635.04
3/27/2012 17:00
-563.97
3/27/2012 18:00
-575.17
3/27/2012 19:00
-462.52
3/27/2012 20:00
-475.56
3/27/2012 21:00
-426.70
3/27/2012 22:00
-498.21
3/27/2012 23:00
-610.72
3/28/2012 0:00
-558.16
Docket No. ER11-1844
Exhibit No. NYI-4
Page 186 of 375
3/28/2012 1:00
-568.32
3/28/2012 2:00
-552.93
3/28/2012 3:00
-502.22
3/28/2012 4:00
-421.18
3/28/2012 5:00
-242.43
3/28/2012 6:00
-383.68
3/28/2012 7:00
-521.12
3/28/2012 8:00
-651.14
3/28/2012 9:00
-766.24
3/28/2012 10:00
-688.58
3/28/2012 11:00
-716.23
3/28/2012 12:00
-661.56
3/28/2012 13:00
-770.84
3/28/2012 14:00
-620.93
3/28/2012 15:00
-602.21
3/28/2012 16:00
-527.93
3/28/2012 17:00
-594.61
3/28/2012 18:00
-564.03
3/28/2012 19:00
-516.31
3/28/2012 20:00
-491.75
3/28/2012 21:00
-540.43
3/28/2012 22:00
-606.63
3/28/2012 23:00
-626.41
3/29/2012 0:00
-691.36
3/29/2012 1:00
-529.04
3/29/2012 2:00
-397.90
3/29/2012 3:00
-419.20
3/29/2012 4:00
-463.16
3/29/2012 5:00
-536.70
3/29/2012 6:00
-626.03
3/29/2012 7:00
-667.17
3/29/2012 8:00
-706.60
3/29/2012 9:00
-725.11
3/29/2012 10:00
-855.93
3/29/2012 11:00
-688.05
3/29/2012 12:00
-766.45
3/29/2012 13:00
-731.06
3/29/2012 14:00
-742.87
3/29/2012 15:00
-767.58
3/29/2012 16:00
-607.56
3/29/2012 17:00
-568.53
3/29/2012 18:00
-657.80
3/29/2012 19:00
-590.60
3/29/2012 20:00
-606.18
3/29/2012 21:00
-554.43
3/29/2012 22:00
-506.93
3/29/2012 23:00
-676.91
Docket No. ER11-1844
Exhibit No. NYI-4
Page 187 of 375
3/30/2012 0:00
-529.33
3/30/2012 1:00
-420.36
3/30/2012 2:00
-444.10
3/30/2012 3:00
-435.71
3/30/2012 4:00
-511.48
3/30/2012 5:00
-481.46
3/30/2012 6:00
-467.00
3/30/2012 7:00
-470.07
3/30/2012 8:00
-442.20
3/30/2012 9:00
-513.17
3/30/2012 10:00
-433.41
3/30/2012 11:00
-475.32
3/30/2012 12:00
-436.82
3/30/2012 13:00
-339.24
3/30/2012 14:00
-418.76
3/30/2012 15:00
-473.28
3/30/2012 16:00
-522.02
3/30/2012 17:00
-511.40
3/30/2012 18:00
-314.99
3/30/2012 19:00
-448.94
3/30/2012 20:00
-430.82
3/30/2012 21:00
-362.17
3/30/2012 22:00
-564.10
3/30/2012 23:00
-396.26
3/31/2012 0:00
-340.18
3/31/2012 1:00
-419.90
3/31/2012 2:00
-299.91
3/31/2012 3:00
-356.31
3/31/2012 4:00
-396.77
3/31/2012 5:00
-375.80
3/31/2012 6:00
-335.68
3/31/2012 7:00
-338.14
3/31/2012 8:00
-279.73
3/31/2012 9:00
-349.32
3/31/2012 10:00
-412.26
3/31/2012 11:00
-268.74
3/31/2012 12:00
-218.56
3/31/2012 13:00
-210.30
3/31/2012 14:00
-226.22
3/31/2012 15:00
-201.73
3/31/2012 16:00
-14.77
3/31/2012 17:00
47.85
3/31/2012 18:00
237.80
3/31/2012 19:00
239.59
3/31/2012 20:00
325.56
3/31/2012 21:00
67.33
3/31/2012 22:00
-6.99
Docket No. ER11-1844
Exhibit No. NYI-4
Page 188 of 375
3/31/2012 23:00
-67.20
Docket No. ER11-1844
Exhibit No. NYI-4
Page 189 of 375
Difference Between Scheduled
and Actual Power Flows,
Date
measured at the NYISO IESO
Border
1/1/2011 0:00
80.77
4249
Hours within Bandwidth
1/1/2011 1:00
344.89
48.50% Percent of Hours within Bandwidth
1/1/2011 2:00
376.07
1/1/2011 3:00
280.09
1/1/2011 4:00
167.08
1/1/2011 5:00
-8.20
1/1/2011 6:00
-31.54
1/1/2011 7:00
-185.01
1/1/2011 8:00
227.64
1/1/2011 9:00
95.35
1/1/2011 10:00
103.15
1/1/2011 11:00
118.94
1/1/2011 12:00
208.94
1/1/2011 13:00
187.95
1/1/2011 14:00
123.70
1/1/2011 15:00
62.05
1/1/2011 16:00
170.51
1/1/2011 17:00
209.72
1/1/2011 18:00
129.10
1/1/2011 19:00
70.31
1/1/2011 20:00
49.82
1/1/2011 21:00
-38.04
1/1/2011 22:00
-295.93
1/1/2011 23:00
-345.87
1/2/2011 0:00
-392.94
1/2/2011 1:00
-324.01
1/2/2011 2:00
-377.61
1/2/2011 3:00
-421.03
1/2/2011 4:00
-486.08
1/2/2011 5:00
-578.07
1/2/2011 6:00
-491.60
1/2/2011 7:00
-385.81
1/2/2011 8:00
-53.65
1/2/2011 9:00
-78.82
1/2/2011 10:00
205.77
1/2/2011 11:00
209.31
1/2/2011 12:00
372.84
1/2/2011 13:00
175.70
1/2/2011 14:00
300.89
1/2/2011 15:00
166.75
1/2/2011 16:00
151.48
Docket No. ER11-1844
Exhibit No. NYI-4
Page 190 of 375
1/2/2011 17:00
206.57
1/2/2011 18:00
254.81
1/2/2011 19:00
157.72
1/2/2011 20:00
68.13
1/2/2011 21:00
-8.94
1/2/2011 22:00
-227.76
1/2/2011 23:00
-244.47
1/3/2011 0:00
-209.32
1/3/2011 1:00
-237.79
1/3/2011 2:00
-455.26
1/3/2011 3:00
-586.35
1/3/2011 4:00
-637.02
1/3/2011 5:00
-303.46
1/3/2011 6:00
-304.92
1/3/2011 7:00
-145.84
1/3/2011 8:00
75.15
1/3/2011 9:00
120.24
1/3/2011 10:00
77.12
1/3/2011 11:00
135.25
1/3/2011 12:00
78.38
1/3/2011 13:00
10.66
1/3/2011 14:00
62.91
1/3/2011 15:00
76.84
1/3/2011 16:00
84.85
1/3/2011 17:00
254.98
1/3/2011 18:00
242.81
1/3/2011 19:00
354.69
1/3/2011 20:00
362.72
1/3/2011 21:00
356.51
1/3/2011 22:00
35.42
1/3/2011 23:00
-82.81
1/4/2011 0:00
98.63
1/4/2011 1:00
28.46
1/4/2011 2:00
128.03
1/4/2011 3:00
213.25
1/4/2011 4:00
170.24
1/4/2011 5:00
224.95
1/4/2011 6:00
314.06
1/4/2011 7:00
125.71
1/4/2011 8:00
177.87
1/4/2011 9:00
181.04
1/4/2011 10:00
311.75
1/4/2011 11:00
401.63
1/4/2011 12:00
218.57
1/4/2011 13:00
240.36
1/4/2011 14:00
154.45
1/4/2011 15:00
218.18
Docket No. ER11-1844
Exhibit No. NYI-4
Page 191 of 375
1/4/2011 16:00
128.38
1/4/2011 17:00
88.51
1/4/2011 18:00
-54.13
1/4/2011 19:00
-74.86
1/4/2011 20:00
-99.38
1/4/2011 21:00
46.66
1/4/2011 22:00
-27.30
1/4/2011 23:00
22.94
1/5/2011 0:00
152.36
1/5/2011 1:00
78.08
1/5/2011 2:00
147.62
1/5/2011 3:00
72.54
1/5/2011 4:00
-5.75
1/5/2011 5:00
-61.96
1/5/2011 6:00
-212.80
1/5/2011 7:00
-231.23
1/5/2011 8:00
-189.34
1/5/2011 9:00
-50.32
1/5/2011 10:00
-76.24
1/5/2011 11:00
-252.82
1/5/2011 12:00
-79.66
1/5/2011 13:00
-159.25
1/5/2011 14:00
-61.43
1/5/2011 15:00
61.61
1/5/2011 16:00
77.31
1/5/2011 17:00
186.16
1/5/2011 18:00
58.27
1/5/2011 19:00
326.88
1/5/2011 20:00
408.15
1/5/2011 21:00
345.82
1/5/2011 22:00
535.34
1/5/2011 23:00
549.79
1/6/2011 0:00
442.46
1/6/2011 1:00
280.90
1/6/2011 2:00
357.75
1/6/2011 3:00
173.02
1/6/2011 4:00
229.10
1/6/2011 5:00
313.51
1/6/2011 6:00
450.24
1/6/2011 7:00
213.94
1/6/2011 8:00
333.46
1/6/2011 9:00
419.80
1/6/2011 10:00
390.72
1/6/2011 11:00
380.27
1/6/2011 12:00
388.07
1/6/2011 13:00
542.66
1/6/2011 14:00
603.35
Docket No. ER11-1844
Exhibit No. NYI-4
Page 192 of 375
1/6/2011 15:00
610.93
1/6/2011 16:00
709.04
1/6/2011 17:00
278.39
1/6/2011 18:00
273.80
1/6/2011 19:00
453.99
1/6/2011 20:00
682.96
1/6/2011 21:00
519.32
1/6/2011 22:00
603.15
1/6/2011 23:00
342.32
1/7/2011 0:00
339.88
1/7/2011 1:00
425.07
1/7/2011 2:00
415.45
1/7/2011 3:00
431.21
1/7/2011 4:00
515.27
1/7/2011 5:00
491.09
1/7/2011 6:00
544.41
1/7/2011 7:00
496.91
1/7/2011 8:00
509.70
1/7/2011 9:00
586.29
1/7/2011 10:00
437.53
1/7/2011 11:00
293.95
1/7/2011 12:00
295.49
1/7/2011 13:00
584.31
1/7/2011 14:00
534.23
1/7/2011 15:00
428.43
1/7/2011 16:00
263.58
1/7/2011 17:00
406.94
1/7/2011 18:00
301.92
1/7/2011 19:00
277.85
1/7/2011 20:00
455.54
1/7/2011 21:00
480.29
1/7/2011 22:00
489.33
1/7/2011 23:00
553.91
1/8/2011 0:00
631.36
1/8/2011 1:00
590.87
1/8/2011 2:00
583.46
1/8/2011 3:00
464.01
1/8/2011 4:00
513.83
1/8/2011 5:00
526.42
1/8/2011 6:00
455.45
1/8/2011 7:00
446.37
1/8/2011 8:00
636.81
1/8/2011 9:00
525.39
1/8/2011 10:00
536.08
1/8/2011 11:00
600.18
1/8/2011 12:00
587.55
1/8/2011 13:00
386.09
Docket No. ER11-1844
Exhibit No. NYI-4
Page 193 of 375
1/8/2011 14:00
379.28
1/8/2011 15:00
382.33
1/8/2011 16:00
428.20
1/8/2011 17:00
485.60
1/8/2011 18:00
603.20
1/8/2011 19:00
680.86
1/8/2011 20:00
729.28
1/8/2011 21:00
531.84
1/8/2011 22:00
447.63
1/8/2011 23:00
377.60
1/9/2011 0:00
549.48
1/9/2011 1:00
493.20
1/9/2011 2:00
486.39
1/9/2011 3:00
468.27
1/9/2011 4:00
528.31
1/9/2011 5:00
539.50
1/9/2011 6:00
441.06
1/9/2011 7:00
270.27
1/9/2011 8:00
563.18
1/9/2011 9:00
567.45
1/9/2011 10:00
605.88
1/9/2011 11:00
517.04
1/9/2011 12:00
446.48
1/9/2011 13:00
446.47
1/9/2011 14:00
424.68
1/9/2011 15:00
346.72
1/9/2011 16:00
434.13
1/9/2011 17:00
271.02
1/9/2011 18:00
423.65
1/9/2011 19:00
360.08
1/9/2011 20:00
484.14
1/9/2011 21:00
404.21
1/9/2011 22:00
525.35
1/9/2011 23:00
468.03
1/10/2011 0:00
707.26
1/10/2011 1:00
663.86
1/10/2011 2:00
537.70
1/10/2011 3:00
529.36
1/10/2011 4:00
458.43
1/10/2011 5:00
590.53
1/10/2011 6:00
566.70
1/10/2011 7:00
31.50
1/10/2011 8:00
268.52
1/10/2011 9:00
431.49
1/10/2011 10:00
285.83
1/10/2011 11:00
458.13
1/10/2011 12:00
409.59
Docket No. ER11-1844
Exhibit No. NYI-4
Page 194 of 375
1/10/2011 13:00
421.45
1/10/2011 14:00
395.59
1/10/2011 15:00
395.32
1/10/2011 16:00
404.24
1/10/2011 17:00
370.60
1/10/2011 18:00
297.06
1/10/2011 19:00
267.22
1/10/2011 20:00
95.05
1/10/2011 21:00
495.82
1/10/2011 22:00
609.43
1/10/2011 23:00
951.86
1/11/2011 0:00
761.96
1/11/2011 1:00
773.19
1/11/2011 2:00
663.25
1/11/2011 3:00
651.21
1/11/2011 4:00
492.32
1/11/2011 5:00
589.08
1/11/2011 6:00
673.97
1/11/2011 7:00
365.79
1/11/2011 8:00
285.43
1/11/2011 9:00
250.97
1/11/2011 10:00
210.93
1/11/2011 11:00
85.47
1/11/2011 12:00
111.81
1/11/2011 13:00
166.78
1/11/2011 14:00
137.98
1/11/2011 15:00
75.03
1/11/2011 16:00
-39.33
1/11/2011 17:00
15.17
1/11/2011 18:00
-15.36
1/11/2011 19:00
-9.64
1/11/2011 20:00
3.27
1/11/2011 21:00
84.74
1/11/2011 22:00
132.17
1/11/2011 23:00
435.36
1/12/2011 0:00
186.52
1/12/2011 1:00
278.96
1/12/2011 2:00
423.44
1/12/2011 3:00
253.22
1/12/2011 4:00
346.34
1/12/2011 5:00
183.49
1/12/2011 6:00
404.43
1/12/2011 7:00
23.70
1/12/2011 8:00
169.96
1/12/2011 9:00
204.64
1/12/2011 10:00
170.63
1/12/2011 11:00
236.47
Docket No. ER11-1844
Exhibit No. NYI-4
Page 195 of 375
1/12/2011 12:00
468.88
1/12/2011 13:00
430.33
1/12/2011 14:00
284.30
1/12/2011 15:00
252.17
1/12/2011 16:00
94.09
1/12/2011 17:00
-15.77
1/12/2011 18:00
47.10
1/12/2011 19:00
59.87
1/12/2011 20:00
61.42
1/12/2011 21:00
158.80
1/12/2011 22:00
243.52
1/12/2011 23:00
571.93
1/13/2011 0:00
344.04
1/13/2011 1:00
274.81
1/13/2011 2:00
48.76
1/13/2011 3:00
80.18
1/13/2011 4:00
292.14
1/13/2011 5:00
386.11
1/13/2011 6:00
388.80
1/13/2011 7:00
131.27
1/13/2011 8:00
330.69
1/13/2011 9:00
244.53
1/13/2011 10:00
278.39
1/13/2011 11:00
528.21
1/13/2011 12:00
497.88
1/13/2011 13:00
330.76
1/13/2011 14:00
201.11
1/13/2011 15:00
438.14
1/13/2011 16:00
373.37
1/13/2011 17:00
94.64
1/13/2011 18:00
-44.39
1/13/2011 19:00
235.27
1/13/2011 20:00
452.65
1/13/2011 21:00
676.03
1/13/2011 22:00
747.12
1/13/2011 23:00
576.29
1/14/2011 0:00
570.85
1/14/2011 1:00
268.39
1/14/2011 2:00
573.92
1/14/2011 3:00
220.20
1/14/2011 4:00
354.00
1/14/2011 5:00
81.29
1/14/2011 6:00
301.06
1/14/2011 7:00
411.28
1/14/2011 8:00
379.83
1/14/2011 9:00
572.49
1/14/2011 10:00
571.69
Docket No. ER11-1844
Exhibit No. NYI-4
Page 196 of 375
1/14/2011 11:00
558.52
1/14/2011 12:00
465.96
1/14/2011 13:00
671.47
1/14/2011 14:00
539.13
1/14/2011 15:00
287.15
1/14/2011 16:00
49.43
1/14/2011 17:00
242.70
1/14/2011 18:00
160.01
1/14/2011 19:00
80.79
1/14/2011 20:00
149.56
1/14/2011 21:00
286.31
1/14/2011 22:00
541.63
1/14/2011 23:00
690.73
1/15/2011 0:00
468.51
1/15/2011 1:00
569.63
1/15/2011 2:00
608.58
1/15/2011 3:00
516.26
1/15/2011 4:00
170.60
1/15/2011 5:00
425.57
1/15/2011 6:00
331.44
1/15/2011 7:00
448.79
1/15/2011 8:00
542.25
1/15/2011 9:00
625.36
1/15/2011 10:00
413.37
1/15/2011 11:00
463.23
1/15/2011 12:00
525.48
1/15/2011 13:00
408.07
1/15/2011 14:00
317.71
1/15/2011 15:00
359.06
1/15/2011 16:00
530.32
1/15/2011 17:00
266.28
1/15/2011 18:00
266.40
1/15/2011 19:00
345.65
1/15/2011 20:00
507.87
1/15/2011 21:00
409.27
1/15/2011 22:00
479.67
1/15/2011 23:00
464.45
1/16/2011 0:00
330.84
1/16/2011 1:00
393.50
1/16/2011 2:00
422.63
1/16/2011 3:00
419.37
1/16/2011 4:00
565.50
1/16/2011 5:00
589.06
1/16/2011 6:00
514.41
1/16/2011 7:00
395.17
1/16/2011 8:00
540.62
1/16/2011 9:00
538.20
Docket No. ER11-1844
Exhibit No. NYI-4
Page 197 of 375
1/16/2011 10:00
439.02
1/16/2011 11:00
456.99
1/16/2011 12:00
275.92
1/16/2011 13:00
343.53
1/16/2011 14:00
291.47
1/16/2011 15:00
303.15
1/16/2011 16:00
209.05
1/16/2011 17:00
253.39
1/16/2011 18:00
214.29
1/16/2011 19:00
394.05
1/16/2011 20:00
204.84
1/16/2011 21:00
407.38
1/16/2011 22:00
564.51
1/16/2011 23:00
882.51
1/17/2011 0:00
763.51
1/17/2011 1:00
905.15
1/17/2011 2:00
898.79
1/17/2011 3:00
1010.79
1/17/2011 4:00
858.61
1/17/2011 5:00
488.52
1/17/2011 6:00
311.16
1/17/2011 7:00
-242.34
1/17/2011 8:00
117.50
1/17/2011 9:00
257.76
1/17/2011 10:00
105.70
1/17/2011 11:00
301.64
1/17/2011 12:00
328.82
1/17/2011 13:00
403.44
1/17/2011 14:00
377.93
1/17/2011 15:00
348.27
1/17/2011 16:00
80.34
1/17/2011 17:00
158.86
1/17/2011 18:00
-27.36
1/17/2011 19:00
-80.59
1/17/2011 20:00
-103.97
1/17/2011 21:00
357.14
1/17/2011 22:00
711.50
1/17/2011 23:00
1119.79
1/18/2011 0:00
983.86
1/18/2011 1:00
682.54
1/18/2011 2:00
743.47
1/18/2011 3:00
650.35
1/18/2011 4:00
680.96
1/18/2011 5:00
311.08
1/18/2011 6:00
-5.95
1/18/2011 7:00
97.40
1/18/2011 8:00
432.10
Docket No. ER11-1844
Exhibit No. NYI-4
Page 198 of 375
1/18/2011 9:00
469.13
1/18/2011 10:00
566.08
1/18/2011 11:00
367.87
1/18/2011 12:00
446.66
1/18/2011 13:00
250.16
1/18/2011 14:00
129.84
1/18/2011 15:00
117.38
1/18/2011 16:00
235.64
1/18/2011 17:00
221.48
1/18/2011 18:00
255.25
1/18/2011 19:00
372.35
1/18/2011 20:00
491.20
1/18/2011 21:00
444.48
1/18/2011 22:00
545.22
1/18/2011 23:00
552.63
1/19/2011 0:00
369.92
1/19/2011 1:00
264.25
1/19/2011 2:00
364.58
1/19/2011 3:00
270.58
1/19/2011 4:00
385.35
1/19/2011 5:00
172.29
1/19/2011 6:00
588.48
1/19/2011 7:00
436.90
1/19/2011 8:00
250.45
1/19/2011 9:00
272.45
1/19/2011 10:00
262.40
1/19/2011 11:00
287.32
1/19/2011 12:00
257.56
1/19/2011 13:00
188.85
1/19/2011 14:00
46.22
1/19/2011 15:00
94.60
1/19/2011 16:00
38.99
1/19/2011 17:00
149.92
1/19/2011 18:00
200.94
1/19/2011 19:00
236.78
1/19/2011 20:00
126.02
1/19/2011 21:00
282.17
1/19/2011 22:00
664.14
1/19/2011 23:00
652.68
1/20/2011 0:00
723.97
1/20/2011 1:00
777.25
1/20/2011 2:00
936.10
1/20/2011 3:00
636.11
1/20/2011 4:00
596.38
1/20/2011 5:00
578.16
1/20/2011 6:00
890.66
1/20/2011 7:00
387.58
Docket No. ER11-1844
Exhibit No. NYI-4
Page 199 of 375
1/20/2011 8:00
175.28
1/20/2011 9:00
156.55
1/20/2011 10:00
179.24
1/20/2011 11:00
138.53
1/20/2011 12:00
127.29
1/20/2011 13:00
281.31
1/20/2011 14:00
394.69
1/20/2011 15:00
502.05
1/20/2011 16:00
654.41
1/20/2011 17:00
528.56
1/20/2011 18:00
467.99
1/20/2011 19:00
606.84
1/20/2011 20:00
645.31
1/20/2011 21:00
654.37
1/20/2011 22:00
599.61
1/20/2011 23:00
672.18
1/21/2011 0:00
770.98
1/21/2011 1:00
557.22
1/21/2011 2:00
326.93
1/21/2011 3:00
272.25
1/21/2011 4:00
396.68
1/21/2011 5:00
524.39
1/21/2011 6:00
390.34
1/21/2011 7:00
381.05
1/21/2011 8:00
419.41
1/21/2011 9:00
368.52
1/21/2011 10:00
460.90
1/21/2011 11:00
338.39
1/21/2011 12:00
590.78
1/21/2011 13:00
392.98
1/21/2011 14:00
468.58
1/21/2011 15:00
298.38
1/21/2011 16:00
117.23
1/21/2011 17:00
75.56
1/21/2011 18:00
112.07
1/21/2011 19:00
185.30
1/21/2011 20:00
191.11
1/21/2011 21:00
232.71
1/21/2011 22:00
535.08
1/21/2011 23:00
488.33
1/22/2011 0:00
266.57
1/22/2011 1:00
371.19
1/22/2011 2:00
267.15
1/22/2011 3:00
333.36
1/22/2011 4:00
263.42
1/22/2011 5:00
585.83
1/22/2011 6:00
450.29
Docket No. ER11-1844
Exhibit No. NYI-4
Page 200 of 375
1/22/2011 7:00
313.51
1/22/2011 8:00
332.20
1/22/2011 9:00
243.61
1/22/2011 10:00
329.68
1/22/2011 11:00
474.10
1/22/2011 12:00
471.05
1/22/2011 13:00
385.53
1/22/2011 14:00
242.10
1/22/2011 15:00
123.04
1/22/2011 16:00
45.78
1/22/2011 17:00
59.36
1/22/2011 18:00
122.30
1/22/2011 19:00
147.94
1/22/2011 20:00
201.04
1/22/2011 21:00
241.71
1/22/2011 22:00
336.89
1/22/2011 23:00
415.69
1/23/2011 0:00
293.47
1/23/2011 1:00
354.21
1/23/2011 2:00
244.23
1/23/2011 3:00
286.48
1/23/2011 4:00
334.28
1/23/2011 5:00
404.94
1/23/2011 6:00
282.41
1/23/2011 7:00
329.19
1/23/2011 8:00
657.53
1/23/2011 9:00
490.52
1/23/2011 10:00
467.23
1/23/2011 11:00
470.02
1/23/2011 12:00
522.56
1/23/2011 13:00
383.70
1/23/2011 14:00
293.00
1/23/2011 15:00
270.03
1/23/2011 16:00
443.88
1/23/2011 17:00
282.59
1/23/2011 18:00
605.30
1/23/2011 19:00
517.18
1/23/2011 20:00
538.66
1/23/2011 21:00
572.92
1/23/2011 22:00
534.77
1/23/2011 23:00
718.34
1/24/2011 0:00
468.83
1/24/2011 1:00
311.36
1/24/2011 2:00
402.08
1/24/2011 3:00
448.15
1/24/2011 4:00
461.32
1/24/2011 5:00
617.64
Docket No. ER11-1844
Exhibit No. NYI-4
Page 201 of 375
1/24/2011 6:00
462.39
1/24/2011 7:00
394.22
1/24/2011 8:00
411.22
1/24/2011 9:00
111.55
1/24/2011 10:00
246.06
1/24/2011 11:00
367.14
1/24/2011 12:00
595.84
1/24/2011 13:00
-4.28
1/24/2011 14:00
232.78
1/24/2011 15:00
271.58
1/24/2011 16:00
40.31
1/24/2011 17:00
138.26
1/24/2011 18:00
183.69
1/24/2011 19:00
315.47
1/24/2011 20:00
287.96
1/24/2011 21:00
449.53
1/24/2011 22:00
630.63
1/24/2011 23:00
319.92
1/25/2011 0:00
68.44
1/25/2011 1:00
200.96
1/25/2011 2:00
100.23
1/25/2011 3:00
-27.38
1/25/2011 4:00
121.22
1/25/2011 5:00
56.40
1/25/2011 6:00
303.01
1/25/2011 7:00
223.81
1/25/2011 8:00
417.00
1/25/2011 9:00
542.70
1/25/2011 10:00
305.04
1/25/2011 11:00
588.73
1/25/2011 12:00
267.52
1/25/2011 13:00
377.66
1/25/2011 14:00
628.24
1/25/2011 15:00
291.01
1/25/2011 16:00
150.14
1/25/2011 17:00
-45.74
1/25/2011 18:00
-69.98
1/25/2011 19:00
337.50
1/25/2011 20:00
675.26
1/25/2011 21:00
764.29
1/25/2011 22:00
754.96
1/25/2011 23:00
564.43
1/26/2011 0:00
429.31
1/26/2011 1:00
163.44
1/26/2011 2:00
348.89
1/26/2011 3:00
430.23
1/26/2011 4:00
525.97
Docket No. ER11-1844
Exhibit No. NYI-4
Page 202 of 375
1/26/2011 5:00
385.19
1/26/2011 6:00
544.06
1/26/2011 7:00
476.94
1/26/2011 8:00
294.15
1/26/2011 9:00
436.72
1/26/2011 10:00
616.58
1/26/2011 11:00
360.48
1/26/2011 12:00
169.83
1/26/2011 13:00
365.46
1/26/2011 14:00
365.04
1/26/2011 15:00
440.14
1/26/2011 16:00
534.17
1/26/2011 17:00
328.55
1/26/2011 18:00
66.16
1/26/2011 19:00
116.90
1/26/2011 20:00
239.00
1/26/2011 21:00
688.34
1/26/2011 22:00
816.25
1/26/2011 23:00
822.52
1/27/2011 0:00
651.76
1/27/2011 1:00
568.74
1/27/2011 2:00
452.53
1/27/2011 3:00
304.31
1/27/2011 4:00
272.17
1/27/2011 5:00
178.83
1/27/2011 6:00
-16.43
1/27/2011 7:00
-73.59
1/27/2011 8:00
237.16
1/27/2011 9:00
309.15
1/27/2011 10:00
203.60
1/27/2011 11:00
347.56
1/27/2011 12:00
267.54
1/27/2011 13:00
214.29
1/27/2011 14:00
30.39
1/27/2011 15:00
167.27
1/27/2011 16:00
383.14
1/27/2011 17:00
293.87
1/27/2011 18:00
-29.63
1/27/2011 19:00
375.40
1/27/2011 20:00
194.77
1/27/2011 21:00
257.57
1/27/2011 22:00
264.19
1/27/2011 23:00
382.58
1/28/2011 0:00
609.97
1/28/2011 1:00
528.67
1/28/2011 2:00
384.79
1/28/2011 3:00
363.17
Docket No. ER11-1844
Exhibit No. NYI-4
Page 203 of 375
1/28/2011 4:00
354.19
1/28/2011 5:00
239.69
1/28/2011 6:00
201.23
1/28/2011 7:00
334.73
1/28/2011 8:00
699.00
1/28/2011 9:00
472.28
1/28/2011 10:00
509.93
1/28/2011 11:00
363.12
1/28/2011 12:00
440.32
1/28/2011 13:00
390.55
1/28/2011 14:00
495.62
1/28/2011 15:00
258.18
1/28/2011 16:00
323.32
1/28/2011 17:00
378.82
1/28/2011 18:00
182.96
1/28/2011 19:00
190.66
1/28/2011 20:00
356.77
1/28/2011 21:00
688.77
1/28/2011 22:00
641.22
1/28/2011 23:00
693.51
1/29/2011 0:00
587.04
1/29/2011 1:00
414.02
1/29/2011 2:00
179.70
1/29/2011 3:00
144.65
1/29/2011 4:00
95.88
1/29/2011 5:00
190.37
1/29/2011 6:00
89.24
1/29/2011 7:00
179.06
1/29/2011 8:00
599.61
1/29/2011 9:00
451.30
1/29/2011 10:00
436.57
1/29/2011 11:00
479.26
1/29/2011 12:00
409.21
1/29/2011 13:00
385.28
1/29/2011 14:00
517.97
1/29/2011 15:00
366.97
1/29/2011 16:00
326.94
1/29/2011 17:00
370.31
1/29/2011 18:00
272.83
1/29/2011 19:00
342.40
1/29/2011 20:00
348.01
1/29/2011 21:00
360.76
1/29/2011 22:00
663.48
1/29/2011 23:00
692.81
1/30/2011 0:00
519.45
1/30/2011 1:00
661.83
1/30/2011 2:00
645.65
Docket No. ER11-1844
Exhibit No. NYI-4
Page 204 of 375
1/30/2011 3:00
568.52
1/30/2011 4:00
630.38
1/30/2011 5:00
637.32
1/30/2011 6:00
345.69
1/30/2011 7:00
168.60
1/30/2011 8:00
205.79
1/30/2011 9:00
331.34
1/30/2011 10:00
348.76
1/30/2011 11:00
254.15
1/30/2011 12:00
296.08
1/30/2011 13:00
214.62
1/30/2011 14:00
252.54
1/30/2011 15:00
308.65
1/30/2011 16:00
401.50
1/30/2011 17:00
361.19
1/30/2011 18:00
28.04
1/30/2011 19:00
168.83
1/30/2011 20:00
336.22
1/30/2011 21:00
418.44
1/30/2011 22:00
614.44
1/30/2011 23:00
577.05
1/31/2011 0:00
240.57
1/31/2011 1:00
41.85
1/31/2011 2:00
1.81
1/31/2011 3:00
118.70
1/31/2011 4:00
149.49
1/31/2011 5:00
-144.40
1/31/2011 6:00
-381.63
1/31/2011 7:00
-437.51
1/31/2011 8:00
-218.20
1/31/2011 9:00
-147.27
1/31/2011 10:00
-140.75
1/31/2011 11:00
-55.04
1/31/2011 12:00
-0.11
1/31/2011 13:00
-141.05
1/31/2011 14:00
-213.64
1/31/2011 15:00
-313.68
1/31/2011 16:00
-265.18
1/31/2011 17:00
-456.91
1/31/2011 18:00
-495.40
1/31/2011 19:00
-285.01
1/31/2011 20:00
-316.97
1/31/2011 21:00
-222.10
1/31/2011 22:00
-294.82
1/31/2011 23:00
-212.90
2/1/2011 0:00
-34.68
2/1/2011 1:00
-289.01
Docket No. ER11-1844
Exhibit No. NYI-4
Page 205 of 375
2/1/2011 2:00
-233.07
2/1/2011 3:00
-376.99
2/1/2011 4:00
1.87
2/1/2011 5:00
-318.04
2/1/2011 6:00
-672.59
2/1/2011 7:00
-664.79
2/1/2011 8:00
-545.63
2/1/2011 9:00
-495.49
2/1/2011 10:00
-374.94
2/1/2011 11:00
-473.83
2/1/2011 12:00
-400.25
2/1/2011 13:00
-324.25
2/1/2011 14:00
-334.71
2/1/2011 15:00
-344.75
2/1/2011 16:00
-370.53
2/1/2011 17:00
-566.84
2/1/2011 18:00
-715.81
2/1/2011 19:00
-608.64
2/1/2011 20:00
-498.91
2/1/2011 21:00
-232.87
2/1/2011 22:00
19.24
2/1/2011 23:00
-107.84
2/2/2011 0:00
-108.45
2/2/2011 1:00
-284.08
2/2/2011 2:00
-131.62
2/2/2011 3:00
-124.10
2/2/2011 4:00
179.77
2/2/2011 5:00
1.60
2/2/2011 6:00
-173.02
2/2/2011 7:00
-246.83
2/2/2011 8:00
-139.66
2/2/2011 9:00
-162.87
2/2/2011 10:00
-103.91
2/2/2011 11:00
-104.95
2/2/2011 12:00
-291.87
2/2/2011 13:00
-176.23
2/2/2011 14:00
-263.13
2/2/2011 15:00
-368.02
2/2/2011 16:00
-380.10
2/2/2011 17:00
-341.33
2/2/2011 18:00
-381.00
2/2/2011 19:00
-431.98
2/2/2011 20:00
-427.45
2/2/2011 21:00
42.83
2/2/2011 22:00
255.40
2/2/2011 23:00
319.80
2/3/2011 0:00
349.93
Docket No. ER11-1844
Exhibit No. NYI-4
Page 206 of 375
2/3/2011 1:00
215.42
2/3/2011 2:00
217.55
2/3/2011 3:00
58.57
2/3/2011 4:00
168.18
2/3/2011 5:00
261.84
2/3/2011 6:00
174.71
2/3/2011 7:00
523.75
2/3/2011 8:00
459.93
2/3/2011 9:00
409.12
2/3/2011 10:00
332.65
2/3/2011 11:00
529.85
2/3/2011 12:00
271.34
2/3/2011 13:00
379.10
2/3/2011 14:00
248.22
2/3/2011 15:00
419.01
2/3/2011 16:00
425.44
2/3/2011 17:00
436.59
2/3/2011 18:00
137.27
2/3/2011 19:00
9.20
2/3/2011 20:00
338.27
2/3/2011 21:00
464.52
2/3/2011 22:00
567.17
2/3/2011 23:00
542.57
2/4/2011 0:00
570.01
2/4/2011 1:00
527.68
2/4/2011 2:00
318.75
2/4/2011 3:00
258.58
2/4/2011 4:00
249.62
2/4/2011 5:00
277.44
2/4/2011 6:00
398.68
2/4/2011 7:00
323.23
2/4/2011 8:00
363.61
2/4/2011 9:00
208.17
2/4/2011 10:00
173.03
2/4/2011 11:00
58.21
2/4/2011 12:00
409.75
2/4/2011 13:00
239.34
2/4/2011 14:00
341.42
2/4/2011 15:00
218.75
2/4/2011 16:00
295.06
2/4/2011 17:00
484.93
2/4/2011 18:00
55.15
2/4/2011 19:00
198.28
2/4/2011 20:00
-115.14
2/4/2011 21:00
-133.30
2/4/2011 22:00
253.30
2/4/2011 23:00
219.75
Docket No. ER11-1844
Exhibit No. NYI-4
Page 207 of 375
2/5/2011 0:00
298.27
2/5/2011 1:00
197.97
2/5/2011 2:00
253.27
2/5/2011 3:00
329.05
2/5/2011 4:00
319.74
2/5/2011 5:00
146.43
2/5/2011 6:00
-4.46
2/5/2011 7:00
-132.24
2/5/2011 8:00
-262.44
2/5/2011 9:00
-350.94
2/5/2011 10:00
-342.85
2/5/2011 11:00
-443.45
2/5/2011 12:00
-484.73
2/5/2011 13:00
-289.11
2/5/2011 14:00
-3.07
2/5/2011 15:00
38.39
2/5/2011 16:00
-17.10
2/5/2011 17:00
12.41
2/5/2011 18:00
-172.56
2/5/2011 19:00
-35.91
2/5/2011 20:00
-109.47
2/5/2011 21:00
-212.17
2/5/2011 22:00
102.34
2/5/2011 23:00
112.95
2/6/2011 0:00
138.05
2/6/2011 1:00
154.64
2/6/2011 2:00
222.01
2/6/2011 3:00
354.09
2/6/2011 4:00
266.09
2/6/2011 5:00
353.73
2/6/2011 6:00
224.93
2/6/2011 7:00
92.15
2/6/2011 8:00
80.34
2/6/2011 9:00
-118.56
2/6/2011 10:00
-167.82
2/6/2011 11:00
-312.63
2/6/2011 12:00
-266.11
2/6/2011 13:00
-74.70
2/6/2011 14:00
-172.35
2/6/2011 15:00
-22.44
2/6/2011 16:00
-154.78
2/6/2011 17:00
8.52
2/6/2011 18:00
127.12
2/6/2011 19:00
57.91
2/6/2011 20:00
-146.54
2/6/2011 21:00
-225.07
2/6/2011 22:00
-141.29
Docket No. ER11-1844
Exhibit No. NYI-4
Page 208 of 375
2/6/2011 23:00
162.73
2/7/2011 0:00
436.35
2/7/2011 1:00
367.52
2/7/2011 2:00
318.68
2/7/2011 3:00
282.83
2/7/2011 4:00
215.14
2/7/2011 5:00
93.16
2/7/2011 6:00
41.97
2/7/2011 7:00
-86.14
2/7/2011 8:00
-18.16
2/7/2011 9:00
-66.08
2/7/2011 10:00
-30.11
2/7/2011 11:00
-76.97
2/7/2011 12:00
-94.40
2/7/2011 13:00
-394.57
2/7/2011 14:00
-468.13
2/7/2011 15:00
-461.46
2/7/2011 16:00
-309.99
2/7/2011 17:00
-12.33
2/7/2011 18:00
124.78
2/7/2011 19:00
239.82
2/7/2011 20:00
194.82
2/7/2011 21:00
-97.79
2/7/2011 22:00
-50.82
2/7/2011 23:00
8.17
2/8/2011 0:00
133.04
2/8/2011 1:00
118.42
2/8/2011 2:00
241.38
2/8/2011 3:00
94.30
2/8/2011 4:00
107.39
2/8/2011 5:00
-1.75
2/8/2011 6:00
-50.51
2/8/2011 7:00
175.86
2/8/2011 8:00
172.55
2/8/2011 9:00
105.85
2/8/2011 10:00
185.62
2/8/2011 11:00
112.99
2/8/2011 12:00
84.35
2/8/2011 13:00
35.64
2/8/2011 14:00
-24.70
2/8/2011 15:00
129.63
2/8/2011 16:00
253.79
2/8/2011 17:00
395.78
2/8/2011 18:00
103.36
2/8/2011 19:00
307.07
2/8/2011 20:00
232.69
2/8/2011 21:00
233.30
Docket No. ER11-1844
Exhibit No. NYI-4
Page 209 of 375
2/8/2011 22:00
183.99
2/8/2011 23:00
326.83
2/9/2011 0:00
354.08
2/9/2011 1:00
607.15
2/9/2011 2:00
460.51
2/9/2011 3:00
456.74
2/9/2011 4:00
475.97
2/9/2011 5:00
492.28
2/9/2011 6:00
335.01
2/9/2011 7:00
66.53
2/9/2011 8:00
-59.24
2/9/2011 9:00
-66.15
2/9/2011 10:00
-71.24
2/9/2011 11:00
0.07
2/9/2011 12:00
138.74
2/9/2011 13:00
103.65
2/9/2011 14:00
141.67
2/9/2011 15:00
224.69
2/9/2011 16:00
200.03
2/9/2011 17:00
312.01
2/9/2011 18:00
316.13
2/9/2011 19:00
293.63
2/9/2011 20:00
358.02
2/9/2011 21:00
291.10
2/9/2011 22:00
238.90
2/9/2011 23:00
308.80
2/10/2011 0:00
188.01
2/10/2011 1:00
80.26
2/10/2011 2:00
144.04
2/10/2011 3:00
-7.48
2/10/2011 4:00
69.16
2/10/2011 5:00
176.40
2/10/2011 6:00
320.72
2/10/2011 7:00
2.68
2/10/2011 8:00
340.51
2/10/2011 9:00
414.24
2/10/2011 10:00
331.18
2/10/2011 11:00
183.95
2/10/2011 12:00
150.94
2/10/2011 13:00
157.40
2/10/2011 14:00
-25.48
2/10/2011 15:00
-34.88
2/10/2011 16:00
15.87
2/10/2011 17:00
304.82
2/10/2011 18:00
240.97
2/10/2011 19:00
356.68
2/10/2011 20:00
454.24
Docket No. ER11-1844
Exhibit No. NYI-4
Page 210 of 375
2/10/2011 21:00
308.85
2/10/2011 22:00
482.91
2/10/2011 23:00
239.22
2/11/2011 0:00
88.99
2/11/2011 1:00
65.46
2/11/2011 2:00
-10.30
2/11/2011 3:00
-156.45
2/11/2011 4:00
-202.37
2/11/2011 5:00
-126.42
2/11/2011 6:00
-299.12
2/11/2011 7:00
-75.93
2/11/2011 8:00
193.62
2/11/2011 9:00
260.49
2/11/2011 10:00
45.61
2/11/2011 11:00
-271.73
2/11/2011 12:00
-348.78
2/11/2011 13:00
-315.24
2/11/2011 14:00
-365.47
2/11/2011 15:00
-337.07
2/11/2011 16:00
-312.23
2/11/2011 17:00
97.57
2/11/2011 18:00
-123.13
2/11/2011 19:00
-140.43
2/11/2011 20:00
91.45
2/11/2011 21:00
24.61
2/11/2011 22:00
283.19
2/11/2011 23:00
366.52
2/12/2011 0:00
205.95
2/12/2011 1:00
391.12
2/12/2011 2:00
395.31
2/12/2011 3:00
376.99
2/12/2011 4:00
390.50
2/12/2011 5:00
316.90
2/12/2011 6:00
224.74
2/12/2011 7:00
255.99
2/12/2011 8:00
417.59
2/12/2011 9:00
364.11
2/12/2011 10:00
162.09
2/12/2011 11:00
178.73
2/12/2011 12:00
2.93
2/12/2011 13:00
-49.77
2/12/2011 14:00
-24.18
2/12/2011 15:00
-115.46
2/12/2011 16:00
-72.92
2/12/2011 17:00
181.26
2/12/2011 18:00
285.62
2/12/2011 19:00
216.51
Docket No. ER11-1844
Exhibit No. NYI-4
Page 211 of 375
2/12/2011 20:00
189.40
2/12/2011 21:00
265.58
2/12/2011 22:00
250.25
2/12/2011 23:00
262.33
2/13/2011 0:00
412.49
2/13/2011 1:00
454.71
2/13/2011 2:00
447.25
2/13/2011 3:00
453.54
2/13/2011 4:00
587.97
2/13/2011 5:00
525.46
2/13/2011 6:00
464.41
2/13/2011 7:00
571.19
2/13/2011 8:00
649.11
2/13/2011 9:00
353.62
2/13/2011 10:00
124.48
2/13/2011 11:00
19.99
2/13/2011 12:00
5.83
2/13/2011 13:00
-45.21
2/13/2011 14:00
-102.19
2/13/2011 15:00
-108.59
2/13/2011 16:00
-212.11
2/13/2011 17:00
201.40
2/13/2011 18:00
433.55
2/13/2011 19:00
289.39
2/13/2011 20:00
52.08
2/13/2011 21:00
-96.38
2/13/2011 22:00
-106.34
2/13/2011 23:00
-59.69
2/14/2011 0:00
-209.16
2/14/2011 1:00
-194.66
2/14/2011 2:00
-234.26
2/14/2011 3:00
-274.70
2/14/2011 4:00
2.92
2/14/2011 5:00
-125.28
2/14/2011 6:00
-114.18
2/14/2011 7:00
80.72
2/14/2011 8:00
16.57
2/14/2011 9:00
143.93
2/14/2011 10:00
-69.99
2/14/2011 11:00
-360.59
2/14/2011 12:00
-468.30
2/14/2011 13:00
-346.33
2/14/2011 14:00
-392.23
2/14/2011 15:00
-461.43
2/14/2011 16:00
-428.61
2/14/2011 17:00
114.50
2/14/2011 18:00
356.04
Docket No. ER11-1844
Exhibit No. NYI-4
Page 212 of 375
2/14/2011 19:00
104.07
2/14/2011 20:00
-103.59
2/14/2011 21:00
-113.66
2/14/2011 22:00
-284.83
2/14/2011 23:00
-259.14
2/15/2011 0:00
-115.38
2/15/2011 1:00
-49.75
2/15/2011 2:00
106.98
2/15/2011 3:00
161.19
2/15/2011 4:00
120.97
2/15/2011 5:00
66.04
2/15/2011 6:00
246.98
2/15/2011 7:00
115.96
2/15/2011 8:00
-79.25
2/15/2011 9:00
-197.83
2/15/2011 10:00
-281.76
2/15/2011 11:00
-296.58
2/15/2011 12:00
-385.62
2/15/2011 13:00
-470.23
2/15/2011 14:00
-387.62
2/15/2011 15:00
-365.51
2/15/2011 16:00
-75.39
2/15/2011 17:00
-40.43
2/15/2011 18:00
-54.44
2/15/2011 19:00
-122.58
2/15/2011 20:00
-50.63
2/15/2011 21:00
112.30
2/15/2011 22:00
63.68
2/15/2011 23:00
148.41
2/16/2011 0:00
209.59
2/16/2011 1:00
282.91
2/16/2011 2:00
328.68
2/16/2011 3:00
488.16
2/16/2011 4:00
403.50
2/16/2011 5:00
170.28
2/16/2011 6:00
126.71
2/16/2011 7:00
42.57
2/16/2011 8:00
-37.61
2/16/2011 9:00
-320.52
2/16/2011 10:00
-457.32
2/16/2011 11:00
-443.62
2/16/2011 12:00
-443.04
2/16/2011 13:00
-332.71
2/16/2011 14:00
-336.16
2/16/2011 15:00
-228.94
2/16/2011 16:00
-251.39
2/16/2011 17:00
-107.23
Docket No. ER11-1844
Exhibit No. NYI-4
Page 213 of 375
2/16/2011 18:00
-66.64
2/16/2011 19:00
-99.85
2/16/2011 20:00
-278.61
2/16/2011 21:00
11.59
2/16/2011 22:00
195.40
2/16/2011 23:00
248.35
2/17/2011 0:00
312.80
2/17/2011 1:00
305.21
2/17/2011 2:00
382.39
2/17/2011 3:00
115.08
2/17/2011 4:00
144.43
2/17/2011 5:00
-11.76
2/17/2011 6:00
-159.08
2/17/2011 7:00
-101.98
2/17/2011 8:00
-320.82
2/17/2011 9:00
-197.23
2/17/2011 10:00
-58.76
2/17/2011 11:00
-210.32
2/17/2011 12:00
-138.83
2/17/2011 13:00
-62.16
2/17/2011 14:00
65.13
2/17/2011 15:00
-4.99
2/17/2011 16:00
-107.76
2/17/2011 17:00
-99.47
2/17/2011 18:00
7.93
2/17/2011 19:00
-189.81
2/17/2011 20:00
-286.40
2/17/2011 21:00
-166.22
2/17/2011 22:00
-49.94
2/17/2011 23:00
97.70
2/18/2011 0:00
47.47
2/18/2011 1:00
55.44
2/18/2011 2:00
-22.21
2/18/2011 3:00
-16.57
2/18/2011 4:00
-3.01
2/18/2011 5:00
73.13
2/18/2011 6:00
-120.02
2/18/2011 7:00
98.04
2/18/2011 8:00
159.17
2/18/2011 9:00
46.62
2/18/2011 10:00
-102.07
2/18/2011 11:00
-191.26
2/18/2011 12:00
-53.11
2/18/2011 13:00
94.60
2/18/2011 14:00
242.74
2/18/2011 15:00
401.44
2/18/2011 16:00
370.91
Docket No. ER11-1844
Exhibit No. NYI-4
Page 214 of 375
2/18/2011 17:00
326.92
2/18/2011 18:00
300.90
2/18/2011 19:00
387.09
2/18/2011 20:00
152.00
2/18/2011 21:00
85.82
2/18/2011 22:00
110.74
2/18/2011 23:00
196.05
2/19/2011 0:00
153.42
2/19/2011 1:00
10.61
2/19/2011 2:00
-99.77
2/19/2011 3:00
-192.25
2/19/2011 4:00
-58.32
2/19/2011 5:00
-78.27
2/19/2011 6:00
-213.81
2/19/2011 7:00
-104.44
2/19/2011 8:00
-12.44
2/19/2011 9:00
-94.55
2/19/2011 10:00
-28.80
2/19/2011 11:00
-20.85
2/19/2011 12:00
63.01
2/19/2011 13:00
225.04
2/19/2011 14:00
356.64
2/19/2011 15:00
465.32
2/19/2011 16:00
333.62
2/19/2011 17:00
170.50
2/19/2011 18:00
302.67
2/19/2011 19:00
155.52
2/19/2011 20:00
55.99
2/19/2011 21:00
243.93
2/19/2011 22:00
237.28
2/19/2011 23:00
310.28
2/20/2011 0:00
213.52
2/20/2011 1:00
354.98
2/20/2011 2:00
310.22
2/20/2011 3:00
423.35
2/20/2011 4:00
404.93
2/20/2011 5:00
331.09
2/20/2011 6:00
366.19
2/20/2011 7:00
243.95
2/20/2011 8:00
171.21
2/20/2011 9:00
109.40
2/20/2011 10:00
28.82
2/20/2011 11:00
-87.45
2/20/2011 12:00
-19.12
2/20/2011 13:00
-98.89
2/20/2011 14:00
-259.47
2/20/2011 15:00
-328.25
Docket No. ER11-1844
Exhibit No. NYI-4
Page 215 of 375
2/20/2011 16:00
-238.19
2/20/2011 17:00
-310.17
2/20/2011 18:00
-163.57
2/20/2011 19:00
-135.74
2/20/2011 20:00
-119.15
2/20/2011 21:00
75.64
2/20/2011 22:00
-49.91
2/20/2011 23:00
-12.02
2/21/2011 0:00
124.76
2/21/2011 1:00
131.43
2/21/2011 2:00
129.10
2/21/2011 3:00
22.29
2/21/2011 4:00
-102.87
2/21/2011 5:00
-224.00
2/21/2011 6:00
-69.24
2/21/2011 7:00
84.60
2/21/2011 8:00
266.33
2/21/2011 9:00
306.57
2/21/2011 10:00
140.27
2/21/2011 11:00
40.74
2/21/2011 12:00
-96.54
2/21/2011 13:00
-248.95
2/21/2011 14:00
-75.84
2/21/2011 15:00
93.31
2/21/2011 16:00
40.06
2/21/2011 17:00
71.28
2/21/2011 18:00
-64.29
2/21/2011 19:00
22.80
2/21/2011 20:00
55.47
2/21/2011 21:00
69.53
2/21/2011 22:00
129.27
2/21/2011 23:00
92.66
2/22/2011 0:00
-135.73
2/22/2011 1:00
-106.83
2/22/2011 2:00
178.62
2/22/2011 3:00
183.76
2/22/2011 4:00
166.02
2/22/2011 5:00
113.34
2/22/2011 6:00
193.91
2/22/2011 7:00
597.67
2/22/2011 8:00
653.46
2/22/2011 9:00
599.15
2/22/2011 10:00
328.83
2/22/2011 11:00
133.14
2/22/2011 12:00
87.33
2/22/2011 13:00
17.31
2/22/2011 14:00
120.31
Docket No. ER11-1844
Exhibit No. NYI-4
Page 216 of 375
2/22/2011 15:00
226.11
2/22/2011 16:00
186.88
2/22/2011 17:00
140.04
2/22/2011 18:00
246.00
2/22/2011 19:00
128.94
2/22/2011 20:00
88.71
2/22/2011 21:00
226.97
2/22/2011 22:00
259.02
2/22/2011 23:00
29.17
2/23/2011 0:00
665.92
2/23/2011 1:00
648.80
2/23/2011 2:00
513.92
2/23/2011 3:00
373.51
2/23/2011 4:00
415.41
2/23/2011 5:00
509.33
2/23/2011 6:00
496.47
2/23/2011 7:00
549.89
2/23/2011 8:00
239.17
2/23/2011 9:00
376.22
2/23/2011 10:00
412.72
2/23/2011 11:00
500.53
2/23/2011 12:00
504.90
2/23/2011 13:00
339.64
2/23/2011 14:00
287.65
2/23/2011 15:00
343.93
2/23/2011 16:00
357.25
2/23/2011 17:00
705.83
2/23/2011 18:00
254.63
2/23/2011 19:00
247.93
2/23/2011 20:00
273.22
2/23/2011 21:00
158.42
2/23/2011 22:00
163.23
2/23/2011 23:00
136.27
2/24/2011 0:00
449.94
2/24/2011 1:00
334.65
2/24/2011 2:00
433.60
2/24/2011 3:00
398.34
2/24/2011 4:00
596.82
2/24/2011 5:00
556.36
2/24/2011 6:00
311.64
2/24/2011 7:00
-397.87
2/24/2011 8:00
-136.46
2/24/2011 9:00
428.40
2/24/2011 10:00
409.82
2/24/2011 11:00
-28.79
2/24/2011 12:00
183.83
2/24/2011 13:00
-8.22
Docket No. ER11-1844
Exhibit No. NYI-4
Page 217 of 375
2/24/2011 14:00
-61.80
2/24/2011 15:00
-22.93
2/24/2011 16:00
240.91
2/24/2011 17:00
587.12
2/24/2011 18:00
280.69
2/24/2011 19:00
310.62
2/24/2011 20:00
430.49
2/24/2011 21:00
77.04
2/24/2011 22:00
374.53
2/24/2011 23:00
473.42
2/25/2011 0:00
757.26
2/25/2011 1:00
856.26
2/25/2011 2:00
470.80
2/25/2011 3:00
512.21
2/25/2011 4:00
394.33
2/25/2011 5:00
289.63
2/25/2011 6:00
344.27
2/25/2011 7:00
144.34
2/25/2011 8:00
196.39
2/25/2011 9:00
121.82
2/25/2011 10:00
-22.76
2/25/2011 11:00
314.00
2/25/2011 12:00
355.78
2/25/2011 13:00
454.67
2/25/2011 14:00
301.00
2/25/2011 15:00
426.43
2/25/2011 16:00
474.79
2/25/2011 17:00
472.49
2/25/2011 18:00
491.88
2/25/2011 19:00
574.46
2/25/2011 20:00
548.50
2/25/2011 21:00
414.71
2/25/2011 22:00
753.57
2/25/2011 23:00
793.92
2/26/2011 0:00
730.77
2/26/2011 1:00
523.80
2/26/2011 2:00
397.88
2/26/2011 3:00
433.19
2/26/2011 4:00
349.46
2/26/2011 5:00
135.64
2/26/2011 6:00
85.63
2/26/2011 7:00
181.16
2/26/2011 8:00
203.51
2/26/2011 9:00
141.63
2/26/2011 10:00
88.13
2/26/2011 11:00
-8.14
2/26/2011 12:00
-322.88
Docket No. ER11-1844
Exhibit No. NYI-4
Page 218 of 375
2/26/2011 13:00
-252.39
2/26/2011 14:00
-330.55
2/26/2011 15:00
-274.62
2/26/2011 16:00
-199.71
2/26/2011 17:00
-16.95
2/26/2011 18:00
75.85
2/26/2011 19:00
227.46
2/26/2011 20:00
83.46
2/26/2011 21:00
-0.45
2/26/2011 22:00
166.78
2/26/2011 23:00
143.51
2/27/2011 0:00
105.47
2/27/2011 1:00
73.09
2/27/2011 2:00
119.07
2/27/2011 3:00
191.62
2/27/2011 4:00
234.18
2/27/2011 5:00
-57.50
2/27/2011 6:00
-198.01
2/27/2011 7:00
-87.71
2/27/2011 8:00
12.52
2/27/2011 9:00
-29.38
2/27/2011 10:00
-49.02
2/27/2011 11:00
-115.74
2/27/2011 12:00
-142.28
2/27/2011 13:00
-167.57
2/27/2011 14:00
-94.50
2/27/2011 15:00
-225.94
2/27/2011 16:00
-168.56
2/27/2011 17:00
-223.93
2/27/2011 18:00
47.85
2/27/2011 19:00
-84.92
2/27/2011 20:00
-46.97
2/27/2011 21:00
-26.85
2/27/2011 22:00
0.09
2/27/2011 23:00
304.23
2/28/2011 0:00
392.32
2/28/2011 1:00
478.69
2/28/2011 2:00
518.99
2/28/2011 3:00
448.96
2/28/2011 4:00
520.19
2/28/2011 5:00
398.24
2/28/2011 6:00
155.03
2/28/2011 7:00
154.86
2/28/2011 8:00
179.57
2/28/2011 9:00
112.97
2/28/2011 10:00
422.17
2/28/2011 11:00
401.56
Docket No. ER11-1844
Exhibit No. NYI-4
Page 219 of 375
2/28/2011 12:00
447.48
2/28/2011 13:00
416.73
2/28/2011 14:00
464.02
2/28/2011 15:00
597.73
2/28/2011 16:00
540.40
2/28/2011 17:00
556.45
2/28/2011 18:00
553.37
2/28/2011 19:00
441.61
2/28/2011 20:00
381.03
2/28/2011 21:00
197.71
2/28/2011 22:00
125.57
2/28/2011 23:00
144.50
3/1/2011 0:00
281.46
3/1/2011 1:00
316.83
3/1/2011 2:00
436.59
3/1/2011 3:00
146.58
3/1/2011 4:00
128.81
3/1/2011 5:00
147.66
3/1/2011 6:00
277.96
3/1/2011 7:00
592.82
3/1/2011 8:00
303.91
3/1/2011 9:00
94.19
3/1/2011 10:00
-86.95
3/1/2011 11:00
-227.29
3/1/2011 12:00
17.03
3/1/2011 13:00
8.68
3/1/2011 14:00
-16.85
3/1/2011 15:00
-97.33
3/1/2011 16:00
161.29
3/1/2011 17:00
184.31
3/1/2011 18:00
341.47
3/1/2011 19:00
216.99
3/1/2011 20:00
30.56
3/1/2011 21:00
186.68
3/1/2011 22:00
289.70
3/1/2011 23:00
655.81
3/2/2011 0:00
445.44
3/2/2011 1:00
514.00
3/2/2011 2:00
609.03
3/2/2011 3:00
596.31
3/2/2011 4:00
479.05
3/2/2011 5:00
769.11
3/2/2011 6:00
900.86
3/2/2011 7:00
640.72
3/2/2011 8:00
492.07
3/2/2011 9:00
474.83
3/2/2011 10:00
318.73
Docket No. ER11-1844
Exhibit No. NYI-4
Page 220 of 375
3/2/2011 11:00
67.61
3/2/2011 12:00
130.25
3/2/2011 13:00
93.95
3/2/2011 14:00
58.51
3/2/2011 15:00
267.62
3/2/2011 16:00
347.03
3/2/2011 17:00
468.08
3/2/2011 18:00
386.17
3/2/2011 19:00
306.06
3/2/2011 20:00
606.45
3/2/2011 21:00
403.65
3/2/2011 22:00
231.20
3/2/2011 23:00
289.62
3/3/2011 0:00
466.56
3/3/2011 1:00
453.69
3/3/2011 2:00
652.47
3/3/2011 3:00
575.49
3/3/2011 4:00
590.46
3/3/2011 5:00
891.92
3/3/2011 6:00
700.32
3/3/2011 7:00
577.54
3/3/2011 8:00
682.91
3/3/2011 9:00
813.33
3/3/2011 10:00
750.86
3/3/2011 11:00
446.90
3/3/2011 12:00
508.27
3/3/2011 13:00
73.45
3/3/2011 14:00
61.90
3/3/2011 15:00
247.30
3/3/2011 16:00
207.13
3/3/2011 17:00
502.57
3/3/2011 18:00
315.91
3/3/2011 19:00
586.11
3/3/2011 20:00
446.68
3/3/2011 21:00
539.80
3/3/2011 22:00
404.22
3/3/2011 23:00
478.34
3/4/2011 0:00
410.01
3/4/2011 1:00
573.33
3/4/2011 2:00
518.44
3/4/2011 3:00
378.78
3/4/2011 4:00
584.04
3/4/2011 5:00
464.75
3/4/2011 6:00
278.10
3/4/2011 7:00
293.09
3/4/2011 8:00
439.67
3/4/2011 9:00
585.24
Docket No. ER11-1844
Exhibit No. NYI-4
Page 221 of 375
3/4/2011 10:00
406.15
3/4/2011 11:00
201.51
3/4/2011 12:00
13.96
3/4/2011 13:00
-189.37
3/4/2011 14:00
-112.78
3/4/2011 15:00
4.56
3/4/2011 16:00
270.17
3/4/2011 17:00
109.80
3/4/2011 18:00
192.11
3/4/2011 19:00
20.34
3/4/2011 20:00
-1.92
3/4/2011 21:00
414.92
3/4/2011 22:00
218.15
3/4/2011 23:00
211.36
3/5/2011 0:00
175.69
3/5/2011 1:00
93.09
3/5/2011 2:00
-16.28
3/5/2011 3:00
56.78
3/5/2011 4:00
168.34
3/5/2011 5:00
310.98
3/5/2011 6:00
159.93
3/5/2011 7:00
46.73
3/5/2011 8:00
248.91
3/5/2011 9:00
202.31
3/5/2011 10:00
194.78
3/5/2011 11:00
123.09
3/5/2011 12:00
78.15
3/5/2011 13:00
96.47
3/5/2011 14:00
228.75
3/5/2011 15:00
140.28
3/5/2011 16:00
193.73
3/5/2011 17:00
360.70
3/5/2011 18:00
333.38
3/5/2011 19:00
401.66
3/5/2011 20:00
316.97
3/5/2011 21:00
26.46
3/5/2011 22:00
127.17
3/5/2011 23:00
136.72
3/6/2011 0:00
-60.11
3/6/2011 1:00
-37.52
3/6/2011 2:00
157.25
3/6/2011 3:00
171.56
3/6/2011 4:00
120.05
3/6/2011 5:00
-7.53
3/6/2011 6:00
119.26
3/6/2011 7:00
191.35
3/6/2011 8:00
50.41
Docket No. ER11-1844
Exhibit No. NYI-4
Page 222 of 375
3/6/2011 9:00
27.95
3/6/2011 10:00
-116.50
3/6/2011 11:00
38.15
3/6/2011 12:00
283.18
3/6/2011 13:00
167.55
3/6/2011 14:00
277.00
3/6/2011 15:00
315.95
3/6/2011 16:00
346.59
3/6/2011 17:00
288.33
3/6/2011 18:00
450.79
3/6/2011 19:00
153.32
3/6/2011 20:00
97.73
3/6/2011 21:00
181.84
3/6/2011 22:00
70.65
3/6/2011 23:00
239.61
3/7/2011 0:00
263.79
3/7/2011 1:00
196.51
3/7/2011 2:00
146.01
3/7/2011 3:00
183.23
3/7/2011 4:00
100.19
3/7/2011 5:00
287.14
3/7/2011 6:00
441.83
3/7/2011 7:00
363.60
3/7/2011 8:00
167.17
3/7/2011 9:00
69.87
3/7/2011 10:00
-207.13
3/7/2011 11:00
-356.78
3/7/2011 12:00
-305.23
3/7/2011 13:00
-153.86
3/7/2011 14:00
11.27
3/7/2011 15:00
-16.22
3/7/2011 16:00
160.21
3/7/2011 17:00
114.23
3/7/2011 18:00
-64.10
3/7/2011 19:00
-68.76
3/7/2011 20:00
-98.34
3/7/2011 21:00
93.12
3/7/2011 22:00
399.47
3/7/2011 23:00
343.50
3/8/2011 0:00
351.46
3/8/2011 1:00
462.81
3/8/2011 2:00
471.16
3/8/2011 3:00
416.16
3/8/2011 4:00
278.38
3/8/2011 5:00
600.72
3/8/2011 6:00
353.12
3/8/2011 7:00
187.99
Docket No. ER11-1844
Exhibit No. NYI-4
Page 223 of 375
3/8/2011 8:00
98.91
3/8/2011 9:00
-50.32
3/8/2011 10:00
-141.70
3/8/2011 11:00
-300.90
3/8/2011 12:00
-178.90
3/8/2011 13:00
-144.85
3/8/2011 14:00
-2.75
3/8/2011 15:00
45.93
3/8/2011 16:00
4.40
3/8/2011 17:00
141.08
3/8/2011 18:00
101.38
3/8/2011 19:00
110.19
3/8/2011 20:00
11.50
3/8/2011 21:00
4.91
3/8/2011 22:00
84.78
3/8/2011 23:00
271.30
3/9/2011 0:00
44.59
3/9/2011 1:00
67.67
3/9/2011 2:00
-42.42
3/9/2011 3:00
-97.14
3/9/2011 4:00
92.22
3/9/2011 5:00
-111.49
3/9/2011 6:00
-257.90
3/9/2011 7:00
-335.41
3/9/2011 8:00
-333.55
3/9/2011 9:00
-324.92
3/9/2011 10:00
-243.94
3/9/2011 11:00
-273.23
3/9/2011 12:00
-429.75
3/9/2011 13:00
-85.54
3/9/2011 14:00
-40.09
3/9/2011 15:00
-22.91
3/9/2011 16:00
-48.12
3/9/2011 17:00
162.25
3/9/2011 18:00
107.80
3/9/2011 19:00
57.17
3/9/2011 20:00
-53.97
3/9/2011 21:00
40.80
3/9/2011 22:00
198.54
3/9/2011 23:00
189.30
3/10/2011 0:00
318.90
3/10/2011 1:00
440.67
3/10/2011 2:00
298.21
3/10/2011 3:00
261.18
3/10/2011 4:00
376.55
3/10/2011 5:00
249.67
3/10/2011 6:00
145.40
Docket No. ER11-1844
Exhibit No. NYI-4
Page 224 of 375
3/10/2011 7:00
152.63
3/10/2011 8:00
37.82
3/10/2011 9:00
83.89
3/10/2011 10:00
362.58
3/10/2011 11:00
237.70
3/10/2011 12:00
6.97
3/10/2011 13:00
321.51
3/10/2011 14:00
232.37
3/10/2011 15:00
294.42
3/10/2011 16:00
308.08
3/10/2011 17:00
277.47
3/10/2011 18:00
360.43
3/10/2011 19:00
448.44
3/10/2011 20:00
127.08
3/10/2011 21:00
-86.82
3/10/2011 22:00
-97.15
3/10/2011 23:00
-1.54
3/11/2011 0:00
1.64
3/11/2011 1:00
-137.68
3/11/2011 2:00
57.43
3/11/2011 3:00
-83.31
3/11/2011 4:00
92.20
3/11/2011 5:00
2.59
3/11/2011 6:00
-83.14
3/11/2011 7:00
-205.47
3/11/2011 8:00
-207.26
3/11/2011 9:00
-166.73
3/11/2011 10:00
-24.02
3/11/2011 11:00
-73.08
3/11/2011 12:00
-6.35
3/11/2011 13:00
153.81
3/11/2011 14:00
162.07
3/11/2011 15:00
353.00
3/11/2011 16:00
287.82
3/11/2011 17:00
184.97
3/11/2011 18:00
414.29
3/11/2011 19:00
261.90
3/11/2011 20:00
235.21
3/11/2011 21:00
97.88
3/11/2011 22:00
98.28
3/11/2011 23:00
225.76
3/12/2011 0:00
277.42
3/12/2011 1:00
155.80
3/12/2011 2:00
90.81
3/12/2011 3:00
54.54
3/12/2011 4:00
162.74
3/12/2011 5:00
259.94
Docket No. ER11-1844
Exhibit No. NYI-4
Page 225 of 375
3/12/2011 6:00
245.82
3/12/2011 7:00
376.32
3/12/2011 8:00
82.21
3/12/2011 9:00
293.35
3/12/2011 10:00
255.38
3/12/2011 11:00
397.46
3/12/2011 12:00
184.85
3/12/2011 13:00
235.30
3/12/2011 14:00
-6.62
3/12/2011 15:00
164.98
3/12/2011 16:00
191.99
3/12/2011 17:00
337.45
3/12/2011 18:00
458.09
3/12/2011 19:00
382.34
3/12/2011 20:00
427.80
3/12/2011 21:00
393.29
3/12/2011 22:00
173.54
3/12/2011 23:00
111.50
3/13/2011 0:00
-307.97
3/13/2011 1:00
-488.55
3/13/2011 2:00
-488.55
3/13/2011 3:00
-270.39
3/13/2011 4:00
-159.66
3/13/2011 5:00
-134.62
3/13/2011 6:00
-92.88
3/13/2011 7:00
-10.19
3/13/2011 8:00
163.72
3/13/2011 9:00
268.68
3/13/2011 10:00
333.75
3/13/2011 11:00
235.73
3/13/2011 12:00
156.12
3/13/2011 13:00
156.69
3/13/2011 14:00
156.27
3/13/2011 15:00
157.19
3/13/2011 16:00
133.51
3/13/2011 17:00
256.10
3/13/2011 18:00
205.61
3/13/2011 19:00
317.41
3/13/2011 20:00
313.64
3/13/2011 21:00
316.35
3/13/2011 22:00
201.78
3/13/2011 23:00
197.38
3/14/2011 0:00
40.84
3/14/2011 1:00
298.99
3/14/2011 2:00
211.03
3/14/2011 3:00
218.99
3/14/2011 4:00
317.29
Docket No. ER11-1844
Exhibit No. NYI-4
Page 226 of 375
3/14/2011 5:00
343.69
3/14/2011 6:00
661.13
3/14/2011 7:00
328.63
3/14/2011 8:00
230.91
3/14/2011 9:00
285.61
3/14/2011 10:00
363.31
3/14/2011 11:00
353.69
3/14/2011 12:00
353.26
3/14/2011 13:00
477.44
3/14/2011 14:00
446.19
3/14/2011 15:00
316.92
3/14/2011 16:00
258.59
3/14/2011 17:00
386.58
3/14/2011 18:00
487.73
3/14/2011 19:00
394.74
3/14/2011 20:00
673.86
3/14/2011 21:00
522.59
3/14/2011 22:00
492.94
3/14/2011 23:00
251.01
3/15/2011 0:00
511.74
3/15/2011 1:00
303.79
3/15/2011 2:00
195.02
3/15/2011 3:00
311.12
3/15/2011 4:00
313.67
3/15/2011 5:00
317.90
3/15/2011 6:00
647.81
3/15/2011 7:00
249.54
3/15/2011 8:00
196.52
3/15/2011 9:00
136.40
3/15/2011 10:00
75.04
3/15/2011 11:00
254.64
3/15/2011 12:00
-125.16
3/15/2011 13:00
120.85
3/15/2011 14:00
-40.86
3/15/2011 15:00
10.63
3/15/2011 16:00
38.13
3/15/2011 17:00
173.56
3/15/2011 18:00
270.80
3/15/2011 19:00
207.20
3/15/2011 20:00
483.92
3/15/2011 21:00
592.09
3/15/2011 22:00
358.83
3/15/2011 23:00
195.79
3/16/2011 0:00
-66.01
3/16/2011 1:00
-68.46
3/16/2011 2:00
-23.35
3/16/2011 3:00
5.05
Docket No. ER11-1844
Exhibit No. NYI-4
Page 227 of 375
3/16/2011 4:00
-66.40
3/16/2011 5:00
97.59
3/16/2011 6:00
-53.41
3/16/2011 7:00
97.99
3/16/2011 8:00
305.98
3/16/2011 9:00
223.50
3/16/2011 10:00
108.33
3/16/2011 11:00
12.14
3/16/2011 12:00
-65.42
3/16/2011 13:00
-96.35
3/16/2011 14:00
-193.01
3/16/2011 15:00
-146.45
3/16/2011 16:00
-21.83
3/16/2011 17:00
40.62
3/16/2011 18:00
-34.35
3/16/2011 19:00
45.76
3/16/2011 20:00
91.54
3/16/2011 21:00
-38.99
3/16/2011 22:00
-154.26
3/16/2011 23:00
-97.82
3/17/2011 0:00
-99.77
3/17/2011 1:00
17.32
3/17/2011 2:00
75.72
3/17/2011 3:00
125.46
3/17/2011 4:00
-247.01
3/17/2011 5:00
-158.39
3/17/2011 6:00
-131.05
3/17/2011 7:00
13.60
3/17/2011 8:00
-145.71
3/17/2011 9:00
24.80
3/17/2011 10:00
180.12
3/17/2011 11:00
146.47
3/17/2011 12:00
221.18
3/17/2011 13:00
92.57
3/17/2011 14:00
14.10
3/17/2011 15:00
-51.83
3/17/2011 16:00
196.91
3/17/2011 17:00
304.64
3/17/2011 18:00
148.52
3/17/2011 19:00
258.07
3/17/2011 20:00
208.26
3/17/2011 21:00
65.48
3/17/2011 22:00
142.19
3/17/2011 23:00
107.45
3/18/2011 0:00
344.18
3/18/2011 1:00
382.01
3/18/2011 2:00
362.39
Docket No. ER11-1844
Exhibit No. NYI-4
Page 228 of 375
3/18/2011 3:00
343.43
3/18/2011 4:00
383.36
3/18/2011 5:00
222.02
3/18/2011 6:00
138.05
3/18/2011 7:00
434.72
3/18/2011 8:00
470.14
3/18/2011 9:00
217.72
3/18/2011 10:00
281.60
3/18/2011 11:00
230.87
3/18/2011 12:00
278.35
3/18/2011 13:00
336.31
3/18/2011 14:00
168.85
3/18/2011 15:00
216.97
3/18/2011 16:00
317.00
3/18/2011 17:00
389.53
3/18/2011 18:00
383.71
3/18/2011 19:00
452.82
3/18/2011 20:00
128.87
3/18/2011 21:00
236.70
3/18/2011 22:00
178.00
3/18/2011 23:00
221.26
3/19/2011 0:00
301.72
3/19/2011 1:00
252.01
3/19/2011 2:00
220.18
3/19/2011 3:00
301.85
3/19/2011 4:00
194.63
3/19/2011 5:00
247.99
3/19/2011 6:00
136.61
3/19/2011 7:00
-30.20
3/19/2011 8:00
28.59
3/19/2011 9:00
118.07
3/19/2011 10:00
217.90
3/19/2011 11:00
387.35
3/19/2011 12:00
293.48
3/19/2011 13:00
261.22
3/19/2011 14:00
298.91
3/19/2011 15:00
347.17
3/19/2011 16:00
318.41
3/19/2011 17:00
240.42
3/19/2011 18:00
257.14
3/19/2011 19:00
349.96
3/19/2011 20:00
240.38
3/19/2011 21:00
286.73
3/19/2011 22:00
245.21
3/19/2011 23:00
458.58
3/20/2011 0:00
491.04
3/20/2011 1:00
454.31
Docket No. ER11-1844
Exhibit No. NYI-4
Page 229 of 375
3/20/2011 2:00
523.73
3/20/2011 3:00
596.45
3/20/2011 4:00
621.52
3/20/2011 5:00
592.55
3/20/2011 6:00
515.69
3/20/2011 7:00
458.47
3/20/2011 8:00
502.57
3/20/2011 9:00
437.67
3/20/2011 10:00
294.25
3/20/2011 11:00
259.06
3/20/2011 12:00
390.07
3/20/2011 13:00
267.88
3/20/2011 14:00
348.68
3/20/2011 15:00
351.01
3/20/2011 16:00
213.10
3/20/2011 17:00
189.23
3/20/2011 18:00
207.01
3/20/2011 19:00
252.52
3/20/2011 20:00
210.24
3/20/2011 21:00
267.81
3/20/2011 22:00
277.77
3/20/2011 23:00
304.71
3/21/2011 0:00
299.34
3/21/2011 1:00
304.74
3/21/2011 2:00
244.49
3/21/2011 3:00
393.71
3/21/2011 4:00
402.44
3/21/2011 5:00
430.88
3/21/2011 6:00
335.92
3/21/2011 7:00
139.79
3/21/2011 8:00
394.00
3/21/2011 9:00
386.02
3/21/2011 10:00
504.42
3/21/2011 11:00
763.91
3/21/2011 12:00
568.80
3/21/2011 13:00
552.95
3/21/2011 14:00
503.97
3/21/2011 15:00
379.28
3/21/2011 16:00
405.76
3/21/2011 17:00
591.39
3/21/2011 18:00
870.94
3/21/2011 19:00
462.07
3/21/2011 20:00
467.54
3/21/2011 21:00
159.76
3/21/2011 22:00
18.08
3/21/2011 23:00
-189.93
3/22/2011 0:00
-230.37
Docket No. ER11-1844
Exhibit No. NYI-4
Page 230 of 375
3/22/2011 1:00
-37.37
3/22/2011 2:00
-8.16
3/22/2011 3:00
28.72
3/22/2011 4:00
-136.34
3/22/2011 5:00
-252.68
3/22/2011 6:00
-134.62
3/22/2011 7:00
92.37
3/22/2011 8:00
205.49
3/22/2011 9:00
152.74
3/22/2011 10:00
167.26
3/22/2011 11:00
278.78
3/22/2011 12:00
316.14
3/22/2011 13:00
214.11
3/22/2011 14:00
-69.48
3/22/2011 15:00
-145.44
3/22/2011 16:00
-149.23
3/22/2011 17:00
-46.36
3/22/2011 18:00
-50.21
3/22/2011 19:00
12.35
3/22/2011 20:00
366.19
3/22/2011 21:00
-189.45
3/22/2011 22:00
-244.03
3/22/2011 23:00
-12.70
3/23/2011 0:00
31.43
3/23/2011 1:00
270.36
3/23/2011 2:00
130.70
3/23/2011 3:00
221.04
3/23/2011 4:00
377.87
3/23/2011 5:00
149.06
3/23/2011 6:00
67.82
3/23/2011 7:00
60.62
3/23/2011 8:00
63.70
3/23/2011 9:00
162.85
3/23/2011 10:00
232.15
3/23/2011 11:00
275.64
3/23/2011 12:00
205.10
3/23/2011 13:00
237.94
3/23/2011 14:00
308.80
3/23/2011 15:00
327.25
3/23/2011 16:00
196.20
3/23/2011 17:00
273.32
3/23/2011 18:00
441.07
3/23/2011 19:00
226.71
3/23/2011 20:00
250.46
3/23/2011 21:00
308.31
3/23/2011 22:00
61.17
3/23/2011 23:00
217.45
Docket No. ER11-1844
Exhibit No. NYI-4
Page 231 of 375
3/24/2011 0:00
320.88
3/24/2011 1:00
313.97
3/24/2011 2:00
222.13
3/24/2011 3:00
209.68
3/24/2011 4:00
304.13
3/24/2011 5:00
633.98
3/24/2011 6:00
647.93
3/24/2011 7:00
740.63
3/24/2011 8:00
448.05
3/24/2011 9:00
512.97
3/24/2011 10:00
464.48
3/24/2011 11:00
594.05
3/24/2011 12:00
458.32
3/24/2011 13:00
295.48
3/24/2011 14:00
157.27
3/24/2011 15:00
191.08
3/24/2011 16:00
368.61
3/24/2011 17:00
443.97
3/24/2011 18:00
391.34
3/24/2011 19:00
570.14
3/24/2011 20:00
517.15
3/24/2011 21:00
518.62
3/24/2011 22:00
496.88
3/24/2011 23:00
537.03
3/25/2011 0:00
466.20
3/25/2011 1:00
542.77
3/25/2011 2:00
425.29
3/25/2011 3:00
431.85
3/25/2011 4:00
457.39
3/25/2011 5:00
389.54
3/25/2011 6:00
823.75
3/25/2011 7:00
592.65
3/25/2011 8:00
465.86
3/25/2011 9:00
484.46
3/25/2011 10:00
321.23
3/25/2011 11:00
305.73
3/25/2011 12:00
494.25
3/25/2011 13:00
372.36
3/25/2011 14:00
396.43
3/25/2011 15:00
252.17
3/25/2011 16:00
378.70
3/25/2011 17:00
431.01
3/25/2011 18:00
643.47
3/25/2011 19:00
699.27
3/25/2011 20:00
383.55
3/25/2011 21:00
691.21
3/25/2011 22:00
733.09
Docket No. ER11-1844
Exhibit No. NYI-4
Page 232 of 375
3/25/2011 23:00
726.04
3/26/2011 0:00
627.93
3/26/2011 1:00
557.17
3/26/2011 2:00
517.00
3/26/2011 3:00
531.96
3/26/2011 4:00
376.96
3/26/2011 5:00
429.36
3/26/2011 6:00
385.29
3/26/2011 7:00
299.37
3/26/2011 8:00
433.67
3/26/2011 9:00
534.13
3/26/2011 10:00
293.18
3/26/2011 11:00
258.08
3/26/2011 12:00
198.33
3/26/2011 13:00
-105.39
3/26/2011 14:00
-66.40
3/26/2011 15:00
42.26
3/26/2011 16:00
133.48
3/26/2011 17:00
220.44
3/26/2011 18:00
337.14
3/26/2011 19:00
555.67
3/26/2011 20:00
309.49
3/26/2011 21:00
447.45
3/26/2011 22:00
343.31
3/26/2011 23:00
416.00
3/27/2011 0:00
462.68
3/27/2011 1:00
385.36
3/27/2011 2:00
351.90
3/27/2011 3:00
372.78
3/27/2011 4:00
413.26
3/27/2011 5:00
356.19
3/27/2011 6:00
250.35
3/27/2011 7:00
257.00
3/27/2011 8:00
430.94
3/27/2011 9:00
477.16
3/27/2011 10:00
490.08
3/27/2011 11:00
307.93
3/27/2011 12:00
344.33
3/27/2011 13:00
288.32
3/27/2011 14:00
252.49
3/27/2011 15:00
117.39
3/27/2011 16:00
119.00
3/27/2011 17:00
7.42
3/27/2011 18:00
215.13
3/27/2011 19:00
723.44
3/27/2011 20:00
439.52
3/27/2011 21:00
445.28
Docket No. ER11-1844
Exhibit No. NYI-4
Page 233 of 375
3/27/2011 22:00
617.32
3/27/2011 23:00
597.33
3/28/2011 0:00
613.49
3/28/2011 1:00
599.47
3/28/2011 2:00
616.05
3/28/2011 3:00
530.97
3/28/2011 4:00
393.61
3/28/2011 5:00
609.97
3/28/2011 6:00
659.32
3/28/2011 7:00
390.40
3/28/2011 8:00
354.37
3/28/2011 9:00
325.85
3/28/2011 10:00
377.23
3/28/2011 11:00
552.26
3/28/2011 12:00
412.46
3/28/2011 13:00
467.81
3/28/2011 14:00
565.87
3/28/2011 15:00
452.30
3/28/2011 16:00
345.22
3/28/2011 17:00
500.05
3/28/2011 18:00
747.62
3/28/2011 19:00
637.37
3/28/2011 20:00
452.78
3/28/2011 21:00
458.84
3/28/2011 22:00
508.58
3/28/2011 23:00
345.56
3/29/2011 0:00
507.11
3/29/2011 1:00
512.90
3/29/2011 2:00
474.35
3/29/2011 3:00
507.42
3/29/2011 4:00
411.73
3/29/2011 5:00
293.51
3/29/2011 6:00
936.20
3/29/2011 7:00
377.03
3/29/2011 8:00
518.07
3/29/2011 9:00
412.28
3/29/2011 10:00
522.88
3/29/2011 11:00
495.09
3/29/2011 12:00
265.40
3/29/2011 13:00
168.41
3/29/2011 14:00
175.30
3/29/2011 15:00
156.00
3/29/2011 16:00
158.40
3/29/2011 17:00
241.31
3/29/2011 18:00
411.24
3/29/2011 19:00
486.72
3/29/2011 20:00
587.17
Docket No. ER11-1844
Exhibit No. NYI-4
Page 234 of 375
3/29/2011 21:00
492.05
3/29/2011 22:00
182.99
3/29/2011 23:00
395.05
3/30/2011 0:00
386.62
3/30/2011 1:00
257.90
3/30/2011 2:00
213.55
3/30/2011 3:00
135.65
3/30/2011 4:00
199.10
3/30/2011 5:00
122.45
3/30/2011 6:00
-6.49
3/30/2011 7:00
259.53
3/30/2011 8:00
144.26
3/30/2011 9:00
95.17
3/30/2011 10:00
-33.37
3/30/2011 11:00
135.61
3/30/2011 12:00
14.69
3/30/2011 13:00
-46.75
3/30/2011 14:00
-164.05
3/30/2011 15:00
-115.56
3/30/2011 16:00
-64.05
3/30/2011 17:00
-8.99
3/30/2011 18:00
132.63
3/30/2011 19:00
529.93
3/30/2011 20:00
613.44
3/30/2011 21:00
308.60
3/30/2011 22:00
214.12
3/30/2011 23:00
240.60
3/31/2011 0:00
262.79
3/31/2011 1:00
356.76
3/31/2011 2:00
362.62
3/31/2011 3:00
374.56
3/31/2011 4:00
420.43
3/31/2011 5:00
434.58
3/31/2011 6:00
124.32
3/31/2011 7:00
492.83
3/31/2011 8:00
476.41
3/31/2011 9:00
292.22
3/31/2011 10:00
187.32
3/31/2011 11:00
220.16
3/31/2011 12:00
656.76
3/31/2011 13:00
583.68
3/31/2011 14:00
496.03
3/31/2011 15:00
313.61
3/31/2011 16:00
401.79
3/31/2011 17:00
239.18
3/31/2011 18:00
328.70
3/31/2011 19:00
524.40
Docket No. ER11-1844
Exhibit No. NYI-4
Page 235 of 375
3/31/2011 20:00
799.87
3/31/2011 21:00
569.92
3/31/2011 22:00
477.03
3/31/2011 23:00
443.09
4/1/2011 0:00
583.66
4/1/2011 1:00
508.59
4/1/2011 2:00
436.05
4/1/2011 3:00
469.84
4/1/2011 4:00
451.48
4/1/2011 5:00
315.04
4/1/2011 6:00
-10.23
4/1/2011 7:00
119.04
4/1/2011 8:00
213.43
4/1/2011 9:00
244.03
4/1/2011 10:00
298.02
4/1/2011 11:00
183.40
4/1/2011 12:00
158.07
4/1/2011 13:00
-79.58
4/1/2011 14:00
-158.34
4/1/2011 15:00
-158.62
4/1/2011 16:00
-151.36
4/1/2011 17:00
16.69
4/1/2011 18:00
94.88
4/1/2011 19:00
177.06
4/1/2011 20:00
122.74
4/1/2011 21:00
-24.36
4/1/2011 22:00
46.41
4/1/2011 23:00
370.92
4/2/2011 0:00
531.25
4/2/2011 1:00
639.78
4/2/2011 2:00
449.40
4/2/2011 3:00
427.22
4/2/2011 4:00
452.35
4/2/2011 5:00
435.50
4/2/2011 6:00
275.26
4/2/2011 7:00
208.51
4/2/2011 8:00
202.95
4/2/2011 9:00
211.54
4/2/2011 10:00
286.98
4/2/2011 11:00
264.05
4/2/2011 12:00
379.08
4/2/2011 13:00
281.31
4/2/2011 14:00
418.92
4/2/2011 15:00
568.64
4/2/2011 16:00
457.09
4/2/2011 17:00
469.07
4/2/2011 18:00
423.74
Docket No. ER11-1844
Exhibit No. NYI-4
Page 236 of 375
4/2/2011 19:00
443.56
4/2/2011 20:00
200.88
4/2/2011 21:00
-32.81
4/2/2011 22:00
423.23
4/2/2011 23:00
212.82
4/3/2011 0:00
214.55
4/3/2011 1:00
216.03
4/3/2011 2:00
193.37
4/3/2011 3:00
291.07
4/3/2011 4:00
321.20
4/3/2011 5:00
445.16
4/3/2011 6:00
469.50
4/3/2011 7:00
424.50
4/3/2011 8:00
250.69
4/3/2011 9:00
262.32
4/3/2011 10:00
295.37
4/3/2011 11:00
207.30
4/3/2011 12:00
335.61
4/3/2011 13:00
320.60
4/3/2011 14:00
205.64
4/3/2011 15:00
62.81
4/3/2011 16:00
89.91
4/3/2011 17:00
117.79
4/3/2011 18:00
102.29
4/3/2011 19:00
323.42
4/3/2011 20:00
327.90
4/3/2011 21:00
127.22
4/3/2011 22:00
206.00
4/3/2011 23:00
257.37
4/4/2011 0:00
175.91
4/4/2011 1:00
302.05
4/4/2011 2:00
278.56
4/4/2011 3:00
404.51
4/4/2011 4:00
278.47
4/4/2011 5:00
71.76
4/4/2011 6:00
-23.79
4/4/2011 7:00
223.58
4/4/2011 8:00
1.87
4/4/2011 9:00
167.84
4/4/2011 10:00
8.34
4/4/2011 11:00
-133.83
4/4/2011 12:00
-218.81
4/4/2011 13:00
-174.60
4/4/2011 14:00
-152.49
4/4/2011 15:00
-268.38
4/4/2011 16:00
-248.26
4/4/2011 17:00
-231.83
Docket No. ER11-1844
Exhibit No. NYI-4
Page 237 of 375
4/4/2011 18:00
-203.89
4/4/2011 19:00
-215.36
4/4/2011 20:00
-277.90
4/4/2011 21:00
-213.04
4/4/2011 22:00
146.35
4/4/2011 23:00
291.25
4/5/2011 0:00
300.23
4/5/2011 1:00
113.00
4/5/2011 2:00
3.14
4/5/2011 3:00
-76.24
4/5/2011 4:00
32.35
4/5/2011 5:00
109.11
4/5/2011 6:00
-127.55
4/5/2011 7:00
119.78
4/5/2011 8:00
114.94
4/5/2011 9:00
-180.46
4/5/2011 10:00
-95.10
4/5/2011 11:00
-191.56
4/5/2011 12:00
-336.66
4/5/2011 13:00
-143.60
4/5/2011 14:00
-200.84
4/5/2011 15:00
80.11
4/5/2011 16:00
-28.22
4/5/2011 17:00
-33.78
4/5/2011 18:00
5.05
4/5/2011 19:00
252.86
4/5/2011 20:00
33.55
4/5/2011 21:00
155.15
4/5/2011 22:00
233.44
4/5/2011 23:00
317.18
4/6/2011 0:00
395.39
4/6/2011 1:00
370.84
4/6/2011 2:00
262.29
4/6/2011 3:00
217.05
4/6/2011 4:00
231.40
4/6/2011 5:00
213.97
4/6/2011 6:00
360.94
4/6/2011 7:00
250.55
4/6/2011 8:00
310.16
4/6/2011 9:00
132.75
4/6/2011 10:00
38.68
4/6/2011 11:00
-242.83
4/6/2011 12:00
-36.60
4/6/2011 13:00
70.37
4/6/2011 14:00
-66.20
4/6/2011 15:00
-76.82
4/6/2011 16:00
27.17
Docket No. ER11-1844
Exhibit No. NYI-4
Page 238 of 375
4/6/2011 17:00
-72.32
4/6/2011 18:00
-33.02
4/6/2011 19:00
-35.58
4/6/2011 20:00
95.06
4/6/2011 21:00
47.30
4/6/2011 22:00
126.16
4/6/2011 23:00
309.60
4/7/2011 0:00
338.12
4/7/2011 1:00
248.87
4/7/2011 2:00
302.26
4/7/2011 3:00
220.57
4/7/2011 4:00
150.24
4/7/2011 5:00
101.12
4/7/2011 6:00
-1.96
4/7/2011 7:00
87.54
4/7/2011 8:00
167.70
4/7/2011 9:00
102.09
4/7/2011 10:00
-65.70
4/7/2011 11:00
3.30
4/7/2011 12:00
-96.91
4/7/2011 13:00
-61.70
4/7/2011 14:00
-90.98
4/7/2011 15:00
-22.09
4/7/2011 16:00
13.29
4/7/2011 17:00
161.75
4/7/2011 18:00
305.78
4/7/2011 19:00
101.71
4/7/2011 20:00
-37.85
4/7/2011 21:00
111.70
4/7/2011 22:00
191.06
4/7/2011 23:00
412.94
4/8/2011 0:00
322.40
4/8/2011 1:00
314.75
4/8/2011 2:00
339.29
4/8/2011 3:00
278.18
4/8/2011 4:00
225.54
4/8/2011 5:00
21.48
4/8/2011 6:00
-120.96
4/8/2011 7:00
-18.34
4/8/2011 8:00
85.59
4/8/2011 9:00
-37.63
4/8/2011 10:00
-10.99
4/8/2011 11:00
40.67
4/8/2011 12:00
41.24
4/8/2011 13:00
-23.46
4/8/2011 14:00
127.23
4/8/2011 15:00
124.84
Docket No. ER11-1844
Exhibit No. NYI-4
Page 239 of 375
4/8/2011 16:00
484.23
4/8/2011 17:00
564.98
4/8/2011 18:00
618.20
4/8/2011 19:00
698.92
4/8/2011 20:00
458.47
4/8/2011 21:00
372.88
4/8/2011 22:00
404.43
4/8/2011 23:00
390.58
4/9/2011 0:00
329.75
4/9/2011 1:00
330.05
4/9/2011 2:00
330.02
4/9/2011 3:00
391.91
4/9/2011 4:00
410.75
4/9/2011 5:00
313.54
4/9/2011 6:00
159.10
4/9/2011 7:00
215.80
4/9/2011 8:00
212.33
4/9/2011 9:00
88.94
4/9/2011 10:00
333.76
4/9/2011 11:00
295.05
4/9/2011 12:00
336.58
4/9/2011 13:00
62.88
4/9/2011 14:00
120.56
4/9/2011 15:00
220.69
4/9/2011 16:00
453.56
4/9/2011 17:00
387.75
4/9/2011 18:00
465.70
4/9/2011 19:00
597.78
4/9/2011 20:00
604.22
4/9/2011 21:00
569.86
4/9/2011 22:00
461.15
4/9/2011 23:00
192.11
4/10/2011 0:00
344.80
4/10/2011 1:00
653.98
4/10/2011 2:00
519.27
4/10/2011 3:00
506.66
4/10/2011 4:00
634.98
4/10/2011 5:00
562.89
4/10/2011 6:00
550.65
4/10/2011 7:00
430.97
4/10/2011 8:00
473.82
4/10/2011 9:00
568.92
4/10/2011 10:00
491.53
4/10/2011 11:00
492.62
4/10/2011 12:00
160.84
4/10/2011 13:00
246.00
4/10/2011 14:00
-27.45
Docket No. ER11-1844
Exhibit No. NYI-4
Page 240 of 375
4/10/2011 15:00
16.28
4/10/2011 16:00
69.17
4/10/2011 17:00
94.16
4/10/2011 18:00
115.68
4/10/2011 19:00
145.32
4/10/2011 20:00
96.19
4/10/2011 21:00
403.48
4/10/2011 22:00
429.80
4/10/2011 23:00
208.41
4/11/2011 0:00
80.09
4/11/2011 1:00
404.26
4/11/2011 2:00
368.58
4/11/2011 3:00
242.90
4/11/2011 4:00
237.87
4/11/2011 5:00
278.39
4/11/2011 6:00
106.18
4/11/2011 7:00
308.98
4/11/2011 8:00
73.23
4/11/2011 9:00
63.27
4/11/2011 10:00
232.53
4/11/2011 11:00
220.31
4/11/2011 12:00
304.80
4/11/2011 13:00
188.81
4/11/2011 14:00
382.22
4/11/2011 15:00
141.12
4/11/2011 16:00
87.37
4/11/2011 17:00
88.63
4/11/2011 18:00
35.96
4/11/2011 19:00
284.11
4/11/2011 20:00
366.51
4/11/2011 21:00
31.73
4/11/2011 22:00
328.49
4/11/2011 23:00
339.59
4/12/2011 0:00
329.02
4/12/2011 1:00
419.09
4/12/2011 2:00
393.89
4/12/2011 3:00
389.08
4/12/2011 4:00
365.15
4/12/2011 5:00
191.60
4/12/2011 6:00
-10.42
4/12/2011 7:00
385.77
4/12/2011 8:00
349.92
4/12/2011 9:00
374.44
4/12/2011 10:00
452.32
4/12/2011 11:00
300.08
4/12/2011 12:00
75.50
4/12/2011 13:00
360.98
Docket No. ER11-1844
Exhibit No. NYI-4
Page 241 of 375
4/12/2011 14:00
367.42
4/12/2011 15:00
345.93
4/12/2011 16:00
300.07
4/12/2011 17:00
325.48
4/12/2011 18:00
286.31
4/12/2011 19:00
488.51
4/12/2011 20:00
115.79
4/12/2011 21:00
126.93
4/12/2011 22:00
276.17
4/12/2011 23:00
383.58
4/13/2011 0:00
324.06
4/13/2011 1:00
268.23
4/13/2011 2:00
222.16
4/13/2011 3:00
197.98
4/13/2011 4:00
148.24
4/13/2011 5:00
61.94
4/13/2011 6:00
-13.13
4/13/2011 7:00
151.72
4/13/2011 8:00
466.37
4/13/2011 9:00
519.71
4/13/2011 10:00
208.43
4/13/2011 11:00
411.00
4/13/2011 12:00
265.52
4/13/2011 13:00
348.01
4/13/2011 14:00
199.81
4/13/2011 15:00
224.11
4/13/2011 16:00
240.51
4/13/2011 17:00
306.55
4/13/2011 18:00
314.80
4/13/2011 19:00
274.22
4/13/2011 20:00
375.58
4/13/2011 21:00
275.43
4/13/2011 22:00
241.56
4/13/2011 23:00
338.17
4/14/2011 0:00
221.45
4/14/2011 1:00
245.28
4/14/2011 2:00
199.27
4/14/2011 3:00
317.69
4/14/2011 4:00
274.70
4/14/2011 5:00
15.92
4/14/2011 6:00
-171.69
4/14/2011 7:00
-291.24
4/14/2011 8:00
-158.32
4/14/2011 9:00
42.18
4/14/2011 10:00
145.33
4/14/2011 11:00
593.10
4/14/2011 12:00
469.55
Docket No. ER11-1844
Exhibit No. NYI-4
Page 242 of 375
4/14/2011 13:00
644.93
4/14/2011 14:00
404.77
4/14/2011 15:00
189.65
4/14/2011 16:00
167.31
4/14/2011 17:00
-135.01
4/14/2011 18:00
1.15
4/14/2011 19:00
137.63
4/14/2011 20:00
93.11
4/14/2011 21:00
186.95
4/14/2011 22:00
-7.48
4/14/2011 23:00
153.52
4/15/2011 0:00
323.54
4/15/2011 1:00
390.26
4/15/2011 2:00
369.56
4/15/2011 3:00
302.94
4/15/2011 4:00
224.83
4/15/2011 5:00
173.21
4/15/2011 6:00
-53.86
4/15/2011 7:00
-85.51
4/15/2011 8:00
20.76
4/15/2011 9:00
192.26
4/15/2011 10:00
316.41
4/15/2011 11:00
107.45
4/15/2011 12:00
105.71
4/15/2011 13:00
209.75
4/15/2011 14:00
110.10
4/15/2011 15:00
167.37
4/15/2011 16:00
58.00
4/15/2011 17:00
119.51
4/15/2011 18:00
223.63
4/15/2011 19:00
321.58
4/15/2011 20:00
333.50
4/15/2011 21:00
260.25
4/15/2011 22:00
296.75
4/15/2011 23:00
267.58
4/16/2011 0:00
387.59
4/16/2011 1:00
237.09
4/16/2011 2:00
109.82
4/16/2011 3:00
300.87
4/16/2011 4:00
240.59
4/16/2011 5:00
306.65
4/16/2011 6:00
188.14
4/16/2011 7:00
268.47
4/16/2011 8:00
281.78
4/16/2011 9:00
232.35
4/16/2011 10:00
429.24
4/16/2011 11:00
372.16
Docket No. ER11-1844
Exhibit No. NYI-4
Page 243 of 375
4/16/2011 12:00
522.16
4/16/2011 13:00
323.64
4/16/2011 14:00
172.61
4/16/2011 15:00
254.72
4/16/2011 16:00
209.01
4/16/2011 17:00
189.07
4/16/2011 18:00
228.07
4/16/2011 19:00
119.65
4/16/2011 20:00
308.90
4/16/2011 21:00
105.22
4/16/2011 22:00
393.05
4/16/2011 23:00
194.71
4/17/2011 0:00
114.82
4/17/2011 1:00
137.44
4/17/2011 2:00
206.40
4/17/2011 3:00
164.11
4/17/2011 4:00
138.37
4/17/2011 5:00
306.14
4/17/2011 6:00
239.63
4/17/2011 7:00
186.84
4/17/2011 8:00
201.42
4/17/2011 9:00
286.53
4/17/2011 10:00
289.46
4/17/2011 11:00
267.79
4/17/2011 12:00
258.20
4/17/2011 13:00
211.07
4/17/2011 14:00
141.94
4/17/2011 15:00
276.30
4/17/2011 16:00
99.09
4/17/2011 17:00
175.32
4/17/2011 18:00
91.11
4/17/2011 19:00
229.59
4/17/2011 20:00
236.35
4/17/2011 21:00
243.70
4/17/2011 22:00
281.90
4/17/2011 23:00
212.88
4/18/2011 0:00
143.62
4/18/2011 1:00
214.88
4/18/2011 2:00
160.57
4/18/2011 3:00
241.19
4/18/2011 4:00
150.43
4/18/2011 5:00
171.67
4/18/2011 6:00
130.91
4/18/2011 7:00
212.47
4/18/2011 8:00
254.83
4/18/2011 9:00
311.32
4/18/2011 10:00
428.98
Docket No. ER11-1844
Exhibit No. NYI-4
Page 244 of 375
4/18/2011 11:00
354.14
4/18/2011 12:00
449.21
4/18/2011 13:00
595.03
4/18/2011 14:00
456.64
4/18/2011 15:00
459.18
4/18/2011 16:00
475.04
4/18/2011 17:00
552.89
4/18/2011 18:00
368.56
4/18/2011 19:00
295.23
4/18/2011 20:00
106.18
4/18/2011 21:00
273.14
4/18/2011 22:00
525.71
4/18/2011 23:00
429.51
4/19/2011 0:00
287.62
4/19/2011 1:00
218.29
4/19/2011 2:00
39.85
4/19/2011 3:00
127.00
4/19/2011 4:00
120.10
4/19/2011 5:00
106.72
4/19/2011 6:00
133.86
4/19/2011 7:00
147.14
4/19/2011 8:00
230.09
4/19/2011 9:00
147.50
4/19/2011 10:00
102.63
4/19/2011 11:00
-83.84
4/19/2011 12:00
-343.50
4/19/2011 13:00
-355.03
4/19/2011 14:00
-262.51
4/19/2011 15:00
-352.48
4/19/2011 16:00
-189.70
4/19/2011 17:00
-360.30
4/19/2011 18:00
-96.53
4/19/2011 19:00
-72.85
4/19/2011 20:00
91.38
4/19/2011 21:00
-116.50
4/19/2011 22:00
-310.62
4/19/2011 23:00
-253.30
4/20/2011 0:00
-43.18
4/20/2011 1:00
-49.90
4/20/2011 2:00
-115.51
4/20/2011 3:00
0.32
4/20/2011 4:00
207.25
4/20/2011 5:00
248.50
4/20/2011 6:00
194.98
4/20/2011 7:00
460.26
4/20/2011 8:00
418.87
4/20/2011 9:00
316.04
Docket No. ER11-1844
Exhibit No. NYI-4
Page 245 of 375
4/20/2011 10:00
504.40
4/20/2011 11:00
377.61
4/20/2011 12:00
380.20
4/20/2011 13:00
234.14
4/20/2011 14:00
183.87
4/20/2011 15:00
104.79
4/20/2011 16:00
135.68
4/20/2011 17:00
154.20
4/20/2011 18:00
66.81
4/20/2011 19:00
71.57
4/20/2011 20:00
93.76
4/20/2011 21:00
-17.90
4/20/2011 22:00
-64.63
4/20/2011 23:00
72.96
4/21/2011 0:00
-17.24
4/21/2011 1:00
15.34
4/21/2011 2:00
-175.93
4/21/2011 3:00
-169.10
4/21/2011 4:00
-107.24
4/21/2011 5:00
19.59
4/21/2011 6:00
196.42
4/21/2011 7:00
220.58
4/21/2011 8:00
14.78
4/21/2011 9:00
142.79
4/21/2011 10:00
228.48
4/21/2011 11:00
250.54
4/21/2011 12:00
54.24
4/21/2011 13:00
49.94
4/21/2011 14:00
53.21
4/21/2011 15:00
3.41
4/21/2011 16:00
251.39
4/21/2011 17:00
324.58
4/21/2011 18:00
334.27
4/21/2011 19:00
435.74
4/21/2011 20:00
475.33
4/21/2011 21:00
480.15
4/21/2011 22:00
595.53
4/21/2011 23:00
446.89
4/22/2011 0:00
449.84
4/22/2011 1:00
519.21
4/22/2011 2:00
232.67
4/22/2011 3:00
215.64
4/22/2011 4:00
324.01
4/22/2011 5:00
199.25
4/22/2011 6:00
243.30
4/22/2011 7:00
133.42
4/22/2011 8:00
63.49
Docket No. ER11-1844
Exhibit No. NYI-4
Page 246 of 375
4/22/2011 9:00
-82.39
4/22/2011 10:00
-61.14
4/22/2011 11:00
157.23
4/22/2011 12:00
16.53
4/22/2011 13:00
-10.89
4/22/2011 14:00
195.79
4/22/2011 15:00
216.77
4/22/2011 16:00
204.69
4/22/2011 17:00
172.15
4/22/2011 18:00
422.27
4/22/2011 19:00
401.93
4/22/2011 20:00
83.40
4/22/2011 21:00
188.19
4/22/2011 22:00
194.04
4/22/2011 23:00
380.45
4/23/2011 0:00
421.72
4/23/2011 1:00
165.00
4/23/2011 2:00
238.53
4/23/2011 3:00
173.31
4/23/2011 4:00
226.73
4/23/2011 5:00
211.90
4/23/2011 6:00
133.17
4/23/2011 7:00
160.03
4/23/2011 8:00
255.00
4/23/2011 9:00
369.23
4/23/2011 10:00
382.10
4/23/2011 11:00
460.39
4/23/2011 12:00
300.20
4/23/2011 13:00
288.07
4/23/2011 14:00
345.80
4/23/2011 15:00
20.62
4/23/2011 16:00
95.43
4/23/2011 17:00
11.23
4/23/2011 18:00
61.59
4/23/2011 19:00
133.16
4/23/2011 20:00
85.33
4/23/2011 21:00
-106.02
4/23/2011 22:00
-36.61
4/23/2011 23:00
-21.82
4/24/2011 0:00
238.64
4/24/2011 1:00
162.68
4/24/2011 2:00
132.76
4/24/2011 3:00
199.88
4/24/2011 4:00
200.60
4/24/2011 5:00
218.93
4/24/2011 6:00
85.20
4/24/2011 7:00
130.49
Docket No. ER11-1844
Exhibit No. NYI-4
Page 247 of 375
4/24/2011 8:00
240.03
4/24/2011 9:00
273.16
4/24/2011 10:00
372.28
4/24/2011 11:00
551.97
4/24/2011 12:00
510.28
4/24/2011 13:00
412.61
4/24/2011 14:00
313.74
4/24/2011 15:00
351.16
4/24/2011 16:00
336.56
4/24/2011 17:00
210.10
4/24/2011 18:00
288.20
4/24/2011 19:00
374.75
4/24/2011 20:00
264.05
4/24/2011 21:00
278.33
4/24/2011 22:00
499.41
4/24/2011 23:00
332.12
4/25/2011 0:00
465.31
4/25/2011 1:00
276.19
4/25/2011 2:00
-68.99
4/25/2011 3:00
13.53
4/25/2011 4:00
-26.45
4/25/2011 5:00
122.58
4/25/2011 6:00
113.92
4/25/2011 7:00
114.00
4/25/2011 8:00
231.47
4/25/2011 9:00
335.46
4/25/2011 10:00
657.97
4/25/2011 11:00
466.55
4/25/2011 12:00
524.89
4/25/2011 13:00
630.11
4/25/2011 14:00
317.26
4/25/2011 15:00
478.12
4/25/2011 16:00
572.00
4/25/2011 17:00
481.35
4/25/2011 18:00
547.94
4/25/2011 19:00
365.30
4/25/2011 20:00
461.27
4/25/2011 21:00
548.99
4/25/2011 22:00
460.23
4/25/2011 23:00
373.79
4/26/2011 0:00
475.09
4/26/2011 1:00
418.68
4/26/2011 2:00
197.35
4/26/2011 3:00
266.93
4/26/2011 4:00
203.68
4/26/2011 5:00
168.32
4/26/2011 6:00
-8.53
Docket No. ER11-1844
Exhibit No. NYI-4
Page 248 of 375
4/26/2011 7:00
210.69
4/26/2011 8:00
203.01
4/26/2011 9:00
197.78
4/26/2011 10:00
321.45
4/26/2011 11:00
213.48
4/26/2011 12:00
303.48
4/26/2011 13:00
372.45
4/26/2011 14:00
484.87
4/26/2011 15:00
494.49
4/26/2011 16:00
554.25
4/26/2011 17:00
511.68
4/26/2011 18:00
452.34
4/26/2011 19:00
478.13
4/26/2011 20:00
321.21
4/26/2011 21:00
377.14
4/26/2011 22:00
206.35
4/26/2011 23:00
68.12
4/27/2011 0:00
253.20
4/27/2011 1:00
416.61
4/27/2011 2:00
383.59
4/27/2011 3:00
220.20
4/27/2011 4:00
474.61
4/27/2011 5:00
443.43
4/27/2011 6:00
291.68
4/27/2011 7:00
47.32
4/27/2011 8:00
148.71
4/27/2011 9:00
293.82
4/27/2011 10:00
340.25
4/27/2011 11:00
273.13
4/27/2011 12:00
370.78
4/27/2011 13:00
428.16
4/27/2011 14:00
433.84
4/27/2011 15:00
554.13
4/27/2011 16:00
478.84
4/27/2011 17:00
521.67
4/27/2011 18:00
659.91
4/27/2011 19:00
711.18
4/27/2011 20:00
674.86
4/27/2011 21:00
478.26
4/27/2011 22:00
419.44
4/27/2011 23:00
361.38
4/28/2011 0:00
569.16
4/28/2011 1:00
349.39
4/28/2011 2:00
285.62
4/28/2011 3:00
338.91
4/28/2011 4:00
238.89
4/28/2011 5:00
99.33
Docket No. ER11-1844
Exhibit No. NYI-4
Page 249 of 375
4/28/2011 6:00
162.38
4/28/2011 7:00
163.48
4/28/2011 8:00
78.82
4/28/2011 9:00
123.17
4/28/2011 10:00
142.15
4/28/2011 11:00
97.94
4/28/2011 12:00
296.32
4/28/2011 13:00
269.64
4/28/2011 14:00
247.11
4/28/2011 15:00
86.81
4/28/2011 16:00
-42.50
4/28/2011 17:00
-146.86
4/28/2011 18:00
-235.50
4/28/2011 19:00
83.73
4/28/2011 20:00
110.32
4/28/2011 21:00
-85.98
4/28/2011 22:00
-100.57
4/28/2011 23:00
85.30
4/29/2011 0:00
117.10
4/29/2011 1:00
-89.54
4/29/2011 2:00
-97.62
4/29/2011 3:00
-164.09
4/29/2011 4:00
-230.20
4/29/2011 5:00
-286.58
4/29/2011 6:00
-455.15
4/29/2011 7:00
-424.62
4/29/2011 8:00
-277.12
4/29/2011 9:00
-232.81
4/29/2011 10:00
-224.70
4/29/2011 11:00
-222.88
4/29/2011 12:00
-345.46
4/29/2011 13:00
-316.23
4/29/2011 14:00
-335.30
4/29/2011 15:00
-440.97
4/29/2011 16:00
-341.69
4/29/2011 17:00
-161.66
4/29/2011 18:00
-95.83
4/29/2011 19:00
-90.58
4/29/2011 20:00
-52.33
4/29/2011 21:00
-183.03
4/29/2011 22:00
-151.78
4/29/2011 23:00
70.00
4/30/2011 0:00
110.17
4/30/2011 1:00
102.56
4/30/2011 2:00
285.30
4/30/2011 3:00
230.69
4/30/2011 4:00
258.32
Docket No. ER11-1844
Exhibit No. NYI-4
Page 250 of 375
4/30/2011 5:00
220.09
4/30/2011 6:00
142.86
4/30/2011 7:00
293.24
4/30/2011 8:00
255.53
4/30/2011 9:00
230.50
4/30/2011 10:00
338.04
4/30/2011 11:00
459.86
4/30/2011 12:00
343.43
4/30/2011 13:00
302.28
4/30/2011 14:00
151.16
4/30/2011 15:00
135.50
4/30/2011 16:00
150.95
4/30/2011 17:00
267.42
4/30/2011 18:00
304.75
4/30/2011 19:00
241.74
4/30/2011 20:00
303.41
4/30/2011 21:00
149.57
4/30/2011 22:00
236.06
4/30/2011 23:00
371.02
5/1/2011 0:00
259.30
5/1/2011 1:00
278.13
5/1/2011 2:00
-77.54
5/1/2011 3:00
-66.92
5/1/2011 4:00
-52.03
5/1/2011 5:00
33.97
5/1/2011 6:00
69.50
5/1/2011 7:00
163.32
5/1/2011 8:00
-52.63
5/1/2011 9:00
205.18
5/1/2011 10:00
202.53
5/1/2011 11:00
246.55
5/1/2011 12:00
243.96
5/1/2011 13:00
270.18
5/1/2011 14:00
250.52
5/1/2011 15:00
249.43
5/1/2011 16:00
343.89
5/1/2011 17:00
376.45
5/1/2011 18:00
497.11
5/1/2011 19:00
540.83
5/1/2011 20:00
236.66
5/1/2011 21:00
199.61
5/1/2011 22:00
20.27
5/1/2011 23:00
322.91
5/2/2011 0:00
168.04
5/2/2011 1:00
116.26
5/2/2011 2:00
235.16
5/2/2011 3:00
125.71
Docket No. ER11-1844
Exhibit No. NYI-4
Page 251 of 375
5/2/2011 4:00
114.18
5/2/2011 5:00
70.66
5/2/2011 6:00
2.68
5/2/2011 7:00
62.99
5/2/2011 8:00
381.40
5/2/2011 9:00
369.08
5/2/2011 10:00
604.09
5/2/2011 11:00
242.05
5/2/2011 12:00
231.72
5/2/2011 13:00
185.65
5/2/2011 14:00
223.43
5/2/2011 15:00
198.97
5/2/2011 16:00
246.77
5/2/2011 17:00
263.45
5/2/2011 18:00
165.88
5/2/2011 19:00
155.95
5/2/2011 20:00
439.71
5/2/2011 21:00
350.81
5/2/2011 22:00
268.90
5/2/2011 23:00
288.73
5/3/2011 0:00
328.56
5/3/2011 1:00
311.57
5/3/2011 2:00
396.21
5/3/2011 3:00
412.23
5/3/2011 4:00
500.55
5/3/2011 5:00
552.17
5/3/2011 6:00
214.62
5/3/2011 7:00
444.94
5/3/2011 8:00
361.82
5/3/2011 9:00
346.32
5/3/2011 10:00
397.09
5/3/2011 11:00
423.75
5/3/2011 12:00
330.48
5/3/2011 13:00
241.26
5/3/2011 14:00
153.87
5/3/2011 15:00
129.64
5/3/2011 16:00
54.80
5/3/2011 17:00
17.06
5/3/2011 18:00
-54.82
5/3/2011 19:00
41.36
5/3/2011 20:00
124.57
5/3/2011 21:00
236.00
5/3/2011 22:00
35.11
5/3/2011 23:00
331.10
5/4/2011 0:00
356.70
5/4/2011 1:00
303.51
5/4/2011 2:00
235.64
Docket No. ER11-1844
Exhibit No. NYI-4
Page 252 of 375
5/4/2011 3:00
130.60
5/4/2011 4:00
221.58
5/4/2011 5:00
178.22
5/4/2011 6:00
-85.73
5/4/2011 7:00
71.32
5/4/2011 8:00
142.00
5/4/2011 9:00
143.06
5/4/2011 10:00
33.06
5/4/2011 11:00
-93.70
5/4/2011 12:00
-72.84
5/4/2011 13:00
-100.25
5/4/2011 14:00
-164.88
5/4/2011 15:00
-125.47
5/4/2011 16:00
-126.76
5/4/2011 17:00
-175.89
5/4/2011 18:00
-7.03
5/4/2011 19:00
-17.26
5/4/2011 20:00
229.68
5/4/2011 21:00
185.01
5/4/2011 22:00
-132.00
5/4/2011 23:00
-143.61
5/5/2011 0:00
-56.80
5/5/2011 1:00
146.06
5/5/2011 2:00
-23.37
5/5/2011 3:00
9.04
5/5/2011 4:00
-30.67
5/5/2011 5:00
149.46
5/5/2011 6:00
138.28
5/5/2011 7:00
203.16
5/5/2011 8:00
253.91
5/5/2011 9:00
342.93
5/5/2011 10:00
-23.50
5/5/2011 11:00
68.98
5/5/2011 12:00
129.07
5/5/2011 13:00
121.73
5/5/2011 14:00
-33.16
5/5/2011 15:00
-33.66
5/5/2011 16:00
-185.54
5/5/2011 17:00
-274.07
5/5/2011 18:00
-141.53
5/5/2011 19:00
-36.41
5/5/2011 20:00
225.25
5/5/2011 21:00
228.48
5/5/2011 22:00
207.89
5/5/2011 23:00
136.41
5/6/2011 0:00
96.59
5/6/2011 1:00
233.92
Docket No. ER11-1844
Exhibit No. NYI-4
Page 253 of 375
5/6/2011 2:00
168.47
5/6/2011 3:00
192.73
5/6/2011 4:00
237.91
5/6/2011 5:00
230.12
5/6/2011 6:00
79.11
5/6/2011 7:00
-83.38
5/6/2011 8:00
-37.77
5/6/2011 9:00
-133.06
5/6/2011 10:00
-182.94
5/6/2011 11:00
-130.45
5/6/2011 12:00
-103.37
5/6/2011 13:00
-60.16
5/6/2011 14:00
-83.88
5/6/2011 15:00
-51.28
5/6/2011 16:00
-99.29
5/6/2011 17:00
-8.56
5/6/2011 18:00
339.63
5/6/2011 19:00
438.88
5/6/2011 20:00
295.44
5/6/2011 21:00
254.51
5/6/2011 22:00
144.25
5/6/2011 23:00
88.62
5/7/2011 0:00
180.93
5/7/2011 1:00
402.71
5/7/2011 2:00
331.11
5/7/2011 3:00
210.09
5/7/2011 4:00
258.21
5/7/2011 5:00
302.06
5/7/2011 6:00
332.83
5/7/2011 7:00
383.93
5/7/2011 8:00
302.85
5/7/2011 9:00
271.08
5/7/2011 10:00
413.50
5/7/2011 11:00
485.83
5/7/2011 12:00
387.19
5/7/2011 13:00
193.31
5/7/2011 14:00
140.34
5/7/2011 15:00
124.18
5/7/2011 16:00
153.95
5/7/2011 17:00
189.24
5/7/2011 18:00
128.70
5/7/2011 19:00
220.27
5/7/2011 20:00
446.56
5/7/2011 21:00
268.60
5/7/2011 22:00
310.50
5/7/2011 23:00
372.27
5/8/2011 0:00
436.60
Docket No. ER11-1844
Exhibit No. NYI-4
Page 254 of 375
5/8/2011 1:00
373.78
5/8/2011 2:00
371.94
5/8/2011 3:00
230.37
5/8/2011 4:00
203.26
5/8/2011 5:00
120.79
5/8/2011 6:00
82.24
5/8/2011 7:00
85.46
5/8/2011 8:00
282.00
5/8/2011 9:00
190.38
5/8/2011 10:00
410.27
5/8/2011 11:00
311.94
5/8/2011 12:00
251.16
5/8/2011 13:00
154.84
5/8/2011 14:00
164.31
5/8/2011 15:00
304.95
5/8/2011 16:00
254.91
5/8/2011 17:00
344.13
5/8/2011 18:00
257.01
5/8/2011 19:00
193.79
5/8/2011 20:00
213.18
5/8/2011 21:00
218.67
5/8/2011 22:00
135.47
5/8/2011 23:00
222.92
5/9/2011 0:00
198.63
5/9/2011 1:00
178.22
5/9/2011 2:00
233.46
5/9/2011 3:00
154.07
5/9/2011 4:00
154.35
5/9/2011 5:00
68.66
5/9/2011 6:00
52.65
5/9/2011 7:00
-48.57
5/9/2011 8:00
-131.59
5/9/2011 9:00
-245.60
5/9/2011 10:00
-246.51
5/9/2011 11:00
-187.11
5/9/2011 12:00
-129.16
5/9/2011 13:00
-121.08
5/9/2011 14:00
-12.33
5/9/2011 15:00
1.14
5/9/2011 16:00
-2.97
5/9/2011 17:00
-46.62
5/9/2011 18:00
-13.21
5/9/2011 19:00
-96.49
5/9/2011 20:00
55.46
5/9/2011 21:00
-69.80
5/9/2011 22:00
-60.71
5/9/2011 23:00
-18.49
Docket No. ER11-1844
Exhibit No. NYI-4
Page 255 of 375
5/10/2011 0:00
199.19
5/10/2011 1:00
102.63
5/10/2011 2:00
336.70
5/10/2011 3:00
370.24
5/10/2011 4:00
317.30
5/10/2011 5:00
271.92
5/10/2011 6:00
35.95
5/10/2011 7:00
92.13
5/10/2011 8:00
-50.87
5/10/2011 9:00
-225.87
5/10/2011 10:00
-216.68
5/10/2011 11:00
-172.63
5/10/2011 12:00
-13.60
5/10/2011 13:00
-58.57
5/10/2011 14:00
-113.08
5/10/2011 15:00
-59.03
5/10/2011 16:00
26.37
5/10/2011 17:00
-10.60
5/10/2011 18:00
-2.04
5/10/2011 19:00
23.35
5/10/2011 20:00
-198.99
5/10/2011 21:00
-242.53
5/10/2011 22:00
-191.74
5/10/2011 23:00
141.98
5/11/2011 0:00
-47.63
5/11/2011 1:00
116.74
5/11/2011 2:00
287.74
5/11/2011 3:00
287.51
5/11/2011 4:00
390.97
5/11/2011 5:00
378.88
5/11/2011 6:00
219.80
5/11/2011 7:00
248.88
5/11/2011 8:00
129.70
5/11/2011 9:00
147.89
5/11/2011 10:00
141.77
5/11/2011 11:00
44.64
5/11/2011 12:00
3.10
5/11/2011 13:00
-292.52
5/11/2011 14:00
-267.13
5/11/2011 15:00
-299.92
5/11/2011 16:00
-128.89
5/11/2011 17:00
-171.56
5/11/2011 18:00
47.81
5/11/2011 19:00
-70.74
5/11/2011 20:00
-0.59
5/11/2011 21:00
-115.86
5/11/2011 22:00
-240.99
Docket No. ER11-1844
Exhibit No. NYI-4
Page 256 of 375
5/11/2011 23:00
-402.64
5/12/2011 0:00
-209.06
5/12/2011 1:00
5.65
5/12/2011 2:00
284.36
5/12/2011 3:00
276.69
5/12/2011 4:00
370.86
5/12/2011 5:00
341.09
5/12/2011 6:00
39.10
5/12/2011 7:00
46.97
5/12/2011 8:00
51.10
5/12/2011 9:00
50.53
5/12/2011 10:00
229.50
5/12/2011 11:00
225.03
5/12/2011 12:00
111.80
5/12/2011 13:00
41.85
5/12/2011 14:00
-26.43
5/12/2011 15:00
-84.83
5/12/2011 16:00
-39.67
5/12/2011 17:00
-24.10
5/12/2011 18:00
61.44
5/12/2011 19:00
106.95
5/12/2011 20:00
77.74
5/12/2011 21:00
-127.15
5/12/2011 22:00
-290.02
5/12/2011 23:00
-60.36
5/13/2011 0:00
-36.58
5/13/2011 1:00
-71.70
5/13/2011 2:00
-4.30
5/13/2011 3:00
37.62
5/13/2011 4:00
13.76
5/13/2011 5:00
-127.19
5/13/2011 6:00
-159.24
5/13/2011 7:00
-59.44
5/13/2011 8:00
-144.34
5/13/2011 9:00
-128.55
5/13/2011 10:00
-194.06
5/13/2011 11:00
-76.54
5/13/2011 12:00
-86.53
5/13/2011 13:00
-208.47
5/13/2011 14:00
-228.16
5/13/2011 15:00
-183.82
5/13/2011 16:00
-134.57
5/13/2011 17:00
-22.07
5/13/2011 18:00
126.44
5/13/2011 19:00
72.03
5/13/2011 20:00
-74.31
5/13/2011 21:00
-25.98
Docket No. ER11-1844
Exhibit No. NYI-4
Page 257 of 375
5/13/2011 22:00
54.89
5/13/2011 23:00
128.57
5/14/2011 0:00
316.79
5/14/2011 1:00
406.51
5/14/2011 2:00
237.67
5/14/2011 3:00
225.45
5/14/2011 4:00
212.21
5/14/2011 5:00
231.39
5/14/2011 6:00
352.78
5/14/2011 7:00
122.30
5/14/2011 8:00
72.37
5/14/2011 9:00
126.43
5/14/2011 10:00
58.46
5/14/2011 11:00
2.71
5/14/2011 12:00
84.21
5/14/2011 13:00
202.73
5/14/2011 14:00
251.70
5/14/2011 15:00
292.25
5/14/2011 16:00
277.70
5/14/2011 17:00
282.40
5/14/2011 18:00
259.65
5/14/2011 19:00
219.85
5/14/2011 20:00
280.81
5/14/2011 21:00
293.07
5/14/2011 22:00
431.53
5/14/2011 23:00
412.99
5/15/2011 0:00
133.11
5/15/2011 1:00
57.99
5/15/2011 2:00
170.50
5/15/2011 3:00
245.99
5/15/2011 4:00
63.96
5/15/2011 5:00
161.01
5/15/2011 6:00
151.10
5/15/2011 7:00
278.72
5/15/2011 8:00
235.73
5/15/2011 9:00
183.92
5/15/2011 10:00
201.28
5/15/2011 11:00
260.11
5/15/2011 12:00
442.52
5/15/2011 13:00
321.87
5/15/2011 14:00
362.39
5/15/2011 15:00
256.20
5/15/2011 16:00
323.33
5/15/2011 17:00
267.23
5/15/2011 18:00
411.79
5/15/2011 19:00
373.95
5/15/2011 20:00
375.65
Docket No. ER11-1844
Exhibit No. NYI-4
Page 258 of 375
5/15/2011 21:00
211.68
5/15/2011 22:00
321.86
5/15/2011 23:00
422.36
5/16/2011 0:00
139.26
5/16/2011 1:00
248.89
5/16/2011 2:00
93.06
5/16/2011 3:00
27.63
5/16/2011 4:00
-72.67
5/16/2011 5:00
-168.41
5/16/2011 6:00
-80.88
5/16/2011 7:00
65.37
5/16/2011 8:00
129.67
5/16/2011 9:00
294.88
5/16/2011 10:00
551.40
5/16/2011 11:00
502.21
5/16/2011 12:00
418.70
5/16/2011 13:00
284.01
5/16/2011 14:00
357.51
5/16/2011 15:00
360.19
5/16/2011 16:00
335.33
5/16/2011 17:00
302.44
5/16/2011 18:00
325.04
5/16/2011 19:00
543.65
5/16/2011 20:00
311.22
5/16/2011 21:00
264.51
5/16/2011 22:00
245.16
5/16/2011 23:00
327.58
5/17/2011 0:00
275.25
5/17/2011 1:00
353.27
5/17/2011 2:00
257.43
5/17/2011 3:00
290.95
5/17/2011 4:00
173.55
5/17/2011 5:00
175.95
5/17/2011 6:00
133.20
5/17/2011 7:00
67.57
5/17/2011 8:00
138.01
5/17/2011 9:00
377.50
5/17/2011 10:00
448.49
5/17/2011 11:00
510.18
5/17/2011 12:00
365.61
5/17/2011 13:00
317.36
5/17/2011 14:00
212.42
5/17/2011 15:00
192.43
5/17/2011 16:00
254.62
5/17/2011 17:00
295.55
5/17/2011 18:00
320.32
5/17/2011 19:00
311.52
Docket No. ER11-1844
Exhibit No. NYI-4
Page 259 of 375
5/17/2011 20:00
245.90
5/17/2011 21:00
148.70
5/17/2011 22:00
154.31
5/17/2011 23:00
65.51
5/18/2011 0:00
105.87
5/18/2011 1:00
145.11
5/18/2011 2:00
154.02
5/18/2011 3:00
269.39
5/18/2011 4:00
140.57
5/18/2011 5:00
165.47
5/18/2011 6:00
-32.25
5/18/2011 7:00
80.39
5/18/2011 8:00
63.68
5/18/2011 9:00
94.30
5/18/2011 10:00
109.24
5/18/2011 11:00
196.40
5/18/2011 12:00
299.72
5/18/2011 13:00
393.60
5/18/2011 14:00
337.32
5/18/2011 15:00
334.66
5/18/2011 16:00
279.91
5/18/2011 17:00
311.99
5/18/2011 18:00
319.43
5/18/2011 19:00
401.89
5/18/2011 20:00
388.88
5/18/2011 21:00
332.14
5/18/2011 22:00
248.21
5/18/2011 23:00
193.96
5/19/2011 0:00
119.84
5/19/2011 1:00
245.61
5/19/2011 2:00
328.39
5/19/2011 3:00
379.32
5/19/2011 4:00
256.02
5/19/2011 5:00
194.55
5/19/2011 6:00
127.84
5/19/2011 7:00
50.11
5/19/2011 8:00
87.00
5/19/2011 9:00
-77.64
5/19/2011 10:00
-21.86
5/19/2011 11:00
152.47
5/19/2011 12:00
385.44
5/19/2011 13:00
123.56
5/19/2011 14:00
-252.78
5/19/2011 15:00
-9.87
5/19/2011 16:00
101.07
5/19/2011 17:00
274.47
5/19/2011 18:00
384.44
Docket No. ER11-1844
Exhibit No. NYI-4
Page 260 of 375
5/19/2011 19:00
230.88
5/19/2011 20:00
314.10
5/19/2011 21:00
171.33
5/19/2011 22:00
234.26
5/19/2011 23:00
272.62
5/20/2011 0:00
175.22
5/20/2011 1:00
401.39
5/20/2011 2:00
464.65
5/20/2011 3:00
422.60
5/20/2011 4:00
465.04
5/20/2011 5:00
316.59
5/20/2011 6:00
434.26
5/20/2011 7:00
266.63
5/20/2011 8:00
387.97
5/20/2011 9:00
340.25
5/20/2011 10:00
377.16
5/20/2011 11:00
152.37
5/20/2011 12:00
210.32
5/20/2011 13:00
219.83
5/20/2011 14:00
361.96
5/20/2011 15:00
136.06
5/20/2011 16:00
123.67
5/20/2011 17:00
121.20
5/20/2011 18:00
193.71
5/20/2011 19:00
352.41
5/20/2011 20:00
276.54
5/20/2011 21:00
326.98
5/20/2011 22:00
433.03
5/20/2011 23:00
347.69
5/21/2011 0:00
515.71
5/21/2011 1:00
532.14
5/21/2011 2:00
503.07
5/21/2011 3:00
392.58
5/21/2011 4:00
390.56
5/21/2011 5:00
370.82
5/21/2011 6:00
500.58
5/21/2011 7:00
436.82
5/21/2011 8:00
352.12
5/21/2011 9:00
249.07
5/21/2011 10:00
362.68
5/21/2011 11:00
562.95
5/21/2011 12:00
562.97
5/21/2011 13:00
312.96
5/21/2011 14:00
388.50
5/21/2011 15:00
403.78
5/21/2011 16:00
396.20
5/21/2011 17:00
511.25
Docket No. ER11-1844
Exhibit No. NYI-4
Page 261 of 375
5/21/2011 18:00
554.36
5/21/2011 19:00
576.78
5/21/2011 20:00
535.19
5/21/2011 21:00
764.81
5/21/2011 22:00
322.24
5/21/2011 23:00
372.27
5/22/2011 0:00
212.11
5/22/2011 1:00
393.16
5/22/2011 2:00
351.25
5/22/2011 3:00
252.12
5/22/2011 4:00
151.07
5/22/2011 5:00
-85.57
5/22/2011 6:00
248.70
5/22/2011 7:00
112.06
5/22/2011 8:00
-11.09
5/22/2011 9:00
-33.44
5/22/2011 10:00
6.69
5/22/2011 11:00
202.93
5/22/2011 12:00
67.08
5/22/2011 13:00
172.60
5/22/2011 14:00
264.20
5/22/2011 15:00
218.64
5/22/2011 16:00
267.78
5/22/2011 17:00
181.07
5/22/2011 18:00
322.96
5/22/2011 19:00
343.20
5/22/2011 20:00
361.53
5/22/2011 21:00
347.64
5/22/2011 22:00
153.79
5/22/2011 23:00
119.61
5/23/2011 0:00
20.57
5/23/2011 1:00
224.47
5/23/2011 2:00
133.00
5/23/2011 3:00
209.71
5/23/2011 4:00
126.99
5/23/2011 5:00
174.81
5/23/2011 6:00
231.82
5/23/2011 7:00
56.71
5/23/2011 8:00
-23.64
5/23/2011 9:00
202.84
5/23/2011 10:00
79.16
5/23/2011 11:00
96.10
5/23/2011 12:00
-106.92
5/23/2011 13:00
156.27
5/23/2011 14:00
2.13
5/23/2011 15:00
-162.21
5/23/2011 16:00
-89.57
Docket No. ER11-1844
Exhibit No. NYI-4
Page 262 of 375
5/23/2011 17:00
9.86
5/23/2011 18:00
111.85
5/23/2011 19:00
162.50
5/23/2011 20:00
199.53
5/23/2011 21:00
4.45
5/23/2011 22:00
-32.78
5/23/2011 23:00
-39.59
5/24/2011 0:00
-91.34
5/24/2011 1:00
55.75
5/24/2011 2:00
68.04
5/24/2011 3:00
122.82
5/24/2011 4:00
208.58
5/24/2011 5:00
193.79
5/24/2011 6:00
-18.89
5/24/2011 7:00
-73.55
5/24/2011 8:00
-186.39
5/24/2011 9:00
-19.44
5/24/2011 10:00
-158.99
5/24/2011 11:00
-259.36
5/24/2011 12:00
-397.20
5/24/2011 13:00
5.63
5/24/2011 14:00
-58.06
5/24/2011 15:00
-15.90
5/24/2011 16:00
13.28
5/24/2011 17:00
122.90
5/24/2011 18:00
24.05
5/24/2011 19:00
386.12
5/24/2011 20:00
281.44
5/24/2011 21:00
172.73
5/24/2011 22:00
171.79
5/24/2011 23:00
229.81
5/25/2011 0:00
552.17
5/25/2011 1:00
560.83
5/25/2011 2:00
420.32
5/25/2011 3:00
400.95
5/25/2011 4:00
484.91
5/25/2011 5:00
499.85
5/25/2011 6:00
557.28
5/25/2011 7:00
215.90
5/25/2011 8:00
156.36
5/25/2011 9:00
79.00
5/25/2011 10:00
103.19
5/25/2011 11:00
189.14
5/25/2011 12:00
252.31
5/25/2011 13:00
380.77
5/25/2011 14:00
247.44
5/25/2011 15:00
303.43
Docket No. ER11-1844
Exhibit No. NYI-4
Page 263 of 375
5/25/2011 16:00
115.97
5/25/2011 17:00
107.60
5/25/2011 18:00
42.49
5/25/2011 19:00
23.97
5/25/2011 20:00
-114.67
5/25/2011 21:00
-117.17
5/25/2011 22:00
274.55
5/25/2011 23:00
315.34
5/26/2011 0:00
473.44
5/26/2011 1:00
538.27
5/26/2011 2:00
514.58
5/26/2011 3:00
429.74
5/26/2011 4:00
271.28
5/26/2011 5:00
216.53
5/26/2011 6:00
153.39
5/26/2011 7:00
223.10
5/26/2011 8:00
276.32
5/26/2011 9:00
234.53
5/26/2011 10:00
298.87
5/26/2011 11:00
67.85
5/26/2011 12:00
199.41
5/26/2011 13:00
115.54
5/26/2011 14:00
92.28
5/26/2011 15:00
185.51
5/26/2011 16:00
179.68
5/26/2011 17:00
-62.55
5/26/2011 18:00
133.26
5/26/2011 19:00
246.19
5/26/2011 20:00
301.37
5/26/2011 21:00
226.34
5/26/2011 22:00
263.96
5/26/2011 23:00
207.78
5/27/2011 0:00
394.11
5/27/2011 1:00
345.43
5/27/2011 2:00
258.39
5/27/2011 3:00
155.82
5/27/2011 4:00
206.56
5/27/2011 5:00
315.75
5/27/2011 6:00
301.38
5/27/2011 7:00
379.57
5/27/2011 8:00
288.46
5/27/2011 9:00
370.92
5/27/2011 10:00
417.14
5/27/2011 11:00
562.18
5/27/2011 12:00
531.14
5/27/2011 13:00
108.64
5/27/2011 14:00
149.57
Docket No. ER11-1844
Exhibit No. NYI-4
Page 264 of 375
5/27/2011 15:00
426.75
5/27/2011 16:00
76.78
5/27/2011 17:00
-101.56
5/27/2011 18:00
-153.05
5/27/2011 19:00
12.33
5/27/2011 20:00
90.03
5/27/2011 21:00
167.14
5/27/2011 22:00
286.57
5/27/2011 23:00
614.63
5/28/2011 0:00
627.86
5/28/2011 1:00
885.91
5/28/2011 2:00
802.63
5/28/2011 3:00
737.40
5/28/2011 4:00
761.26
5/28/2011 5:00
613.61
5/28/2011 6:00
773.83
5/28/2011 7:00
796.71
5/28/2011 8:00
427.43
5/28/2011 9:00
406.49
5/28/2011 10:00
504.26
5/28/2011 11:00
486.92
5/28/2011 12:00
215.45
5/28/2011 13:00
248.76
5/28/2011 14:00
211.09
5/28/2011 15:00
315.71
5/28/2011 16:00
434.80
5/28/2011 17:00
384.13
5/28/2011 18:00
623.84
5/28/2011 19:00
541.79
5/28/2011 20:00
598.78
5/28/2011 21:00
513.53
5/28/2011 22:00
647.35
5/28/2011 23:00
679.27
5/29/2011 0:00
408.48
5/29/2011 1:00
475.85
5/29/2011 2:00
455.91
5/29/2011 3:00
427.10
5/29/2011 4:00
484.21
5/29/2011 5:00
533.41
5/29/2011 6:00
679.97
5/29/2011 7:00
616.30
5/29/2011 8:00
420.19
5/29/2011 9:00
415.13
5/29/2011 10:00
506.08
5/29/2011 11:00
473.69
5/29/2011 12:00
208.64
5/29/2011 13:00
458.53
Docket No. ER11-1844
Exhibit No. NYI-4
Page 265 of 375
5/29/2011 14:00
552.96
5/29/2011 15:00
654.25
5/29/2011 16:00
630.50
5/29/2011 17:00
666.13
5/29/2011 18:00
613.30
5/29/2011 19:00
517.03
5/29/2011 20:00
666.73
5/29/2011 21:00
672.39
5/29/2011 22:00
645.23
5/29/2011 23:00
578.82
5/30/2011 0:00
631.13
5/30/2011 1:00
707.47
5/30/2011 2:00
703.16
5/30/2011 3:00
802.22
5/30/2011 4:00
727.40
5/30/2011 5:00
644.35
5/30/2011 6:00
863.70
5/30/2011 7:00
513.09
5/30/2011 8:00
481.50
5/30/2011 9:00
526.01
5/30/2011 10:00
544.66
5/30/2011 11:00
431.61
5/30/2011 12:00
280.20
5/30/2011 13:00
177.09
5/30/2011 14:00
360.89
5/30/2011 15:00
222.54
5/30/2011 16:00
116.86
5/30/2011 17:00
-181.03
5/30/2011 18:00
-175.72
5/30/2011 19:00
232.29
5/30/2011 20:00
264.67
5/30/2011 21:00
136.16
5/30/2011 22:00
242.84
5/30/2011 23:00
369.65
5/31/2011 0:00
430.24
5/31/2011 1:00
530.65
5/31/2011 2:00
267.32
5/31/2011 3:00
415.51
5/31/2011 4:00
381.35
5/31/2011 5:00
352.19
5/31/2011 6:00
436.51
5/31/2011 7:00
403.29
5/31/2011 8:00
285.03
5/31/2011 9:00
35.01
5/31/2011 10:00
-104.49
5/31/2011 11:00
-225.38
5/31/2011 12:00
-100.50
Docket No. ER11-1844
Exhibit No. NYI-4
Page 266 of 375
5/31/2011 13:00
-360.94
5/31/2011 14:00
-233.41
5/31/2011 15:00
-302.85
5/31/2011 16:00
-139.82
5/31/2011 17:00
-122.47
5/31/2011 18:00
164.73
5/31/2011 19:00
-15.72
5/31/2011 20:00
223.04
5/31/2011 21:00
156.94
5/31/2011 22:00
282.72
5/31/2011 23:00
442.23
6/1/2011 0:00
96.27
6/1/2011 1:00
-232.76
6/1/2011 2:00
-258.70
6/1/2011 3:00
38.51
6/1/2011 4:00
178.05
6/1/2011 5:00
207.15
6/1/2011 6:00
278.52
6/1/2011 7:00
266.19
6/1/2011 8:00
-298.85
6/1/2011 9:00
-107.41
6/1/2011 10:00
-139.64
6/1/2011 11:00
89.59
6/1/2011 12:00
220.81
6/1/2011 13:00
259.92
6/1/2011 14:00
556.87
6/1/2011 15:00
874.64
6/1/2011 16:00
899.32
6/1/2011 17:00
695.58
6/1/2011 18:00
455.70
6/1/2011 19:00
757.27
6/1/2011 20:00
770.59
6/1/2011 21:00
629.59
6/1/2011 22:00
639.11
6/1/2011 23:00
532.61
6/2/2011 0:00
155.65
6/2/2011 1:00
36.44
6/2/2011 2:00
-6.28
6/2/2011 3:00
231.40
6/2/2011 4:00
186.63
6/2/2011 5:00
220.47
6/2/2011 6:00
285.89
6/2/2011 7:00
339.37
6/2/2011 8:00
520.78
6/2/2011 9:00
451.52
6/2/2011 10:00
381.72
6/2/2011 11:00
165.81
Docket No. ER11-1844
Exhibit No. NYI-4
Page 267 of 375
6/2/2011 12:00
221.29
6/2/2011 13:00
240.27
6/2/2011 14:00
239.81
6/2/2011 15:00
97.81
6/2/2011 16:00
371.43
6/2/2011 17:00
181.03
6/2/2011 18:00
353.82
6/2/2011 19:00
454.73
6/2/2011 20:00
341.13
6/2/2011 21:00
36.12
6/2/2011 22:00
188.17
6/2/2011 23:00
23.02
6/3/2011 0:00
111.01
6/3/2011 1:00
223.22
6/3/2011 2:00
414.51
6/3/2011 3:00
484.95
6/3/2011 4:00
594.69
6/3/2011 5:00
491.37
6/3/2011 6:00
393.63
6/3/2011 7:00
508.05
6/3/2011 8:00
384.57
6/3/2011 9:00
240.79
6/3/2011 10:00
384.63
6/3/2011 11:00
304.06
6/3/2011 12:00
271.76
6/3/2011 13:00
513.92
6/3/2011 14:00
641.83
6/3/2011 15:00
672.46
6/3/2011 16:00
636.70
6/3/2011 17:00
486.73
6/3/2011 18:00
595.44
6/3/2011 19:00
503.46
6/3/2011 20:00
477.17
6/3/2011 21:00
381.72
6/3/2011 22:00
500.88
6/3/2011 23:00
486.02
6/4/2011 0:00
691.57
6/4/2011 1:00
524.25
6/4/2011 2:00
430.74
6/4/2011 3:00
456.96
6/4/2011 4:00
263.50
6/4/2011 5:00
253.35
6/4/2011 6:00
246.89
6/4/2011 7:00
331.19
6/4/2011 8:00
338.22
6/4/2011 9:00
242.84
6/4/2011 10:00
-32.71
Docket No. ER11-1844
Exhibit No. NYI-4
Page 268 of 375
6/4/2011 11:00
-95.15
6/4/2011 12:00
44.31
6/4/2011 13:00
-160.50
6/4/2011 14:00
-78.82
6/4/2011 15:00
-103.47
6/4/2011 16:00
26.38
6/4/2011 17:00
10.22
6/4/2011 18:00
-95.91
6/4/2011 19:00
41.19
6/4/2011 20:00
28.34
6/4/2011 21:00
-50.07
6/4/2011 22:00
-14.63
6/4/2011 23:00
312.38
6/5/2011 0:00
203.19
6/5/2011 1:00
362.45
6/5/2011 2:00
354.59
6/5/2011 3:00
679.26
6/5/2011 4:00
504.99
6/5/2011 5:00
554.26
6/5/2011 6:00
719.58
6/5/2011 7:00
557.63
6/5/2011 8:00
506.33
6/5/2011 9:00
361.15
6/5/2011 10:00
74.52
6/5/2011 11:00
-119.55
6/5/2011 12:00
-143.48
6/5/2011 13:00
-70.77
6/5/2011 14:00
-148.96
6/5/2011 15:00
-288.26
6/5/2011 16:00
-252.00
6/5/2011 17:00
-224.77
6/5/2011 18:00
-107.48
6/5/2011 19:00
173.90
6/5/2011 20:00
169.56
6/5/2011 21:00
163.64
6/5/2011 22:00
409.98
6/5/2011 23:00
470.15
6/6/2011 0:00
673.65
6/6/2011 1:00
515.45
6/6/2011 2:00
599.43
6/6/2011 3:00
530.96
6/6/2011 4:00
703.35
6/6/2011 5:00
605.79
6/6/2011 6:00
586.10
6/6/2011 7:00
465.92
6/6/2011 8:00
276.85
6/6/2011 9:00
334.99
Docket No. ER11-1844
Exhibit No. NYI-4
Page 269 of 375
6/6/2011 10:00
218.49
6/6/2011 11:00
125.71
6/6/2011 12:00
-95.60
6/6/2011 13:00
-25.87
6/6/2011 14:00
4.41
6/6/2011 15:00
71.88
6/6/2011 16:00
116.83
6/6/2011 17:00
122.24
6/6/2011 18:00
258.05
6/6/2011 19:00
170.43
6/6/2011 20:00
-4.92
6/6/2011 21:00
-53.39
6/6/2011 22:00
-143.52
6/6/2011 23:00
162.96
6/7/2011 0:00
266.08
6/7/2011 1:00
487.95
6/7/2011 2:00
403.71
6/7/2011 3:00
190.36
6/7/2011 4:00
263.88
6/7/2011 5:00
328.81
6/7/2011 6:00
187.97
6/7/2011 7:00
-82.98
6/7/2011 8:00
20.25
6/7/2011 9:00
5.29
6/7/2011 10:00
-246.88
6/7/2011 11:00
-462.26
6/7/2011 12:00
18.23
6/7/2011 13:00
-163.80
6/7/2011 14:00
-488.88
6/7/2011 15:00
61.48
6/7/2011 16:00
-279.91
6/7/2011 17:00
-368.99
6/7/2011 18:00
-161.95
6/7/2011 19:00
-186.91
6/7/2011 20:00
-282.16
6/7/2011 21:00
-309.27
6/7/2011 22:00
-256.83
6/7/2011 23:00
-282.18
6/8/2011 0:00
-346.24
6/8/2011 1:00
-135.04
6/8/2011 2:00
-194.04
6/8/2011 3:00
-102.90
6/8/2011 4:00
-16.93
6/8/2011 5:00
-15.97
6/8/2011 6:00
76.07
6/8/2011 7:00
-73.37
6/8/2011 8:00
64.14
Docket No. ER11-1844
Exhibit No. NYI-4
Page 270 of 375
6/8/2011 9:00
-256.26
6/8/2011 10:00
-609.41
6/8/2011 11:00
-570.11
6/8/2011 12:00
-502.88
6/8/2011 13:00
-700.25
6/8/2011 14:00
-546.36
6/8/2011 15:00
-428.18
6/8/2011 16:00
-505.94
6/8/2011 17:00
-475.35
6/8/2011 18:00
-526.93
6/8/2011 19:00
-519.31
6/8/2011 20:00
-478.85
6/8/2011 21:00
-672.36
6/8/2011 22:00
-319.65
6/8/2011 23:00
-373.73
6/9/2011 0:00
-78.07
6/9/2011 1:00
-10.92
6/9/2011 2:00
81.71
6/9/2011 3:00
304.24
6/9/2011 4:00
341.97
6/9/2011 5:00
155.06
6/9/2011 6:00
271.68
6/9/2011 7:00
200.91
6/9/2011 8:00
127.64
6/9/2011 9:00
113.40
6/9/2011 10:00
107.07
6/9/2011 11:00
354.32
6/9/2011 12:00
222.19
6/9/2011 13:00
626.27
6/9/2011 14:00
509.35
6/9/2011 15:00
793.35
6/9/2011 16:00
720.45
6/9/2011 17:00
700.93
6/9/2011 18:00
792.03
6/9/2011 19:00
836.53
6/9/2011 20:00
661.97
6/9/2011 21:00
726.89
6/9/2011 22:00
856.19
6/9/2011 23:00
519.77
6/10/2011 0:00
424.20
6/10/2011 1:00
453.19
6/10/2011 2:00
695.69
6/10/2011 3:00
649.36
6/10/2011 4:00
661.10
6/10/2011 5:00
546.61
6/10/2011 6:00
379.94
6/10/2011 7:00
318.02
Docket No. ER11-1844
Exhibit No. NYI-4
Page 271 of 375
6/10/2011 8:00
454.80
6/10/2011 9:00
297.41
6/10/2011 10:00
351.85
6/10/2011 11:00
191.71
6/10/2011 12:00
301.99
6/10/2011 13:00
386.41
6/10/2011 14:00
347.34
6/10/2011 15:00
283.50
6/10/2011 16:00
432.22
6/10/2011 17:00
375.03
6/10/2011 18:00
393.69
6/10/2011 19:00
493.75
6/10/2011 20:00
491.57
6/10/2011 21:00
210.73
6/10/2011 22:00
196.92
6/10/2011 23:00
143.80
6/11/2011 0:00
246.79
6/11/2011 1:00
410.36
6/11/2011 2:00
356.66
6/11/2011 3:00
253.13
6/11/2011 4:00
459.48
6/11/2011 5:00
267.88
6/11/2011 6:00
276.53
6/11/2011 7:00
505.69
6/11/2011 8:00
424.06
6/11/2011 9:00
254.26
6/11/2011 10:00
249.70
6/11/2011 11:00
373.82
6/11/2011 12:00
381.96
6/11/2011 13:00
377.97
6/11/2011 14:00
351.94
6/11/2011 15:00
508.70
6/11/2011 16:00
506.39
6/11/2011 17:00
294.49
6/11/2011 18:00
269.68
6/11/2011 19:00
327.02
6/11/2011 20:00
355.72
6/11/2011 21:00
226.13
6/11/2011 22:00
295.59
6/11/2011 23:00
419.15
6/12/2011 0:00
390.81
6/12/2011 1:00
453.35
6/12/2011 2:00
369.63
6/12/2011 3:00
224.48
6/12/2011 4:00
398.23
6/12/2011 5:00
411.28
6/12/2011 6:00
440.70
Docket No. ER11-1844
Exhibit No. NYI-4
Page 272 of 375
6/12/2011 7:00
480.45
6/12/2011 8:00
377.44
6/12/2011 9:00
426.12
6/12/2011 10:00
404.62
6/12/2011 11:00
444.36
6/12/2011 12:00
479.35
6/12/2011 13:00
499.92
6/12/2011 14:00
312.15
6/12/2011 15:00
466.10
6/12/2011 16:00
361.53
6/12/2011 17:00
483.75
6/12/2011 18:00
462.82
6/12/2011 19:00
344.18
6/12/2011 20:00
369.15
6/12/2011 21:00
269.52
6/12/2011 22:00
243.65
6/12/2011 23:00
296.86
6/13/2011 0:00
342.59
6/13/2011 1:00
226.65
6/13/2011 2:00
290.32
6/13/2011 3:00
249.86
6/13/2011 4:00
323.92
6/13/2011 5:00
200.27
6/13/2011 6:00
304.73
6/13/2011 7:00
274.99
6/13/2011 8:00
94.65
6/13/2011 9:00
17.09
6/13/2011 10:00
53.38
6/13/2011 11:00
170.77
6/13/2011 12:00
72.33
6/13/2011 13:00
39.29
6/13/2011 14:00
-90.38
6/13/2011 15:00
-149.76
6/13/2011 16:00
-60.30
6/13/2011 17:00
-136.10
6/13/2011 18:00
-56.29
6/13/2011 19:00
37.95
6/13/2011 20:00
-82.20
6/13/2011 21:00
-59.22
6/13/2011 22:00
225.59
6/13/2011 23:00
377.73
6/14/2011 0:00
387.69
6/14/2011 1:00
463.36
6/14/2011 2:00
425.05
6/14/2011 3:00
158.24
6/14/2011 4:00
21.40
6/14/2011 5:00
277.63
Docket No. ER11-1844
Exhibit No. NYI-4
Page 273 of 375
6/14/2011 6:00
573.98
6/14/2011 7:00
334.58
6/14/2011 8:00
212.39
6/14/2011 9:00
135.38
6/14/2011 10:00
190.00
6/14/2011 11:00
79.51
6/14/2011 12:00
-0.93
6/14/2011 13:00
142.65
6/14/2011 14:00
11.60
6/14/2011 15:00
-6.57
6/14/2011 16:00
-28.43
6/14/2011 17:00
41.34
6/14/2011 18:00
185.46
6/14/2011 19:00
126.48
6/14/2011 20:00
204.99
6/14/2011 21:00
133.06
6/14/2011 22:00
186.60
6/14/2011 23:00
529.72
6/15/2011 0:00
366.82
6/15/2011 1:00
403.04
6/15/2011 2:00
115.72
6/15/2011 3:00
172.91
6/15/2011 4:00
63.55
6/15/2011 5:00
197.04
6/15/2011 6:00
615.29
6/15/2011 7:00
525.73
6/15/2011 8:00
453.35
6/15/2011 9:00
470.91
6/15/2011 10:00
459.57
6/15/2011 11:00
360.94
6/15/2011 12:00
313.26
6/15/2011 13:00
425.38
6/15/2011 14:00
340.59
6/15/2011 15:00
341.30
6/15/2011 16:00
370.26
6/15/2011 17:00
347.79
6/15/2011 18:00
310.73
6/15/2011 19:00
301.14
6/15/2011 20:00
341.05
6/15/2011 21:00
175.70
6/15/2011 22:00
274.36
6/15/2011 23:00
565.64
6/16/2011 0:00
617.37
6/16/2011 1:00
542.06
6/16/2011 2:00
465.15
6/16/2011 3:00
395.99
6/16/2011 4:00
476.61
Docket No. ER11-1844
Exhibit No. NYI-4
Page 274 of 375
6/16/2011 5:00
668.64
6/16/2011 6:00
689.41
6/16/2011 7:00
706.88
6/16/2011 8:00
389.91
6/16/2011 9:00
265.48
6/16/2011 10:00
342.93
6/16/2011 11:00
509.86
6/16/2011 12:00
479.64
6/16/2011 13:00
498.04
6/16/2011 14:00
383.45
6/16/2011 15:00
505.22
6/16/2011 16:00
511.89
6/16/2011 17:00
501.98
6/16/2011 18:00
377.16
6/16/2011 19:00
441.44
6/16/2011 20:00
435.55
6/16/2011 21:00
384.07
6/16/2011 22:00
446.50
6/16/2011 23:00
496.21
6/17/2011 0:00
411.31
6/17/2011 1:00
492.64
6/17/2011 2:00
422.20
6/17/2011 3:00
497.59
6/17/2011 4:00
300.19
6/17/2011 5:00
234.79
6/17/2011 6:00
444.39
6/17/2011 7:00
259.17
6/17/2011 8:00
192.20
6/17/2011 9:00
161.93
6/17/2011 10:00
267.59
6/17/2011 11:00
174.22
6/17/2011 12:00
444.06
6/17/2011 13:00
292.65
6/17/2011 14:00
347.52
6/17/2011 15:00
304.38
6/17/2011 16:00
158.45
6/17/2011 17:00
193.23
6/17/2011 18:00
272.68
6/17/2011 19:00
334.76
6/17/2011 20:00
187.00
6/17/2011 21:00
78.42
6/17/2011 22:00
326.55
6/17/2011 23:00
287.44
6/18/2011 0:00
237.76
6/18/2011 1:00
339.75
6/18/2011 2:00
386.94
6/18/2011 3:00
340.94
Docket No. ER11-1844
Exhibit No. NYI-4
Page 275 of 375
6/18/2011 4:00
247.95
6/18/2011 5:00
187.42
6/18/2011 6:00
533.35
6/18/2011 7:00
373.60
6/18/2011 8:00
50.62
6/18/2011 9:00
160.76
6/18/2011 10:00
423.53
6/18/2011 11:00
334.53
6/18/2011 12:00
310.94
6/18/2011 13:00
515.59
6/18/2011 14:00
539.21
6/18/2011 15:00
601.59
6/18/2011 16:00
561.87
6/18/2011 17:00
448.42
6/18/2011 18:00
292.03
6/18/2011 19:00
374.80
6/18/2011 20:00
456.64
6/18/2011 21:00
339.01
6/18/2011 22:00
366.00
6/18/2011 23:00
434.26
6/19/2011 0:00
302.22
6/19/2011 1:00
421.34
6/19/2011 2:00
641.65
6/19/2011 3:00
475.71
6/19/2011 4:00
509.83
6/19/2011 5:00
396.95
6/19/2011 6:00
345.28
6/19/2011 7:00
361.15
6/19/2011 8:00
514.98
6/19/2011 9:00
575.41
6/19/2011 10:00
489.32
6/19/2011 11:00
88.46
6/19/2011 12:00
173.97
6/19/2011 13:00
76.62
6/19/2011 14:00
194.85
6/19/2011 15:00
108.11
6/19/2011 16:00
209.23
6/19/2011 17:00
146.07
6/19/2011 18:00
311.86
6/19/2011 19:00
312.63
6/19/2011 20:00
261.60
6/19/2011 21:00
258.94
6/19/2011 22:00
414.33
6/19/2011 23:00
255.83
6/20/2011 0:00
213.83
6/20/2011 1:00
352.24
6/20/2011 2:00
497.82
Docket No. ER11-1844
Exhibit No. NYI-4
Page 276 of 375
6/20/2011 3:00
470.31
6/20/2011 4:00
622.33
6/20/2011 5:00
461.43
6/20/2011 6:00
348.37
6/20/2011 7:00
360.91
6/20/2011 8:00
107.57
6/20/2011 9:00
149.73
6/20/2011 10:00
86.66
6/20/2011 11:00
121.95
6/20/2011 12:00
81.16
6/20/2011 13:00
179.38
6/20/2011 14:00
542.14
6/20/2011 15:00
477.76
6/20/2011 16:00
382.21
6/20/2011 17:00
253.60
6/20/2011 18:00
154.92
6/20/2011 19:00
177.22
6/20/2011 20:00
269.25
6/20/2011 21:00
161.67
6/20/2011 22:00
144.37
6/20/2011 23:00
63.41
6/21/2011 0:00
329.09
6/21/2011 1:00
327.80
6/21/2011 2:00
454.51
6/21/2011 3:00
482.58
6/21/2011 4:00
349.00
6/21/2011 5:00
169.74
6/21/2011 6:00
305.34
6/21/2011 7:00
395.40
6/21/2011 8:00
69.79
6/21/2011 9:00
-61.55
6/21/2011 10:00
-155.49
6/21/2011 11:00
-87.40
6/21/2011 12:00
174.08
6/21/2011 13:00
251.87
6/21/2011 14:00
146.10
6/21/2011 15:00
178.03
6/21/2011 16:00
84.38
6/21/2011 17:00
133.86
6/21/2011 18:00
39.64
6/21/2011 19:00
-48.79
6/21/2011 20:00
145.05
6/21/2011 21:00
71.04
6/21/2011 22:00
252.39
6/21/2011 23:00
32.93
6/22/2011 0:00
232.54
6/22/2011 1:00
36.83
Docket No. ER11-1844
Exhibit No. NYI-4
Page 277 of 375
6/22/2011 2:00
-24.52
6/22/2011 3:00
35.10
6/22/2011 4:00
30.05
6/22/2011 5:00
122.86
6/22/2011 6:00
224.94
6/22/2011 7:00
0.27
6/22/2011 8:00
-158.81
6/22/2011 9:00
-168.02
6/22/2011 10:00
-18.60
6/22/2011 11:00
188.81
6/22/2011 12:00
-168.98
6/22/2011 13:00
-106.22
6/22/2011 14:00
-332.91
6/22/2011 15:00
-252.20
6/22/2011 16:00
-233.79
6/22/2011 17:00
-306.24
6/22/2011 18:00
-164.82
6/22/2011 19:00
37.22
6/22/2011 20:00
130.75
6/22/2011 21:00
362.98
6/22/2011 22:00
322.62
6/22/2011 23:00
268.40
6/23/2011 0:00
357.61
6/23/2011 1:00
411.09
6/23/2011 2:00
272.13
6/23/2011 3:00
282.40
6/23/2011 4:00
156.22
6/23/2011 5:00
170.73
6/23/2011 6:00
216.95
6/23/2011 7:00
119.69
6/23/2011 8:00
10.64
6/23/2011 9:00
8.19
6/23/2011 10:00
71.62
6/23/2011 11:00
265.93
6/23/2011 12:00
373.50
6/23/2011 13:00
543.76
6/23/2011 14:00
333.06
6/23/2011 15:00
250.18
6/23/2011 16:00
261.75
6/23/2011 17:00
311.88
6/23/2011 18:00
298.63
6/23/2011 19:00
153.21
6/23/2011 20:00
215.43
6/23/2011 21:00
60.27
6/23/2011 22:00
202.51
6/23/2011 23:00
185.07
6/24/2011 0:00
247.48
Docket No. ER11-1844
Exhibit No. NYI-4
Page 278 of 375
6/24/2011 1:00
276.83
6/24/2011 2:00
321.46
6/24/2011 3:00
324.50
6/24/2011 4:00
306.89
6/24/2011 5:00
170.00
6/24/2011 6:00
289.33
6/24/2011 7:00
182.30
6/24/2011 8:00
183.80
6/24/2011 9:00
224.25
6/24/2011 10:00
275.58
6/24/2011 11:00
249.11
6/24/2011 12:00
278.15
6/24/2011 13:00
380.47
6/24/2011 14:00
143.55
6/24/2011 15:00
234.50
6/24/2011 16:00
322.77
6/24/2011 17:00
402.17
6/24/2011 18:00
261.70
6/24/2011 19:00
393.25
6/24/2011 20:00
281.08
6/24/2011 21:00
269.14
6/24/2011 22:00
420.67
6/24/2011 23:00
339.29
6/25/2011 0:00
362.18
6/25/2011 1:00
409.13
6/25/2011 2:00
374.94
6/25/2011 3:00
505.72
6/25/2011 4:00
357.67
6/25/2011 5:00
463.86
6/25/2011 6:00
204.89
6/25/2011 7:00
412.37
6/25/2011 8:00
297.81
6/25/2011 9:00
299.38
6/25/2011 10:00
207.30
6/25/2011 11:00
195.89
6/25/2011 12:00
177.82
6/25/2011 13:00
142.26
6/25/2011 14:00
130.65
6/25/2011 15:00
56.71
6/25/2011 16:00
39.31
6/25/2011 17:00
43.15
6/25/2011 18:00
56.98
6/25/2011 19:00
28.78
6/25/2011 20:00
169.62
6/25/2011 21:00
52.06
6/25/2011 22:00
231.37
6/25/2011 23:00
305.95
Docket No. ER11-1844
Exhibit No. NYI-4
Page 279 of 375
6/26/2011 0:00
219.24
6/26/2011 1:00
351.31
6/26/2011 2:00
375.45
6/26/2011 3:00
337.29
6/26/2011 4:00
364.56
6/26/2011 5:00
417.88
6/26/2011 6:00
426.55
6/26/2011 7:00
455.25
6/26/2011 8:00
276.04
6/26/2011 9:00
336.25
6/26/2011 10:00
281.10
6/26/2011 11:00
-4.89
6/26/2011 12:00
-178.10
6/26/2011 13:00
-167.71
6/26/2011 14:00
17.28
6/26/2011 15:00
-112.24
6/26/2011 16:00
-158.08
6/26/2011 17:00
-121.79
6/26/2011 18:00
56.15
6/26/2011 19:00
27.31
6/26/2011 20:00
111.05
6/26/2011 21:00
109.60
6/26/2011 22:00
333.53
6/26/2011 23:00
387.22
6/27/2011 0:00
457.42
6/27/2011 1:00
372.69
6/27/2011 2:00
411.84
6/27/2011 3:00
266.35
6/27/2011 4:00
301.30
6/27/2011 5:00
233.94
6/27/2011 6:00
300.95
6/27/2011 7:00
102.40
6/27/2011 8:00
142.69
6/27/2011 9:00
129.68
6/27/2011 10:00
90.79
6/27/2011 11:00
-31.58
6/27/2011 12:00
41.44
6/27/2011 13:00
-34.68
6/27/2011 14:00
-71.91
6/27/2011 15:00
-91.84
6/27/2011 16:00
18.79
6/27/2011 17:00
127.16
6/27/2011 18:00
15.26
6/27/2011 19:00
135.05
6/27/2011 20:00
98.64
6/27/2011 21:00
-110.43
6/27/2011 22:00
-158.25
Docket No. ER11-1844
Exhibit No. NYI-4
Page 280 of 375
6/27/2011 23:00
76.12
6/28/2011 0:00
186.26
6/28/2011 1:00
276.51
6/28/2011 2:00
377.26
6/28/2011 3:00
304.75
6/28/2011 4:00
302.26
6/28/2011 5:00
344.71
6/28/2011 6:00
385.42
6/28/2011 7:00
10.52
6/28/2011 8:00
-189.37
6/28/2011 9:00
-250.73
6/28/2011 10:00
-278.56
6/28/2011 11:00
-163.74
6/28/2011 12:00
-63.75
6/28/2011 13:00
-92.52
6/28/2011 14:00
-104.05
6/28/2011 15:00
45.46
6/28/2011 16:00
132.05
6/28/2011 17:00
303.12
6/28/2011 18:00
372.73
6/28/2011 19:00
353.33
6/28/2011 20:00
567.72
6/28/2011 21:00
561.10
6/28/2011 22:00
566.12
6/28/2011 23:00
359.00
6/29/2011 0:00
362.97
6/29/2011 1:00
248.59
6/29/2011 2:00
176.61
6/29/2011 3:00
108.05
6/29/2011 4:00
126.58
6/29/2011 5:00
153.99
6/29/2011 6:00
286.42
6/29/2011 7:00
159.74
6/29/2011 8:00
51.53
6/29/2011 9:00
142.56
6/29/2011 10:00
271.55
6/29/2011 11:00
420.89
6/29/2011 12:00
567.75
6/29/2011 13:00
158.88
6/29/2011 14:00
173.05
6/29/2011 15:00
305.33
6/29/2011 16:00
205.16
6/29/2011 17:00
366.14
6/29/2011 18:00
246.14
6/29/2011 19:00
234.32
6/29/2011 20:00
231.32
6/29/2011 21:00
44.25
Docket No. ER11-1844
Exhibit No. NYI-4
Page 281 of 375
6/29/2011 22:00
202.94
6/29/2011 23:00
336.26
6/30/2011 0:00
404.10
6/30/2011 1:00
383.22
6/30/2011 2:00
252.83
6/30/2011 3:00
189.87
6/30/2011 4:00
162.29
6/30/2011 5:00
187.31
6/30/2011 6:00
549.79
6/30/2011 7:00
409.16
6/30/2011 8:00
87.74
6/30/2011 9:00
216.17
6/30/2011 10:00
11.98
6/30/2011 11:00
-63.09
6/30/2011 12:00
0.59
6/30/2011 13:00
-18.02
6/30/2011 14:00
226.87
6/30/2011 15:00
141.63
6/30/2011 16:00
150.89
6/30/2011 17:00
102.52
6/30/2011 18:00
335.85
6/30/2011 19:00
152.53
6/30/2011 20:00
200.30
6/30/2011 21:00
174.45
6/30/2011 22:00
245.05
6/30/2011 23:00
257.24
7/1/2011 0:00
302.41
7/1/2011 1:00
389.42
7/1/2011 2:00
148.89
7/1/2011 3:00
68.64
7/1/2011 4:00
92.73
7/1/2011 5:00
211.63
7/1/2011 6:00
136.01
7/1/2011 7:00
81.70
7/1/2011 8:00
54.69
7/1/2011 9:00
123.00
7/1/2011 10:00
263.45
7/1/2011 11:00
481.36
7/1/2011 12:00
573.28
7/1/2011 13:00
502.60
7/1/2011 14:00
331.22
7/1/2011 15:00
298.26
7/1/2011 16:00
231.42
7/1/2011 17:00
285.61
7/1/2011 18:00
368.95
7/1/2011 19:00
390.67
7/1/2011 20:00
554.15
Docket No. ER11-1844
Exhibit No. NYI-4
Page 282 of 375
7/1/2011 21:00
572.21
7/1/2011 22:00
307.48
7/1/2011 23:00
226.52
7/2/2011 0:00
167.82
7/2/2011 1:00
91.02
7/2/2011 2:00
73.61
7/2/2011 3:00
348.68
7/2/2011 4:00
238.90
7/2/2011 5:00
95.50
7/2/2011 6:00
60.87
7/2/2011 7:00
-149.91
7/2/2011 8:00
333.60
7/2/2011 9:00
32.11
7/2/2011 10:00
82.85
7/2/2011 11:00
281.49
7/2/2011 12:00
307.12
7/2/2011 13:00
222.91
7/2/2011 14:00
337.66
7/2/2011 15:00
218.24
7/2/2011 16:00
273.96
7/2/2011 17:00
400.43
7/2/2011 18:00
337.23
7/2/2011 19:00
489.46
7/2/2011 20:00
403.85
7/2/2011 21:00
390.08
7/2/2011 22:00
366.92
7/2/2011 23:00
333.16
7/3/2011 0:00
33.34
7/3/2011 1:00
95.72
7/3/2011 2:00
171.39
7/3/2011 3:00
256.07
7/3/2011 4:00
278.29
7/3/2011 5:00
271.99
7/3/2011 6:00
288.91
7/3/2011 7:00
266.43
7/3/2011 8:00
470.95
7/3/2011 9:00
61.44
7/3/2011 10:00
-145.62
7/3/2011 11:00
-195.25
7/3/2011 12:00
-183.95
7/3/2011 13:00
-291.72
7/3/2011 14:00
-338.10
7/3/2011 15:00
171.69
7/3/2011 16:00
348.77
7/3/2011 17:00
408.45
7/3/2011 18:00
191.26
7/3/2011 19:00
260.19
Docket No. ER11-1844
Exhibit No. NYI-4
Page 283 of 375
7/3/2011 20:00
213.31
7/3/2011 21:00
193.71
7/3/2011 22:00
16.40
7/3/2011 23:00
41.44
7/4/2011 0:00
32.64
7/4/2011 1:00
24.34
7/4/2011 2:00
-79.76
7/4/2011 3:00
21.11
7/4/2011 4:00
62.51
7/4/2011 5:00
-113.29
7/4/2011 6:00
-88.26
7/4/2011 7:00
185.88
7/4/2011 8:00
126.82
7/4/2011 9:00
-150.55
7/4/2011 10:00
-23.25
7/4/2011 11:00
111.33
7/4/2011 12:00
107.13
7/4/2011 13:00
166.82
7/4/2011 14:00
146.39
7/4/2011 15:00
345.61
7/4/2011 16:00
569.43
7/4/2011 17:00
395.37
7/4/2011 18:00
271.59
7/4/2011 19:00
217.81
7/4/2011 20:00
354.29
7/4/2011 21:00
305.88
7/4/2011 22:00
216.67
7/4/2011 23:00
32.85
7/5/2011 0:00
158.58
7/5/2011 1:00
280.36
7/5/2011 2:00
159.54
7/5/2011 3:00
39.65
7/5/2011 4:00
-16.37
7/5/2011 5:00
256.94
7/5/2011 6:00
343.83
7/5/2011 7:00
46.25
7/5/2011 8:00
-44.13
7/5/2011 9:00
-78.23
7/5/2011 10:00
-44.03
7/5/2011 11:00
-110.38
7/5/2011 12:00
-9.54
7/5/2011 13:00
9.01
7/5/2011 14:00
214.94
7/5/2011 15:00
249.29
7/5/2011 16:00
172.46
7/5/2011 17:00
176.88
7/5/2011 18:00
313.58
Docket No. ER11-1844
Exhibit No. NYI-4
Page 284 of 375
7/5/2011 19:00
196.37
7/5/2011 20:00
221.87
7/5/2011 21:00
83.01
7/5/2011 22:00
121.23
7/5/2011 23:00
185.84
7/6/2011 0:00
-140.08
7/6/2011 1:00
13.04
7/6/2011 2:00
-203.13
7/6/2011 3:00
-200.26
7/6/2011 4:00
-162.08
7/6/2011 5:00
-1.22
7/6/2011 6:00
365.18
7/6/2011 7:00
139.78
7/6/2011 8:00
169.57
7/6/2011 9:00
271.02
7/6/2011 10:00
398.24
7/6/2011 11:00
372.92
7/6/2011 12:00
64.67
7/6/2011 13:00
119.01
7/6/2011 14:00
-55.02
7/6/2011 15:00
48.94
7/6/2011 16:00
109.76
7/6/2011 17:00
68.15
7/6/2011 18:00
191.45
7/6/2011 19:00
446.01
7/6/2011 20:00
554.23
7/6/2011 21:00
541.12
7/6/2011 22:00
474.74
7/6/2011 23:00
577.14
7/7/2011 0:00
329.00
7/7/2011 1:00
397.97
7/7/2011 2:00
466.25
7/7/2011 3:00
514.69
7/7/2011 4:00
581.63
7/7/2011 5:00
547.37
7/7/2011 6:00
517.46
7/7/2011 7:00
527.66
7/7/2011 8:00
491.93
7/7/2011 9:00
499.23
7/7/2011 10:00
333.22
7/7/2011 11:00
198.70
7/7/2011 12:00
305.90
7/7/2011 13:00
271.01
7/7/2011 14:00
429.84
7/7/2011 15:00
42.71
7/7/2011 16:00
-47.14
7/7/2011 17:00
156.58
Docket No. ER11-1844
Exhibit No. NYI-4
Page 285 of 375
7/7/2011 18:00
192.15
7/7/2011 19:00
579.01
7/7/2011 20:00
707.56
7/7/2011 21:00
509.67
7/7/2011 22:00
392.34
7/7/2011 23:00
261.09
7/8/2011 0:00
261.03
7/8/2011 1:00
145.66
7/8/2011 2:00
68.73
7/8/2011 3:00
69.88
7/8/2011 4:00
213.15
7/8/2011 5:00
138.84
7/8/2011 6:00
314.40
7/8/2011 7:00
198.95
7/8/2011 8:00
236.81
7/8/2011 9:00
105.74
7/8/2011 10:00
-52.24
7/8/2011 11:00
-44.68
7/8/2011 12:00
70.52
7/8/2011 13:00
176.55
7/8/2011 14:00
208.49
7/8/2011 15:00
298.15
7/8/2011 16:00
135.99
7/8/2011 17:00
396.00
7/8/2011 18:00
53.18
7/8/2011 19:00
178.11
7/8/2011 20:00
91.75
7/8/2011 21:00
292.25
7/8/2011 22:00
211.66
7/8/2011 23:00
188.53
7/9/2011 0:00
17.98
7/9/2011 1:00
-45.25
7/9/2011 2:00
25.70
7/9/2011 3:00
120.79
7/9/2011 4:00
13.98
7/9/2011 5:00
-40.41
7/9/2011 6:00
-134.24
7/9/2011 7:00
187.18
7/9/2011 8:00
194.75
7/9/2011 9:00
-15.82
7/9/2011 10:00
-111.96
7/9/2011 11:00
-50.72
7/9/2011 12:00
-90.05
7/9/2011 13:00
-144.40
7/9/2011 14:00
195.91
7/9/2011 15:00
168.26
7/9/2011 16:00
212.36
Docket No. ER11-1844
Exhibit No. NYI-4
Page 286 of 375
7/9/2011 17:00
285.64
7/9/2011 18:00
280.74
7/9/2011 19:00
307.79
7/9/2011 20:00
86.13
7/9/2011 21:00
311.18
7/9/2011 22:00
230.63
7/9/2011 23:00
8.71
7/10/2011 0:00
53.25
7/10/2011 1:00
-125.39
7/10/2011 2:00
-112.10
7/10/2011 3:00
-116.49
7/10/2011 4:00
24.97
7/10/2011 5:00
30.44
7/10/2011 6:00
11.38
7/10/2011 7:00
-106.96
7/10/2011 8:00
19.08
7/10/2011 9:00
-326.17
7/10/2011 10:00
-387.66
7/10/2011 11:00
-182.82
7/10/2011 12:00
24.36
7/10/2011 13:00
77.22
7/10/2011 14:00
139.19
7/10/2011 15:00
22.14
7/10/2011 16:00
-109.13
7/10/2011 17:00
-124.81
7/10/2011 18:00
-19.46
7/10/2011 19:00
126.67
7/10/2011 20:00
270.23
7/10/2011 21:00
163.55
7/10/2011 22:00
114.41
7/10/2011 23:00
-114.76
7/11/2011 0:00
94.65
7/11/2011 1:00
120.06
7/11/2011 2:00
140.29
7/11/2011 3:00
106.81
7/11/2011 4:00
260.31
7/11/2011 5:00
175.40
7/11/2011 6:00
173.81
7/11/2011 7:00
247.00
7/11/2011 8:00
181.45
7/11/2011 9:00
59.90
7/11/2011 10:00
4.82
7/11/2011 11:00
299.46
7/11/2011 12:00
173.70
7/11/2011 13:00
385.33
7/11/2011 14:00
264.99
7/11/2011 15:00
393.44
Docket No. ER11-1844
Exhibit No. NYI-4
Page 287 of 375
7/11/2011 16:00
197.56
7/11/2011 17:00
153.63
7/11/2011 18:00
262.06
7/11/2011 19:00
286.97
7/11/2011 20:00
410.52
7/11/2011 21:00
371.12
7/11/2011 22:00
279.07
7/11/2011 23:00
315.59
7/12/2011 0:00
287.18
7/12/2011 1:00
406.03
7/12/2011 2:00
299.69
7/12/2011 3:00
305.74
7/12/2011 4:00
313.84
7/12/2011 5:00
289.97
7/12/2011 6:00
54.85
7/12/2011 7:00
-182.16
7/12/2011 8:00
-142.11
7/12/2011 9:00
-176.38
7/12/2011 10:00
-280.77
7/12/2011 11:00
-559.67
7/12/2011 12:00
-401.96
7/12/2011 13:00
-279.19
7/12/2011 14:00
-539.89
7/12/2011 15:00
-570.20
7/12/2011 16:00
-421.49
7/12/2011 17:00
-443.76
7/12/2011 18:00
-282.12
7/12/2011 19:00
73.98
7/12/2011 20:00
131.24
7/12/2011 21:00
85.13
7/12/2011 22:00
31.97
7/12/2011 23:00
-14.58
7/13/2011 0:00
-30.22
7/13/2011 1:00
148.60
7/13/2011 2:00
108.13
7/13/2011 3:00
92.54
7/13/2011 4:00
118.91
7/13/2011 5:00
107.46
7/13/2011 6:00
100.42
7/13/2011 7:00
10.90
7/13/2011 8:00
124.68
7/13/2011 9:00
52.35
7/13/2011 10:00
-92.88
7/13/2011 11:00
-121.92
7/13/2011 12:00
-187.29
7/13/2011 13:00
-179.43
7/13/2011 14:00
19.91
Docket No. ER11-1844
Exhibit No. NYI-4
Page 288 of 375
7/13/2011 15:00
-64.51
7/13/2011 16:00
-24.76
7/13/2011 17:00
5.46
7/13/2011 18:00
221.58
7/13/2011 19:00
369.15
7/13/2011 20:00
307.75
7/13/2011 21:00
246.79
7/13/2011 22:00
252.51
7/13/2011 23:00
219.59
7/14/2011 0:00
368.99
7/14/2011 1:00
483.24
7/14/2011 2:00
228.68
7/14/2011 3:00
276.97
7/14/2011 4:00
85.81
7/14/2011 5:00
275.85
7/14/2011 6:00
392.13
7/14/2011 7:00
205.92
7/14/2011 8:00
333.09
7/14/2011 9:00
247.15
7/14/2011 10:00
180.13
7/14/2011 11:00
149.53
7/14/2011 12:00
260.02
7/14/2011 13:00
120.44
7/14/2011 14:00
437.39
7/14/2011 15:00
523.67
7/14/2011 16:00
545.15
7/14/2011 17:00
289.29
7/14/2011 18:00
195.45
7/14/2011 19:00
138.10
7/14/2011 20:00
343.06
7/14/2011 21:00
656.77
7/14/2011 22:00
451.29
7/14/2011 23:00
217.74
7/15/2011 0:00
200.91
7/15/2011 1:00
174.35
7/15/2011 2:00
-77.05
7/15/2011 3:00
-60.60
7/15/2011 4:00
59.76
7/15/2011 5:00
-0.75
7/15/2011 6:00
268.39
7/15/2011 7:00
198.10
7/15/2011 8:00
28.78
7/15/2011 9:00
-157.29
7/15/2011 10:00
-226.53
7/15/2011 11:00
-99.96
7/15/2011 12:00
65.76
7/15/2011 13:00
45.39
Docket No. ER11-1844
Exhibit No. NYI-4
Page 289 of 375
7/15/2011 14:00
-114.00
7/15/2011 15:00
-292.90
7/15/2011 16:00
-129.15
7/15/2011 17:00
-282.38
7/15/2011 18:00
8.37
7/15/2011 19:00
40.48
7/15/2011 20:00
130.32
7/15/2011 21:00
-127.22
7/15/2011 22:00
-75.43
7/15/2011 23:00
9.29
7/16/2011 0:00
66.19
7/16/2011 1:00
195.80
7/16/2011 2:00
148.85
7/16/2011 3:00
169.88
7/16/2011 4:00
165.76
7/16/2011 5:00
241.65
7/16/2011 6:00
194.22
7/16/2011 7:00
329.33
7/16/2011 8:00
161.90
7/16/2011 9:00
-99.72
7/16/2011 10:00
-186.03
7/16/2011 11:00
-212.91
7/16/2011 12:00
-225.55
7/16/2011 13:00
-190.72
7/16/2011 14:00
-114.84
7/16/2011 15:00
-142.77
7/16/2011 16:00
-192.47
7/16/2011 17:00
-156.93
7/16/2011 18:00
77.98
7/16/2011 19:00
91.21
7/16/2011 20:00
243.74
7/16/2011 21:00
184.13
7/16/2011 22:00
-51.65
7/16/2011 23:00
-36.39
7/17/2011 0:00
-165.29
7/17/2011 1:00
-44.79
7/17/2011 2:00
30.24
7/17/2011 3:00
12.80
7/17/2011 4:00
-58.58
7/17/2011 5:00
5.52
7/17/2011 6:00
-45.34
7/17/2011 7:00
20.48
7/17/2011 8:00
-92.85
7/17/2011 9:00
-424.56
7/17/2011 10:00
-493.60
7/17/2011 11:00
-558.57
7/17/2011 12:00
-315.34
Docket No. ER11-1844
Exhibit No. NYI-4
Page 290 of 375
7/17/2011 13:00
-368.61
7/17/2011 14:00
-372.27
7/17/2011 15:00
-463.00
7/17/2011 16:00
-410.61
7/17/2011 17:00
-237.05
7/17/2011 18:00
-107.94
7/17/2011 19:00
100.78
7/17/2011 20:00
-116.49
7/17/2011 21:00
-599.99
7/17/2011 22:00
-444.27
7/17/2011 23:00
-532.64
7/18/2011 0:00
-19.54
7/18/2011 1:00
-45.39
7/18/2011 2:00
-26.87
7/18/2011 3:00
65.81
7/18/2011 4:00
129.58
7/18/2011 5:00
43.78
7/18/2011 6:00
118.00
7/18/2011 7:00
98.01
7/18/2011 8:00
123.48
7/18/2011 9:00
14.77
7/18/2011 10:00
-90.58
7/18/2011 11:00
-114.33
7/18/2011 12:00
-49.44
7/18/2011 13:00
-31.77
7/18/2011 14:00
-10.35
7/18/2011 15:00
250.63
7/18/2011 16:00
333.91
7/18/2011 17:00
473.60
7/18/2011 18:00
391.17
7/18/2011 19:00
441.64
7/18/2011 20:00
501.14
7/18/2011 21:00
155.20
7/18/2011 22:00
79.45
7/18/2011 23:00
186.61
7/19/2011 0:00
406.32
7/19/2011 1:00
297.50
7/19/2011 2:00
190.12
7/19/2011 3:00
171.80
7/19/2011 4:00
176.23
7/19/2011 5:00
69.41
7/19/2011 6:00
335.40
7/19/2011 7:00
313.56
7/19/2011 8:00
423.27
7/19/2011 9:00
378.88
7/19/2011 10:00
261.98
7/19/2011 11:00
442.79
Docket No. ER11-1844
Exhibit No. NYI-4
Page 291 of 375
7/19/2011 12:00
149.89
7/19/2011 13:00
-174.09
7/19/2011 14:00
-368.94
7/19/2011 15:00
-192.88
7/19/2011 16:00
-106.15
7/19/2011 17:00
-30.82
7/19/2011 18:00
-10.68
7/19/2011 19:00
91.28
7/19/2011 20:00
257.60
7/19/2011 21:00
306.90
7/19/2011 22:00
76.38
7/19/2011 23:00
68.54
7/20/2011 0:00
76.92
7/20/2011 1:00
-50.12
7/20/2011 2:00
-227.02
7/20/2011 3:00
-183.72
7/20/2011 4:00
-226.21
7/20/2011 5:00
-178.56
7/20/2011 6:00
-255.00
7/20/2011 7:00
79.54
7/20/2011 8:00
160.14
7/20/2011 9:00
308.24
7/20/2011 10:00
101.45
7/20/2011 11:00
134.91
7/20/2011 12:00
-22.37
7/20/2011 13:00
-468.21
7/20/2011 14:00
-528.08
7/20/2011 15:00
-434.87
7/20/2011 16:00
-243.60
7/20/2011 17:00
-178.72
7/20/2011 18:00
57.29
7/20/2011 19:00
169.79
7/20/2011 20:00
321.05
7/20/2011 21:00
190.11
7/20/2011 22:00
462.98
7/20/2011 23:00
179.97
7/21/2011 0:00
-229.47
7/21/2011 1:00
-205.96
7/21/2011 2:00
-377.03
7/21/2011 3:00
-304.49
7/21/2011 4:00
-262.75
7/21/2011 5:00
-307.05
7/21/2011 6:00
-266.93
7/21/2011 7:00
-175.37
7/21/2011 8:00
-369.25
7/21/2011 9:00
-495.20
7/21/2011 10:00
-238.70
Docket No. ER11-1844
Exhibit No. NYI-4
Page 292 of 375
7/21/2011 11:00
-48.93
7/21/2011 12:00
239.69
7/21/2011 13:00
1.29
7/21/2011 14:00
-44.90
7/21/2011 15:00
11.71
7/21/2011 16:00
25.35
7/21/2011 17:00
-8.66
7/21/2011 18:00
231.57
7/21/2011 19:00
73.89
7/21/2011 20:00
159.99
7/21/2011 21:00
368.82
7/21/2011 22:00
150.71
7/21/2011 23:00
-193.11
7/22/2011 0:00
-365.15
7/22/2011 1:00
-282.68
7/22/2011 2:00
-141.99
7/22/2011 3:00
-130.89
7/22/2011 4:00
-81.56
7/22/2011 5:00
-205.10
7/22/2011 6:00
-190.99
7/22/2011 7:00
-121.66
7/22/2011 8:00
105.82
7/22/2011 9:00
236.09
7/22/2011 10:00
582.36
7/22/2011 11:00
541.43
7/22/2011 12:00
778.19
7/22/2011 13:00
505.49
7/22/2011 14:00
528.00
7/22/2011 15:00
709.23
7/22/2011 16:00
529.28
7/22/2011 17:00
230.55
7/22/2011 18:00
410.95
7/22/2011 19:00
501.16
7/22/2011 20:00
606.95
7/22/2011 21:00
581.76
7/22/2011 22:00
471.88
7/22/2011 23:00
405.76
7/23/2011 0:00
350.69
7/23/2011 1:00
391.43
7/23/2011 2:00
351.35
7/23/2011 3:00
300.94
7/23/2011 4:00
326.93
7/23/2011 5:00
255.36
7/23/2011 6:00
119.13
7/23/2011 7:00
167.39
7/23/2011 8:00
13.28
7/23/2011 9:00
77.21
Docket No. ER11-1844
Exhibit No. NYI-4
Page 293 of 375
7/23/2011 10:00
415.91
7/23/2011 11:00
578.90
7/23/2011 12:00
499.53
7/23/2011 13:00
418.16
7/23/2011 14:00
346.83
7/23/2011 15:00
100.52
7/23/2011 16:00
133.61
7/23/2011 17:00
263.50
7/23/2011 18:00
214.63
7/23/2011 19:00
190.97
7/23/2011 20:00
82.30
7/23/2011 21:00
210.92
7/23/2011 22:00
199.45
7/23/2011 23:00
21.11
7/24/2011 0:00
185.23
7/24/2011 1:00
60.21
7/24/2011 2:00
-21.55
7/24/2011 3:00
22.20
7/24/2011 4:00
69.32
7/24/2011 5:00
-26.15
7/24/2011 6:00
77.33
7/24/2011 7:00
173.26
7/24/2011 8:00
25.00
7/24/2011 9:00
162.78
7/24/2011 10:00
74.27
7/24/2011 11:00
220.13
7/24/2011 12:00
175.90
7/24/2011 13:00
171.57
7/24/2011 14:00
219.63
7/24/2011 15:00
30.91
7/24/2011 16:00
-116.88
7/24/2011 17:00
-218.69
7/24/2011 18:00
-195.23
7/24/2011 19:00
33.57
7/24/2011 20:00
19.90
7/24/2011 21:00
-233.79
7/24/2011 22:00
9.94
7/24/2011 23:00
-261.22
7/25/2011 0:00
-181.25
7/25/2011 1:00
-235.87
7/25/2011 2:00
-275.64
7/25/2011 3:00
-92.11
7/25/2011 4:00
-34.25
7/25/2011 5:00
-32.79
7/25/2011 6:00
-144.75
7/25/2011 7:00
-113.44
7/25/2011 8:00
-256.50
Docket No. ER11-1844
Exhibit No. NYI-4
Page 294 of 375
7/25/2011 9:00
-115.13
7/25/2011 10:00
122.18
7/25/2011 11:00
130.84
7/25/2011 12:00
56.70
7/25/2011 13:00
42.20
7/25/2011 14:00
-158.89
7/25/2011 15:00
-226.88
7/25/2011 16:00
-189.79
7/25/2011 17:00
-340.54
7/25/2011 18:00
-169.99
7/25/2011 19:00
-54.44
7/25/2011 20:00
-116.43
7/25/2011 21:00
-187.24
7/25/2011 22:00
-48.98
7/25/2011 23:00
-9.20
7/26/2011 0:00
84.51
7/26/2011 1:00
-15.97
7/26/2011 2:00
-64.58
7/26/2011 3:00
186.82
7/26/2011 4:00
292.32
7/26/2011 5:00
6.51
7/26/2011 6:00
-182.52
7/26/2011 7:00
-85.95
7/26/2011 8:00
85.59
7/26/2011 9:00
88.61
7/26/2011 10:00
12.36
7/26/2011 11:00
-96.36
7/26/2011 12:00
-231.06
7/26/2011 13:00
-62.62
7/26/2011 14:00
-110.71
7/26/2011 15:00
69.21
7/26/2011 16:00
181.99
7/26/2011 17:00
354.29
7/26/2011 18:00
400.77
7/26/2011 19:00
591.12
7/26/2011 20:00
488.06
7/26/2011 21:00
318.46
7/26/2011 22:00
411.36
7/26/2011 23:00
211.35
7/27/2011 0:00
41.35
7/27/2011 1:00
-129.33
7/27/2011 2:00
7.24
7/27/2011 3:00
17.15
7/27/2011 4:00
86.01
7/27/2011 5:00
99.72
7/27/2011 6:00
106.12
7/27/2011 7:00
201.83
Docket No. ER11-1844
Exhibit No. NYI-4
Page 295 of 375
7/27/2011 8:00
420.38
7/27/2011 9:00
511.24
7/27/2011 10:00
623.62
7/27/2011 11:00
418.60
7/27/2011 12:00
471.26
7/27/2011 13:00
246.46
7/27/2011 14:00
76.27
7/27/2011 15:00
54.69
7/27/2011 16:00
-121.25
7/27/2011 17:00
-214.23
7/27/2011 18:00
111.99
7/27/2011 19:00
165.48
7/27/2011 20:00
215.80
7/27/2011 21:00
259.77
7/27/2011 22:00
-11.06
7/27/2011 23:00
-307.64
7/28/2011 0:00
13.83
7/28/2011 1:00
-166.52
7/28/2011 2:00
-202.63
7/28/2011 3:00
-253.80
7/28/2011 4:00
-331.59
7/28/2011 5:00
-153.68
7/28/2011 6:00
-377.67
7/28/2011 7:00
-335.38
7/28/2011 8:00
-75.03
7/28/2011 9:00
-17.02
7/28/2011 10:00
-19.29
7/28/2011 11:00
-149.89
7/28/2011 12:00
-228.75
7/28/2011 13:00
-385.95
7/28/2011 14:00
-443.47
7/28/2011 15:00
-761.19
7/28/2011 16:00
-918.53
7/28/2011 17:00
-967.87
7/28/2011 18:00
-890.77
7/28/2011 19:00
-575.57
7/28/2011 20:00
-538.21
7/28/2011 21:00
-532.09
7/28/2011 22:00
-714.83
7/28/2011 23:00
-657.54
7/29/2011 0:00
-400.42
7/29/2011 1:00
-245.36
7/29/2011 2:00
-257.64
7/29/2011 3:00
-488.75
7/29/2011 4:00
-462.20
7/29/2011 5:00
-246.01
7/29/2011 6:00
-531.26
Docket No. ER11-1844
Exhibit No. NYI-4
Page 296 of 375
7/29/2011 7:00
-415.41
7/29/2011 8:00
-82.00
7/29/2011 9:00
137.83
7/29/2011 10:00
-208.57
7/29/2011 11:00
-555.84
7/29/2011 12:00
-415.19
7/29/2011 13:00
-515.83
7/29/2011 14:00
-607.06
7/29/2011 15:00
-567.57
7/29/2011 16:00
-439.76
7/29/2011 17:00
-328.71
7/29/2011 18:00
-368.93
7/29/2011 19:00
-188.84
7/29/2011 20:00
-268.31
7/29/2011 21:00
-299.27
7/29/2011 22:00
-571.26
7/29/2011 23:00
-428.71
7/30/2011 0:00
-186.96
7/30/2011 1:00
-235.93
7/30/2011 2:00
-216.92
7/30/2011 3:00
-85.33
7/30/2011 4:00
20.74
7/30/2011 5:00
-54.66
7/30/2011 6:00
162.76
7/30/2011 7:00
185.18
7/30/2011 8:00
-213.58
7/30/2011 9:00
-253.81
7/30/2011 10:00
-116.74
7/30/2011 11:00
-162.48
7/30/2011 12:00
-325.40
7/30/2011 13:00
-32.55
7/30/2011 14:00
-63.54
7/30/2011 15:00
24.46
7/30/2011 16:00
157.46
7/30/2011 17:00
68.94
7/30/2011 18:00
-82.73
7/30/2011 19:00
-49.71
7/30/2011 20:00
-43.64
7/30/2011 21:00
65.68
7/30/2011 22:00
-88.35
7/30/2011 23:00
-420.36
7/31/2011 0:00
-411.48
7/31/2011 1:00
-206.19
7/31/2011 2:00
1.93
7/31/2011 3:00
54.58
7/31/2011 4:00
236.97
7/31/2011 5:00
252.54
Docket No. ER11-1844
Exhibit No. NYI-4
Page 297 of 375
7/31/2011 6:00
142.66
7/31/2011 7:00
-17.79
7/31/2011 8:00
152.69
7/31/2011 9:00
116.60
7/31/2011 10:00
223.40
7/31/2011 11:00
168.85
7/31/2011 12:00
285.73
7/31/2011 13:00
98.25
7/31/2011 14:00
-35.57
7/31/2011 15:00
-103.75
7/31/2011 16:00
-144.10
7/31/2011 17:00
-89.52
7/31/2011 18:00
-69.02
7/31/2011 19:00
-99.96
7/31/2011 20:00
-106.35
7/31/2011 21:00
-50.56
7/31/2011 22:00
-227.84
7/31/2011 23:00
-507.06
8/1/2011 0:00
-422.55
8/1/2011 1:00
-382.07
8/1/2011 2:00
-290.67
8/1/2011 3:00
-123.52
8/1/2011 4:00
-140.83
8/1/2011 5:00
-151.06
8/1/2011 6:00
-134.89
8/1/2011 7:00
-135.40
8/1/2011 8:00
-179.04
8/1/2011 9:00
-299.71
8/1/2011 10:00
4.92
8/1/2011 11:00
276.01
8/1/2011 12:00
324.11
8/1/2011 13:00
-22.75
8/1/2011 14:00
99.51
8/1/2011 15:00
164.92
8/1/2011 16:00
161.45
8/1/2011 17:00
173.87
8/1/2011 18:00
72.12
8/1/2011 19:00
-5.40
8/1/2011 20:00
56.33
8/1/2011 21:00
-85.19
8/1/2011 22:00
66.50
8/1/2011 23:00
-172.13
8/2/2011 0:00
66.79
8/2/2011 1:00
-175.02
8/2/2011 2:00
-162.47
8/2/2011 3:00
-162.35
8/2/2011 4:00
-199.49
Docket No. ER11-1844
Exhibit No. NYI-4
Page 298 of 375
8/2/2011 5:00
-187.27
8/2/2011 6:00
-227.18
8/2/2011 7:00
-27.03
8/2/2011 8:00
52.52
8/2/2011 9:00
200.28
8/2/2011 10:00
167.59
8/2/2011 11:00
-58.49
8/2/2011 12:00
14.89
8/2/2011 13:00
-110.11
8/2/2011 14:00
-403.88
8/2/2011 15:00
-547.35
8/2/2011 16:00
-426.95
8/2/2011 17:00
-488.59
8/2/2011 18:00
-269.76
8/2/2011 19:00
-48.83
8/2/2011 20:00
-3.28
8/2/2011 21:00
-106.96
8/2/2011 22:00
-145.01
8/2/2011 23:00
-128.30
8/3/2011 0:00
-110.44
8/3/2011 1:00
69.43
8/3/2011 2:00
66.98
8/3/2011 3:00
66.41
8/3/2011 4:00
20.97
8/3/2011 5:00
-41.77
8/3/2011 6:00
-149.22
8/3/2011 7:00
-44.75
8/3/2011 8:00
-68.58
8/3/2011 9:00
62.60
8/3/2011 10:00
89.56
8/3/2011 11:00
100.87
8/3/2011 12:00
72.89
8/3/2011 13:00
77.26
8/3/2011 14:00
-21.10
8/3/2011 15:00
-438.96
8/3/2011 16:00
-787.12
8/3/2011 17:00
-980.05
8/3/2011 18:00
-618.36
8/3/2011 19:00
-423.73
8/3/2011 20:00
-151.12
8/3/2011 21:00
-147.69
8/3/2011 22:00
-121.80
8/3/2011 23:00
-218.68
8/4/2011 0:00
-61.85
8/4/2011 1:00
-117.74
8/4/2011 2:00
-54.52
8/4/2011 3:00
8.17
Docket No. ER11-1844
Exhibit No. NYI-4
Page 299 of 375
8/4/2011 4:00
10.24
8/4/2011 5:00
78.40
8/4/2011 6:00
27.77
8/4/2011 7:00
142.52
8/4/2011 8:00
-21.39
8/4/2011 9:00
-128.08
8/4/2011 10:00
-172.91
8/4/2011 11:00
-285.39
8/4/2011 12:00
-569.19
8/4/2011 13:00
-232.91
8/4/2011 14:00
-201.00
8/4/2011 15:00
-379.79
8/4/2011 16:00
-516.40
8/4/2011 17:00
-544.48
8/4/2011 18:00
-432.84
8/4/2011 19:00
-521.83
8/4/2011 20:00
-336.88
8/4/2011 21:00
-80.81
8/4/2011 22:00
-114.17
8/4/2011 23:00
-4.79
8/5/2011 0:00
59.47
8/5/2011 1:00
170.62
8/5/2011 2:00
101.33
8/5/2011 3:00
85.41
8/5/2011 4:00
155.08
8/5/2011 5:00
257.15
8/5/2011 6:00
27.43
8/5/2011 7:00
-85.06
8/5/2011 8:00
-99.81
8/5/2011 9:00
-92.95
8/5/2011 10:00
-134.18
8/5/2011 11:00
-238.75
8/5/2011 12:00
-43.14
8/5/2011 13:00
-207.58
8/5/2011 14:00
-289.44
8/5/2011 15:00
-227.97
8/5/2011 16:00
-456.49
8/5/2011 17:00
-283.38
8/5/2011 18:00
-216.33
8/5/2011 19:00
-432.61
8/5/2011 20:00
-391.56
8/5/2011 21:00
-540.88
8/5/2011 22:00
-580.38
8/5/2011 23:00
-585.40
8/6/2011 0:00
-484.90
8/6/2011 1:00
-262.62
8/6/2011 2:00
-43.35
Docket No. ER11-1844
Exhibit No. NYI-4
Page 300 of 375
8/6/2011 3:00
-40.09
8/6/2011 4:00
27.93
8/6/2011 5:00
-2.55
8/6/2011 6:00
-312.59
8/6/2011 7:00
-174.31
8/6/2011 8:00
-259.51
8/6/2011 9:00
-381.60
8/6/2011 10:00
-281.76
8/6/2011 11:00
-331.30
8/6/2011 12:00
-361.95
8/6/2011 13:00
-294.81
8/6/2011 14:00
-204.55
8/6/2011 15:00
-186.78
8/6/2011 16:00
-199.03
8/6/2011 17:00
-259.64
8/6/2011 18:00
-124.49
8/6/2011 19:00
-130.13
8/6/2011 20:00
20.50
8/6/2011 21:00
-179.23
8/6/2011 22:00
-317.74
8/6/2011 23:00
-236.33
8/7/2011 0:00
-291.65
8/7/2011 1:00
-328.63
8/7/2011 2:00
-8.17
8/7/2011 3:00
115.49
8/7/2011 4:00
263.09
8/7/2011 5:00
209.19
8/7/2011 6:00
54.27
8/7/2011 7:00
201.72
8/7/2011 8:00
82.94
8/7/2011 9:00
-20.03
8/7/2011 10:00
234.64
8/7/2011 11:00
49.98
8/7/2011 12:00
81.50
8/7/2011 13:00
103.90
8/7/2011 14:00
164.22
8/7/2011 15:00
248.53
8/7/2011 16:00
479.59
8/7/2011 17:00
348.29
8/7/2011 18:00
137.71
8/7/2011 19:00
496.77
8/7/2011 20:00
538.27
8/7/2011 21:00
373.58
8/7/2011 22:00
555.79
8/7/2011 23:00
294.35
8/8/2011 0:00
188.70
8/8/2011 1:00
245.10
Docket No. ER11-1844
Exhibit No. NYI-4
Page 301 of 375
8/8/2011 2:00
242.98
8/8/2011 3:00
217.53
8/8/2011 4:00
222.20
8/8/2011 5:00
126.25
8/8/2011 6:00
113.94
8/8/2011 7:00
176.86
8/8/2011 8:00
204.42
8/8/2011 9:00
406.53
8/8/2011 10:00
245.43
8/8/2011 11:00
127.97
8/8/2011 12:00
-13.11
8/8/2011 13:00
-95.82
8/8/2011 14:00
-158.03
8/8/2011 15:00
84.58
8/8/2011 16:00
244.16
8/8/2011 17:00
280.85
8/8/2011 18:00
292.16
8/8/2011 19:00
120.76
8/8/2011 20:00
72.52
8/8/2011 21:00
96.57
8/8/2011 22:00
-213.85
8/8/2011 23:00
-340.71
8/9/2011 0:00
48.77
8/9/2011 1:00
-17.83
8/9/2011 2:00
122.31
8/9/2011 3:00
162.71
8/9/2011 4:00
-16.42
8/9/2011 5:00
-12.65
8/9/2011 6:00
176.21
8/9/2011 7:00
96.23
8/9/2011 8:00
125.28
8/9/2011 9:00
207.39
8/9/2011 10:00
197.57
8/9/2011 11:00
-69.84
8/9/2011 12:00
-215.28
8/9/2011 13:00
-234.37
8/9/2011 14:00
-116.14
8/9/2011 15:00
-136.59
8/9/2011 16:00
0.75
8/9/2011 17:00
182.57
8/9/2011 18:00
201.52
8/9/2011 19:00
229.72
8/9/2011 20:00
353.67
8/9/2011 21:00
299.37
8/9/2011 22:00
222.81
8/9/2011 23:00
175.83
8/10/2011 0:00
267.28
Docket No. ER11-1844
Exhibit No. NYI-4
Page 302 of 375
8/10/2011 1:00
142.85
8/10/2011 2:00
19.89
8/10/2011 3:00
-72.42
8/10/2011 4:00
92.83
8/10/2011 5:00
121.30
8/10/2011 6:00
64.87
8/10/2011 7:00
131.30
8/10/2011 8:00
259.51
8/10/2011 9:00
263.25
8/10/2011 10:00
64.14
8/10/2011 11:00
-14.17
8/10/2011 12:00
55.97
8/10/2011 13:00
25.80
8/10/2011 14:00
330.84
8/10/2011 15:00
544.07
8/10/2011 16:00
274.94
8/10/2011 17:00
454.11
8/10/2011 18:00
445.43
8/10/2011 19:00
357.58
8/10/2011 20:00
481.67
8/10/2011 21:00
499.44
8/10/2011 22:00
443.90
8/10/2011 23:00
305.53
8/11/2011 0:00
160.42
8/11/2011 1:00
371.72
8/11/2011 2:00
363.29
8/11/2011 3:00
273.03
8/11/2011 4:00
248.50
8/11/2011 5:00
351.37
8/11/2011 6:00
539.48
8/11/2011 7:00
342.04
8/11/2011 8:00
235.08
8/11/2011 9:00
265.96
8/11/2011 10:00
266.43
8/11/2011 11:00
323.41
8/11/2011 12:00
192.77
8/11/2011 13:00
70.20
8/11/2011 14:00
50.25
8/11/2011 15:00
-66.06
8/11/2011 16:00
-74.22
8/11/2011 17:00
31.03
8/11/2011 18:00
73.16
8/11/2011 19:00
272.43
8/11/2011 20:00
390.64
8/11/2011 21:00
363.06
8/11/2011 22:00
189.82
8/11/2011 23:00
63.31
Docket No. ER11-1844
Exhibit No. NYI-4
Page 303 of 375
8/12/2011 0:00
-41.41
8/12/2011 1:00
188.21
8/12/2011 2:00
215.88
8/12/2011 3:00
242.84
8/12/2011 4:00
232.42
8/12/2011 5:00
41.41
8/12/2011 6:00
228.36
8/12/2011 7:00
372.55
8/12/2011 8:00
89.20
8/12/2011 9:00
118.70
8/12/2011 10:00
-35.55
8/12/2011 11:00
-28.00
8/12/2011 12:00
108.13
8/12/2011 13:00
71.03
8/12/2011 14:00
-24.58
8/12/2011 15:00
134.47
8/12/2011 16:00
168.15
8/12/2011 17:00
19.29
8/12/2011 18:00
128.19
8/12/2011 19:00
10.60
8/12/2011 20:00
-21.12
8/12/2011 21:00
-72.62
8/12/2011 22:00
-139.15
8/12/2011 23:00
-145.82
8/13/2011 0:00
-42.15
8/13/2011 1:00
154.15
8/13/2011 2:00
152.15
8/13/2011 3:00
197.00
8/13/2011 4:00
204.56
8/13/2011 5:00
187.96
8/13/2011 6:00
68.11
8/13/2011 7:00
41.85
8/13/2011 8:00
275.34
8/13/2011 9:00
266.24
8/13/2011 10:00
147.51
8/13/2011 11:00
-71.85
8/13/2011 12:00
-125.59
8/13/2011 13:00
-182.96
8/13/2011 14:00
-273.75
8/13/2011 15:00
-111.05
8/13/2011 16:00
-232.30
8/13/2011 17:00
57.04
8/13/2011 18:00
51.97
8/13/2011 19:00
281.99
8/13/2011 20:00
319.99
8/13/2011 21:00
261.20
8/13/2011 22:00
301.87
Docket No. ER11-1844
Exhibit No. NYI-4
Page 304 of 375
8/13/2011 23:00
281.55
8/14/2011 0:00
306.83
8/14/2011 1:00
388.35
8/14/2011 2:00
306.37
8/14/2011 3:00
290.40
8/14/2011 4:00
302.41
8/14/2011 5:00
348.38
8/14/2011 6:00
57.14
8/14/2011 7:00
280.38
8/14/2011 8:00
441.79
8/14/2011 9:00
411.14
8/14/2011 10:00
371.40
8/14/2011 11:00
344.66
8/14/2011 12:00
177.67
8/14/2011 13:00
83.93
8/14/2011 14:00
-16.55
8/14/2011 15:00
-73.14
8/14/2011 16:00
-199.51
8/14/2011 17:00
-23.00
8/14/2011 18:00
162.33
8/14/2011 19:00
194.36
8/14/2011 20:00
290.98
8/14/2011 21:00
269.77
8/14/2011 22:00
378.00
8/14/2011 23:00
313.77
8/15/2011 0:00
105.42
8/15/2011 1:00
117.98
8/15/2011 2:00
163.54
8/15/2011 3:00
189.63
8/15/2011 4:00
299.28
8/15/2011 5:00
537.99
8/15/2011 6:00
405.67
8/15/2011 7:00
390.53
8/15/2011 8:00
304.65
8/15/2011 9:00
178.44
8/15/2011 10:00
254.94
8/15/2011 11:00
193.60
8/15/2011 12:00
140.36
8/15/2011 13:00
69.50
8/15/2011 14:00
-137.61
8/15/2011 15:00
9.86
8/15/2011 16:00
-62.09
8/15/2011 17:00
-250.87
8/15/2011 18:00
12.70
8/15/2011 19:00
131.81
8/15/2011 20:00
152.46
8/15/2011 21:00
94.86
Docket No. ER11-1844
Exhibit No. NYI-4
Page 305 of 375
8/15/2011 22:00
229.35
8/15/2011 23:00
251.73
8/16/2011 0:00
414.82
8/16/2011 1:00
532.01
8/16/2011 2:00
385.89
8/16/2011 3:00
371.34
8/16/2011 4:00
221.96
8/16/2011 5:00
190.23
8/16/2011 6:00
339.44
8/16/2011 7:00
171.95
8/16/2011 8:00
93.87
8/16/2011 9:00
178.81
8/16/2011 10:00
78.64
8/16/2011 11:00
34.59
8/16/2011 12:00
90.05
8/16/2011 13:00
-16.55
8/16/2011 14:00
75.30
8/16/2011 15:00
34.34
8/16/2011 16:00
63.19
8/16/2011 17:00
161.64
8/16/2011 18:00
231.96
8/16/2011 19:00
280.70
8/16/2011 20:00
180.97
8/16/2011 21:00
257.36
8/16/2011 22:00
253.53
8/16/2011 23:00
264.89
8/17/2011 0:00
154.75
8/17/2011 1:00
190.10
8/17/2011 2:00
345.50
8/17/2011 3:00
212.08
8/17/2011 4:00
397.29
8/17/2011 5:00
570.35
8/17/2011 6:00
410.63
8/17/2011 7:00
498.96
8/17/2011 8:00
500.19
8/17/2011 9:00
485.20
8/17/2011 10:00
383.25
8/17/2011 11:00
339.50
8/17/2011 12:00
27.71
8/17/2011 13:00
149.91
8/17/2011 14:00
232.30
8/17/2011 15:00
271.33
8/17/2011 16:00
240.93
8/17/2011 17:00
454.04
8/17/2011 18:00
443.43
8/17/2011 19:00
244.23
8/17/2011 20:00
272.14
Docket No. ER11-1844
Exhibit No. NYI-4
Page 306 of 375
8/17/2011 21:00
99.41
8/17/2011 22:00
68.79
8/17/2011 23:00
-49.36
8/18/2011 0:00
244.12
8/18/2011 1:00
225.69
8/18/2011 2:00
226.89
8/18/2011 3:00
231.79
8/18/2011 4:00
209.38
8/18/2011 5:00
204.07
8/18/2011 6:00
75.24
8/18/2011 7:00
58.99
8/18/2011 8:00
71.16
8/18/2011 9:00
-14.28
8/18/2011 10:00
-225.52
8/18/2011 11:00
-257.38
8/18/2011 12:00
-158.52
8/18/2011 13:00
-53.21
8/18/2011 14:00
27.59
8/18/2011 15:00
-18.87
8/18/2011 16:00
9.42
8/18/2011 17:00
115.51
8/18/2011 18:00
197.80
8/18/2011 19:00
154.62
8/18/2011 20:00
226.36
8/18/2011 21:00
149.42
8/18/2011 22:00
76.76
8/18/2011 23:00
-185.37
8/19/2011 0:00
46.01
8/19/2011 1:00
158.84
8/19/2011 2:00
208.54
8/19/2011 3:00
179.52
8/19/2011 4:00
167.83
8/19/2011 5:00
187.76
8/19/2011 6:00
109.36
8/19/2011 7:00
24.37
8/19/2011 8:00
-183.07
8/19/2011 9:00
-79.93
8/19/2011 10:00
-123.06
8/19/2011 11:00
-308.31
8/19/2011 12:00
-584.35
8/19/2011 13:00
-405.02
8/19/2011 14:00
37.45
8/19/2011 15:00
97.98
8/19/2011 16:00
111.86
8/19/2011 17:00
160.08
8/19/2011 18:00
-291.25
8/19/2011 19:00
-192.44
Docket No. ER11-1844
Exhibit No. NYI-4
Page 307 of 375
8/19/2011 20:00
-87.57
8/19/2011 21:00
-279.93
8/19/2011 22:00
-68.50
8/19/2011 23:00
-169.60
8/20/2011 0:00
-84.13
8/20/2011 1:00
-34.40
8/20/2011 2:00
103.59
8/20/2011 3:00
134.23
8/20/2011 4:00
69.98
8/20/2011 5:00
73.91
8/20/2011 6:00
-36.08
8/20/2011 7:00
-150.30
8/20/2011 8:00
-141.50
8/20/2011 9:00
-251.26
8/20/2011 10:00
-249.93
8/20/2011 11:00
-271.21
8/20/2011 12:00
-354.14
8/20/2011 13:00
-198.16
8/20/2011 14:00
42.10
8/20/2011 15:00
133.02
8/20/2011 16:00
150.29
8/20/2011 17:00
334.82
8/20/2011 18:00
309.55
8/20/2011 19:00
204.74
8/20/2011 20:00
333.18
8/20/2011 21:00
141.82
8/20/2011 22:00
386.38
8/20/2011 23:00
245.65
8/21/2011 0:00
39.92
8/21/2011 1:00
114.56
8/21/2011 2:00
78.59
8/21/2011 3:00
70.13
8/21/2011 4:00
101.54
8/21/2011 5:00
141.44
8/21/2011 6:00
244.33
8/21/2011 7:00
290.54
8/21/2011 8:00
249.07
8/21/2011 9:00
213.30
8/21/2011 10:00
229.46
8/21/2011 11:00
141.84
8/21/2011 12:00
282.62
8/21/2011 13:00
293.19
8/21/2011 14:00
455.69
8/21/2011 15:00
417.60
8/21/2011 16:00
305.94
8/21/2011 17:00
330.21
8/21/2011 18:00
137.17
Docket No. ER11-1844
Exhibit No. NYI-4
Page 308 of 375
8/21/2011 19:00
404.84
8/21/2011 20:00
207.63
8/21/2011 21:00
196.26
8/21/2011 22:00
208.20
8/21/2011 23:00
142.82
8/22/2011 0:00
252.45
8/22/2011 1:00
84.29
8/22/2011 2:00
90.76
8/22/2011 3:00
181.72
8/22/2011 4:00
192.26
8/22/2011 5:00
242.77
8/22/2011 6:00
178.26
8/22/2011 7:00
199.16
8/22/2011 8:00
221.24
8/22/2011 9:00
93.02
8/22/2011 10:00
214.48
8/22/2011 11:00
164.88
8/22/2011 12:00
119.88
8/22/2011 13:00
175.66
8/22/2011 14:00
190.44
8/22/2011 15:00
273.44
8/22/2011 16:00
307.73
8/22/2011 17:00
326.55
8/22/2011 18:00
360.92
8/22/2011 19:00
372.29
8/22/2011 20:00
345.04
8/22/2011 21:00
178.09
8/22/2011 22:00
199.87
8/22/2011 23:00
53.43
8/23/2011 0:00
127.47
8/23/2011 1:00
37.20
8/23/2011 2:00
-53.81
8/23/2011 3:00
52.72
8/23/2011 4:00
100.24
8/23/2011 5:00
34.24
8/23/2011 6:00
199.04
8/23/2011 7:00
118.04
8/23/2011 8:00
13.78
8/23/2011 9:00
-73.51
8/23/2011 10:00
-13.57
8/23/2011 11:00
8.50
8/23/2011 12:00
-38.39
8/23/2011 13:00
140.92
8/23/2011 14:00
94.12
8/23/2011 15:00
481.20
8/23/2011 16:00
578.81
8/23/2011 17:00
501.70
Docket No. ER11-1844
Exhibit No. NYI-4
Page 309 of 375
8/23/2011 18:00
487.30
8/23/2011 19:00
638.53
8/23/2011 20:00
535.91
8/23/2011 21:00
411.15
8/23/2011 22:00
408.27
8/23/2011 23:00
244.42
8/24/2011 0:00
101.75
8/24/2011 1:00
238.13
8/24/2011 2:00
79.61
8/24/2011 3:00
-61.23
8/24/2011 4:00
-121.15
8/24/2011 5:00
-227.02
8/24/2011 6:00
-201.65
8/24/2011 7:00
-11.21
8/24/2011 8:00
-89.58
8/24/2011 9:00
-265.27
8/24/2011 10:00
-192.55
8/24/2011 11:00
-265.82
8/24/2011 12:00
-170.80
8/24/2011 13:00
-178.13
8/24/2011 14:00
-140.26
8/24/2011 15:00
-43.45
8/24/2011 16:00
-341.60
8/24/2011 17:00
-12.97
8/24/2011 18:00
354.74
8/24/2011 19:00
158.78
8/24/2011 20:00
73.74
8/24/2011 21:00
201.28
8/24/2011 22:00
206.63
8/24/2011 23:00
95.83
8/25/2011 0:00
-94.63
8/25/2011 1:00
-133.31
8/25/2011 2:00
-20.62
8/25/2011 3:00
-42.97
8/25/2011 4:00
-7.61
8/25/2011 5:00
79.88
8/25/2011 6:00
-67.83
8/25/2011 7:00
-9.49
8/25/2011 8:00
282.05
8/25/2011 9:00
179.48
8/25/2011 10:00
267.95
8/25/2011 11:00
452.27
8/25/2011 12:00
456.80
8/25/2011 13:00
347.60
8/25/2011 14:00
747.11
8/25/2011 15:00
669.41
8/25/2011 16:00
561.52
Docket No. ER11-1844
Exhibit No. NYI-4
Page 310 of 375
8/25/2011 17:00
604.97
8/25/2011 18:00
-50.86
8/25/2011 19:00
338.60
8/25/2011 20:00
508.88
8/25/2011 21:00
418.59
8/25/2011 22:00
332.63
8/25/2011 23:00
298.69
8/26/2011 0:00
319.57
8/26/2011 1:00
277.89
8/26/2011 2:00
272.72
8/26/2011 3:00
134.15
8/26/2011 4:00
182.29
8/26/2011 5:00
281.50
8/26/2011 6:00
116.48
8/26/2011 7:00
60.77
8/26/2011 8:00
119.83
8/26/2011 9:00
199.93
8/26/2011 10:00
-0.50
8/26/2011 11:00
17.39
8/26/2011 12:00
-170.19
8/26/2011 13:00
-100.07
8/26/2011 14:00
-142.38
8/26/2011 15:00
259.00
8/26/2011 16:00
467.90
8/26/2011 17:00
562.47
8/26/2011 18:00
293.13
8/26/2011 19:00
371.64
8/26/2011 20:00
350.71
8/26/2011 21:00
272.50
8/26/2011 22:00
418.92
8/26/2011 23:00
168.60
8/27/2011 0:00
126.94
8/27/2011 1:00
78.93
8/27/2011 2:00
153.47
8/27/2011 3:00
29.47
8/27/2011 4:00
112.13
8/27/2011 5:00
86.71
8/27/2011 6:00
264.44
8/27/2011 7:00
33.49
8/27/2011 8:00
184.74
8/27/2011 9:00
33.30
8/27/2011 10:00
11.60
8/27/2011 11:00
-254.81
8/27/2011 12:00
-438.88
8/27/2011 13:00
-469.19
8/27/2011 14:00
-463.50
8/27/2011 15:00
-552.96
Docket No. ER11-1844
Exhibit No. NYI-4
Page 311 of 375
8/27/2011 16:00
-379.24
8/27/2011 17:00
-354.46
8/27/2011 18:00
-187.94
8/27/2011 19:00
-60.10
8/27/2011 20:00
39.91
8/27/2011 21:00
-31.24
8/27/2011 22:00
-12.95
8/27/2011 23:00
-96.16
8/28/2011 0:00
-141.54
8/28/2011 1:00
-233.86
8/28/2011 2:00
-346.64
8/28/2011 3:00
-341.16
8/28/2011 4:00
-180.63
8/28/2011 5:00
-144.98
8/28/2011 6:00
-146.62
8/28/2011 7:00
-11.13
8/28/2011 8:00
199.05
8/28/2011 9:00
422.89
8/28/2011 10:00
374.29
8/28/2011 11:00
261.26
8/28/2011 12:00
219.76
8/28/2011 13:00
106.29
8/28/2011 14:00
110.22
8/28/2011 15:00
230.80
8/28/2011 16:00
307.26
8/28/2011 17:00
168.43
8/28/2011 18:00
393.43
8/28/2011 19:00
458.26
8/28/2011 20:00
293.98
8/28/2011 21:00
449.40
8/28/2011 22:00
309.89
8/28/2011 23:00
340.74
8/29/2011 0:00
237.34
8/29/2011 1:00
271.73
8/29/2011 2:00
316.40
8/29/2011 3:00
415.18
8/29/2011 4:00
593.62
8/29/2011 5:00
568.62
8/29/2011 6:00
627.20
8/29/2011 7:00
701.83
8/29/2011 8:00
458.86
8/29/2011 9:00
157.91
8/29/2011 10:00
66.00
8/29/2011 11:00
57.01
8/29/2011 12:00
-119.17
8/29/2011 13:00
-279.62
8/29/2011 14:00
-108.85
Docket No. ER11-1844
Exhibit No. NYI-4
Page 312 of 375
8/29/2011 15:00
9.60
8/29/2011 16:00
224.07
8/29/2011 17:00
179.83
8/29/2011 18:00
161.98
8/29/2011 19:00
347.42
8/29/2011 20:00
253.65
8/29/2011 21:00
323.30
8/29/2011 22:00
203.37
8/29/2011 23:00
131.24
8/30/2011 0:00
347.81
8/30/2011 1:00
411.12
8/30/2011 2:00
349.21
8/30/2011 3:00
299.63
8/30/2011 4:00
296.77
8/30/2011 5:00
240.35
8/30/2011 6:00
75.82
8/30/2011 7:00
35.68
8/30/2011 8:00
116.47
8/30/2011 9:00
-39.60
8/30/2011 10:00
-221.19
8/30/2011 11:00
-281.78
8/30/2011 12:00
-338.22
8/30/2011 13:00
-407.79
8/30/2011 14:00
-278.25
8/30/2011 15:00
-187.48
8/30/2011 16:00
-134.77
8/30/2011 17:00
5.75
8/30/2011 18:00
2.98
8/30/2011 19:00
43.59
8/30/2011 20:00
87.88
8/30/2011 21:00
56.28
8/30/2011 22:00
134.19
8/30/2011 23:00
74.22
8/31/2011 0:00
329.51
8/31/2011 1:00
433.98
8/31/2011 2:00
283.62
8/31/2011 3:00
268.48
8/31/2011 4:00
308.25
8/31/2011 5:00
385.17
8/31/2011 6:00
244.75
8/31/2011 7:00
213.14
8/31/2011 8:00
256.03
8/31/2011 9:00
84.92
8/31/2011 10:00
84.71
8/31/2011 11:00
-64.37
8/31/2011 12:00
-221.74
8/31/2011 13:00
-41.55
Docket No. ER11-1844
Exhibit No. NYI-4
Page 313 of 375
8/31/2011 14:00
-6.66
8/31/2011 15:00
26.27
8/31/2011 16:00
49.16
8/31/2011 17:00
114.72
8/31/2011 18:00
-28.83
8/31/2011 19:00
-210.43
8/31/2011 20:00
-178.10
8/31/2011 21:00
-60.88
8/31/2011 22:00
110.11
8/31/2011 23:00
69.59
9/1/2011 0:00
111.89
9/1/2011 1:00
33.22
9/1/2011 2:00
10.36
9/1/2011 3:00
-1.09
9/1/2011 4:00
-158.11
9/1/2011 5:00
27.60
9/1/2011 6:00
0.84
9/1/2011 7:00
78.90
9/1/2011 8:00
42.40
9/1/2011 9:00
-231.12
9/1/2011 10:00
-293.09
9/1/2011 11:00
-435.08
9/1/2011 12:00
-335.96
9/1/2011 13:00
-373.90
9/1/2011 14:00
-629.07
9/1/2011 15:00
-724.10
9/1/2011 16:00
-627.27
9/1/2011 17:00
-366.56
9/1/2011 18:00
-269.35
9/1/2011 19:00
-101.94
9/1/2011 20:00
-372.39
9/1/2011 21:00
-478.96
9/1/2011 22:00
-348.84
9/1/2011 23:00
-381.59
9/2/2011 0:00
51.42
9/2/2011 1:00
-25.38
9/2/2011 2:00
-28.39
9/2/2011 3:00
-31.91
9/2/2011 4:00
21.36
9/2/2011 5:00
-12.86
9/2/2011 6:00
-113.73
9/2/2011 7:00
33.28
9/2/2011 8:00
-72.31
9/2/2011 9:00
-158.93
9/2/2011 10:00
-225.25
9/2/2011 11:00
-126.10
9/2/2011 12:00
-176.01
Docket No. ER11-1844
Exhibit No. NYI-4
Page 314 of 375
9/2/2011 13:00
-233.78
9/2/2011 14:00
-242.68
9/2/2011 15:00
-268.28
9/2/2011 16:00
-110.25
9/2/2011 17:00
20.53
9/2/2011 18:00
225.57
9/2/2011 19:00
224.53
9/2/2011 20:00
-65.44
9/2/2011 21:00
-107.74
9/2/2011 22:00
-29.03
9/2/2011 23:00
311.48
9/3/2011 0:00
239.97
9/3/2011 1:00
184.70
9/3/2011 2:00
88.66
9/3/2011 3:00
156.43
9/3/2011 4:00
228.26
9/3/2011 5:00
309.77
9/3/2011 6:00
229.71
9/3/2011 7:00
362.48
9/3/2011 8:00
56.35
9/3/2011 9:00
17.40
9/3/2011 10:00
-269.78
9/3/2011 11:00
-346.40
9/3/2011 12:00
-460.07
9/3/2011 13:00
-505.69
9/3/2011 14:00
-452.96
9/3/2011 15:00
-108.53
9/3/2011 16:00
11.02
9/3/2011 17:00
30.54
9/3/2011 18:00
156.89
9/3/2011 19:00
89.01
9/3/2011 20:00
184.66
9/3/2011 21:00
327.85
9/3/2011 22:00
307.06
9/3/2011 23:00
380.61
9/4/2011 0:00
234.45
9/4/2011 1:00
78.75
9/4/2011 2:00
122.51
9/4/2011 3:00
30.28
9/4/2011 4:00
77.38
9/4/2011 5:00
12.31
9/4/2011 6:00
-55.85
9/4/2011 7:00
-48.07
9/4/2011 8:00
156.23
9/4/2011 9:00
109.23
9/4/2011 10:00
40.79
9/4/2011 11:00
-10.42
Docket No. ER11-1844
Exhibit No. NYI-4
Page 315 of 375
9/4/2011 12:00
148.74
9/4/2011 13:00
271.98
9/4/2011 14:00
460.53
9/4/2011 15:00
462.83
9/4/2011 16:00
427.26
9/4/2011 17:00
366.37
9/4/2011 18:00
356.00
9/4/2011 19:00
540.24
9/4/2011 20:00
414.16
9/4/2011 21:00
340.63
9/4/2011 22:00
506.03
9/4/2011 23:00
511.95
9/5/2011 0:00
641.74
9/5/2011 1:00
436.33
9/5/2011 2:00
302.05
9/5/2011 3:00
402.64
9/5/2011 4:00
504.56
9/5/2011 5:00
538.04
9/5/2011 6:00
308.68
9/5/2011 7:00
357.93
9/5/2011 8:00
368.98
9/5/2011 9:00
608.76
9/5/2011 10:00
514.54
9/5/2011 11:00
403.50
9/5/2011 12:00
361.14
9/5/2011 13:00
303.16
9/5/2011 14:00
274.05
9/5/2011 15:00
197.92
9/5/2011 16:00
25.63
9/5/2011 17:00
19.43
9/5/2011 18:00
144.81
9/5/2011 19:00
351.68
9/5/2011 20:00
335.69
9/5/2011 21:00
267.51
9/5/2011 22:00
393.09
9/5/2011 23:00
367.32
9/6/2011 0:00
559.70
9/6/2011 1:00
384.86
9/6/2011 2:00
389.59
9/6/2011 3:00
218.29
9/6/2011 4:00
499.42
9/6/2011 5:00
196.82
9/6/2011 6:00
64.26
9/6/2011 7:00
-27.33
9/6/2011 8:00
20.98
9/6/2011 9:00
85.83
9/6/2011 10:00
7.22
Docket No. ER11-1844
Exhibit No. NYI-4
Page 316 of 375
9/6/2011 11:00
-19.14
9/6/2011 12:00
-114.44
9/6/2011 13:00
-109.65
9/6/2011 14:00
-211.65
9/6/2011 15:00
-186.78
9/6/2011 16:00
-185.01
9/6/2011 17:00
-260.56
9/6/2011 18:00
-83.28
9/6/2011 19:00
-53.55
9/6/2011 20:00
-175.72
9/6/2011 21:00
50.41
9/6/2011 22:00
189.97
9/6/2011 23:00
357.38
9/7/2011 0:00
444.42
9/7/2011 1:00
175.14
9/7/2011 2:00
55.64
9/7/2011 3:00
254.31
9/7/2011 4:00
104.30
9/7/2011 5:00
290.39
9/7/2011 6:00
308.04
9/7/2011 7:00
191.08
9/7/2011 8:00
152.01
9/7/2011 9:00
-185.64
9/7/2011 10:00
-361.67
9/7/2011 11:00
-194.23
9/7/2011 12:00
-49.72
9/7/2011 13:00
307.18
9/7/2011 14:00
306.31
9/7/2011 15:00
434.66
9/7/2011 16:00
387.40
9/7/2011 17:00
283.18
9/7/2011 18:00
245.60
9/7/2011 19:00
246.01
9/7/2011 20:00
150.65
9/7/2011 21:00
250.30
9/7/2011 22:00
523.30
9/7/2011 23:00
331.11
9/8/2011 0:00
441.15
9/8/2011 1:00
449.61
9/8/2011 2:00
314.42
9/8/2011 3:00
290.61
9/8/2011 4:00
363.21
9/8/2011 5:00
464.20
9/8/2011 6:00
335.21
9/8/2011 7:00
115.81
9/8/2011 8:00
78.79
9/8/2011 9:00
80.03
Docket No. ER11-1844
Exhibit No. NYI-4
Page 317 of 375
9/8/2011 10:00
147.63
9/8/2011 11:00
72.96
9/8/2011 12:00
120.94
9/8/2011 13:00
57.59
9/8/2011 14:00
-27.58
9/8/2011 15:00
73.48
9/8/2011 16:00
118.68
9/8/2011 17:00
104.01
9/8/2011 18:00
236.73
9/8/2011 19:00
163.88
9/8/2011 20:00
-14.65
9/8/2011 21:00
88.88
9/8/2011 22:00
425.18
9/8/2011 23:00
378.88
9/9/2011 0:00
327.22
9/9/2011 1:00
199.99
9/9/2011 2:00
45.56
9/9/2011 3:00
-1.29
9/9/2011 4:00
-22.21
9/9/2011 5:00
-2.51
9/9/2011 6:00
146.57
9/9/2011 7:00
46.44
9/9/2011 8:00
100.95
9/9/2011 9:00
-90.70
9/9/2011 10:00
-105.00
9/9/2011 11:00
143.52
9/9/2011 12:00
141.08
9/9/2011 13:00
186.70
9/9/2011 14:00
375.03
9/9/2011 15:00
406.34
9/9/2011 16:00
304.28
9/9/2011 17:00
262.92
9/9/2011 18:00
270.48
9/9/2011 19:00
255.82
9/9/2011 20:00
201.77
9/9/2011 21:00
187.67
9/9/2011 22:00
316.44
9/9/2011 23:00
231.46
9/10/2011 0:00
391.44
9/10/2011 1:00
481.92
9/10/2011 2:00
479.02
9/10/2011 3:00
457.55
9/10/2011 4:00
368.38
9/10/2011 5:00
300.40
9/10/2011 6:00
289.13
9/10/2011 7:00
343.98
9/10/2011 8:00
254.82
Docket No. ER11-1844
Exhibit No. NYI-4
Page 318 of 375
9/10/2011 9:00
446.33
9/10/2011 10:00
282.49
9/10/2011 11:00
163.62
9/10/2011 12:00
169.10
9/10/2011 13:00
166.08
9/10/2011 14:00
216.71
9/10/2011 15:00
138.85
9/10/2011 16:00
50.60
9/10/2011 17:00
136.32
9/10/2011 18:00
74.27
9/10/2011 19:00
281.05
9/10/2011 20:00
162.68
9/10/2011 21:00
146.84
9/10/2011 22:00
451.38
9/10/2011 23:00
459.20
9/11/2011 0:00
468.75
9/11/2011 1:00
420.81
9/11/2011 2:00
437.74
9/11/2011 3:00
368.89
9/11/2011 4:00
373.25
9/11/2011 5:00
323.60
9/11/2011 6:00
332.04
9/11/2011 7:00
366.16
9/11/2011 8:00
345.57
9/11/2011 9:00
206.15
9/11/2011 10:00
141.38
9/11/2011 11:00
115.87
9/11/2011 12:00
33.09
9/11/2011 13:00
91.41
9/11/2011 14:00
-11.26
9/11/2011 15:00
-67.06
9/11/2011 16:00
-111.26
9/11/2011 17:00
-4.40
9/11/2011 18:00
59.62
9/11/2011 19:00
59.14
9/11/2011 20:00
136.24
9/11/2011 21:00
-24.64
9/11/2011 22:00
83.31
9/11/2011 23:00
91.30
9/12/2011 0:00
305.54
9/12/2011 1:00
89.78
9/12/2011 2:00
79.81
9/12/2011 3:00
-90.96
9/12/2011 4:00
-70.47
9/12/2011 5:00
164.98
9/12/2011 6:00
103.07
9/12/2011 7:00
31.73
Docket No. ER11-1844
Exhibit No. NYI-4
Page 319 of 375
9/12/2011 8:00
-130.64
9/12/2011 9:00
-111.09
9/12/2011 10:00
-145.38
9/12/2011 11:00
117.97
9/12/2011 12:00
82.26
9/12/2011 13:00
-1.18
9/12/2011 14:00
-180.62
9/12/2011 15:00
-153.67
9/12/2011 16:00
13.39
9/12/2011 17:00
-20.59
9/12/2011 18:00
336.86
9/12/2011 19:00
378.26
9/12/2011 20:00
362.68
9/12/2011 21:00
177.86
9/12/2011 22:00
207.98
9/12/2011 23:00
382.83
9/13/2011 0:00
667.32
9/13/2011 1:00
574.64
9/13/2011 2:00
395.19
9/13/2011 3:00
241.92
9/13/2011 4:00
50.46
9/13/2011 5:00
-55.76
9/13/2011 6:00
-95.79
9/13/2011 7:00
124.88
9/13/2011 8:00
143.04
9/13/2011 9:00
-79.77
9/13/2011 10:00
-179.36
9/13/2011 11:00
-10.30
9/13/2011 12:00
136.01
9/13/2011 13:00
-120.18
9/13/2011 14:00
31.88
9/13/2011 15:00
57.54
9/13/2011 16:00
143.56
9/13/2011 17:00
380.45
9/13/2011 18:00
373.32
9/13/2011 19:00
410.95
9/13/2011 20:00
91.41
9/13/2011 21:00
282.01
9/13/2011 22:00
346.36
9/13/2011 23:00
153.94
9/14/2011 0:00
311.91
9/14/2011 1:00
448.97
9/14/2011 2:00
359.42
9/14/2011 3:00
131.21
9/14/2011 4:00
33.91
9/14/2011 5:00
-59.37
9/14/2011 6:00
-56.70
Docket No. ER11-1844
Exhibit No. NYI-4
Page 320 of 375
9/14/2011 7:00
43.85
9/14/2011 8:00
114.72
9/14/2011 9:00
158.35
9/14/2011 10:00
277.89
9/14/2011 11:00
397.97
9/14/2011 12:00
398.92
9/14/2011 13:00
289.96
9/14/2011 14:00
328.80
9/14/2011 15:00
301.59
9/14/2011 16:00
351.18
9/14/2011 17:00
405.71
9/14/2011 18:00
408.00
9/14/2011 19:00
737.15
9/14/2011 20:00
671.85
9/14/2011 21:00
528.71
9/14/2011 22:00
646.32
9/14/2011 23:00
338.62
9/15/2011 0:00
506.70
9/15/2011 1:00
245.21
9/15/2011 2:00
175.26
9/15/2011 3:00
167.40
9/15/2011 4:00
281.36
9/15/2011 5:00
146.75
9/15/2011 6:00
86.35
9/15/2011 7:00
221.57
9/15/2011 8:00
153.65
9/15/2011 9:00
68.56
9/15/2011 10:00
340.76
9/15/2011 11:00
438.25
9/15/2011 12:00
214.78
9/15/2011 13:00
9.20
9/15/2011 14:00
11.30
9/15/2011 15:00
-59.31
9/15/2011 16:00
-55.79
9/15/2011 17:00
-12.96
9/15/2011 18:00
138.82
9/15/2011 19:00
186.03
9/15/2011 20:00
191.94
9/15/2011 21:00
106.65
9/15/2011 22:00
329.64
9/15/2011 23:00
243.62
9/16/2011 0:00
371.90
9/16/2011 1:00
334.07
9/16/2011 2:00
361.85
9/16/2011 3:00
300.66
9/16/2011 4:00
168.26
9/16/2011 5:00
212.84
Docket No. ER11-1844
Exhibit No. NYI-4
Page 321 of 375
9/16/2011 6:00
173.93
9/16/2011 7:00
112.97
9/16/2011 8:00
131.41
9/16/2011 9:00
195.72
9/16/2011 10:00
150.86
9/16/2011 11:00
137.05
9/16/2011 12:00
118.26
9/16/2011 13:00
54.68
9/16/2011 14:00
91.36
9/16/2011 15:00
220.45
9/16/2011 16:00
128.50
9/16/2011 17:00
224.14
9/16/2011 18:00
305.95
9/16/2011 19:00
519.49
9/16/2011 20:00
256.83
9/16/2011 21:00
354.84
9/16/2011 22:00
594.74
9/16/2011 23:00
429.63
9/17/2011 0:00
403.27
9/17/2011 1:00
376.17
9/17/2011 2:00
503.58
9/17/2011 3:00
417.19
9/17/2011 4:00
495.31
9/17/2011 5:00
338.99
9/17/2011 6:00
291.77
9/17/2011 7:00
294.89
9/17/2011 8:00
255.97
9/17/2011 9:00
168.46
9/17/2011 10:00
86.08
9/17/2011 11:00
20.10
9/17/2011 12:00
85.15
9/17/2011 13:00
77.61
9/17/2011 14:00
337.91
9/17/2011 15:00
321.56
9/17/2011 16:00
298.06
9/17/2011 17:00
202.95
9/17/2011 18:00
548.81
9/17/2011 19:00
462.37
9/17/2011 20:00
440.08
9/17/2011 21:00
322.57
9/17/2011 22:00
540.85
9/17/2011 23:00
358.74
9/18/2011 0:00
474.17
9/18/2011 1:00
358.48
9/18/2011 2:00
434.26
9/18/2011 3:00
420.82
9/18/2011 4:00
441.11
Docket No. ER11-1844
Exhibit No. NYI-4
Page 322 of 375
9/18/2011 5:00
306.22
9/18/2011 6:00
254.28
9/18/2011 7:00
356.75
9/18/2011 8:00
484.45
9/18/2011 9:00
359.05
9/18/2011 10:00
196.49
9/18/2011 11:00
177.61
9/18/2011 12:00
133.86
9/18/2011 13:00
78.01
9/18/2011 14:00
102.72
9/18/2011 15:00
57.75
9/18/2011 16:00
118.15
9/18/2011 17:00
131.63
9/18/2011 18:00
147.46
9/18/2011 19:00
64.94
9/18/2011 20:00
135.67
9/18/2011 21:00
131.17
9/18/2011 22:00
340.26
9/18/2011 23:00
267.61
9/19/2011 0:00
398.61
9/19/2011 1:00
262.33
9/19/2011 2:00
179.39
9/19/2011 3:00
180.45
9/19/2011 4:00
267.66
9/19/2011 5:00
212.64
9/19/2011 6:00
149.61
9/19/2011 7:00
357.83
9/19/2011 8:00
339.73
9/19/2011 9:00
190.06
9/19/2011 10:00
249.02
9/19/2011 11:00
307.64
9/19/2011 12:00
173.54
9/19/2011 13:00
142.32
9/19/2011 14:00
99.33
9/19/2011 15:00
66.77
9/19/2011 16:00
114.89
9/19/2011 17:00
11.17
9/19/2011 18:00
86.61
9/19/2011 19:00
102.38
9/19/2011 20:00
70.24
9/19/2011 21:00
-111.96
9/19/2011 22:00
181.28
9/19/2011 23:00
55.31
9/20/2011 0:00
308.58
9/20/2011 1:00
259.91
9/20/2011 2:00
188.69
9/20/2011 3:00
119.93
Docket No. ER11-1844
Exhibit No. NYI-4
Page 323 of 375
9/20/2011 4:00
181.29
9/20/2011 5:00
250.10
9/20/2011 6:00
91.14
9/20/2011 7:00
54.28
9/20/2011 8:00
138.81
9/20/2011 9:00
9.40
9/20/2011 10:00
31.99
9/20/2011 11:00
60.34
9/20/2011 12:00
-12.05
9/20/2011 13:00
-164.65
9/20/2011 14:00
-44.21
9/20/2011 15:00
-85.59
9/20/2011 16:00
-184.16
9/20/2011 17:00
-113.29
9/20/2011 18:00
64.54
9/20/2011 19:00
-27.95
9/20/2011 20:00
-148.59
9/20/2011 21:00
-130.69
9/20/2011 22:00
201.38
9/20/2011 23:00
224.82
9/21/2011 0:00
317.35
9/21/2011 1:00
325.77
9/21/2011 2:00
216.20
9/21/2011 3:00
34.49
9/21/2011 4:00
44.69
9/21/2011 5:00
26.98
9/21/2011 6:00
27.48
9/21/2011 7:00
95.63
9/21/2011 8:00
23.22
9/21/2011 9:00
-57.71
9/21/2011 10:00
-107.90
9/21/2011 11:00
-162.85
9/21/2011 12:00
-232.63
9/21/2011 13:00
-242.59
9/21/2011 14:00
-316.18
9/21/2011 15:00
-311.97
9/21/2011 16:00
-266.18
9/21/2011 17:00
-271.18
9/21/2011 18:00
-148.47
9/21/2011 19:00
-148.96
9/21/2011 20:00
-103.00
9/21/2011 21:00
-59.00
9/21/2011 22:00
186.57
9/21/2011 23:00
148.88
9/22/2011 0:00
439.68
9/22/2011 1:00
188.76
9/22/2011 2:00
29.18
Docket No. ER11-1844
Exhibit No. NYI-4
Page 324 of 375
9/22/2011 3:00
223.52
9/22/2011 4:00
307.33
9/22/2011 5:00
376.82
9/22/2011 6:00
239.43
9/22/2011 7:00
159.74
9/22/2011 8:00
112.34
9/22/2011 9:00
168.26
9/22/2011 10:00
412.83
9/22/2011 11:00
204.08
9/22/2011 12:00
243.63
9/22/2011 13:00
419.09
9/22/2011 14:00
280.02
9/22/2011 15:00
127.06
9/22/2011 16:00
287.37
9/22/2011 17:00
296.00
9/22/2011 18:00
366.70
9/22/2011 19:00
433.60
9/22/2011 20:00
634.61
9/22/2011 21:00
639.95
9/22/2011 22:00
439.10
9/22/2011 23:00
439.73
9/23/2011 0:00
418.37
9/23/2011 1:00
397.05
9/23/2011 2:00
359.32
9/23/2011 3:00
421.82
9/23/2011 4:00
319.66
9/23/2011 5:00
-45.39
9/23/2011 6:00
164.78
9/23/2011 7:00
144.52
9/23/2011 8:00
138.95
9/23/2011 9:00
181.09
9/23/2011 10:00
269.18
9/23/2011 11:00
130.98
9/23/2011 12:00
273.72
9/23/2011 13:00
198.96
9/23/2011 14:00
262.11
9/23/2011 15:00
230.76
9/23/2011 16:00
169.63
9/23/2011 17:00
170.36
9/23/2011 18:00
285.79
9/23/2011 19:00
191.43
9/23/2011 20:00
302.66
9/23/2011 21:00
395.32
9/23/2011 22:00
695.56
9/23/2011 23:00
683.78
9/24/2011 0:00
561.81
9/24/2011 1:00
270.78
Docket No. ER11-1844
Exhibit No. NYI-4
Page 325 of 375
9/24/2011 2:00
259.04
9/24/2011 3:00
248.64
9/24/2011 4:00
174.66
9/24/2011 5:00
170.26
9/24/2011 6:00
253.06
9/24/2011 7:00
406.23
9/24/2011 8:00
333.18
9/24/2011 9:00
173.58
9/24/2011 10:00
127.60
9/24/2011 11:00
87.19
9/24/2011 12:00
101.87
9/24/2011 13:00
120.69
9/24/2011 14:00
-90.58
9/24/2011 15:00
78.57
9/24/2011 16:00
140.20
9/24/2011 17:00
96.57
9/24/2011 18:00
224.19
9/24/2011 19:00
57.76
9/24/2011 20:00
336.70
9/24/2011 21:00
198.35
9/24/2011 22:00
248.67
9/24/2011 23:00
93.85
9/25/2011 0:00
266.67
9/25/2011 1:00
265.78
9/25/2011 2:00
339.94
9/25/2011 3:00
449.44
9/25/2011 4:00
472.65
9/25/2011 5:00
392.36
9/25/2011 6:00
317.82
9/25/2011 7:00
416.02
9/25/2011 8:00
196.93
9/25/2011 9:00
274.14
9/25/2011 10:00
280.13
9/25/2011 11:00
286.42
9/25/2011 12:00
112.70
9/25/2011 13:00
89.34
9/25/2011 14:00
212.27
9/25/2011 15:00
35.37
9/25/2011 16:00
-137.31
9/25/2011 17:00
-47.18
9/25/2011 18:00
36.85
9/25/2011 19:00
15.43
9/25/2011 20:00
101.62
9/25/2011 21:00
184.31
9/25/2011 22:00
319.87
9/25/2011 23:00
307.87
9/26/2011 0:00
330.62
Docket No. ER11-1844
Exhibit No. NYI-4
Page 326 of 375
9/26/2011 1:00
80.69
9/26/2011 2:00
282.17
9/26/2011 3:00
81.99
9/26/2011 4:00
37.15
9/26/2011 5:00
-39.49
9/26/2011 6:00
-28.77
9/26/2011 7:00
-27.75
9/26/2011 8:00
9.45
9/26/2011 9:00
-38.58
9/26/2011 10:00
-60.37
9/26/2011 11:00
150.25
9/26/2011 12:00
239.70
9/26/2011 13:00
129.17
9/26/2011 14:00
106.87
9/26/2011 15:00
278.91
9/26/2011 16:00
35.05
9/26/2011 17:00
193.94
9/26/2011 18:00
21.65
9/26/2011 19:00
110.04
9/26/2011 20:00
176.03
9/26/2011 21:00
130.97
9/26/2011 22:00
148.71
9/26/2011 23:00
289.87
9/27/2011 0:00
321.51
9/27/2011 1:00
154.89
9/27/2011 2:00
306.27
9/27/2011 3:00
329.95
9/27/2011 4:00
257.71
9/27/2011 5:00
111.06
9/27/2011 6:00
179.21
9/27/2011 7:00
-73.02
9/27/2011 8:00
36.74
9/27/2011 9:00
-40.76
9/27/2011 10:00
-101.09
9/27/2011 11:00
120.43
9/27/2011 12:00
41.68
9/27/2011 13:00
-116.62
9/27/2011 14:00
-260.66
9/27/2011 15:00
-261.48
9/27/2011 16:00
-121.55
9/27/2011 17:00
-126.54
9/27/2011 18:00
-96.89
9/27/2011 19:00
-38.82
9/27/2011 20:00
-166.65
9/27/2011 21:00
-177.49
9/27/2011 22:00
-91.79
9/27/2011 23:00
-61.45
Docket No. ER11-1844
Exhibit No. NYI-4
Page 327 of 375
9/28/2011 0:00
260.05
9/28/2011 1:00
252.37
9/28/2011 2:00
-129.28
9/28/2011 3:00
-132.07
9/28/2011 4:00
72.21
9/28/2011 5:00
-9.76
9/28/2011 6:00
-126.58
9/28/2011 7:00
-289.29
9/28/2011 8:00
-183.56
9/28/2011 9:00
-419.45
9/28/2011 10:00
-375.34
9/28/2011 11:00
-426.40
9/28/2011 12:00
-239.43
9/28/2011 13:00
-370.49
9/28/2011 14:00
-329.97
9/28/2011 15:00
-294.85
9/28/2011 16:00
-165.05
9/28/2011 17:00
-32.40
9/28/2011 18:00
24.96
9/28/2011 19:00
-175.67
9/28/2011 20:00
-166.26
9/28/2011 21:00
-91.64
9/28/2011 22:00
145.58
9/28/2011 23:00
139.94
9/29/2011 0:00
114.16
9/29/2011 1:00
201.17
9/29/2011 2:00
-89.59
9/29/2011 3:00
-135.01
9/29/2011 4:00
-153.44
9/29/2011 5:00
-39.04
9/29/2011 6:00
-124.48
9/29/2011 7:00
-219.48
9/29/2011 8:00
-304.37
9/29/2011 9:00
-357.71
9/29/2011 10:00
-459.99
9/29/2011 11:00
-542.87
9/29/2011 12:00
-549.45
9/29/2011 13:00
-414.37
9/29/2011 14:00
-300.07
9/29/2011 15:00
-231.37
9/29/2011 16:00
-381.01
9/29/2011 17:00
-323.07
9/29/2011 18:00
-314.51
9/29/2011 19:00
-294.54
9/29/2011 20:00
-335.35
9/29/2011 21:00
-208.39
9/29/2011 22:00
-107.09
Docket No. ER11-1844
Exhibit No. NYI-4
Page 328 of 375
9/29/2011 23:00
-94.73
9/30/2011 0:00
67.95
9/30/2011 1:00
133.81
9/30/2011 2:00
-62.25
9/30/2011 3:00
-159.91
9/30/2011 4:00
-236.75
9/30/2011 5:00
-353.79
9/30/2011 6:00
-355.69
9/30/2011 7:00
-293.06
9/30/2011 8:00
-221.72
9/30/2011 9:00
-41.32
9/30/2011 10:00
-11.70
9/30/2011 11:00
-78.27
9/30/2011 12:00
26.75
9/30/2011 13:00
-64.40
9/30/2011 14:00
-77.49
9/30/2011 15:00
101.31
9/30/2011 16:00
113.52
9/30/2011 17:00
207.33
9/30/2011 18:00
192.85
9/30/2011 19:00
77.54
9/30/2011 20:00
-138.82
9/30/2011 21:00
-244.50
9/30/2011 22:00
-198.71
9/30/2011 23:00
-247.68
10/1/2011 0:00
46.94
10/1/2011 1:00
67.79
10/1/2011 2:00
97.75
10/1/2011 3:00
123.42
10/1/2011 4:00
268.86
10/1/2011 5:00
351.79
10/1/2011 6:00
195.46
10/1/2011 7:00
93.97
10/1/2011 8:00
31.86
10/1/2011 9:00
-98.56
10/1/2011 10:00
-152.35
10/1/2011 11:00
-138.81
10/1/2011 12:00
-226.96
10/1/2011 13:00
-10.80
10/1/2011 14:00
-87.71
10/1/2011 15:00
-77.49
10/1/2011 16:00
-119.46
10/1/2011 17:00
-74.36
10/1/2011 18:00
-248.77
10/1/2011 19:00
-278.84
10/1/2011 20:00
-221.07
10/1/2011 21:00
-75.26
Docket No. ER11-1844
Exhibit No. NYI-4
Page 329 of 375
10/1/2011 22:00
-265.33
10/1/2011 23:00
-191.90
10/2/2011 0:00
-45.64
10/2/2011 1:00
-17.26
10/2/2011 2:00
328.45
10/2/2011 3:00
423.07
10/2/2011 4:00
431.01
10/2/2011 5:00
368.70
10/2/2011 6:00
112.42
10/2/2011 7:00
-45.12
10/2/2011 8:00
27.14
10/2/2011 9:00
19.35
10/2/2011 10:00
-79.44
10/2/2011 11:00
-23.13
10/2/2011 12:00
-137.03
10/2/2011 13:00
-50.44
10/2/2011 14:00
-1.30
10/2/2011 15:00
-59.01
10/2/2011 16:00
-95.78
10/2/2011 17:00
-142.26
10/2/2011 18:00
-43.53
10/2/2011 19:00
-104.88
10/2/2011 20:00
-115.88
10/2/2011 21:00
-159.78
10/2/2011 22:00
16.59
10/2/2011 23:00
-206.92
10/3/2011 0:00
-59.18
10/3/2011 1:00
1.72
10/3/2011 2:00
-89.62
10/3/2011 3:00
77.94
10/3/2011 4:00
148.11
10/3/2011 5:00
-162.23
10/3/2011 6:00
-246.58
10/3/2011 7:00
3.41
10/3/2011 8:00
-197.17
10/3/2011 9:00
-259.32
10/3/2011 10:00
-147.57
10/3/2011 11:00
-183.18
10/3/2011 12:00
-99.49
10/3/2011 13:00
-213.67
10/3/2011 14:00
-105.38
10/3/2011 15:00
-124.83
10/3/2011 16:00
-251.48
10/3/2011 17:00
-201.78
10/3/2011 18:00
-229.94
10/3/2011 19:00
-96.65
10/3/2011 20:00
-100.48
Docket No. ER11-1844
Exhibit No. NYI-4
Page 330 of 375
10/3/2011 21:00
-48.31
10/3/2011 22:00
263.40
10/3/2011 23:00
84.35
10/4/2011 0:00
69.71
10/4/2011 1:00
240.35
10/4/2011 2:00
229.24
10/4/2011 3:00
194.69
10/4/2011 4:00
148.20
10/4/2011 5:00
112.22
10/4/2011 6:00
49.92
10/4/2011 7:00
-33.42
10/4/2011 8:00
-74.21
10/4/2011 9:00
-207.45
10/4/2011 10:00
-179.47
10/4/2011 11:00
-271.03
10/4/2011 12:00
-166.00
10/4/2011 13:00
-211.38
10/4/2011 14:00
-218.26
10/4/2011 15:00
-204.65
10/4/2011 16:00
-262.35
10/4/2011 17:00
-259.56
10/4/2011 18:00
-127.36
10/4/2011 19:00
-83.53
10/4/2011 20:00
-250.64
10/4/2011 21:00
-198.89
10/4/2011 22:00
93.98
10/4/2011 23:00
148.33
10/5/2011 0:00
233.14
10/5/2011 1:00
282.19
10/5/2011 2:00
243.34
10/5/2011 3:00
274.07
10/5/2011 4:00
240.72
10/5/2011 5:00
243.93
10/5/2011 6:00
39.03
10/5/2011 7:00
15.76
10/5/2011 8:00
-56.42
10/5/2011 9:00
46.65
10/5/2011 10:00
-70.65
10/5/2011 11:00
-90.82
10/5/2011 12:00
-41.84
10/5/2011 13:00
5.94
10/5/2011 14:00
161.35
10/5/2011 15:00
163.49
10/5/2011 16:00
140.65
10/5/2011 17:00
144.04
10/5/2011 18:00
144.25
10/5/2011 19:00
-144.57
Docket No. ER11-1844
Exhibit No. NYI-4
Page 331 of 375
10/5/2011 20:00
-123.90
10/5/2011 21:00
-95.68
10/5/2011 22:00
52.13
10/5/2011 23:00
4.84
10/6/2011 0:00
46.45
10/6/2011 1:00
99.33
10/6/2011 2:00
216.05
10/6/2011 3:00
160.91
10/6/2011 4:00
289.77
10/6/2011 5:00
196.80
10/6/2011 6:00
73.11
10/6/2011 7:00
-27.05
10/6/2011 8:00
-22.24
10/6/2011 9:00
-72.85
10/6/2011 10:00
-109.65
10/6/2011 11:00
-50.75
10/6/2011 12:00
80.55
10/6/2011 13:00
-78.77
10/6/2011 14:00
-64.68
10/6/2011 15:00
-86.16
10/6/2011 16:00
-122.94
10/6/2011 17:00
-92.99
10/6/2011 18:00
44.15
10/6/2011 19:00
-111.34
10/6/2011 20:00
-0.46
10/6/2011 21:00
-35.03
10/6/2011 22:00
201.75
10/6/2011 23:00
243.66
10/7/2011 0:00
308.84
10/7/2011 1:00
258.98
10/7/2011 2:00
185.60
10/7/2011 3:00
284.61
10/7/2011 4:00
197.32
10/7/2011 5:00
177.75
10/7/2011 6:00
22.06
10/7/2011 7:00
-63.29
10/7/2011 8:00
-117.99
10/7/2011 9:00
-112.37
10/7/2011 10:00
-257.90
10/7/2011 11:00
-173.97
10/7/2011 12:00
-91.53
10/7/2011 13:00
-154.10
10/7/2011 14:00
-262.68
10/7/2011 15:00
-348.60
10/7/2011 16:00
-412.97
10/7/2011 17:00
-343.58
10/7/2011 18:00
-185.43
Docket No. ER11-1844
Exhibit No. NYI-4
Page 332 of 375
10/7/2011 19:00
-273.04
10/7/2011 20:00
-74.55
10/7/2011 21:00
-145.25
10/7/2011 22:00
-77.23
10/7/2011 23:00
-104.33
10/8/2011 0:00
-3.06
10/8/2011 1:00
-153.42
10/8/2011 2:00
-229.40
10/8/2011 3:00
-116.50
10/8/2011 4:00
-140.42
10/8/2011 5:00
-42.38
10/8/2011 6:00
-99.19
10/8/2011 7:00
47.57
10/8/2011 8:00
74.81
10/8/2011 9:00
-69.32
10/8/2011 10:00
-191.96
10/8/2011 11:00
-173.10
10/8/2011 12:00
-161.57
10/8/2011 13:00
-157.10
10/8/2011 14:00
-60.54
10/8/2011 15:00
-134.12
10/8/2011 16:00
-20.49
10/8/2011 17:00
17.31
10/8/2011 18:00
96.49
10/8/2011 19:00
308.36
10/8/2011 20:00
200.55
10/8/2011 21:00
187.81
10/8/2011 22:00
166.81
10/8/2011 23:00
145.93
10/9/2011 0:00
109.05
10/9/2011 1:00
289.72
10/9/2011 2:00
188.02
10/9/2011 3:00
110.79
10/9/2011 4:00
145.13
10/9/2011 5:00
145.69
10/9/2011 6:00
137.45
10/9/2011 7:00
213.20
10/9/2011 8:00
109.61
10/9/2011 9:00
-93.43
10/9/2011 10:00
-170.96
10/9/2011 11:00
-53.28
10/9/2011 12:00
-126.55
10/9/2011 13:00
-135.20
10/9/2011 14:00
-83.08
10/9/2011 15:00
-3.88
10/9/2011 16:00
98.75
10/9/2011 17:00
118.10
Docket No. ER11-1844
Exhibit No. NYI-4
Page 333 of 375
10/9/2011 18:00
317.69
10/9/2011 19:00
312.66
10/9/2011 20:00
352.00
10/9/2011 21:00
124.49
10/9/2011 22:00
179.78
10/9/2011 23:00
69.09
10/10/2011 0:00
-104.65
10/10/2011 1:00
-112.96
10/10/2011 2:00
-85.56
10/10/2011 3:00
21.23
10/10/2011 4:00
-7.39
10/10/2011 5:00
75.95
10/10/2011 6:00
-14.11
10/10/2011 7:00
42.79
10/10/2011 8:00
19.13
10/10/2011 9:00
44.73
10/10/2011 10:00
387.60
10/10/2011 11:00
318.35
10/10/2011 12:00
324.91
10/10/2011 13:00
203.47
10/10/2011 14:00
106.98
10/10/2011 15:00
160.04
10/10/2011 16:00
118.61
10/10/2011 17:00
122.74
10/10/2011 18:00
246.21
10/10/2011 19:00
152.45
10/10/2011 20:00
168.64
10/10/2011 21:00
-88.74
10/10/2011 22:00
-65.33
10/10/2011 23:00
30.64
10/11/2011 0:00
202.35
10/11/2011 1:00
255.21
10/11/2011 2:00
122.20
10/11/2011 3:00
97.20
10/11/2011 4:00
107.55
10/11/2011 5:00
-109.74
10/11/2011 6:00
-113.88
10/11/2011 7:00
-7.24
10/11/2011 8:00
127.19
10/11/2011 9:00
170.11
10/11/2011 10:00
97.61
10/11/2011 11:00
85.95
10/11/2011 12:00
66.99
10/11/2011 13:00
176.77
10/11/2011 14:00
109.89
10/11/2011 15:00
10.94
10/11/2011 16:00
18.21
Docket No. ER11-1844
Exhibit No. NYI-4
Page 334 of 375
10/11/2011 17:00
142.49
10/11/2011 18:00
255.29
10/11/2011 19:00
201.95
10/11/2011 20:00
166.36
10/11/2011 21:00
-4.30
10/11/2011 22:00
143.65
10/11/2011 23:00
128.09
10/12/2011 0:00
89.68
10/12/2011 1:00
230.12
10/12/2011 2:00
148.81
10/12/2011 3:00
122.97
10/12/2011 4:00
43.28
10/12/2011 5:00
-13.00
10/12/2011 6:00
-73.82
10/12/2011 7:00
-88.07
10/12/2011 8:00
105.06
10/12/2011 9:00
52.90
10/12/2011 10:00
20.77
10/12/2011 11:00
40.97
10/12/2011 12:00
211.21
10/12/2011 13:00
207.99
10/12/2011 14:00
128.49
10/12/2011 15:00
145.49
10/12/2011 16:00
142.27
10/12/2011 17:00
178.67
10/12/2011 18:00
207.80
10/12/2011 19:00
34.70
10/12/2011 20:00
76.12
10/12/2011 21:00
-31.29
10/12/2011 22:00
140.32
10/12/2011 23:00
114.77
10/13/2011 0:00
240.02
10/13/2011 1:00
347.29
10/13/2011 2:00
188.98
10/13/2011 3:00
201.53
10/13/2011 4:00
112.45
10/13/2011 5:00
186.04
10/13/2011 6:00
234.26
10/13/2011 7:00
182.79
10/13/2011 8:00
178.69
10/13/2011 9:00
229.49
10/13/2011 10:00
180.54
10/13/2011 11:00
176.99
10/13/2011 12:00
297.36
10/13/2011 13:00
237.89
10/13/2011 14:00
200.48
10/13/2011 15:00
368.01
Docket No. ER11-1844
Exhibit No. NYI-4
Page 335 of 375
10/13/2011 16:00
321.42
10/13/2011 17:00
481.97
10/13/2011 18:00
479.36
10/13/2011 19:00
226.56
10/13/2011 20:00
168.56
10/13/2011 21:00
58.73
10/13/2011 22:00
279.20
10/13/2011 23:00
291.49
10/14/2011 0:00
259.25
10/14/2011 1:00
80.18
10/14/2011 2:00
24.53
10/14/2011 3:00
24.98
10/14/2011 4:00
63.21
10/14/2011 5:00
12.40
10/14/2011 6:00
-96.70
10/14/2011 7:00
92.51
10/14/2011 8:00
201.19
10/14/2011 9:00
34.28
10/14/2011 10:00
-48.52
10/14/2011 11:00
-19.28
10/14/2011 12:00
-43.72
10/14/2011 13:00
-62.45
10/14/2011 14:00
-3.72
10/14/2011 15:00
-37.74
10/14/2011 16:00
67.19
10/14/2011 17:00
74.29
10/14/2011 18:00
158.37
10/14/2011 19:00
170.43
10/14/2011 20:00
163.97
10/14/2011 21:00
186.08
10/14/2011 22:00
134.39
10/14/2011 23:00
-110.81
10/15/2011 0:00
-144.28
10/15/2011 1:00
105.50
10/15/2011 2:00
183.25
10/15/2011 3:00
75.02
10/15/2011 4:00
68.04
10/15/2011 5:00
76.76
10/15/2011 6:00
-154.47
10/15/2011 7:00
-272.34
10/15/2011 8:00
-161.99
10/15/2011 9:00
38.67
10/15/2011 10:00
98.44
10/15/2011 11:00
172.43
10/15/2011 12:00
66.87
10/15/2011 13:00
129.90
10/15/2011 14:00
130.21
Docket No. ER11-1844
Exhibit No. NYI-4
Page 336 of 375
10/15/2011 15:00
123.53
10/15/2011 16:00
146.01
10/15/2011 17:00
158.78
10/15/2011 18:00
162.39
10/15/2011 19:00
104.51
10/15/2011 20:00
176.65
10/15/2011 21:00
158.29
10/15/2011 22:00
134.25
10/15/2011 23:00
4.04
10/16/2011 0:00
-11.84
10/16/2011 1:00
-22.27
10/16/2011 2:00
-0.78
10/16/2011 3:00
-98.54
10/16/2011 4:00
-40.21
10/16/2011 5:00
-4.32
10/16/2011 6:00
57.28
10/16/2011 7:00
-10.43
10/16/2011 8:00
-200.61
10/16/2011 9:00
94.50
10/16/2011 10:00
105.43
10/16/2011 11:00
155.68
10/16/2011 12:00
215.93
10/16/2011 13:00
97.12
10/16/2011 14:00
114.32
10/16/2011 15:00
50.61
10/16/2011 16:00
57.31
10/16/2011 17:00
149.85
10/16/2011 18:00
229.18
10/16/2011 19:00
242.17
10/16/2011 20:00
33.29
10/16/2011 21:00
60.81
10/16/2011 22:00
-100.51
10/16/2011 23:00
-26.92
10/17/2011 0:00
-97.18
10/17/2011 1:00
11.39
10/17/2011 2:00
28.27
10/17/2011 3:00
102.42
10/17/2011 4:00
173.70
10/17/2011 5:00
78.07
10/17/2011 6:00
8.86
10/17/2011 7:00
38.73
10/17/2011 8:00
161.90
10/17/2011 9:00
-60.96
10/17/2011 10:00
17.99
10/17/2011 11:00
89.02
10/17/2011 12:00
42.35
10/17/2011 13:00
144.76
Docket No. ER11-1844
Exhibit No. NYI-4
Page 337 of 375
10/17/2011 14:00
116.61
10/17/2011 15:00
170.29
10/17/2011 16:00
242.79
10/17/2011 17:00
148.27
10/17/2011 18:00
286.23
10/17/2011 19:00
13.58
10/17/2011 20:00
148.35
10/17/2011 21:00
16.02
10/17/2011 22:00
-21.08
10/17/2011 23:00
-160.30
10/18/2011 0:00
23.85
10/18/2011 1:00
5.10
10/18/2011 2:00
-36.56
10/18/2011 3:00
-257.34
10/18/2011 4:00
-197.17
10/18/2011 5:00
-144.88
10/18/2011 6:00
-265.74
10/18/2011 7:00
-198.52
10/18/2011 8:00
64.12
10/18/2011 9:00
-17.03
10/18/2011 10:00
-101.43
10/18/2011 11:00
-138.93
10/18/2011 12:00
-135.83
10/18/2011 13:00
-103.73
10/18/2011 14:00
89.76
10/18/2011 15:00
205.99
10/18/2011 16:00
92.76
10/18/2011 17:00
5.15
10/18/2011 18:00
84.13
10/18/2011 19:00
0.43
10/18/2011 20:00
-124.09
10/18/2011 21:00
-120.94
10/18/2011 22:00
-98.39
10/18/2011 23:00
-173.08
10/19/2011 0:00
6.84
10/19/2011 1:00
240.03
10/19/2011 2:00
205.69
10/19/2011 3:00
269.39
10/19/2011 4:00
196.64
10/19/2011 5:00
222.01
10/19/2011 6:00
-214.87
10/19/2011 7:00
-48.11
10/19/2011 8:00
97.98
10/19/2011 9:00
99.23
10/19/2011 10:00
138.89
10/19/2011 11:00
136.46
10/19/2011 12:00
50.98
Docket No. ER11-1844
Exhibit No. NYI-4
Page 338 of 375
10/19/2011 13:00
-8.79
10/19/2011 14:00
36.70
10/19/2011 15:00
-103.99
10/19/2011 16:00
-97.73
10/19/2011 17:00
-33.64
10/19/2011 18:00
-41.01
10/19/2011 19:00
127.96
10/19/2011 20:00
75.73
10/19/2011 21:00
-117.32
10/19/2011 22:00
-85.12
10/19/2011 23:00
119.14
10/20/2011 0:00
216.07
10/20/2011 1:00
-18.40
10/20/2011 2:00
65.47
10/20/2011 3:00
15.79
10/20/2011 4:00
0.66
10/20/2011 5:00
43.85
10/20/2011 6:00
-16.96
10/20/2011 7:00
31.37
10/20/2011 8:00
239.96
10/20/2011 9:00
286.27
10/20/2011 10:00
292.58
10/20/2011 11:00
185.13
10/20/2011 12:00
118.44
10/20/2011 13:00
86.27
10/20/2011 14:00
28.20
10/20/2011 15:00
-85.33
10/20/2011 16:00
-69.75
10/20/2011 17:00
87.09
10/20/2011 18:00
11.82
10/20/2011 19:00
18.46
10/20/2011 20:00
-60.08
10/20/2011 21:00
-238.33
10/20/2011 22:00
-17.46
10/20/2011 23:00
-40.20
10/21/2011 0:00
-83.69
10/21/2011 1:00
-199.02
10/21/2011 2:00
-226.31
10/21/2011 3:00
-199.23
10/21/2011 4:00
-224.72
10/21/2011 5:00
-164.44
10/21/2011 6:00
-148.00
10/21/2011 7:00
131.86
10/21/2011 8:00
21.32
10/21/2011 9:00
125.71
10/21/2011 10:00
101.08
10/21/2011 11:00
158.50
Docket No. ER11-1844
Exhibit No. NYI-4
Page 339 of 375
10/21/2011 12:00
127.98
10/21/2011 13:00
37.34
10/21/2011 14:00
68.56
10/21/2011 15:00
-59.64
10/21/2011 16:00
64.22
10/21/2011 17:00
128.12
10/21/2011 18:00
83.92
10/21/2011 19:00
101.35
10/21/2011 20:00
22.88
10/21/2011 21:00
-73.38
10/21/2011 22:00
101.24
10/21/2011 23:00
-69.39
10/22/2011 0:00
-11.73
10/22/2011 1:00
-41.37
10/22/2011 2:00
-40.36
10/22/2011 3:00
-29.96
10/22/2011 4:00
44.61
10/22/2011 5:00
7.35
10/22/2011 6:00
-70.73
10/22/2011 7:00
-176.72
10/22/2011 8:00
-175.96
10/22/2011 9:00
-147.85
10/22/2011 10:00
-122.89
10/22/2011 11:00
-31.51
10/22/2011 12:00
24.11
10/22/2011 13:00
15.91
10/22/2011 14:00
17.15
10/22/2011 15:00
150.36
10/22/2011 16:00
84.30
10/22/2011 17:00
-23.46
10/22/2011 18:00
-43.26
10/22/2011 19:00
6.22
10/22/2011 20:00
-5.11
10/22/2011 21:00
47.03
10/22/2011 22:00
42.22
10/22/2011 23:00
53.08
10/23/2011 0:00
61.43
10/23/2011 1:00
-37.42
10/23/2011 2:00
4.45
10/23/2011 3:00
-52.75
10/23/2011 4:00
-91.20
10/23/2011 5:00
-84.53
10/23/2011 6:00
-269.55
10/23/2011 7:00
-371.24
10/23/2011 8:00
-253.79
10/23/2011 9:00
-315.09
10/23/2011 10:00
-228.83
Docket No. ER11-1844
Exhibit No. NYI-4
Page 340 of 375
10/23/2011 11:00
-143.14
10/23/2011 12:00
-59.72
10/23/2011 13:00
-23.89
10/23/2011 14:00
-23.14
10/23/2011 15:00
-94.35
10/23/2011 16:00
17.24
10/23/2011 17:00
133.32
10/23/2011 18:00
131.69
10/23/2011 19:00
137.66
10/23/2011 20:00
169.40
10/23/2011 21:00
47.09
10/23/2011 22:00
172.94
10/23/2011 23:00
177.25
10/24/2011 0:00
96.32
10/24/2011 1:00
-68.32
10/24/2011 2:00
-63.85
10/24/2011 3:00
-180.28
10/24/2011 4:00
-327.72
10/24/2011 5:00
-192.24
10/24/2011 6:00
245.57
10/24/2011 7:00
385.81
10/24/2011 8:00
315.82
10/24/2011 9:00
-11.98
10/24/2011 10:00
-75.30
10/24/2011 11:00
48.58
10/24/2011 12:00
129.72
10/24/2011 13:00
53.49
10/24/2011 14:00
110.29
10/24/2011 15:00
-112.46
10/24/2011 16:00
-28.79
10/24/2011 17:00
82.84
10/24/2011 18:00
118.89
10/24/2011 19:00
145.49
10/24/2011 20:00
106.96
10/24/2011 21:00
-70.09
10/24/2011 22:00
-109.90
10/24/2011 23:00
-24.89
10/25/2011 0:00
-92.03
10/25/2011 1:00
-61.95
10/25/2011 2:00
49.73
10/25/2011 3:00
39.00
10/25/2011 4:00
56.79
10/25/2011 5:00
12.10
10/25/2011 6:00
-241.97
10/25/2011 7:00
-189.37
10/25/2011 8:00
-200.40
10/25/2011 9:00
-215.17
Docket No. ER11-1844
Exhibit No. NYI-4
Page 341 of 375
10/25/2011 10:00
-363.15
10/25/2011 11:00
88.31
10/25/2011 12:00
13.95
10/25/2011 13:00
52.19
10/25/2011 14:00
-112.01
10/25/2011 15:00
-190.37
10/25/2011 16:00
-173.33
10/25/2011 17:00
-361.44
10/25/2011 18:00
55.98
10/25/2011 19:00
96.72
10/25/2011 20:00
81.01
10/25/2011 21:00
-2.47
10/25/2011 22:00
187.19
10/25/2011 23:00
360.32
10/26/2011 0:00
220.41
10/26/2011 1:00
256.41
10/26/2011 2:00
176.27
10/26/2011 3:00
189.01
10/26/2011 4:00
167.84
10/26/2011 5:00
19.70
10/26/2011 6:00
315.09
10/26/2011 7:00
460.38
10/26/2011 8:00
529.05
10/26/2011 9:00
317.23
10/26/2011 10:00
250.66
10/26/2011 11:00
178.23
10/26/2011 12:00
204.69
10/26/2011 13:00
130.74
10/26/2011 14:00
74.85
10/26/2011 15:00
-18.57
10/26/2011 16:00
-52.26
10/26/2011 17:00
129.91
10/26/2011 18:00
140.45
10/26/2011 19:00
526.04
10/26/2011 20:00
429.90
10/26/2011 21:00
-11.30
10/26/2011 22:00
179.77
10/26/2011 23:00
186.16
10/27/2011 0:00
270.22
10/27/2011 1:00
58.45
10/27/2011 2:00
78.26
10/27/2011 3:00
-23.29
10/27/2011 4:00
-1.92
10/27/2011 5:00
-125.40
10/27/2011 6:00
61.02
10/27/2011 7:00
84.85
10/27/2011 8:00
106.97
Docket No. ER11-1844
Exhibit No. NYI-4
Page 342 of 375
10/27/2011 9:00
4.00
10/27/2011 10:00
110.28
10/27/2011 11:00
121.55
10/27/2011 12:00
198.47
10/27/2011 13:00
77.66
10/27/2011 14:00
-66.25
10/27/2011 15:00
6.96
10/27/2011 16:00
-180.34
10/27/2011 17:00
-163.99
10/27/2011 18:00
88.37
10/27/2011 19:00
-32.60
10/27/2011 20:00
169.95
10/27/2011 21:00
47.98
10/27/2011 22:00
149.20
10/27/2011 23:00
203.66
10/28/2011 0:00
310.54
10/28/2011 1:00
244.62
10/28/2011 2:00
162.99
10/28/2011 3:00
303.54
10/28/2011 4:00
366.79
10/28/2011 5:00
237.48
10/28/2011 6:00
201.75
10/28/2011 7:00
358.70
10/28/2011 8:00
247.43
10/28/2011 9:00
281.29
10/28/2011 10:00
-19.29
10/28/2011 11:00
-9.37
10/28/2011 12:00
-37.72
10/28/2011 13:00
-57.15
10/28/2011 14:00
-167.98
10/28/2011 15:00
-162.26
10/28/2011 16:00
-110.29
10/28/2011 17:00
-2.71
10/28/2011 18:00
17.07
10/28/2011 19:00
51.45
10/28/2011 20:00
-6.96
10/28/2011 21:00
113.46
10/28/2011 22:00
259.17
10/28/2011 23:00
61.27
10/29/2011 0:00
195.42
10/29/2011 1:00
113.34
10/29/2011 2:00
-37.17
10/29/2011 3:00
-43.44
10/29/2011 4:00
18.92
10/29/2011 5:00
166.00
10/29/2011 6:00
84.07
10/29/2011 7:00
113.71
Docket No. ER11-1844
Exhibit No. NYI-4
Page 343 of 375
10/29/2011 8:00
545.89
10/29/2011 9:00
439.97
10/29/2011 10:00
399.50
10/29/2011 11:00
450.07
10/29/2011 12:00
382.68
10/29/2011 13:00
370.65
10/29/2011 14:00
261.37
10/29/2011 15:00
255.80
10/29/2011 16:00
201.41
10/29/2011 17:00
182.35
10/29/2011 18:00
291.04
10/29/2011 19:00
137.71
10/29/2011 20:00
329.85
10/29/2011 21:00
384.21
10/29/2011 22:00
351.67
10/29/2011 23:00
391.01
10/30/2011 0:00
388.96
10/30/2011 1:00
338.15
10/30/2011 2:00
383.71
10/30/2011 3:00
218.34
10/30/2011 4:00
317.74
10/30/2011 5:00
404.26
10/30/2011 6:00
505.68
10/30/2011 7:00
363.09
10/30/2011 8:00
246.82
10/30/2011 9:00
326.21
10/30/2011 10:00
111.52
10/30/2011 11:00
129.78
10/30/2011 12:00
58.39
10/30/2011 13:00
-48.48
10/30/2011 14:00
-66.20
10/30/2011 15:00
-41.04
10/30/2011 16:00
-7.64
10/30/2011 17:00
-59.75
10/30/2011 18:00
66.63
10/30/2011 19:00
32.53
10/30/2011 20:00
-77.42
10/30/2011 21:00
-74.99
10/30/2011 22:00
223.86
10/30/2011 23:00
29.55
10/31/2011 0:00
-50.49
10/31/2011 1:00
-67.25
10/31/2011 2:00
-81.93
10/31/2011 3:00
-75.51
10/31/2011 4:00
9.68
10/31/2011 5:00
24.63
10/31/2011 6:00
196.52
Docket No. ER11-1844
Exhibit No. NYI-4
Page 344 of 375
10/31/2011 7:00
345.77
10/31/2011 8:00
375.17
10/31/2011 9:00
220.22
10/31/2011 10:00
218.14
10/31/2011 11:00
225.79
10/31/2011 12:00
159.40
10/31/2011 13:00
257.47
10/31/2011 14:00
300.17
10/31/2011 15:00
267.91
10/31/2011 16:00
230.14
10/31/2011 17:00
214.76
10/31/2011 18:00
0.11
10/31/2011 19:00
283.53
10/31/2011 20:00
168.89
10/31/2011 21:00
135.59
10/31/2011 22:00
-40.20
10/31/2011 23:00
-14.65
11/1/2011 0:00
54.22
11/1/2011 1:00
-116.35
11/1/2011 2:00
-217.39
11/1/2011 3:00
-325.13
11/1/2011 4:00
-370.24
11/1/2011 5:00
-111.94
11/1/2011 6:00
142.70
11/1/2011 7:00
246.81
11/1/2011 8:00
198.47
11/1/2011 9:00
127.49
11/1/2011 10:00
64.41
11/1/2011 11:00
192.01
11/1/2011 12:00
71.51
11/1/2011 13:00
151.45
11/1/2011 14:00
98.41
11/1/2011 15:00
137.81
11/1/2011 16:00
224.10
11/1/2011 17:00
322.90
11/1/2011 18:00
212.41
11/1/2011 19:00
160.95
11/1/2011 20:00
262.42
11/1/2011 21:00
226.75
11/1/2011 22:00
-9.23
11/1/2011 23:00
138.99
11/2/2011 0:00
247.20
11/2/2011 1:00
70.51
11/2/2011 2:00
6.46
11/2/2011 3:00
31.06
11/2/2011 4:00
101.18
11/2/2011 5:00
219.82
Docket No. ER11-1844
Exhibit No. NYI-4
Page 345 of 375
11/2/2011 6:00
258.28
11/2/2011 7:00
-15.78
11/2/2011 8:00
193.53
11/2/2011 9:00
131.41
11/2/2011 10:00
-216.46
11/2/2011 11:00
-127.23
11/2/2011 12:00
-230.72
11/2/2011 13:00
-178.80
11/2/2011 14:00
-80.74
11/2/2011 15:00
-51.14
11/2/2011 16:00
84.81
11/2/2011 17:00
229.79
11/2/2011 18:00
212.16
11/2/2011 19:00
226.01
11/2/2011 20:00
336.95
11/2/2011 21:00
299.80
11/2/2011 22:00
97.57
11/2/2011 23:00
114.02
11/3/2011 0:00
131.68
11/3/2011 1:00
207.83
11/3/2011 2:00
-63.63
11/3/2011 3:00
147.80
11/3/2011 4:00
269.91
11/3/2011 5:00
265.02
11/3/2011 6:00
133.48
11/3/2011 7:00
79.53
11/3/2011 8:00
91.30
11/3/2011 9:00
107.14
11/3/2011 10:00
95.22
11/3/2011 11:00
-52.36
11/3/2011 12:00
-126.40
11/3/2011 13:00
-77.00
11/3/2011 14:00
-7.22
11/3/2011 15:00
143.12
11/3/2011 16:00
97.54
11/3/2011 17:00
100.92
11/3/2011 18:00
184.20
11/3/2011 19:00
414.97
11/3/2011 20:00
35.88
11/3/2011 21:00
143.84
11/3/2011 22:00
35.19
11/3/2011 23:00
163.92
11/4/2011 0:00
151.26
11/4/2011 1:00
220.16
11/4/2011 2:00
213.51
11/4/2011 3:00
140.33
11/4/2011 4:00
183.88
Docket No. ER11-1844
Exhibit No. NYI-4
Page 346 of 375
11/4/2011 5:00
84.21
11/4/2011 6:00
-81.38
11/4/2011 7:00
4.52
11/4/2011 8:00
-6.11
11/4/2011 9:00
-97.13
11/4/2011 10:00
-174.66
11/4/2011 11:00
-109.50
11/4/2011 12:00
-49.80
11/4/2011 13:00
-170.32
11/4/2011 14:00
-247.23
11/4/2011 15:00
-204.98
11/4/2011 16:00
-180.50
11/4/2011 17:00
95.77
11/4/2011 18:00
-130.25
11/4/2011 19:00
-226.62
11/4/2011 20:00
-314.69
11/4/2011 21:00
-149.31
11/4/2011 22:00
-173.09
11/4/2011 23:00
-18.60
11/5/2011 0:00
202.00
11/5/2011 1:00
109.92
11/5/2011 2:00
116.00
11/5/2011 3:00
14.71
11/5/2011 4:00
62.28
11/5/2011 5:00
34.16
11/5/2011 6:00
63.40
11/5/2011 7:00
-87.31
11/5/2011 8:00
-152.95
11/5/2011 9:00
-230.01
11/5/2011 10:00
-416.44
11/5/2011 11:00
-388.46
11/5/2011 12:00
-347.94
11/5/2011 13:00
-145.29
11/5/2011 14:00
-123.05
11/5/2011 15:00
0.91
11/5/2011 16:00
-74.01
11/5/2011 17:00
-192.45
11/5/2011 18:00
-256.11
11/5/2011 19:00
-226.30
11/5/2011 20:00
-173.39
11/5/2011 21:00
-209.62
11/5/2011 22:00
-218.55
11/5/2011 23:00
-172.21
11/6/2011 0:00
-165.91
11/6/2011 1:00
294.13
11/6/2011 2:00
292.12
11/6/2011 3:00
-123.37
Docket No. ER11-1844
Exhibit No. NYI-4
Page 347 of 375
11/6/2011 4:00
-176.50
11/6/2011 5:00
189.12
11/6/2011 6:00
112.03
11/6/2011 7:00
104.34
11/6/2011 8:00
-1.72
11/6/2011 9:00
-85.20
11/6/2011 10:00
-19.82
11/6/2011 11:00
-2.35
11/6/2011 12:00
17.39
11/6/2011 13:00
-223.13
11/6/2011 14:00
-221.01
11/6/2011 15:00
-114.55
11/6/2011 16:00
-58.35
11/6/2011 17:00
116.61
11/6/2011 18:00
54.53
11/6/2011 19:00
-198.18
11/6/2011 20:00
-343.99
11/6/2011 21:00
-262.19
11/6/2011 22:00
-332.18
11/6/2011 23:00
-387.57
11/7/2011 0:00
-500.58
11/7/2011 1:00
-479.20
11/7/2011 2:00
-474.27
11/7/2011 3:00
-319.48
11/7/2011 4:00
-372.80
11/7/2011 5:00
-483.91
11/7/2011 6:00
-271.76
11/7/2011 7:00
-159.75
11/7/2011 8:00
-161.81
11/7/2011 9:00
-288.34
11/7/2011 10:00
-507.21
11/7/2011 11:00
-282.96
11/7/2011 12:00
-421.48
11/7/2011 13:00
-291.49
11/7/2011 14:00
-244.86
11/7/2011 15:00
-252.73
11/7/2011 16:00
-222.51
11/7/2011 17:00
-146.77
11/7/2011 18:00
-320.50
11/7/2011 19:00
-562.93
11/7/2011 20:00
-487.57
11/7/2011 21:00
-517.71
11/7/2011 22:00
-428.20
11/7/2011 23:00
-249.68
11/8/2011 0:00
-120.91
11/8/2011 1:00
-2.28
11/8/2011 2:00
162.96
Docket No. ER11-1844
Exhibit No. NYI-4
Page 348 of 375
11/8/2011 3:00
295.58
11/8/2011 4:00
371.77
11/8/2011 5:00
184.61
11/8/2011 6:00
239.39
11/8/2011 7:00
40.64
11/8/2011 8:00
-93.08
11/8/2011 9:00
-172.14
11/8/2011 10:00
-219.20
11/8/2011 11:00
-150.87
11/8/2011 12:00
-133.95
11/8/2011 13:00
-180.91
11/8/2011 14:00
-248.22
11/8/2011 15:00
-259.29
11/8/2011 16:00
-171.80
11/8/2011 17:00
-148.13
11/8/2011 18:00
-221.14
11/8/2011 19:00
-555.14
11/8/2011 20:00
-360.08
11/8/2011 21:00
-173.66
11/8/2011 22:00
-232.79
11/8/2011 23:00
55.66
11/9/2011 0:00
8.65
11/9/2011 1:00
-64.80
11/9/2011 2:00
-81.46
11/9/2011 3:00
41.70
11/9/2011 4:00
228.45
11/9/2011 5:00
191.22
11/9/2011 6:00
172.22
11/9/2011 7:00
-73.89
11/9/2011 8:00
-90.82
11/9/2011 9:00
-150.32
11/9/2011 10:00
-177.03
11/9/2011 11:00
-191.48
11/9/2011 12:00
-182.69
11/9/2011 13:00
-70.25
11/9/2011 14:00
-23.92
11/9/2011 15:00
-82.36
11/9/2011 16:00
68.40
11/9/2011 17:00
-33.80
11/9/2011 18:00
-160.94
11/9/2011 19:00
-136.82
11/9/2011 20:00
-17.27
11/9/2011 21:00
-90.96
11/9/2011 22:00
-46.52
11/9/2011 23:00
206.18
11/10/2011 0:00
289.98
11/10/2011 1:00
387.60
Docket No. ER11-1844
Exhibit No. NYI-4
Page 349 of 375
11/10/2011 2:00
203.22
11/10/2011 3:00
242.63
11/10/2011 4:00
317.11
11/10/2011 5:00
372.39
11/10/2011 6:00
354.86
11/10/2011 7:00
116.97
11/10/2011 8:00
180.84
11/10/2011 9:00
52.70
11/10/2011 10:00
13.61
11/10/2011 11:00
111.91
11/10/2011 12:00
149.20
11/10/2011 13:00
207.61
11/10/2011 14:00
319.80
11/10/2011 15:00
314.97
11/10/2011 16:00
317.17
11/10/2011 17:00
333.65
11/10/2011 18:00
216.21
11/10/2011 19:00
98.38
11/10/2011 20:00
273.21
11/10/2011 21:00
170.08
11/10/2011 22:00
69.26
11/10/2011 23:00
264.84
11/11/2011 0:00
209.73
11/11/2011 1:00
222.59
11/11/2011 2:00
183.87
11/11/2011 3:00
166.84
11/11/2011 4:00
370.60
11/11/2011 5:00
429.32
11/11/2011 6:00
708.81
11/11/2011 7:00
511.70
11/11/2011 8:00
408.64
11/11/2011 9:00
262.60
11/11/2011 10:00
106.07
11/11/2011 11:00
355.10
11/11/2011 12:00
297.70
11/11/2011 13:00
327.34
11/11/2011 14:00
308.63
11/11/2011 15:00
303.62
11/11/2011 16:00
160.30
11/11/2011 17:00
237.42
11/11/2011 18:00
23.89
11/11/2011 19:00
-0.92
11/11/2011 20:00
-0.41
11/11/2011 21:00
249.67
11/11/2011 22:00
140.57
11/11/2011 23:00
301.71
11/12/2011 0:00
36.45
Docket No. ER11-1844
Exhibit No. NYI-4
Page 350 of 375
11/12/2011 1:00
216.63
11/12/2011 2:00
223.94
11/12/2011 3:00
177.15
11/12/2011 4:00
269.19
11/12/2011 5:00
90.04
11/12/2011 6:00
204.09
11/12/2011 7:00
62.79
11/12/2011 8:00
30.55
11/12/2011 9:00
45.06
11/12/2011 10:00
-81.49
11/12/2011 11:00
-90.74
11/12/2011 12:00
-134.88
11/12/2011 13:00
-13.26
11/12/2011 14:00
20.42
11/12/2011 15:00
104.51
11/12/2011 16:00
12.04
11/12/2011 17:00
-110.95
11/12/2011 18:00
-82.26
11/12/2011 19:00
-33.57
11/12/2011 20:00
-43.75
11/12/2011 21:00
32.26
11/12/2011 22:00
272.23
11/12/2011 23:00
202.22
11/13/2011 0:00
243.92
11/13/2011 1:00
473.52
11/13/2011 2:00
688.80
11/13/2011 3:00
689.03
11/13/2011 4:00
774.33
11/13/2011 5:00
764.61
11/13/2011 6:00
681.96
11/13/2011 7:00
649.78
11/13/2011 8:00
507.86
11/13/2011 9:00
191.47
11/13/2011 10:00
102.55
11/13/2011 11:00
113.34
11/13/2011 12:00
50.40
11/13/2011 13:00
91.79
11/13/2011 14:00
41.99
11/13/2011 15:00
143.66
11/13/2011 16:00
136.19
11/13/2011 17:00
135.76
11/13/2011 18:00
4.42
11/13/2011 19:00
127.68
11/13/2011 20:00
93.84
11/13/2011 21:00
17.44
11/13/2011 22:00
4.04
11/13/2011 23:00
20.88
Docket No. ER11-1844
Exhibit No. NYI-4
Page 351 of 375
11/14/2011 0:00
216.74
11/14/2011 1:00
337.14
11/14/2011 2:00
460.07
11/14/2011 3:00
538.61
11/14/2011 4:00
561.41
11/14/2011 5:00
350.34
11/14/2011 6:00
191.74
11/14/2011 7:00
85.18
11/14/2011 8:00
97.19
11/14/2011 9:00
183.35
11/14/2011 10:00
209.15
11/14/2011 11:00
-140.15
11/14/2011 12:00
-131.81
11/14/2011 13:00
-163.62
11/14/2011 14:00
-108.57
11/14/2011 15:00
-193.50
11/14/2011 16:00
-401.09
11/14/2011 17:00
-232.74
11/14/2011 18:00
-176.25
11/14/2011 19:00
-379.52
11/14/2011 20:00
-214.12
11/14/2011 21:00
-196.32
11/14/2011 22:00
-124.24
11/14/2011 23:00
-63.42
11/15/2011 0:00
-92.16
11/15/2011 1:00
71.24
11/15/2011 2:00
26.68
11/15/2011 3:00
162.82
11/15/2011 4:00
112.69
11/15/2011 5:00
68.50
11/15/2011 6:00
108.52
11/15/2011 7:00
-89.98
11/15/2011 8:00
29.95
11/15/2011 9:00
73.59
11/15/2011 10:00
-7.63
11/15/2011 11:00
-199.26
11/15/2011 12:00
-201.89
11/15/2011 13:00
-251.38
11/15/2011 14:00
-113.97
11/15/2011 15:00
-53.75
11/15/2011 16:00
-267.32
11/15/2011 17:00
-299.71
11/15/2011 18:00
-518.26
11/15/2011 19:00
-486.54
11/15/2011 20:00
-318.63
11/15/2011 21:00
-90.80
11/15/2011 22:00
2.85
Docket No. ER11-1844
Exhibit No. NYI-4
Page 352 of 375
11/15/2011 23:00
178.18
11/16/2011 0:00
60.60
11/16/2011 1:00
79.65
11/16/2011 2:00
174.36
11/16/2011 3:00
303.19
11/16/2011 4:00
216.24
11/16/2011 5:00
43.58
11/16/2011 6:00
0.15
11/16/2011 7:00
-92.89
11/16/2011 8:00
-70.87
11/16/2011 9:00
-72.74
11/16/2011 10:00
-142.48
11/16/2011 11:00
-209.09
11/16/2011 12:00
-234.26
11/16/2011 13:00
-279.63
11/16/2011 14:00
-173.29
11/16/2011 15:00
-150.59
11/16/2011 16:00
-122.22
11/16/2011 17:00
-257.23
11/16/2011 18:00
-381.54
11/16/2011 19:00
-619.05
11/16/2011 20:00
-539.37
11/16/2011 21:00
-545.67
11/16/2011 22:00
-608.31
11/16/2011 23:00
-422.76
11/17/2011 0:00
-127.90
11/17/2011 1:00
73.48
11/17/2011 2:00
40.92
11/17/2011 3:00
137.10
11/17/2011 4:00
59.06
11/17/2011 5:00
-72.62
11/17/2011 6:00
-93.03
11/17/2011 7:00
-86.11
11/17/2011 8:00
161.66
11/17/2011 9:00
114.07
11/17/2011 10:00
2.57
11/17/2011 11:00
87.21
11/17/2011 12:00
-82.31
11/17/2011 13:00
-147.64
11/17/2011 14:00
-29.85
11/17/2011 15:00
-98.89
11/17/2011 16:00
149.76
11/17/2011 17:00
-59.70
11/17/2011 18:00
-124.84
11/17/2011 19:00
-39.51
11/17/2011 20:00
-103.49
11/17/2011 21:00
-234.20
Docket No. ER11-1844
Exhibit No. NYI-4
Page 353 of 375
11/17/2011 22:00
-513.92
11/17/2011 23:00
-306.81
11/18/2011 0:00
-32.19
11/18/2011 1:00
108.22
11/18/2011 2:00
166.56
11/18/2011 3:00
179.82
11/18/2011 4:00
291.98
11/18/2011 5:00
477.73
11/18/2011 6:00
594.60
11/18/2011 7:00
373.00
11/18/2011 8:00
169.05
11/18/2011 9:00
74.16
11/18/2011 10:00
-148.26
11/18/2011 11:00
-205.24
11/18/2011 12:00
-182.84
11/18/2011 13:00
-195.28
11/18/2011 14:00
-43.91
11/18/2011 15:00
217.97
11/18/2011 16:00
65.96
11/18/2011 17:00
-350.82
11/18/2011 18:00
-52.41
11/18/2011 19:00
28.36
11/18/2011 20:00
-19.69
11/18/2011 21:00
16.45
11/18/2011 22:00
-103.76
11/18/2011 23:00
109.64
11/19/2011 0:00
327.80
11/19/2011 1:00
330.46
11/19/2011 2:00
431.80
11/19/2011 3:00
437.37
11/19/2011 4:00
214.80
11/19/2011 5:00
176.10
11/19/2011 6:00
220.99
11/19/2011 7:00
182.49
11/19/2011 8:00
143.11
11/19/2011 9:00
-30.35
11/19/2011 10:00
-53.54
11/19/2011 11:00
-185.70
11/19/2011 12:00
-41.13
11/19/2011 13:00
-70.31
11/19/2011 14:00
-87.01
11/19/2011 15:00
-26.98
11/19/2011 16:00
14.62
11/19/2011 17:00
123.16
11/19/2011 18:00
175.76
11/19/2011 19:00
77.38
11/19/2011 20:00
117.58
Docket No. ER11-1844
Exhibit No. NYI-4
Page 354 of 375
11/19/2011 21:00
75.96
11/19/2011 22:00
43.88
11/19/2011 23:00
225.83
11/20/2011 0:00
628.79
11/20/2011 1:00
714.78
11/20/2011 2:00
725.54
11/20/2011 3:00
702.29
11/20/2011 4:00
743.91
11/20/2011 5:00
630.34
11/20/2011 6:00
582.54
11/20/2011 7:00
639.57
11/20/2011 8:00
474.06
11/20/2011 9:00
102.38
11/20/2011 10:00
24.88
11/20/2011 11:00
111.91
11/20/2011 12:00
56.69
11/20/2011 13:00
75.17
11/20/2011 14:00
-22.00
11/20/2011 15:00
94.72
11/20/2011 16:00
14.98
11/20/2011 17:00
71.23
11/20/2011 18:00
114.24
11/20/2011 19:00
132.25
11/20/2011 20:00
151.93
11/20/2011 21:00
145.62
11/20/2011 22:00
54.39
11/20/2011 23:00
-17.54
11/21/2011 0:00
173.36
11/21/2011 1:00
170.13
11/21/2011 2:00
190.75
11/21/2011 3:00
210.14
11/21/2011 4:00
138.85
11/21/2011 5:00
44.29
11/21/2011 6:00
95.65
11/21/2011 7:00
-225.68
11/21/2011 8:00
-80.08
11/21/2011 9:00
-286.63
11/21/2011 10:00
-335.64
11/21/2011 11:00
-257.85
11/21/2011 12:00
-245.31
11/21/2011 13:00
-228.08
11/21/2011 14:00
-159.38
11/21/2011 15:00
-95.20
11/21/2011 16:00
86.54
11/21/2011 17:00
-34.23
11/21/2011 18:00
-144.58
11/21/2011 19:00
-70.36
Docket No. ER11-1844
Exhibit No. NYI-4
Page 355 of 375
11/21/2011 20:00
-162.69
11/21/2011 21:00
-172.56
11/21/2011 22:00
-308.79
11/21/2011 23:00
-1.51
11/22/2011 0:00
126.09
11/22/2011 1:00
71.86
11/22/2011 2:00
149.93
11/22/2011 3:00
92.08
11/22/2011 4:00
182.76
11/22/2011 5:00
64.82
11/22/2011 6:00
65.33
11/22/2011 7:00
-254.61
11/22/2011 8:00
-180.26
11/22/2011 9:00
-155.38
11/22/2011 10:00
-99.01
11/22/2011 11:00
-105.87
11/22/2011 12:00
-30.46
11/22/2011 13:00
-23.76
11/22/2011 14:00
-67.30
11/22/2011 15:00
-89.99
11/22/2011 16:00
93.99
11/22/2011 17:00
19.45
11/22/2011 18:00
-47.28
11/22/2011 19:00
-233.29
11/22/2011 20:00
-305.16
11/22/2011 21:00
-172.04
11/22/2011 22:00
-220.57
11/22/2011 23:00
101.06
11/23/2011 0:00
-45.03
11/23/2011 1:00
-2.20
11/23/2011 2:00
-41.57
11/23/2011 3:00
121.02
11/23/2011 4:00
41.30
11/23/2011 5:00
-58.10
11/23/2011 6:00
-165.55
11/23/2011 7:00
-236.84
11/23/2011 8:00
-267.23
11/23/2011 9:00
-219.59
11/23/2011 10:00
-214.66
11/23/2011 11:00
-242.39
11/23/2011 12:00
-192.80
11/23/2011 13:00
-119.51
11/23/2011 14:00
-133.42
11/23/2011 15:00
-203.35
11/23/2011 16:00
-40.86
11/23/2011 17:00
-139.02
11/23/2011 18:00
-102.83
Docket No. ER11-1844
Exhibit No. NYI-4
Page 356 of 375
11/23/2011 19:00
-315.57
11/23/2011 20:00
-404.47
11/23/2011 21:00
-351.46
11/23/2011 22:00
-200.73
11/23/2011 23:00
-104.71
11/24/2011 0:00
160.51
11/24/2011 1:00
384.47
11/24/2011 2:00
448.71
11/24/2011 3:00
465.58
11/24/2011 4:00
395.93
11/24/2011 5:00
533.38
11/24/2011 6:00
239.60
11/24/2011 7:00
60.36
11/24/2011 8:00
34.02
11/24/2011 9:00
-103.07
11/24/2011 10:00
-196.24
11/24/2011 11:00
-223.70
11/24/2011 12:00
-204.46
11/24/2011 13:00
-84.78
11/24/2011 14:00
-75.62
11/24/2011 15:00
-190.63
11/24/2011 16:00
-46.81
11/24/2011 17:00
-121.52
11/24/2011 18:00
-186.88
11/24/2011 19:00
-140.44
11/24/2011 20:00
-140.02
11/24/2011 21:00
27.56
11/24/2011 22:00
79.05
11/24/2011 23:00
382.93
11/25/2011 0:00
372.11
11/25/2011 1:00
265.73
11/25/2011 2:00
256.43
11/25/2011 3:00
112.32
11/25/2011 4:00
91.16
11/25/2011 5:00
185.38
11/25/2011 6:00
243.97
11/25/2011 7:00
79.77
11/25/2011 8:00
-69.66
11/25/2011 9:00
-67.87
11/25/2011 10:00
-149.62
11/25/2011 11:00
-102.34
11/25/2011 12:00
-45.72
11/25/2011 13:00
-53.87
11/25/2011 14:00
-118.23
11/25/2011 15:00
-183.55
11/25/2011 16:00
31.59
11/25/2011 17:00
-93.11
Docket No. ER11-1844
Exhibit No. NYI-4
Page 357 of 375
11/25/2011 18:00
0.89
11/25/2011 19:00
-63.73
11/25/2011 20:00
-257.41
11/25/2011 21:00
-136.13
11/25/2011 22:00
-153.64
11/25/2011 23:00
80.71
11/26/2011 0:00
360.35
11/26/2011 1:00
405.74
11/26/2011 2:00
456.54
11/26/2011 3:00
433.04
11/26/2011 4:00
421.68
11/26/2011 5:00
433.59
11/26/2011 6:00
398.42
11/26/2011 7:00
290.34
11/26/2011 8:00
351.74
11/26/2011 9:00
180.02
11/26/2011 10:00
132.64
11/26/2011 11:00
50.03
11/26/2011 12:00
-78.40
11/26/2011 13:00
-84.66
11/26/2011 14:00
-74.13
11/26/2011 15:00
-11.57
11/26/2011 16:00
87.84
11/26/2011 17:00
-90.19
11/26/2011 18:00
68.44
11/26/2011 19:00
115.16
11/26/2011 20:00
167.96
11/26/2011 21:00
203.29
11/26/2011 22:00
251.05
11/26/2011 23:00
177.09
11/27/2011 0:00
107.09
11/27/2011 1:00
98.81
11/27/2011 2:00
154.16
11/27/2011 3:00
151.54
11/27/2011 4:00
108.33
11/27/2011 5:00
86.53
11/27/2011 6:00
224.07
11/27/2011 7:00
118.39
11/27/2011 8:00
153.17
11/27/2011 9:00
41.33
11/27/2011 10:00
-168.84
11/27/2011 11:00
-175.06
11/27/2011 12:00
-173.13
11/27/2011 13:00
-239.72
11/27/2011 14:00
-157.77
11/27/2011 15:00
-235.05
11/27/2011 16:00
-168.95
Docket No. ER11-1844
Exhibit No. NYI-4
Page 358 of 375
11/27/2011 17:00
-139.72
11/27/2011 18:00
22.03
11/27/2011 19:00
-73.53
11/27/2011 20:00
-19.72
11/27/2011 21:00
-164.31
11/27/2011 22:00
-339.67
11/27/2011 23:00
-124.02
11/28/2011 0:00
-121.12
11/28/2011 1:00
23.86
11/28/2011 2:00
79.84
11/28/2011 3:00
-36.38
11/28/2011 4:00
-96.78
11/28/2011 5:00
-332.85
11/28/2011 6:00
-272.69
11/28/2011 7:00
-231.19
11/28/2011 8:00
-219.00
11/28/2011 9:00
-255.98
11/28/2011 10:00
-282.80
11/28/2011 11:00
-466.44
11/28/2011 12:00
-441.35
11/28/2011 13:00
-404.16
11/28/2011 14:00
-440.90
11/28/2011 15:00
-211.92
11/28/2011 16:00
-156.77
11/28/2011 17:00
-63.63
11/28/2011 18:00
9.27
11/28/2011 19:00
103.54
11/28/2011 20:00
85.23
11/28/2011 21:00
-171.82
11/28/2011 22:00
-297.31
11/28/2011 23:00
-143.15
11/29/2011 0:00
98.50
11/29/2011 1:00
-231.01
11/29/2011 2:00
-220.31
11/29/2011 3:00
-172.90
11/29/2011 4:00
-55.62
11/29/2011 5:00
-111.13
11/29/2011 6:00
-272.84
11/29/2011 7:00
-365.99
11/29/2011 8:00
-365.03
11/29/2011 9:00
-416.18
11/29/2011 10:00
-340.52
11/29/2011 11:00
-232.91
11/29/2011 12:00
-119.02
11/29/2011 13:00
-140.06
11/29/2011 14:00
-147.50
11/29/2011 15:00
-160.01
Docket No. ER11-1844
Exhibit No. NYI-4
Page 359 of 375
11/29/2011 16:00
-278.03
11/29/2011 17:00
-376.58
11/29/2011 18:00
-182.83
11/29/2011 19:00
-289.16
11/29/2011 20:00
-127.37
11/29/2011 21:00
-198.65
11/29/2011 22:00
-493.38
11/29/2011 23:00
-332.89
11/30/2011 0:00
-214.64
11/30/2011 1:00
-31.03
11/30/2011 2:00
83.71
11/30/2011 3:00
19.48
11/30/2011 4:00
61.68
11/30/2011 5:00
11.55
11/30/2011 6:00
212.33
11/30/2011 7:00
215.52
11/30/2011 8:00
100.01
11/30/2011 9:00
-29.68
11/30/2011 10:00
-144.77
11/30/2011 11:00
-68.14
11/30/2011 12:00
27.48
11/30/2011 13:00
45.76
11/30/2011 14:00
5.99
11/30/2011 15:00
68.36
11/30/2011 16:00
120.95
11/30/2011 17:00
175.56
11/30/2011 18:00
-57.55
11/30/2011 19:00
-147.91
11/30/2011 20:00
-46.13
11/30/2011 21:00
-177.58
11/30/2011 22:00
-230.48
11/30/2011 23:00
-177.73
12/1/2011 0:00
224.04
12/1/2011 1:00
195.34
12/1/2011 2:00
36.61
12/1/2011 3:00
203.91
12/1/2011 4:00
395.48
12/1/2011 5:00
624.82
12/1/2011 6:00
874.88
12/1/2011 7:00
472.80
12/1/2011 8:00
495.68
12/1/2011 9:00
305.16
12/1/2011 10:00
-29.61
12/1/2011 11:00
-27.03
12/1/2011 12:00
44.75
12/1/2011 13:00
107.57
12/1/2011 14:00
33.69
Docket No. ER11-1844
Exhibit No. NYI-4
Page 360 of 375
12/1/2011 15:00
166.79
12/1/2011 16:00
317.77
12/1/2011 17:00
132.13
12/1/2011 18:00
7.47
12/1/2011 19:00
-58.94
12/1/2011 20:00
253.44
12/1/2011 21:00
127.95
12/1/2011 22:00
-89.77
12/1/2011 23:00
50.50
12/2/2011 0:00
-36.76
12/2/2011 1:00
59.74
12/2/2011 2:00
247.35
12/2/2011 3:00
260.95
12/2/2011 4:00
216.73
12/2/2011 5:00
9.05
12/2/2011 6:00
265.68
12/2/2011 7:00
369.02
12/2/2011 8:00
165.93
12/2/2011 9:00
97.70
12/2/2011 10:00
28.00
12/2/2011 11:00
-142.94
12/2/2011 12:00
-187.16
12/2/2011 13:00
-256.62
12/2/2011 14:00
-232.15
12/2/2011 15:00
-176.19
12/2/2011 16:00
-220.09
12/2/2011 17:00
-300.45
12/2/2011 18:00
-137.94
12/2/2011 19:00
-170.36
12/2/2011 20:00
-74.37
12/2/2011 21:00
-25.19
12/2/2011 22:00
-339.19
12/2/2011 23:00
-291.80
12/3/2011 0:00
-447.95
12/3/2011 1:00
-585.83
12/3/2011 2:00
-548.98
12/3/2011 3:00
-391.16
12/3/2011 4:00
-313.18
12/3/2011 5:00
-281.70
12/3/2011 6:00
-319.30
12/3/2011 7:00
-236.30
12/3/2011 8:00
-288.39
12/3/2011 9:00
-347.74
12/3/2011 10:00
-390.04
12/3/2011 11:00
-287.77
12/3/2011 12:00
-240.58
12/3/2011 13:00
-194.55
Docket No. ER11-1844
Exhibit No. NYI-4
Page 361 of 375
12/3/2011 14:00
-22.78
12/3/2011 15:00
-15.80
12/3/2011 16:00
-83.87
12/3/2011 17:00
-161.16
12/3/2011 18:00
-320.21
12/3/2011 19:00
-313.01
12/3/2011 20:00
-277.99
12/3/2011 21:00
-300.21
12/3/2011 22:00
-240.61
12/3/2011 23:00
-89.90
12/4/2011 0:00
-10.95
12/4/2011 1:00
-0.27
12/4/2011 2:00
60.98
12/4/2011 3:00
161.94
12/4/2011 4:00
232.49
12/4/2011 5:00
184.38
12/4/2011 6:00
330.81
12/4/2011 7:00
254.14
12/4/2011 8:00
322.74
12/4/2011 9:00
118.92
12/4/2011 10:00
138.81
12/4/2011 11:00
107.21
12/4/2011 12:00
-30.90
12/4/2011 13:00
-43.15
12/4/2011 14:00
33.97
12/4/2011 15:00
41.42
12/4/2011 16:00
-171.09
12/4/2011 17:00
-157.71
12/4/2011 18:00
-14.97
12/4/2011 19:00
38.61
12/4/2011 20:00
232.38
12/4/2011 21:00
278.92
12/4/2011 22:00
152.51
12/4/2011 23:00
-1.13
12/5/2011 0:00
292.13
12/5/2011 1:00
270.22
12/5/2011 2:00
363.33
12/5/2011 3:00
373.31
12/5/2011 4:00
434.66
12/5/2011 5:00
242.45
12/5/2011 6:00
327.91
12/5/2011 7:00
167.50
12/5/2011 8:00
99.02
12/5/2011 9:00
28.15
12/5/2011 10:00
-13.19
12/5/2011 11:00
-9.98
12/5/2011 12:00
-174.06
Docket No. ER11-1844
Exhibit No. NYI-4
Page 362 of 375
12/5/2011 13:00
-244.39
12/5/2011 14:00
-109.88
12/5/2011 15:00
-230.52
12/5/2011 16:00
-342.77
12/5/2011 17:00
-211.33
12/5/2011 18:00
-252.45
12/5/2011 19:00
-139.04
12/5/2011 20:00
-155.35
12/5/2011 21:00
-220.82
12/5/2011 22:00
-141.69
12/5/2011 23:00
136.24
12/6/2011 0:00
262.04
12/6/2011 1:00
-22.58
12/6/2011 2:00
-121.04
12/6/2011 3:00
-169.52
12/6/2011 4:00
-100.21
12/6/2011 5:00
-171.82
12/6/2011 6:00
-251.96
12/6/2011 7:00
-299.09
12/6/2011 8:00
-272.87
12/6/2011 9:00
-270.45
12/6/2011 10:00
-369.36
12/6/2011 11:00
-318.97
12/6/2011 12:00
-209.18
12/6/2011 13:00
-216.89
12/6/2011 14:00
-121.68
12/6/2011 15:00
-119.05
12/6/2011 16:00
-239.18
12/6/2011 17:00
-286.88
12/6/2011 18:00
-374.46
12/6/2011 19:00
-405.78
12/6/2011 20:00
-394.33
12/6/2011 21:00
-427.47
12/6/2011 22:00
-347.92
12/6/2011 23:00
-98.90
12/7/2011 0:00
85.26
12/7/2011 1:00
85.31
12/7/2011 2:00
99.02
12/7/2011 3:00
164.45
12/7/2011 4:00
149.47
12/7/2011 5:00
87.43
12/7/2011 6:00
-11.54
12/7/2011 7:00
-27.31
12/7/2011 8:00
28.19
12/7/2011 9:00
23.70
12/7/2011 10:00
89.65
12/7/2011 11:00
170.69
Docket No. ER11-1844
Exhibit No. NYI-4
Page 363 of 375
12/7/2011 12:00
219.87
12/7/2011 13:00
306.69
12/7/2011 14:00
262.27
12/7/2011 15:00
195.69
12/7/2011 16:00
256.44
12/7/2011 17:00
82.31
12/7/2011 18:00
-167.73
12/7/2011 19:00
-265.06
12/7/2011 20:00
-68.03
12/7/2011 21:00
-30.88
12/7/2011 22:00
-129.49
12/7/2011 23:00
-43.56
12/8/2011 0:00
-6.00
12/8/2011 1:00
-6.28
12/8/2011 2:00
87.66
12/8/2011 3:00
236.63
12/8/2011 4:00
301.36
12/8/2011 5:00
291.70
12/8/2011 6:00
72.31
12/8/2011 7:00
-3.46
12/8/2011 8:00
18.82
12/8/2011 9:00
-34.27
12/8/2011 10:00
-15.15
12/8/2011 11:00
15.84
12/8/2011 12:00
29.75
12/8/2011 13:00
-12.30
12/8/2011 14:00
141.27
12/8/2011 15:00
154.10
12/8/2011 16:00
221.93
12/8/2011 17:00
19.11
12/8/2011 18:00
-20.38
12/8/2011 19:00
18.44
12/8/2011 20:00
54.05
12/8/2011 21:00
66.22
12/8/2011 22:00
82.94
12/8/2011 23:00
74.96
12/9/2011 0:00
246.86
12/9/2011 1:00
186.77
12/9/2011 2:00
229.00
12/9/2011 3:00
274.22
12/9/2011 4:00
382.63
12/9/2011 5:00
293.46
12/9/2011 6:00
178.96
12/9/2011 7:00
92.67
12/9/2011 8:00
193.04
12/9/2011 9:00
157.78
12/9/2011 10:00
141.92
Docket No. ER11-1844
Exhibit No. NYI-4
Page 364 of 375
12/9/2011 11:00
214.58
12/9/2011 12:00
262.10
12/9/2011 13:00
142.01
12/9/2011 14:00
153.46
12/9/2011 15:00
170.32
12/9/2011 16:00
174.99
12/9/2011 17:00
157.92
12/9/2011 18:00
131.99
12/9/2011 19:00
47.30
12/9/2011 20:00
53.15
12/9/2011 21:00
20.84
12/9/2011 22:00
55.17
12/9/2011 23:00
21.29
12/10/2011 0:00
241.61
12/10/2011 1:00
378.02
12/10/2011 2:00
308.68
12/10/2011 3:00
294.55
12/10/2011 4:00
211.07
12/10/2011 5:00
68.83
12/10/2011 6:00
156.67
12/10/2011 7:00
150.67
12/10/2011 8:00
177.92
12/10/2011 9:00
135.58
12/10/2011 10:00
32.98
12/10/2011 11:00
114.59
12/10/2011 12:00
56.63
12/10/2011 13:00
-32.52
12/10/2011 14:00
19.27
12/10/2011 15:00
91.38
12/10/2011 16:00
197.04
12/10/2011 17:00
213.51
12/10/2011 18:00
166.55
12/10/2011 19:00
129.01
12/10/2011 20:00
157.95
12/10/2011 21:00
120.61
12/10/2011 22:00
367.48
12/10/2011 23:00
344.64
12/11/2011 0:00
344.91
12/11/2011 1:00
425.63
12/11/2011 2:00
456.24
12/11/2011 3:00
513.23
12/11/2011 4:00
385.96
12/11/2011 5:00
346.92
12/11/2011 6:00
288.26
12/11/2011 7:00
300.65
12/11/2011 8:00
207.78
12/11/2011 9:00
298.65
Docket No. ER11-1844
Exhibit No. NYI-4
Page 365 of 375
12/11/2011 10:00
212.97
12/11/2011 11:00
152.80
12/11/2011 12:00
130.58
12/11/2011 13:00
165.22
12/11/2011 14:00
226.43
12/11/2011 15:00
182.25
12/11/2011 16:00
228.02
12/11/2011 17:00
302.65
12/11/2011 18:00
246.48
12/11/2011 19:00
230.75
12/11/2011 20:00
245.97
12/11/2011 21:00
173.90
12/11/2011 22:00
439.28
12/11/2011 23:00
330.38
12/12/2011 0:00
374.34
12/12/2011 1:00
351.55
12/12/2011 2:00
400.05
12/12/2011 3:00
348.15
12/12/2011 4:00
473.33
12/12/2011 5:00
461.40
12/12/2011 6:00
368.09
12/12/2011 7:00
377.07
12/12/2011 8:00
557.50
12/12/2011 9:00
507.79
12/12/2011 10:00
506.29
12/12/2011 11:00
460.67
12/12/2011 12:00
494.27
12/12/2011 13:00
515.13
12/12/2011 14:00
492.01
12/12/2011 15:00
416.13
12/12/2011 16:00
448.00
12/12/2011 17:00
309.19
12/12/2011 18:00
243.51
12/12/2011 19:00
298.99
12/12/2011 20:00
352.44
12/12/2011 21:00
426.59
12/12/2011 22:00
319.08
12/12/2011 23:00
230.82
12/13/2011 0:00
429.64
12/13/2011 1:00
422.18
12/13/2011 2:00
465.84
12/13/2011 3:00
490.75
12/13/2011 4:00
555.06
12/13/2011 5:00
475.65
12/13/2011 6:00
484.88
12/13/2011 7:00
399.01
12/13/2011 8:00
324.26
Docket No. ER11-1844
Exhibit No. NYI-4
Page 366 of 375
12/13/2011 9:00
378.98
12/13/2011 10:00
351.65
12/13/2011 11:00
412.62
12/13/2011 12:00
377.92
12/13/2011 13:00
263.70
12/13/2011 14:00
243.34
12/13/2011 15:00
243.77
12/13/2011 16:00
160.63
12/13/2011 17:00
75.28
12/13/2011 18:00
41.08
12/13/2011 19:00
-19.27
12/13/2011 20:00
-74.00
12/13/2011 21:00
85.22
12/13/2011 22:00
211.36
12/13/2011 23:00
154.34
12/14/2011 0:00
237.38
12/14/2011 1:00
433.89
12/14/2011 2:00
513.64
12/14/2011 3:00
490.41
12/14/2011 4:00
596.56
12/14/2011 5:00
395.72
12/14/2011 6:00
261.92
12/14/2011 7:00
335.61
12/14/2011 8:00
292.00
12/14/2011 9:00
212.67
12/14/2011 10:00
360.38
12/14/2011 11:00
458.63
12/14/2011 12:00
476.31
12/14/2011 13:00
415.02
12/14/2011 14:00
372.86
12/14/2011 15:00
410.98
12/14/2011 16:00
321.86
12/14/2011 17:00
151.95
12/14/2011 18:00
261.16
12/14/2011 19:00
234.39
12/14/2011 20:00
-19.52
12/14/2011 21:00
55.44
12/14/2011 22:00
58.46
12/14/2011 23:00
96.65
12/15/2011 0:00
373.75
12/15/2011 1:00
487.57
12/15/2011 2:00
358.45
12/15/2011 3:00
345.12
12/15/2011 4:00
420.38
12/15/2011 5:00
274.81
12/15/2011 6:00
146.65
12/15/2011 7:00
0.99
Docket No. ER11-1844
Exhibit No. NYI-4
Page 367 of 375
12/15/2011 8:00
-105.02
12/15/2011 9:00
-157.00
12/15/2011 10:00
-155.85
12/15/2011 11:00
-91.80
12/15/2011 12:00
-35.34
12/15/2011 13:00
-112.10
12/15/2011 14:00
-187.55
12/15/2011 15:00
-69.77
12/15/2011 16:00
-323.53
12/15/2011 17:00
-694.94
12/15/2011 18:00
-335.79
12/15/2011 19:00
-245.12
12/15/2011 20:00
-192.17
12/15/2011 21:00
-262.68
12/15/2011 22:00
-280.04
12/15/2011 23:00
-109.55
12/16/2011 0:00
91.65
12/16/2011 1:00
46.47
12/16/2011 2:00
187.15
12/16/2011 3:00
169.00
12/16/2011 4:00
334.79
12/16/2011 5:00
95.56
12/16/2011 6:00
-162.50
12/16/2011 7:00
-123.61
12/16/2011 8:00
-129.35
12/16/2011 9:00
-179.04
12/16/2011 10:00
-79.30
12/16/2011 11:00
153.76
12/16/2011 12:00
155.71
12/16/2011 13:00
175.74
12/16/2011 14:00
201.08
12/16/2011 15:00
210.33
12/16/2011 16:00
354.24
12/16/2011 17:00
427.04
12/16/2011 18:00
352.85
12/16/2011 19:00
186.98
12/16/2011 20:00
93.91
12/16/2011 21:00
118.97
12/16/2011 22:00
294.82
12/16/2011 23:00
446.13
12/17/2011 0:00
594.83
12/17/2011 1:00
576.53
12/17/2011 2:00
602.28
12/17/2011 3:00
533.40
12/17/2011 4:00
343.25
12/17/2011 5:00
274.80
12/17/2011 6:00
258.11
Docket No. ER11-1844
Exhibit No. NYI-4
Page 368 of 375
12/17/2011 7:00
258.57
12/17/2011 8:00
8.10
12/17/2011 9:00
-41.09
12/17/2011 10:00
-87.93
12/17/2011 11:00
-36.21
12/17/2011 12:00
99.87
12/17/2011 13:00
92.57
12/17/2011 14:00
-8.13
12/17/2011 15:00
-96.41
12/17/2011 16:00
-90.62
12/17/2011 17:00
15.47
12/17/2011 18:00
-231.73
12/17/2011 19:00
-245.71
12/17/2011 20:00
-149.24
12/17/2011 21:00
-31.88
12/17/2011 22:00
173.93
12/17/2011 23:00
220.74
12/18/2011 0:00
541.60
12/18/2011 1:00
763.52
12/18/2011 2:00
801.37
12/18/2011 3:00
787.55
12/18/2011 4:00
647.36
12/18/2011 5:00
640.85
12/18/2011 6:00
579.65
12/18/2011 7:00
634.04
12/18/2011 8:00
461.40
12/18/2011 9:00
279.93
12/18/2011 10:00
307.66
12/18/2011 11:00
265.79
12/18/2011 12:00
304.92
12/18/2011 13:00
402.76
12/18/2011 14:00
495.21
12/18/2011 15:00
277.14
12/18/2011 16:00
164.24
12/18/2011 17:00
179.06
12/18/2011 18:00
155.51
12/18/2011 19:00
114.49
12/18/2011 20:00
223.84
12/18/2011 21:00
-1.33
12/18/2011 22:00
69.80
12/18/2011 23:00
-48.59
12/19/2011 0:00
333.39
12/19/2011 1:00
410.12
12/19/2011 2:00
383.95
12/19/2011 3:00
492.51
12/19/2011 4:00
485.95
12/19/2011 5:00
606.31
Docket No. ER11-1844
Exhibit No. NYI-4
Page 369 of 375
12/19/2011 6:00
622.57
12/19/2011 7:00
620.61
12/19/2011 8:00
419.61
12/19/2011 9:00
34.20
12/19/2011 10:00
322.02
12/19/2011 11:00
287.14
12/19/2011 12:00
330.68
12/19/2011 13:00
167.21
12/19/2011 14:00
429.90
12/19/2011 15:00
305.45
12/19/2011 16:00
278.31
12/19/2011 17:00
245.09
12/19/2011 18:00
338.74
12/19/2011 19:00
127.46
12/19/2011 20:00
67.26
12/19/2011 21:00
29.15
12/19/2011 22:00
174.50
12/19/2011 23:00
493.69
12/20/2011 0:00
284.69
12/20/2011 1:00
286.94
12/20/2011 2:00
304.63
12/20/2011 3:00
185.66
12/20/2011 4:00
221.69
12/20/2011 5:00
260.83
12/20/2011 6:00
424.11
12/20/2011 7:00
584.97
12/20/2011 8:00
401.84
12/20/2011 9:00
121.29
12/20/2011 10:00
179.77
12/20/2011 11:00
122.79
12/20/2011 12:00
115.59
12/20/2011 13:00
473.57
12/20/2011 14:00
81.91
12/20/2011 15:00
270.66
12/20/2011 16:00
148.16
12/20/2011 17:00
-72.71
12/20/2011 18:00
-113.80
12/20/2011 19:00
-79.36
12/20/2011 20:00
49.13
12/20/2011 21:00
288.20
12/20/2011 22:00
291.35
12/20/2011 23:00
280.42
12/21/2011 0:00
437.87
12/21/2011 1:00
553.45
12/21/2011 2:00
556.72
12/21/2011 3:00
432.44
12/21/2011 4:00
299.09
Docket No. ER11-1844
Exhibit No. NYI-4
Page 370 of 375
12/21/2011 5:00
93.76
12/21/2011 6:00
299.13
12/21/2011 7:00
264.01
12/21/2011 8:00
277.23
12/21/2011 9:00
328.27
12/21/2011 10:00
387.52
12/21/2011 11:00
594.40
12/21/2011 12:00
394.22
12/21/2011 13:00
579.70
12/21/2011 14:00
476.04
12/21/2011 15:00
573.50
12/21/2011 16:00
313.73
12/21/2011 17:00
83.61
12/21/2011 18:00
29.12
12/21/2011 19:00
87.46
12/21/2011 20:00
158.22
12/21/2011 21:00
-17.18
12/21/2011 22:00
89.83
12/21/2011 23:00
269.64
12/22/2011 0:00
152.63
12/22/2011 1:00
258.85
12/22/2011 2:00
144.14
12/22/2011 3:00
300.46
12/22/2011 4:00
270.47
12/22/2011 5:00
125.59
12/22/2011 6:00
19.44
12/22/2011 7:00
163.32
12/22/2011 8:00
114.88
12/22/2011 9:00
119.86
12/22/2011 10:00
44.28
12/22/2011 11:00
125.55
12/22/2011 12:00
261.71
12/22/2011 13:00
234.15
12/22/2011 14:00
282.68
12/22/2011 15:00
254.68
12/22/2011 16:00
220.45
12/22/2011 17:00
44.41
12/22/2011 18:00
241.16
12/22/2011 19:00
225.60
12/22/2011 20:00
197.50
12/22/2011 21:00
-170.80
12/22/2011 22:00
-50.65
12/22/2011 23:00
123.00
12/23/2011 0:00
193.87
12/23/2011 1:00
197.54
12/23/2011 2:00
208.62
12/23/2011 3:00
154.92
Docket No. ER11-1844
Exhibit No. NYI-4
Page 371 of 375
12/23/2011 4:00
180.57
12/23/2011 5:00
46.49
12/23/2011 6:00
86.50
12/23/2011 7:00
108.70
12/23/2011 8:00
55.32
12/23/2011 9:00
19.91
12/23/2011 10:00
20.83
12/23/2011 11:00
88.67
12/23/2011 12:00
132.48
12/23/2011 13:00
260.57
12/23/2011 14:00
279.10
12/23/2011 15:00
114.16
12/23/2011 16:00
274.67
12/23/2011 17:00
96.90
12/23/2011 18:00
81.49
12/23/2011 19:00
13.87
12/23/2011 20:00
12.76
12/23/2011 21:00
18.40
12/23/2011 22:00
159.41
12/23/2011 23:00
222.70
12/24/2011 0:00
153.39
12/24/2011 1:00
371.47
12/24/2011 2:00
463.12
12/24/2011 3:00
486.66
12/24/2011 4:00
499.79
12/24/2011 5:00
229.81
12/24/2011 6:00
188.33
12/24/2011 7:00
1.54
12/24/2011 8:00
-6.33
12/24/2011 9:00
-4.14
12/24/2011 10:00
7.85
12/24/2011 11:00
-4.76
12/24/2011 12:00
134.83
12/24/2011 13:00
209.10
12/24/2011 14:00
309.25
12/24/2011 15:00
197.70
12/24/2011 16:00
244.98
12/24/2011 17:00
184.82
12/24/2011 18:00
194.00
12/24/2011 19:00
187.62
12/24/2011 20:00
210.93
12/24/2011 21:00
85.86
12/24/2011 22:00
125.54
12/24/2011 23:00
199.99
12/25/2011 0:00
188.18
12/25/2011 1:00
217.50
12/25/2011 2:00
198.78
Docket No. ER11-1844
Exhibit No. NYI-4
Page 372 of 375
12/25/2011 3:00
126.95
12/25/2011 4:00
139.35
12/25/2011 5:00
319.88
12/25/2011 6:00
376.92
12/25/2011 7:00
362.12
12/25/2011 8:00
312.65
12/25/2011 9:00
272.21
12/25/2011 10:00
329.45
12/25/2011 11:00
103.04
12/25/2011 12:00
180.46
12/25/2011 13:00
201.12
12/25/2011 14:00
245.87
12/25/2011 15:00
201.58
12/25/2011 16:00
294.37
12/25/2011 17:00
314.11
12/25/2011 18:00
286.83
12/25/2011 19:00
288.50
12/25/2011 20:00
225.94
12/25/2011 21:00
53.75
12/25/2011 22:00
226.01
12/25/2011 23:00
345.57
12/26/2011 0:00
406.27
12/26/2011 1:00
589.56
12/26/2011 2:00
491.77
12/26/2011 3:00
322.32
12/26/2011 4:00
377.34
12/26/2011 5:00
369.34
12/26/2011 6:00
405.79
12/26/2011 7:00
253.27
12/26/2011 8:00
329.23
12/26/2011 9:00
303.57
12/26/2011 10:00
280.18
12/26/2011 11:00
234.30
12/26/2011 12:00
82.26
12/26/2011 13:00
40.63
12/26/2011 14:00
68.78
12/26/2011 15:00
31.89
12/26/2011 16:00
329.78
12/26/2011 17:00
530.08
12/26/2011 18:00
302.07
12/26/2011 19:00
206.77
12/26/2011 20:00
277.12
12/26/2011 21:00
143.25
12/26/2011 22:00
54.90
12/26/2011 23:00
86.08
12/27/2011 0:00
482.46
12/27/2011 1:00
436.99
Docket No. ER11-1844
Exhibit No. NYI-4
Page 373 of 375
12/27/2011 2:00
325.29
12/27/2011 3:00
344.93
12/27/2011 4:00
428.72
12/27/2011 5:00
627.99
12/27/2011 6:00
532.13
12/27/2011 7:00
572.71
12/27/2011 8:00
454.25
12/27/2011 9:00
412.01
12/27/2011 10:00
291.79
12/27/2011 11:00
339.55
12/27/2011 12:00
342.84
12/27/2011 13:00
347.92
12/27/2011 14:00
207.94
12/27/2011 15:00
141.52
12/27/2011 16:00
221.25
12/27/2011 17:00
426.41
12/27/2011 18:00
129.77
12/27/2011 19:00
229.91
12/27/2011 20:00
106.82
12/27/2011 21:00
190.91
12/27/2011 22:00
126.71
12/27/2011 23:00
94.41
12/28/2011 0:00
179.96
12/28/2011 1:00
198.28
12/28/2011 2:00
295.90
12/28/2011 3:00
318.70
12/28/2011 4:00
303.68
12/28/2011 5:00
318.02
12/28/2011 6:00
265.87
12/28/2011 7:00
420.53
12/28/2011 8:00
391.50
12/28/2011 9:00
333.17
12/28/2011 10:00
307.28
12/28/2011 11:00
395.28
12/28/2011 12:00
278.80
12/28/2011 13:00
248.68
12/28/2011 14:00
123.64
12/28/2011 15:00
149.52
12/28/2011 16:00
323.86
12/28/2011 17:00
261.96
12/28/2011 18:00
186.16
12/28/2011 19:00
260.14
12/28/2011 20:00
358.48
12/28/2011 21:00
106.24
12/28/2011 22:00
243.28
12/28/2011 23:00
190.27
12/29/2011 0:00
182.78
Docket No. ER11-1844
Exhibit No. NYI-4
Page 374 of 375
12/29/2011 1:00
130.24
12/29/2011 2:00
170.41
12/29/2011 3:00
173.18
12/29/2011 4:00
230.43
12/29/2011 5:00
506.99
12/29/2011 6:00
603.96
12/29/2011 7:00
594.04
12/29/2011 8:00
216.49
12/29/2011 9:00
154.02
12/29/2011 10:00
49.98
12/29/2011 11:00
173.44
12/29/2011 12:00
196.21
12/29/2011 13:00
89.29
12/29/2011 14:00
-68.88
12/29/2011 15:00
37.35
12/29/2011 16:00
111.04
12/29/2011 17:00
37.43
12/29/2011 18:00
312.88
12/29/2011 19:00
539.54
12/29/2011 20:00
567.73
12/29/2011 21:00
163.21
12/29/2011 22:00
277.22
12/29/2011 23:00
236.11
12/30/2011 0:00
60.46
12/30/2011 1:00
126.33
12/30/2011 2:00
138.59
12/30/2011 3:00
220.39
12/30/2011 4:00
99.82
12/30/2011 5:00
281.54
12/30/2011 6:00
89.31
12/30/2011 7:00
350.24
12/30/2011 8:00
288.41
12/30/2011 9:00
204.34
12/30/2011 10:00
124.92
12/30/2011 11:00
81.07
12/30/2011 12:00
89.06
12/30/2011 13:00
-24.87
12/30/2011 14:00
-13.08
12/30/2011 15:00
-61.54
12/30/2011 16:00
-148.81
12/30/2011 17:00
-75.04
12/30/2011 18:00
72.06
12/30/2011 19:00
223.34
12/30/2011 20:00
2.41
12/30/2011 21:00
-101.11
12/30/2011 22:00
-106.03
12/30/2011 23:00
165.20
Docket No. ER11-1844
Exhibit No. NYI-4
Page 375 of 375
12/31/2011 0:00
404.83
12/31/2011 1:00
111.74
12/31/2011 2:00
41.86
12/31/2011 3:00
28.12
12/31/2011 4:00
33.24
12/31/2011 5:00
120.47
12/31/2011 6:00
-90.58
12/31/2011 7:00
-171.32
12/31/2011 8:00
-208.86
12/31/2011 9:00
-2.77
12/31/2011 10:00
-47.90
12/31/2011 11:00
-5.74
12/31/2011 12:00
-104.01
12/31/2011 13:00
-67.06
12/31/2011 14:00
31.76
12/31/2011 15:00
90.44
12/31/2011 16:00
153.54
12/31/2011 17:00
266.09
12/31/2011 18:00
193.00
12/31/2011 19:00
174.52
12/31/2011 20:00
-48.77
12/31/2011 21:00
-130.08
12/31/2011 22:00
-133.33
12/31/2011 23:00
#NAME?
DOCKET NO. ER11-1844
EXHIBIT NO. NYI-5
Docket No. ER11-1844
Exhibit No. NYI-5
Page 1 of 1
NYTO/MISO 1-9. If the current rate filing is approved please explain any and all service
obligations that either MISO or ITC will have to NYISO and any circumstances under which
MISO or ITC could have financial liability to the NYISO related to the operation of the
Replacement PARs or lack thereof.
Response: MISO objects to this request to the extent it is overly broad and unduly
burdensome (i.e., “any circumstances”), presumes certain facts that do not exist or which have
not been proven, and callsfor speculation regarding legal theories involving possible claims that
NYISO may raise regarding operation of the PARs, and to the extent that the request does not
apply to MISO (i.e., “or ITC”).
Notwithstanding this objection, MISO responds that approval of the current rate filing will not
affect or alter MISO’s existing service obligations as defined under Section 38 of the MISO
Tariff and related agreements identified therein. MISO’s current limitation of liability provisions
under its Tariff (Section 10) and related agreements are unaffected by the current rate filing. At
present, NYISO is not a MISO Transmission Owner, Transmission Customer, or Market
Participant, and MISO does not have service obligations to NYISO related to these categories.
Sponsored by:
Counsel
DOCKET NO. ER11-1844
EXHIBIT NO. NYI-6
Docket No. ER11-1844
Exhibit No. NYI-6
Page 1 of 1
NYISO/MISO 3-3. Should the Commission ultimately accept MISO’s proposed tariff
revisions and require NYISO customers and PJM customers to pay for a portion of the
cost of ITC’s Replacement PARs:
a. Will the MISO and/or ITC be subject to an obligation to provide reliable
service to NYISO customers and PJM customers that are not otherwise MISO
customers?
i. If so, please identify any/all laws, regulations, FERC precedent and/or
court precedent relied on to prepare Recipient’s response to
NYISO/MISO 3-3a.
b. Identify and explain the nature of any and all service obligations MISO and/or
ITC will become subject to with regard to the NYISO customers and PJM
customers that are not otherwise MISO customers.
i. For each service obligation MISO and/or ITC will assume, identify any/all
laws, regulations, FERC precedent and/or court precedent relied on to
prepare Recipient’s response to NYISO/MISO 3-3b.
Response: No. See response to NYISO TO/MISO 1-9 which has already been provided to
NYISO on February 14, 2012.
Sponsored by:
Counsel
DOCKET NO. ER11-1844
EXHIBIT NO. NYI-7
Docket No. ER11-1844
Exhibit No. NYI-7
Page 1 of 1
NYISO/MISO 3-4. If the Replacement PARs permanently fail (not recoverable)
shortly after they enter service, should PJM customers and NYISO customers still
be required to pay for the Replacement PARs?
a. Explain your response to NYISO/MISO 3-4and identify any/all laws,
regulations, Commission precedent and/or court precedent relied on to
respond to this question.
NYISO/MISO 3-5. If the Replacement PARs require a lengthy (6 month to 2 year)
unscheduled outage, should PJM customers and NYISO customers still be
required to pay for the Replacement PARs while the Replacement PARs are out-
of-service?
a. Explain your response to NYISO/MISO 3-5 and identify any/all laws,
regulations, Commission precedent and/or court precedent relied on to
respond to this question.
NYISO/MISO 3-6. If one or more of the Hydro One PARs require a lengthy (6 month
to 2 year) unscheduled outage, should PJM customers and NYISO customers still
be required to pay for the Replacement PARs while the Hydro One PARs are out-
of-service?
a. Explain your response to NYISO/MISO 3-6 and identify any/all laws,
regulations, Commission precedent and/or court precedent relied on to
respond to this question.
NYISO/MISO 3-7. If one or more of the Hydro One PARs permanently fail (not
recoverable) shortly after the Replacement PARs enter service, should PJM
customers and NYISO customers still be required to pay for the Replacement
PARs?
a. Explain your response to NYISO/MISO 3-7 and identify any/all laws,
regulations, Commission precedent and/or court precedent relied on to
respond to this question.
DOCKET NO. ER11-1844
EXHIBIT NO. NYI-8
Docket No. ER11-1844
Exhibit No. NYI-8
Page 1 of 1
NYISO/MISO 3-4. If the Replacement PARs permanently fail (not recoverable) shortly after
they enter service, should PJM customers and NYISO customers still be required to pay
for the Replacement PARs?
a. Explain your response to NYISO/MISO 3-4and identify any/all laws,
regulations, Commission precedent and/or court precedent relied on to
respond to this question.
Response: Yes. MISO is obligated to charge the rates set forth in its Tariff. See MISO Tariff
https://www.midwestiso.org/Library/Tariff/Pages/Tariff.aspx. See also, Sections 205 and 206 of
the Federal Power Act.See also, Midwest Independent Transmission System Operator, Inc., 133
FERC ¶61,275 (2010), reh’g pending; Midwest Independent Transmission System Operator,
Inc., 134 FERC ¶61,185 (2011).
Sponsored by:
Counsel
DOCKET NO. ER11-1844
EXHIBIT NO. NYI-9
Docket No. ER11-1844
Exhibit No. NYI-9
Page 1 of 1
NYTO/ITC 1-14. Please describe what service obligation ITC would have to the NYISO or any
NYTO to the extent the NYISO or any NYTO is required to pay for any portion of the
Replacement PARs.
Response NYTO/ITC1-14: As far as ITC knows, none. This question should be addressed to
MISO.
Response prepared by Dave Grover
15
DOCKET NO. ER11-1844
EXHIBIT NO. NYI-10
Docket No. ER11-1844
Exhibit No. NYI-10
Page 1 of 14
Docket No. ER11-1844
Exhibit No. NYI-10
Page 2 of 14
Docket No. ER11-1844
Exhibit No. NYI-10
Page 3 of 14
Docket No. ER11-1844
Exhibit No. NYI-10
Page 4 of 14
Docket No. ER11-1844
Exhibit No. NYI-10
Page 5 of 14
Docket No. ER11-1844
Exhibit No. NYI-10
Page 6 of 14
Docket No. ER11-1844
Exhibit No. NYI-10
Page 7 of 14
Docket No. ER11-1844
Exhibit No. NYI-10
Page 8 of 14
Docket No. ER11-1844
Exhibit No. NYI-10
Page 9 of 14
Docket No. ER11-1844
Exhibit No. NYI-10
Page 10 of 14
Docket No. ER11-1844
Exhibit No. NYI-10
Page 11 of 14
Docket No. ER11-1844
Exhibit No. NYI-10
Page 12 of 14
Docket No. ER11-1844
Exhibit No. NYI-10
Page 13 of 14
Docket No. ER11-1844
Exhibit No. NYI-10
Page 14 of 14
DOCKET NO. ER11-1844
EXHIBIT NO. NYI-11
Docket No. ER11-1844
Exhibit No. NYI-11
Page 1 of 10
MEN-2001_Summer_Assessment_Report-body.pdf
MAAC-ECAR-NPCC Study Committee 2001 Summer MEN Interregional Transmission
System Reliability Assessment
May 2001
p26.
In March 2001 the final PAR to be installed in the Michigan-Ontario (M-O) interface
failed a factory test. In April, 2001 the in-service circuit L51D phase shifter was automatically
removed from service for an internal fault. These failures make it unlikely that the M-O PARs
will be able to provide significant inter-regional emergency assistance before the end of the 2001
summer period. The following discussion describes the sensitivity of the inter-regional transfer
capability to an unregulated Michigan-Ontario interface.
MEN01-02_Winter_Assessment_report body.pdf
2001/02 Winter MEN Interregional Transmission System Reliability Assessment
November 2001
p30.
The Michigan-Ontario interface and the Queenston Flow West (QFW) interface in
Ontario have been susceptible to large parallel flows and Transmission Loading Relief (TLR)
curtailments. This condition will continue through the 2001/2002 Winter period since completion
of the Michigan - Ontario Phase Angle Regulating (M-O PAR) project has been delayed due to
the L4D and L51D PAR failures.
MEN-2002_Summer_Assessment_Report-body.pdf
MAAC-ECAR-NPCC Study Committee 2002 Summer MEN Interregional Transmission
System Reliability Assessment.
May 2002
p9.
Another difference between the 2001 and 2002 study is the representation of the four
Ontario-Michigan Interface circuit phase angle regulators (PARs). In anticipation of their
installation, these PARs were represented in service for the summer 2001 analysis and were
utilized to assist the MEN regional power transfers. However, because of failures of some of the
PARs and delays in restoring them to service, only the Keith-Waterman 230 kV J5D
interconnection PAR is represented in the 2002 analysis.
p30. The Michigan - Ontario interface and the Queenston Flow West (QFW) interface in
Ontario have been susceptible to large parallel flows and Transmission Loading Relief (TLR)
curtailments. Delays have prevented the three new Phase Angle Regulating (PAR) transformers
on the Michigan - Ontario Interface from becoming operational.
Transformer testing failures
have impacted the Lambton PARs, L51D and L4D, and operating agreements have impeded the
B3N PAR from becoming operational. The J5D PAR is the only operating unit modeled in the
2002 Summer base case.
NPCC_Reliability_Assessment_for_Summer_2003.pdf
Northeast Power Coordinating Council Reliability Assessment For Summer 2003
May 2003
p21. The final phase angle regulator installation on the Michigan-Ontario Interface (345 kV
circuit L4D) is not expected to be completed until the end of August.
The B3N (230 kV circuit Scott - Bunce Creek) phase angle regulator was forced from service in
March 2003. The return to service of the PAR is not known at this time. This has created
additional uncertainty to the projection of having all Michigan-Ontario Interface phase angle
Docket No. ER11-1844
Exhibit No. NYI-11
Page 2 of 10
regulators in service for any portion of the summer operating period. Therefore it is assumed that
the Michigan-Ontario Ties will remain free flowing for a major portion of the study period.
summer2003.pdf
2003 SUMMER ASSESSMENT Reliability of the Bulk Electricity Supply in North America
May 2003
p9.
Michigan-Ontario Transfers (ECAR to NPCC) — The Michigan-Ontario Phase Angle
Regulator (PAR) project has been further delayed and its completion is not expected until after the
summer. This delay will reduce the transfer capability of the Michigan-Ontario interface and the
ability to control parallel flows. As a result, the Michigan-Ontario interface and the Queenston Flow
West interface in Ontario will continue to be susceptible to Transmission Loading Relief (TLR)
curtailments.
Transfers from Michigan to Ontario are expected to be reduced by about 150 MW on occasion until
about the end of July due to the forced outage of circuit B3N in Ontario as the result of a tower
failure. Transfers from Ontario to Michigan are not expected to be affected.
NPCC_Reliability_Assessment_for_Summer_2004.pdf
Northeast Power Coordinating Council Reliability Assessment For Summer 2004
May 2004
p24. Inter-Regional Transmission Adequacy
Evolution of the interconnected network is continuing in the northeastern U. S. Present plans are
for the integration of Commonwealth Edison as part of PJM’s energy market operations prior to
this summer with AEP and Dominion Resources following later in 2004.
A tower on the B3N circuit between Ontario and Michigan (230 kV circuit Scott - Bunce Creek)
was damaged in April of 2003. The options to return the circuit to service are still being
explored. At the current time, it is estimated that the circuit will not return until after the summer
operating period.
As a result, the ability to transfer energy into / out of Ontario on the Ontario- Michigan Interface
will remain the same as last summer.
The B3N phase angle regulator (PAR) was forced from service in March 2003. The return to
service of the PAR is not known at this time. Additionally, the final phase angle regulator
installation on the Michigan-Ontario Interface (Lambton-St. Clair 345 kV circuit L4D) is not
expected to be completed until the end of September. For the study period it has been assumed
that the Michigan-Ontario Ties will remain free flowing.
It is expected that the transmission system is adequate to support the anticipated Inter-Regional
transfers.
summer2004.pdf
2004 SUMMER ASSESSMENT, Reliability of the Bulk Electricity Supply in North
America. North American Electric Reliability Council
May 2004
p39. Transmission — The Ontario transmission system is expected to be adequate to supply the
coming summer’s demand under the forecast conditions.
The ability to have total control over the flows
across the Michigan-Ontario interface using the four phase-angle regulators continues to be delayed by
equipment failures and will not be available for summer 2004. In the meantime, operating guides are in
place to ensure that the interface is operated reliably.
Docket No. ER11-1844
Exhibit No. NYI-11
Page 3 of 10
The Scott-Bunce Creek 230 kV interconnection (circuit B3N) between Ontario and Michigan is currently
forced out of service. The scheduled date for its return-to-service is September 30, 2004, but further delay
could occur. This outage increases the upper import limit capability of Michigan-Ontario transfers by 200
MW in the summer and by 300 MW in the winter; the Ontario-Michigan export limit decreases by
approximately 500 MW in the summer and in the winter.
NPCC%20Reliability%20Assessment_2004-05Winter_Final_041223.pdf
Northeast Power Coordinating Council Reliability Assessment For Winter 2004/2005 Final
Report
December 17, 2004
p21. Inter-Regional Transmission Adequacy
A tower on the B3N circuit (230 kV circuit Scott - Bunce Creek) was damaged in April of 2003.
The options to return the circuit to service are still being explored. At the current time, it is
estimated that the circuit will not return during the Winter Operating Period. The capability of
this circuit has been removed from transfer capabilities identified in Diagram 1.
The final phase angle regulator is expected to be installed on the Michigan-Ontario Interface
(345 kV circuit L4D) before the end of December. Operating agreements dictating their
operation are under development.
Until the phase shifters become operational any expected
transfer capability on the Michigan - Ontario and the New York - Ontario (Niagara) interfaces
must be rationalized by the impact of Lake Erie Circulation.
Additionally, a review of the policy regarding the method in which ratings for the Michigan and
NY-Niagara interconnections are applied pre and post contingency is underway. Until the results
of this work are complete, the CO-12 Working group assumed the worst case scenario and has
identified the lowest feasible transfer capabilities in Diagram 1.
It is expected that the transmission system is adequate to support the anticipated Inter- Regional
transfers.
NPCC_Reliability_Assessment_for_Summer_2005.pdf
Northeast Power Coordinating Council Reliability Assessment For Summer 2005
April 2005
p25. Inter-Regional Transmission Adequacy
The third phase angle regulator on the Michigan - Ontario Interface (Lambton PS4) associated
with 345 kV circuit L4D (Lambton - St Clair) was placed in service in February 2005. All
counter parties to the project are working to complete a joint instruction that adheres to the
principle of schedule equals flow. Pending completion of the joint instruction, the phase angle
regulators will only be operated off neutral as a last resort to prevent load shedding.
A tower on the 230 kV circuit B3N (Bunce Creek - Scott) between Ontario and Michigan was
damaged in April of 2003, with the associated phase angle regulator failing a month earlier. This
circuit will remain out of service through this summer operating period.
Therefore until the joint instruction is completed, the ability to transfer energy into / out of
Ontario on the Ontario-Michigan Interface is assumed to be the same as experienced last
summer, until the phase shifter agreement can be completed. It is expected that the transmission
system is adequate to support the anticipated Inter-Regional transfers.
summer2005-Revised.pdf
2005 SUMMER ASSESSMENT Reliability of Bulk Electricity Supply in North America
North American Electric Reliability Council,
Docket No. ER11-1844
Exhibit No. NYI-11
Page 4 of 10
May 19, 2005
p40. There are currently three phase angle regulators (PARs) in service on the Michigan-
Ontario interface, including a new 845 MVA PAR on 230 kV circuit L4D. All three PARs are
operating at neutral tap position. An operational agreement is being negotiated with the Midwest
ISO for the operation of the PARs. Until such an agreement is in place, the PARs will only be
operated off neutral tap to prevent shedding firm load.
Due to a forced outage, the 230 kV circuit B3N (Scott Transformer Station x Bunce Creek,
Michigan) is expected to be unavailable until December 31, 2005. The B3N outage increases the
upper capability of the Michigan-to-Ontario import limit by 200 MW in the summer and by 300
MW in the winter.
The Ontario-to-Michigan export limit decreases by about 500 MW in the
summer and in the winter.
Once the B3N circuit and PAR are returned to service, the previous
limits will be restored and all four tie lines will have phase angle control.
Interregional transmission transfer capability studies have been conducted to determine levels of
external assistance that can be imported during the forecast 2005 summer peak demand.
CO12_NPCC_Reliability_Assessment_2005-06W_FINAL.pdf
Northeast Power Coordinating Council Reliability Assessment For Winter 2005 - 2006
Conducted by the NPCC CO-12 Working Group
November 2005
p26. Inter-Regional Transmission Adequacy
The phase angle regulator (PAR) installation on the Michigan - Ontario Interface (PS4 on
230 kV circuit L4D) is in-service and at neutral tap position. The 230 kV PAR on circuit
L51D (PS51) is also available and at neutral tap position. Agreement of the involved
transmission owners, Hydro One and International Transmission Company, is critical in
achieving full PAR control on the Ontario-Michigan interconnections. Until necessary
agreements are in place, PS4 and PS51 will only be operated off neutral tap to prevent
5% voltage reduction in Ontario or Michigan, to prevent shedding firm load or for
testing. Therefore it is assumed that the Michigan - Ontario Ties will remain free flowing
for the study period. Due to a forced outage, 230 kV circuit B3N (230 kV Scott - Bunce
Creek circuit) is expected to be unavailable through the study period.
caa_SIAReport_2006-EX291.pdf
ASSESSMENT SUMMARY letter to Hydro One Networks Inc. from IESO
October 27, 2006
1.0 GENERAL DESCRIPTION
B3N is a 230 kV interconnection line of 6.9 km in length connecting Scott TS and phase shifter
#3 in Bunce Creek, Michigan. A portion of the circuit was damaged on April 20, 2003 and has
been out of service since. Hydro One is proposing to reconstruct this section of the circuit using
795 kcmil ACSS (30/19) conductor instead of the original 636 kcmil ACSR (30/19) conductor
which is no longer available. The new conductor can also be operated at a higher temperature
than an ACSR conductor. The segments being replaced are the span over the river and the spans
on either side of the river span
CO12_NPCC_Reliability_Assessment_2006-07W_Final.pdf
Northeast Power Coordinating Council Reliability Assessment For Winter 2006 - 2007
Conducted by the NPCC CO-12 Working Group
Docket No. ER11-1844
Exhibit No. NYI-11
Page 5 of 10
November 2006
p22. Inter-Regional Transmission Adequacy
The phase angle regulators (PARs) on the Michigan - Ontario Interface (PS4 on 230 kVcircuit
L4D and PS51 on circuit L51D) are available but are presently by-passed, pending completion of
an agreement being negotiated with the International Transmission Company for the operation of
the PARs. Until this agreement is in place, PS4 and PS51 will only be operated off neutral tap
under emergency conditions, prior to voltage reductions or load shedding operating actions. Due
to a forced outage, 230 kV circuit B3N (230 kV Scott - Bunce Creek circuit) has been out of
service since 2003. The circuit was returned to service in November 2006 without a phase shifter
at Bunce Creek. Until a new phase shifter is installed replacing one that failed at Bunce Creek
(estimated to be 2008) and/or the agreement can be reached, it was assumed that the Michigan -
Ontario Ties will remain free flowing for the study period.
RFC-NPCC%202006-07%20Winter%20Final%20Report.pdf
Winter 2006/07 MEN Interregional Transmission System Reliability Assessment
REGIONAL APPRAISALS.
November 2006
p36.
When the assessment was conducted the B3N 230 kV circuit (Scott Transformer Station
x Bunce Creek, Michigan) was expected to be back in service by the end of 2006, however the in
service date of the PAR on B3N is unknown.
The B3N circuit was actually returned to service in
mid-November 2006 with no PAR. The return of B3N without its PAR does not significantly
improve transfer capability and thus has been omitted from this Winter NPCC-RFC study. Once
the B3N circuit and PAR are returned to service, previous limits will be restored and all
four tie lines will have phase angle control.
RFC-SERCEast_2007S_Report_Final.pdf
2007 SUMMER SERC EAST-RFC INTERREGIONAL TRANSMISSION SYSTEM
RELIABILITY ASSESSMENT.
May 2007
p30. The Michigan-Ontario PARS have not yet achieved long-term steady operation of all
units. The B3N phase shifter has failed and is modeled as out of service this summer.
The L4D
PS4 and L51D PS51 are modeled in service and can be operated off nominal tap to control flows.
The Keith-Waterman J5D is in service and regulating for a 0 MW flow.
LTRA2007.pdf
NERC 2007 Long-Term Reliability Assessment.
October 2007
p173. The Scott-Bunce Creek B3N circuit on the Michigan-Ontario interface is expected to be
fully controlled by phase angle regulators (PARs) by the summer of 2009. Facility failures
during the past few years have delayed the full operation of this circuit. A new PAR has been
ordered for the B3N circuit in Michigan, and the transmission line on that circuit has been
restored. An operational agreement is being negotiated. Until that agreement is in place, the
existing PARs on the three other Michigan-Ontario tie lines may now be used for emergency
conditions (e.g. if load shedding is pending or in a 5 percent voltage reduction case, etc.) if
needed. The PARs are intended to improve the ability to manage power flow around Lake Erie.
RFC-SERCEast_2007-08W_Report_Final.pdf
Docket No. ER11-1844
Exhibit No. NYI-11
Page 6 of 10
2007/08 WINTER SERC EAST-RFC INTERREGIONAL TRANSMISSION SYSTEM
RELIABILITY ASSESSMENT.
November 2007
p24. The Michigan-Ontario PARS have not yet achieved long-term steady operation of all
units. The B3N phase shifter has failed and is modeled as out of service this winter.
The L4D
PS4 and L51D PS51 are modeled in service and can be operated off nominal tap to control flows.
The Keith-Waterman J5D is in service and regulating for a 0 MW flow.
NPCC_Reliability_Assessment_2007-08_Winter_Final_Report.pdf
Northeast Power Coordinating Council Reliability Assessment For Winter 2007 - 2008.
November 2007
p26. Inter-Regional Transmission Adequacy
Phase angle regulators (PARs) PS4 on circuit L4D and PS51 on circuit L51D on the Michigan -
Ontario Interface are available but are currently by-passed pending an operational agreement
with Midwest ISO (MISO). An operational agreement is currently being negotiated with MISO
for the operation of the PARs. Until such an agreement is in place, PS4 and PS51 will only be
operated off neutral tap under emergency conditions, prior to voltage reductions or load shedding
operating actions. Therefore it was assumed that the Michigan - Ontario Ties will remain free
flowing for the study period. The last page of Appendix III shows transfer capabilities from
Regions external to NPCC into Ontario and New York
NERC summer2008.pdf
NERC 2008 Summer Reliability Assessment.
May 2008
p76. Phase angle regulators (PARs) are installed on three of the four Michigan to Ontario
interconnections. One PAR, on the Keith to Waterman 230 kV circuit J5D has been in service
and regulating since 1975. The other two available PARs, on circuits L51D and L4D, which had
been bypassed pending completion of agreements between the IESO, the Midwest ISO, Hydro
One and the International Transmission Company, were placed in service on April 14, 2008, and
are expected to start regulating before the summer. All parties have committed to completing the
necessary operating agreements to meet this schedule. The operation of the PARs will assist in
the management of system congestion and control of circulating flows. The fourth PAR, located
in Michigan at the Bunce Creek terminal of circuit B3N, responsible for controlling the tie flow
on the 230 kV circuit B3N, remains unavailable and is undergoing replacement.
p92. Phase Angle Regulators (PARs) are located on all major ties between northeastern PJM
and southeastern New York to help control unscheduled power flows. The Ramapo PARs in
NPCC control flow from RFC to NPCC. The Michigan-Ontario PARs have not yet achieved
long-term operation of all four units.
The B3N PAR that previously failed will still be out-of-
service this summer. An operations agreement for controlling the interface is expected to be
completed by the summer, after which the remaining three PARs are expected to control flows
(i.e. will be regulating).
2008S_SERC-East-RFC_Final_Report.pdf
2008 SUMMER SERC EAST-RFC INTERREGIONAL TRANSMISSION SYSTEM
RELIABILITY ASSESSMENT,
May 2008
Docket No. ER11-1844
Exhibit No. NYI-11
Page 7 of 10
p 26. Phase Angle Regulators (PARs) on all major ties between northeastern PJM and
southeastern New York help control unscheduled power flows through PJM resulting from non-
PJM power transfers. In all of the simulations conducted for this study, a 1000 MW wheeling
schedule was maintained through Public Service (PS). The Ramapo PARs are controlling a 454
MW flow on the 500 kV circuit from Branchburg to Ramapo as related to the interchange
between PJM and NPCC. The Michigan-Ontario PARS have not yet achieved long-term steady
operation of all units. The B3N phase shifter has failed and is modeled as out of service this
summer. The L4D PS4 and L51D PS51 are modeled in service and can be operated off nominal
tap to control flows. The Keith-Waterman J5D is in service and regulating for a 0 MW flow.
Federal Register Application To Amend Presidential Permit; International Transmission Company,
d-b-a ITCTransmission.mht
Application To Amend Presidential Permit; International Transmission Company, d/b/a
ITCTransmission
A Notice by the Energy Department on
February 10, 2009
On September 26, 2000, DOE issued a Presidential permit to International Transmission
Company (ITC) in Order No. PP-230, authorizing it to construct, operate, maintain, and connect
electric transmission facilities at the international border of the United States and Canada. Those
facilities are currently authorized by Presidential Permit No. PP-230-3 and include:Show citation
box
(1) One 230,000-volt (230-kV) transmission line, including one 675-MVA phase-shifting
transformer connecting the Bunce Creek Station, located in Marysville, Michigan, with Hydro
One's Scott Transformer Station, located in Sarnia, Ontario (identified as the B3N facility);Show
citation box
(2) One 230-kV transmission line connecting the Waterman Station, located in Detroit,
Michigan, with Hydro One's J. Clark Keith Generating Station, located in Windsor, Ontario
(identified as the J5D facility);Show citation box
(3) One 345-kV transmission line connecting the St. Clair Generating Station, located in East
China Township, Michigan, with Hydro One's Lambton Generating Station, located in Moore
Township, Ontario (identified as the L4D facility); andShow citation box
(4) One 230-kV transmission line connecting the St. Clair Generating Station with Hydro One's
Lambton Generating Station (identified as the L51D facility).Show citation box
In March 2003, the phase shifting transformer installed on the B3N facilities failed. On January
5, 2009, ITC applied to DOE to amend Presidential Permit PP-230-3 by authorizing it to replace
the failed 675-MVA transformer with two 700-MVA phase shifting transformers connected in
series.
RFC-NPCC_2014S_Report_and_Appendix_Final.pdf
RFC-NPCC Interregional Transmission System Reliability Assessment For the 2014
Summer.
December 1, 2009
Table A-2, Transmission Facility Changes Expected for 2014 Summer
Replace PAR with two 800 MVA (Summer Normal) PARS in series at Bunce Creek
Docket No. ER11-1844
Exhibit No. NYI-11
Page 8 of 10
OASIS%20B3N%20posting%20Aug%205%202010.pdf
ITCTransmission - Hydro One Interconnection Status Update
August 5, 2010
Restoration of the B3N interconnection between ITCTransmission and Hydro One Networks Inc.
of Canada was completed November 15, 2006.
The ITCTransmission Bunce Creek (B3N) Phase Angle Regulating transformer that failed in
March 2003 was retired and has been out of service since that time. The transformer has been
replaced by two (in series) Phase Angle Regulating transformers. Installation of the transformers
was complete in December 2009. Protective system work, in coordination with Hydro One, was
completed in July 2010.
ITCTransmission and Hydro One executed a new Interconnection Facilities Agreement which
became effective June 5, 2009. The Phase Angle Regulating transformers on the
ITCTransmission — Hydro One interconnections will be energized and tested to control
interconnection flows pending the receipt by ITCTransmission of an amended Presidential
Permit from the U.S. Department of Energy and completion of various contractual and
operational agreements between and among the respective Transmission Owners and Reliability
Coordinators.
Until ITCTransmission and Hydro One are authorized to begin operating the B3N Phase Angle
Regulating transformers to control flows, the Phase Angle Regulating transformers on the L4D
and L51D interconnections will remain in a by-pass mode.
RFC-NPCC_2010-2011_Winter_Assessment.pdf
2010-2011 Winter RFC-NPCC Interregional Transmission System Reliability Assessment,
December 7, 2010
p4.
5. In current real time operations, the Keith-Waterman J5D Phase Angle Regulator (PAR)
is in service and regulating. The Lambton-St. Clair L4D and L51D PARs are bypassed for
normal operations but can be used in response to emergency conditions, if necessary. The phase
angle regulator on the Scott-Bunce Creek B3N circuit is physically in place, but unavailable for
both normal and emergency operation due to a lack of an operating agreement.
p5.
6. Because the 2010-2011 winter study represents emergency conditions, the PARs for
three out of the four Michigan-Ontario interface circuits (J5D, L4D, and L51D) were modeled to
reflect their anticipated winter schedules and operation. The B3N PAR is by-passed with the
circuit modeled as a free flowing tie. This is also how this equipment was modeled for the 2008-
2009 winter study.
ERAG%20Study%20Procedure%20Manual%20v1c.pdf
ERAG Study Procedure Manual SERC East-ReliabilityFirst-NPCC (SeRN)
Midwest Reliability Organization-ReliabilityFirst-SERC West-Southwest Power Pool
(MRSwS) Version 1c:
January 23, 2012
p5.
Refer to Table A-7 “PAR Controlled Interchange” for a listing of the base case and transfer
case flows of the Phase Angle Regulating transformers (PARs) on the interface between RFC and
NPCC that are of particular concern in this study.
In this study, all four PARs on the Michigan interface were assumed to be available to control flows
anticipating that the necessary agreements would be ready for the summer of 2012.
Docket No. ER11-1844
Exhibit No. NYI-11
Page 9 of 10
Table A-6 note.
The “SCHEDULE” is the sum of the three PARS that are in service (L51D,
L4D and J5D). “By-pass” means that this phase angle regulator was by-passed because no agreement
enabling its operation has been signed.
PP-230-4%20ITCTransmission.pdf
PRESIDENTIAL PERMIT
February 24, 2012
Facilities currently authorized by Presidential Permit No. PP-2303 (issued September 2000) include:
(I)
One 230,000-volt (230-kV) transmission line, including one 675-MVA phase shifting transformer
connecting the Bunce Creek Station, located in Marysville, Michigan, with Hydro One Networks,
Inc.'s (Hydro One) Scott Transformer Station, located in Sarnia, Ontario (identified as the B3N
facility);
(2)
One 230-kV transmission line connecting the Waterman Station, located in Detroit, Michigan,
with Hydro One's J. Clark Keith Generating Station, located in Windsor, Ontario (identified as
the J5D facility);
(3)
One 345-kV transmission line connecting the St. Clair Generating Station, located in East China
Township, Michigan, with Hydro One's Lambton Generating Station, located in Moore
Township, Ontario (identified as the L4D facility); and
(4)
One 230-kV transmission line connecting the St. Clair Generating Station with Hydro One's
Lambton Generating Station (identified as the L51D facility).
In March 2003, the phase shifting transformer installed on the B3N facilities failed. On January 5, 2009,
ITC applied to DOE to amend Presidential Permit PP-230-3 by authorizing it to replace the failed 675-
MVA transformer with two 700-MVA phase shifting transformers connected in series. Because of the
complexity of the issues raised by this proceeding and in the interest of clarity, a new Presidential Permit
is being issued.
Non-Signatory Commenters
The entities that filed comments and interventions in this proceeding that were not a signatory to the
Settlement Agreement include the New York Independent System Operator (NYISO), the New York
Transmission Owners (NYTO), the Independent Electricity System Operator of Ontario (IESO), and
The Public Utilities Commission of Ohio (PUCO). NYISO filed a comment with DOE on March 9,
2009 in support of ITC's filing. On November 4, 2011, NYISO filed supplemental comments with
DOE supporting ITC's proposed operation of the PARs as well as expressed its intention to work
with ITC, MISO, and PJM to consider whether, and on what terms, NYISO is willing to participate
in the data collection arrangement. NYTO submitted a request to intervene in this proceeding on
April 5, 2011, requesting an opportunity to review the operational agreement when it became
available. As discussed above, DOE provided an opportunity for public comment on ITC's proposed
operation of the PARs by notice in the Federal Register, and NYTO did not Comment. According to
the November 4, 2011 ITC filing accompanying the Settlement Agreement, IESO, which is a
Canadian entity and not subject to U.S. jurisdiction, authorized ITC to inform DOE that it supports
the settlement and intends to voluntarily participate in the data collection process and the PARs
operational discussions. That same filing also indicated that PUCO did not oppose the Settlement
Agreement.
In regards to the Settlement Agreement, DOE appreciates the efforts of the parties to resolve their
differences and allow the installation and operation of the PARs in a manner that should better
control the Lake Erie loop flow. DOE also supports the decision to collect data regarding the impacts
of the operation of the PARs in order to achieve the best operating principles to mitigate any negative
Docket No. ER11-1844
Exhibit No. NYI-11
Page 10 of 10
impact on electric reliability. However, DOE is not in a position at this time to prejudge how it may
evaluate concerns from parties regarding changes to the operation of the PARs.
As noted in the
Settlement Agreement, nothing prevents any of the parties to this proceeding from proposing to DOE
at any time changes in the operating principles of the PARs in order to protect the reliability of the
U.S. electric transmission grid: DOE will evaluate any request at that time to determine the
appropriate manner in which to handle the matter and the best course of action to follow.
2012.03.23 Michigan-Ontario Interface Notice2.docx
Michigan-Ontario Interface Phase Angle Regulators.
March 2012
In March 2003, the ITCTransmission (“ITC”) Bunce Creek (“B3N”) Phase Angle Regulator
(“PAR”) was retired and has been out of service.
The B3N PAR was one of four PAR’s on the
Michigan-Ontario interface which, when operated together, was designed to help mitigate loop
flow in the Lake Erie region by controlling electrical flow across the Michigan-Ontario interface.
The other three PARs, owned and operated by Hydro One, are located at Lambton (L4D and
L51D) and Keith (J5D).
The retired B3N transformer has been replaced by two PARs (connected in series). Installation
of the transformers was complete in December 2009
and protective system work, in coordination
with Hydro One, was completed in July 2010.
As an international facility, regulatory authorization (Presidential Permit) from the U.S.
Department of Energy (“DOE”) is required prior to commissioning and operating the B3N PAR.
All contractual and operational agreements between ITC and Hydro One were filed with the
DOE and ITC took receipt of the amended Presidential Permit on February 24, 2012. With
operational agreements between MISO and the IESO also in place, all requirements necessary to
commission and operate the ITC B3N PAR have been fulfilled. ITC has started the process of
energizing and testing the B3N PAR, which is scheduled to be completed by EOD, April 4,
2012.
In late 2011, Hydro One removed the L4D from service due to early indications of an electrical
issue with the PAR. Testing on the L4D PAR will continue through mid-May, and the L4D PAR
is not expected to be available for use prior to the commissioning of the B3N PAR.
MISO, IESO, ITC and Hydro One have formally set 1000 hours EDT Thursday April 5, 2012 as
the target for starting coordinated operation of PARs on the Michigan-Ontario interface. The
objective of coordinated operations is to help mitigate loop flows in the Lake Erie region by
conforming actual electrical flows across the interface to scheduled electrical flows, to the
maximum extent practical.
Coordinated interface operations without the L4D PAR in service will reduce the overall
capability to control loop flow by an estimated 40-50%, which significantly reduces the time that
the interface will be fully regulated (loop flow exceeds collective ability of remaining PARs to
control flow). As a result, MISO does not intend to change the methodology for pricing
transactions scheduled across the Michigan-Ontario interface in conjunction with the start of
coordinated operations (April 5th) as originally planned. The existing pricing methodology will
remain in place until further notice.
DOCKET NO. ER11-1844
EXHIBIT NO. NYI-12
Docket No. ER11-1844
Exhibit No. NYI-12
Page 1 of 1
Docket No. ER11-1844-000
IESO Data Request Responses to
NYISO Third Set of Data Requests
Page 1 of 2
Question NYISO/IESO 3-1:
Provide an outage history for each of the Hydro One PARs from 1999-2008 identifying
all outages that were 3 months or longer in duration. In each case, please explain:
a. why the Hydro One PAR was removed from service (maintenance outage, forced
outage), and include a short explanation of reason for outage;
b. whether the Hydro One PAR had to be returned to the manufacturer for repair;
and
c. provide the duration of each reported outage.
IESO Response:
The IESO only has outage information back to January 1, 2006. For the period of
January 1, 2006 to 2008 there were no outages 3 months or longer in duration for any
of the Hydro One PARs.
Response Provided by: Nicholas Ingman, Manager, Operational Excellence
DOCKET NO. ER11-1844
EXHIBIT NO. NYI-13
Docket No. ER11-1844
Exhibit No. NYI-13
Page 1 of 1
NYISO/ITC 5-1. Were one or more of the Hydro One PARs out-of-service during the
time period when the Original PAR was in-service? If so:
a. Identify all Hydro One PARs that were out-of-service during the
time period when the Original PAR was in-service;
b. Describe the reason(s) for the outage; and
c. Identify the manufacturer, model, model number and year placed
into service for each of these Hydro One PARs.
Response to NYISO/ITC 5-1: ITC has objected to providing information regarding
the Original PAR. Nevertheless, it is ITC’s understanding that Hydro One’s L4D
and L51D PARs had not been installed at that time. ITC, however, has no further
details on the matter and does not have additional information responsive to Parts a,
b, or c of this question.
Response prepared by: Counsel
2
DOCKET NO. ER11-1844
EXHIBIT NO. NYI-14
Docket No. ER11-1844
Exhibit No. NYI-14
Page 1 of 1
DOCKET NO. ER11-1844
EXHIBIT NO. NYI-15
Docket No. ER11-1844
Exhibit No. NYI-15
Page 1 of 41
MAAC-ECAR-NPCC
Study Committee
2001 Summer
MEN Interregional Transmission System
Reliability Assessment
May 2001
NPCC
4000
4050
3550
682
392
3450
3300
2300
MAAC
ECAR
618
300
3950
30
4000+
2500
2250
VACAR
Docket No. ER11-1844
Exhibit No. NYI-15
Page 2 of 41
MAAC - ECAR - NPCC Study Committee
Mr. W. L. Harm
PJM Interconnection
MAAC
Mr. J. F. Schmitt (Chairman)
ITC/Detroit Edison Company
ECAR
Mr. J. C. Stephens
ATSI/FirstEnergy Corporation
ECAR
Mr. P. A. Roman
Northeast Power Coordinating Council
NPCC
Mr. R. W. Waldele
New York ISO
NPCC
Contributors
Mr. L. Hodge
PJM Interconnection
MAAC
Mr. D. Soulier
Hydro-Québec (TransÉnergie)
NPCC
MAAC - ECAR - NPCC Operating Studies Working Group
Mr. M. H. Gravener (Chairman) PJM Interconnection
MAAC
Mr. D. G. Leitch
Consumers Energy
ECAR
Mr. J. M. Voldrich
ATSI/FirstEnergy Corporation
ECAR
Mr. S. Burns
Independent Electricity Market Operator
NPCC
Mr. G. Eng
New York Power Authority
NPCC
Mr. K. Layman
New York ISO
NPCC
Mr. H. Q. Le
Northeast Power Coordinating Council
NPCC
Mr. P. Metsa
Hydro-Québec (TransÉnergie)
NPCC
2001 Summer MEN Interregional Transmission System Reliability Assessment
i
Docket No. ER11-1844
Exhibit No. NYI-15
Page 3 of 41
TABLE OF CONTENTS
1. Introduction
1
2. Results
A. Executive Summary
3
B. Simultaneous Transfer Capability
5
C. Discussion of Results
8
D. TLR Discussion
10
Exhibits
Figure 1A: Simultaneous Transfer Capability, MAAC to NPCC/ECAR
11
Figure 1B: Simultaneous Transfer Capability, ECAR to MAAC/NPCC
12
Figure 1C: Simultaneous Transfer Capability, NPCC to MAAC/ECAR
13
Figures 2A, 2B & 2C: Summer 2000 Study Simultaneous FCTTC
and Actual Scheduled Interchange
14
Figures 2D, 2E & 2F: Summer 2000 Study Simultaneous FCTTC
with Actual Scheduled Interchange and Tie Flow
17
Figure 3: Non-simultaneous Interregional Transfer Capability
20
Table 1: Comparison of Results (FCITC and FCTTC) with Previous Years
21
Table 2: First Contingency Incremental Transfer Capability (FCITC)
22
Figure 4: Location of Limiting Facilities
23
3. Background Information
A. Base Case Development
24
B. Study Procedure
24
4. Regional Appraisals
A. MAAC Appraisal
26
B. ECAR Appraisal
28
C. NPCC Appraisal
31
2001 Summer MEN Interregional Transmission System Reliability Assessment
ii
Docket No. ER11-1844
Exhibit No. NYI-15
Page 4 of 41
TABLE OF CONTENTS
Appendix A. System Description and Base Case Conditions
Figure A-1: Interconnection Flow Diagram
A-1
Figure A-2: MAAC Base Case Flow Diagram
A-2
Figures A-3W & A-3E: ECAR West/East Base Case Flow Diagrams
A-3
Figure A-4: NPCC Base Case Flow Diagram
A-5
Table A-1: Comparison of Base Case Transfers
A-6
Table A-2: Interregional Extraterritorial Generation & Load
A-9
Table A-3: Major Transmission Facility Changes
A-10
Table A-4: Major Generation Changes
A-12
Table A-5: PAR Controlled Interchange
A-14
Table A-6: MEN/VEM Base Case Interchange Schedules
A-15
Appendix B. Distribution Factors
Figures B-1.1 to B-1.4: Interregional Transfer Distribution Factor Diagrams
B-1
Tables B-1.1 and B-1.2: Transfer Distribution Factors
B-5
Appendix C. Regional Operating Procedures
MAAC Operating Procedures
C-1
ECAR Operating Procedures
C-2
NPCC Operating Procedures
C-3
Rating Criteria
C-4
Appendix D. Regional and Interregional Interfaces
Definitions of Interfaces
D-1
Figure D-1: Location of Interfaces
D-4
Appendix E. Definitions
Glossary of Terms
E-1
Discussion of FCITC Calculations
E-2
FCITC Calculation Examples
E-3
System Abbreviations
E-5
2001 Summer MEN Interregional Transmission System Reliability Assessment
iii
Docket No. ER11-1844
Exhibit No. NYI-15
Page 5 of 41
INTRODUCTION
Report on the MAAC-ECAR-NPCC
2001 Summer Interregional Transmission System Reliability Assessment
1. Introduction
The MAAC - ECAR - NPCC (MEN) Working Group, under the direction of the MEN Study
Committee, has conducted an appraisal of the interregional transmission system performance
among the MEN regions for the conditions expected in the 2001 Summer period. The
purpose of this study is to provide:
• an analysis of First Contingency Incremental Transfer Capabilities (FCITC) for selected
transfers which may occur simultaneously among, or through, the MEN regions.
• First Contingency Incremental Transfer Capabilities (FCITC) and First Contingency Total
Transfer Capabilities (FCTTC), as defined in Appendix E, for non-simultaneous
emergency transfers between ECAR and NPCC and between MAAC and NPCC. Once
determined, no attempts have been made to optimize transfers between regions by
changing dispatches and/or phase angle regulator settings.
• a sensitivity analysis of study results.
• an appraisal for MAAC, ECAR, and NPCC regions.
The FCITCs and FCTTCs reported in this study are calculated under a set of simulated
conditions based on a prediction of many factors which will change in daily operation of the
power system. Actual transfer capabilities will vary from those calculated. Among these
variable factors are:
• load forecasts and generation availability
• geographic distribution of load and generation
• transmission system configuration
• simultaneous inter-system power transfers
• operation based on regional requirements to respect local constraints
• control settings of Phase Angle Regulators (PARs)
Distribution factors and other operating guides are therefore included in this report to aid
system operators in the daily operation of the interconnected network.
An appraisal of the interregional system performance among the VACAR-ECAR-MAAC
(VEM) regions is presented in the companion VEM Study Committee Report: 2001 VEM
Summer Interregional Transmission System Reliability Assessment, dated May 2001.
2001 Summer MEN Interregional Transmission System Reliability Assessment
1
Docket No. ER11-1844
Exhibit No. NYI-15
Page 6 of 41
INTRODUCTION
1. Introduction (cont’d)
Available Transfer Capability vs. MEN Seasonal Study Incremental Transfer
Capability (ITC)
FERC Order 889 mandated that each US transmission provider calculate Available Transfer
Capability (ATC) and post such values to an Open Access Same Time Information System
(OASIS). FERC deferred the development of ATC methodology to NERC, which has
developed a series of technical references, including Available Transfer Capability
Definitions and Determination, which describes the methodology of calculating ATC/TTC
and the application of Transmission Reliability Margin (TRM) and the Capacity Benefit
Margin (CBM). The underlying concepts for both the ATC methodology and the
methodology used to perform MEN seasonal studies are found in the Transmission Transfer
Capability document published by NERC in 1995. These concepts include the First
Contingency Incremental Transfer Capability (FCITC) and First Contingency Total Transfer
Capability (FCTTC).
Thus, the methodology of ATC as calculated by transmission providers and the regional
transfer capabilities developed by MEN are similar. Both calculate incremental and total
transfer capabilities, with the magnitude of transfer capability based on increasing transfer
levels until transmission limits are incurred.
The primary differences between ATC calculations and the MEN study are:
• Scope: ATC is calculated by transmission providers, which generally corresponds to the
control area level; MEN studies are calculated at the NERC regional level.
• Margins: ATC determination uses margins (TRM/CBM) to provide for variation in
system operating conditions; MEN reports FCITCs without applying margins.
• Tie Capacity: ATC between adjacent control areas is limited by scheduling limits based
on the tie capacity between control areas; MEN reports inter-regional network transfer
capabilities regardless of scheduling limits between individual control areas.
• Timeframe: ATC is calculated hourly, daily, weekly, monthly; MEN studies are
conducted semi-annually based on a snapshot of anticipated conditions.
• Publishing: ATC is posted to an OASIS for use by the commercial markets; MEN study
results are published for use as an interregional reliability assessment.
2001 Summer MEN Interregional Transmission System Reliability Assessment
2
Docket No. ER11-1844
Exhibit No. NYI-15
Page 7 of 41
RESULTS
2. Results
A. E xecutive Summary
The following conclusions and observations can be made based on the results of the 2001
Summer Assessment:
1. Assuming all transmission facilities are in service, power flows on the MAAC, ECAR,
and NPCC bulk power transmission systems are within acceptable limits for the base case
power transfers (Appendix A, Table A-1). Also, assuming all operating procedures are
appropriately employed, no single contingency on the bulk power transmission system will
overload the remaining facilities, which are significantly affected by the transfers reported
in this study. After a single contingency, voltage levels can be maintained within
acceptable limits.
2. Compared to the 2000 Summer Operating Study, changes in base conditions have
occurred and the net effect of these changes impact to varying degrees the loading on
critical interfaces and facilities. Section 2.C, as well as Appendix A, Tables 1, A-1 and A-
5, provide some year-to-year comparisons. Major changes in Base Case modeling from
the 2000 Summer Transmission Assessment to the 2001 Summer Base Case include:
Additions:
• Michigan-Ontario Interface PAR status (Note: see the NPCC Appraisal for the
expected status and sensitivity analysis of the M-O PARs)
� Scott - Bunce Creek B3N is in service
� Lambton - St. Clair L4D is in service
� Lambton - St. Clair L51D is in service
� Keith - Waterman J5D is in service
• Approximately 2500 MW of generation capacity additions within MAAC, of
which approximately 2000 MW are new generation facilities
• Approximately 4500 MW of new generation within ECAR
• Approximately 3800 MW of new generation within NPCC
Returned to Service:
• ECAR: D. C. Cook Nuclear Unit 1 (1000 MW) is returned to service
2001 Summer MEN Interregional Transmission System Reliability Assessment
3
Docket No. ER11-1844
Exhibit No. NYI-15
Page 8 of 41
RESULTS
A. Executive Summary (cont’d)
3.
Figures 1A, 1B and 1C are plots of the FCTTC limits between MAAC, ECAR and NPCC
during simultaneous transfers. Table 1 presents the first reported FCITCs and the
corresponding FCTTCs between MAAC and NPCC and between ECAR and NPCC, as
well as direct comparisons between the FCTTCs obtained in this study to those
determined in the previous two summer assessments. Table 2 details the 2001 Summer
FCITCs between MAAC and NPCC and between ECAR and NPCC. All transfer limits
presented in this report have been rounded down to the nearest 50 MW. The following
facilities may be thermal limits for regional transfers:
Homer City 345/230 kV
Scott - Buchanan 220 kV
Glade - Glade Tap 230 kV
North Meshoppen 230/115 kV
Homer City - Shelocta 230 kV
Erie West 345/115 kV
Erie South - Erie East 230 kV
4.
Based on the analysis documented in this study, transfer limits changed as follows:
FCTTC Change
Transfer Path
from 2000 Summer
NPCC to MAAC
700 MW higher
NPCC to ECAR
900 MW higher
MAAC to NPCC
1100 MW higher
ECAR to NPCC
200 MW lower
The primary reason for changes in FCTTC as compared to the 2000 Summer study is the
modeling of the Michigan-Ontario PARs. General causes for the increase in FCTTC
include changes in base transfers and study transfer dispatches that affect the loading on
critical interfaces and facilities in the MEN/VEM base case.
Dynamic Security
As part of its ongoing responsibility, the MEN Study Committee has reviewed the results of
dynamic security assessments that have been recently conducted. These assessments include
the MEN 1998 Summer Peak Load Dynamic Study and the dynamic assessment conducted as
part of the Michigan-Ontario PAR analysis by OHSC for NPCC. Based on this review the
Study Committee concludes that the MEN interconnected network is expected to be
dynamically secure at the steady state transfer limits for Summer 2001.
2001 Summer MEN Interregional Transmission System Reliability Assessment
4
Docket No. ER11-1844
Exhibit No. NYI-15
Page 9 of 41
RESULTS
B. Simultaneous Transfer Capability
The simultaneous transfer capability plots (Figures 1A, 1B and 1C) graphically portray the
anticipated effect on transfer capability when one system is simultaneously transferring
power to or from two separate systems. They reveal how the sensitivity of a particular
system limit to one transfer differs from the same limit’s sensitivity to the other transfer.
These results are based on linear analysis, while actual system performance is influenced
by a number of nonlinear factors.
The results of this analysis stress the continued need for close coordination and
communication among the users of the interconnected systems in order to maximize the
utilization of the network without jeopardizing its reliability.
Figure 1A shows the simultaneous transfers between MAAC and its adjacent regions
NPCC and ECAR. Figure 1B shows the simultaneous transfers between ECAR and its
adjacent regions MAAC and NPCC. Figure 1C shows the simultaneous transfers between
NPCC and its adjacent regions MAAC and ECAR.
In the simultaneous transfer plots, the cross-hair symbol represents the base case level of
transfers between the study region and each of the two adjacent regions. The shaded area
represents different combinations of simultaneous transfers between the study system and
each of the adjacent regions, at which the system can be operated reliably without
encountering any pre-contingency or post-contingency overloads. The dark solid lines
represent points at which the first limit to transfers would be expected to be encountered as
transfers increase from the base case levels. The dashed lines represent points at which a
pre-contingency or post-contingency overload would be expected to occur at levels of
transfers beyond the first limit.
Interpretation of the simultaneous transfer plots is best illustrated with an example.
Referring to Figure 1C, the NPCC to MAAC/ECAR Simultaneous Transfer Capability
plot, the crosshairs indicate that the base case contains transfers of 392 MW from MAAC
to NPCC (-392 on the abscissa) and 682 MW from NPCC to ECAR (+682 on the
ordinate). From this base case operating point, holding the base transfers from NPCC to
ECAR constant at +682 MW, transfers from NPCC to MAAC may be increased to 3050
MW before encountering the Homer City transformer limit (Line A). This correlates with
the results in Table 1 under “NPCC-MAAC”. However, if the transfers from ECAR to
NPCC are changed to 300 MW (-300 on the ordinate), simultaneous transfers from NPCC
to MAAC may be as high as 3900 MW before encountering the limits for both the Homer
City transformer and the Glade - Glade Tap line (at the intersection of lines A and B).
Simultaneous schedules which plot within the shaded area of the respective Simultaneous
Transfer Capability plots will not overload any of the limiting facilities in the study model.
2001 Summer MEN Interregional Transmission System Reliability Assessment
5
Docket No. ER11-1844
Exhibit No. NYI-15
Page 10 of 41
RESULTS
B. Simultaneous Transfer Capability (cont’d)
Retrospective on Summer 2000 FCTTC vs. Actual Scheduled Interchange
Figures 2A, 2B and 2C compare MEN 2000 Summer study results to the actual
interregional transfer schedules by superimposing the schedules on the Simultaneous
Transfer Capability results from the study. These plots provide a sense of validity to the
limits being identified by the study and verification of selection of the base case operating
point. Each data point represents one day, and is the hourly-integrated, aggregate regional
scheduled interchange for hour ending 1700, weekdays, 6/1/00 to 8/31/00.
From an overall perspective, the plots provide an indication of the magnitude of regional
market activity during the summer of 2000. Weather patterns across the MEN region were
such that a large diversity existed between individual company peak loads. One result of
this diversity was a wide variation in simultaneous power exchanges between the MEN
regions. The MAAC region experienced all combinations of imports and exports with
ECAR and NPCC. However, the highest concentration of points is in the lower left
quadrant (see Figure 2A), indicating simultaneous imports from both ECAR and NPCC.
The ECAR and NPCC plots (Figures 2B and 2C, respectively) show the prevalence of
simultaneously exporting to MAAC, while showing more limited scheduling activity
between themselves, with NPCC generally exporting to ECAR between 300 to 650 MW. It
should be noted that Figures 2B and 2C can only show scheduling activity between ECAR
and NPCC over the Michigan-Ontario interface; scheduling activity between ECAR and
NPCC through MAAC can best be discerned in Figure 2A.
As the vast majority of data points lie within the shaded boundaries, the thermal and
voltage limits identified by the study seem to have valid correspondence with actual
scheduling activity, which is coupled to the availability of transmission service. Two
points lie outside the shaded areas, and are most easily seen on Figure 2A (MAAC to
NPCC/ECAR). The first point outside the shaded area is above the boundary defined by
the Dumont 765/345 kV transformer limit and corresponds to 6/14/00. This day was
characterized by heavy MAAC exports to ECAR to support the summer peak of several
ECAR companies. The Dumont 765/345 kV transformer did not limit the MAAC exports
due to the fact that Cook unit #2, connected on the high side of the Cook 765/345 kV
transformer, was out of service.
The second point outside of the shaded area on Figure 2A occurred on 8/3/00, and the
boundary exceeded is a voltage limit (Bedington - Doubs 500 kV for L/O Mt. Storm -
Doubs 500 kV). In MAAC this reflects a day of high economic purchases from ECAR that
occurred within a week of MAAC’s summer peak on 8/8/00. The voltage limit depicted on
the plot is highly dependent on the availability of units in western MAAC and eastern
ECAR, and the particular unit availability provided sufficient reactive support to facilitate
this simultaneous transfer.
2001 Summer MEN Interregional Transmission System Reliability Assessment
6
Docket No. ER11-1844
Exhibit No. NYI-15
Page 11 of 41
RESULTS
B. Simultaneous Transfer Capability (cont’d)
Retrospective on Summer 2000 Circulation
Figures 2D, 2E and 2F compare scheduled interregional transfers to actual interregional tie
flow, superimposed on the Simultaneous Transfer Capability results from the MEN 2000
Summer study. By incorporating actual interregional tie flow, these plots further the goals
of Figures 2A, 2B and 2C by providing a means of visually portraying the circulating, or
loop, flows that occur among the MEN and neighboring regions, as well as verification of
the Interregional Transfer Distribution Factors portrayed in Figures B-1.1 to B-1.4. Each
data pair joined by a connecting line represents one day - the “plus-signs” being the
hourly-integrated, aggregate regional scheduled interchange, the “zeros” being the hourly-
integrated, aggregate regional tie flow - for hour ending 1700, weekdays, 7/1/00 to
7/31/00.
The actual circulating flows experienced by the MEN systems last July generally consisted
of the following elements:
• Counter-clockwise Lake Erie flow throughout the MEN systems
• SERC to MAAC transfers utilizing ECAR systems
The MAAC region generally experienced flows higher than scheduled imports from
ECAR and exports to NPCC. Using Figure 2D, this places the actual interregional tie flow
(‘0’) down and to the right of the schedule (‘+’). The counter-clockwise Lake Erie
circulation adds to the already increased ECAR to MAAC flows, and also increases the
MAAC to NPCC flow above schedule. Flow higher than scheduled imports from ECAR to
MAAC are composed primarily of SERC to MAAC transfers utilizing the ties between
ECAR and MAAC for a sizable portion of their transfers. On the other hand, NPCC to
MAAC flows were generally less than scheduled.
ECAR (Figure 2E) experienced higher flows than scheduled imports from NPCC and
higher export flows than scheduled to MAAC, the majority of which consisted of Lake
Erie circulation utilizing the NPCC to ECAR and then the MAAC to NPCC paths. SERC
to MAAC transfers also utilized the ties between ECAR and MAAC for a sizable portion
of their transfers.
The highest magnitude of circulating flow can be seen in the NPCC plot (Figure 2F), and
is purely composed of the Lake Erie circulation: higher flows than scheduled exports from
NPCC to ECAR and flow higher than scheduled imports from MAAC to NPCC. The
Phase Angle Regulating transformers being added on the Michigan-Ontario interface will
mitigate Lake Erie circulation.
2001 Summer MEN Interregional Transmission System Reliability Assessment
7
Docket No. ER11-1844
Exhibit No. NYI-15
Page 12 of 41
RESULTS
C. D iscussion of Results
The FCTTCs and FCITCs calculated were determined for peak load conditions as
presently forecasted and with mainly firm, capacity backed transfers. It should be noted
that the FCTTCs and FCITCs are used only as indicators of the relative strength of the
interconnected system. They cannot be used as absolute indices of operating capability of
the system because they are determined for the one set of specific conditions represented
in this study. Any changes to the system condition, such as variations in generation
dispatch or simultaneous transfers that are not modeled in this study, can significantly
affect transfer capabilities.
As noted earlier, the FCITCs and FCTTCs represent a possible method to compare and
measure the relative strength of the system from one season or appraisal period to the next.
Hence, a comparison of the FCTTC values determined for this summer and the
corresponding values determined for the previous two summers are provided in Table 1.
Due to the integrated nature of the bulk supply network, power transfers between areas can
result in incremental power flows throughout all three MEN regions. In some cases, the
resulting power flow through a part of the region not involved in the transfer can be
significant.
When considered by themselves, these transfers may not appear to pose a problem within
the maximum permissible transfer value. But for certain combinations of simultaneous
power transfers, portions of the interconnected network could experience significant power
flow increases when the response to the transfer is in the same direction.
Conversely, a transaction may also decrease the prevailing flow and allow for increased
transfers. The responsiveness of selected elements within the MEN network to multiple
transfers can be evaluated by use of the transfer response factors given in Appendix B.
Using superposition, these tables enable the calculation of the power flows on facilities
and interfaces for combinations of simultaneous transfers. These response characteristics
demonstrate the possibility for strong interaction among certain transfers.
Voltage limits are recognized by use of proxy thermal limits to determine interregional
transfer capabilities. None of the FCITCs reported in Tables 1 and 2 are voltage-limited.
2001 Summer MEN Interregional Transmission System Reliability Assessment
8
Docket No. ER11-1844
Exhibit No. NYI-15
Page 13 of 41
RESULTS
C. D iscussion of Results (cont’d)
Comparison of 2001 Summer Results with 2000 Summer Results
The following discussion of differences between the 2001 Summer and 2000 Summer
FCTTCs is based principally on the results presented in Table 1.
The use of the FCTTC values to compare results from one time period to another, as
opposed to using the FCITCs, is deemed more appropriate to capture the effect of variation
in base case transfers. The FCTTC values used in the comparison are the algebraic sums
of the FCITC values and the appropriate total interregional base case transfers.
NPCC Export Limits
NPCC to MAAC
The increase in the reported NPCC to MAAC transfer capability of 700 MW can be
attributed primarily to the increased ability to control pre-contingency flow on bulk power
facilities due to the installation of the Michigan-Ontario PARs. The redirection of NPCC
to MAAC flows through ECAR result in decreased transfer distribution factors through
limiting facilities.
NPCC to ECAR
The increase in the reported NPCC to ECAR transfer capability of 900 MW can be
primarily attributed to the return to service of Cook unit #1. This removes the Dumont
765/345 kV transformer limit for the loss of the Cook 765/345 kV transformer which was
experienced last summer.
NPCC Import Limits
MAAC to NPCC
The increase in the reported MAAC to NPCC transfer capability of 1100 MW can be
attributed primarily to the modeling of the Michigan-Ontario PARs to support transfers.
This redistribution of MAAC to NPCC flows unloads facilities along the northern
PJM/NYISO interface, resulting in higher transfer capability.
ECAR to NPCC
The decrease in the reported ECAR to NPCC transfer capability of 200 MW can be
attributed to the modeling of the Michigan-Ontario PARs to support transfers. This
redistribution of ECAR to NPCC flows, in addition to higher generation levels modeled at
Lambton, results in IMO facilities overloading before facilities along the northern
PJM/NYISO interface.
2001 Summer MEN Interregional Transmission System Reliability Assessment
9
Docket No. ER11-1844
Exhibit No. NYI-15
Page 14 of 41
RESULTS
D. TLR Discussion
The NERC Transmission Loading Relief (TLR) procedure has been implemented as an
interconnection-wide procedure to properly identify the causes of adverse parallel flows
and to assist in their relief in the event of thermal, voltage or stability limitations.
TLR has supplemented local coordination procedures between some control areas, one of
which is the AP/PJM/VP Reliability Coordination Plan (RCP). The RCP was designed to
limit west-to-east economic flows into the Mid-Atlantic region for voltage limitations on
the interconnected 500 kV system. The methodology of calculating RCP limits - a voltage
proxy applied as thermal limits to transmission lines - has been incorporated into the TLR
procedure.
The MEN 2001 Summer study did not identify any limiting facilities that correlate to those
that activated 2000 summer TLR procedures. 2000 summer load was relatively mild, with
well-diversified peaking among the control areas that comprise the MEN regions, and few,
if any, control areas establishing new all-time peak loads.
2001 Summer MEN Interregional Transmission System Reliability Assessment
10
Docket No. ER11-1844
Exhibit No. NYI-15
Page 15 of 41
RESULTS
Figure 1A
Simultaneous Transfer Capability - MAAC to NPCC/ECAR
(see discussion under “Results, Simultaneous Transfer Capability”)
2001 Summer MEN Interregional Transmission System Reliability Assessment
11
Docket No. ER11-1844
Exhibit No. NYI-15
Page 16 of 41
RESULTS
Figure 1B
Simultaneous Transfer Capability - ECAR to MAAC/NPCC
(see discussion under “Results, Simultaneous Transfer Capability”)
2001 Summer MEN Interregional Transmission System Reliability Assessment
12
Docket No. ER11-1844
Exhibit No. NYI-15
Page 17 of 41
RESULTS
Figure 1C
Simultaneous Transfer Capability - NPCC to MAAC/ECAR
(see discussion under “Results, Simultaneous Transfer Capability”)
2001 Summer MEN Interregional Transmission System Reliability Assessment
13
Docket No. ER11-1844
Exhibit No. NYI-15
Page 18 of 41
RESULTS
Figure 2A
2000 Summer Study Simultaneous FCTTC
and Actual Scheduled Interchange (’+’)
MAAC to NPCC/ECAR
2001 Summer MEN Interregional Transmission System Reliability Assessment
14
Docket No. ER11-1844
Exhibit No. NYI-15
Page 19 of 41
RESULTS
Figure 2B
2000 Summer Study Simultaneous FCTTC
and Actual Scheduled Interchange (’+’)
ECAR to MAAC/ NPCC
2001 Summer MEN Interregional Transmission System Reliability Assessment
15
Docket No. ER11-1844
Exhibit No. NYI-15
Page 20 of 41
RESULTS
Figure 2C
2000 Summer Study Simultaneous FCTTC
and Actual Scheduled Interchange (’+’)
NPCC to MAAC/ECAR
2001 Summer MEN Interregional Transmission System Reliability Assessment
16
Docket No. ER11-1844
Exhibit No. NYI-15
Page 21 of 41
RESULTS
Figure 2D
2000 Summer Study Simultaneous FCTTC
with Actual Scheduled Interchange ('+') and Tie Flow (‘0’)
MAAC to NPCC/ECAR
2001 Summer MEN Interregional Transmission System Reliability Assessment
17
Docket No. ER11-1844
Exhibit No. NYI-15
Page 22 of 41
RESULTS
Figure 2E
2000 Summer Study Simultaneous FCTTC
with Actual Scheduled Interchange ('+') and Tie Flow (‘0’)
ECAR to MAAC/NPCC
2001 Summer MEN Interregional Transmission System Reliability Assessment
18
Docket No. ER11-1844
Exhibit No. NYI-15
Page 23 of 41
RESULTS
Figure 2F
2000 Summer Study Simultaneous FCTTC
with Actual Scheduled Interchange ('+') and Tie Flow (‘0’)
NPCC to MAAC/ECAR
2001 Summer MEN Interregional Transmission System Reliability Assessment
19
Docket No. ER11-1844
Exhibit No. NYI-15
Page 24 of 41
RESULTS
Figure 3
Non-simultaneous Interregional Transfer Capability
NPCC
4000
4050
3550
682
392
3450
3300
2300
MAIN
MAAC
19
ECAR
618
300
3950
30
4000+
144
2500
2250
VACAR
REMAINDER OF SERC
(Excluding SEPA Generation)
36
First Contingency
Incremental Transfer
This figure includes values obtained from the companion
Capability (FCITC)
2001 Summer VEM Interregional Transmission System
Reliability Assessment
Base Scheduled
Power Interchanges
(see Appendix A, Table A-1)
2001 Summer MEN Interregional Transmission System Reliability Assessment
20
Docket No. ER11-1844
Exhibit No. NYI-15
Page 25 of 41
RESULTS
Table 1
Comparison of Results (FCITC and FCTTC) with Previous Years
Transfer
FCITC
FCTTC
Limiting Facility
Contingency
NPCC - MAAC
2001 Summer
3450
3050
Homer City 345/230 kV #2 (GPU)
Homer City 345/230 kV #1 (GPU)
2000 Summer
2800
2350
1Homer City - Shelocta 230 kV (GPU)
Base Case - No Contingency
1999 Summer
3150
2250
1Homer City 345/230 kV #2 (GPU)
Homer City 345/230 kV #1 (GPU)
NPCC - ECAR
2001 Summer
3550
4200
2Erie South - Erie East 230 kV (GPU)
Erie West - Wayne 345 kV (GPU)
2000 Summer
2650
3300
3Dumont 765/345 kV (AEP)
Cook 765/345 kV (AEP)
1999 Summer
4050
4700
1Lambton - St. Clair L51D 345 kV (IMO/MECS)
Base Case - No Contingency
MAAC - NPCC
2001 Summer
4050
4400
4Scott - Buchanan N22W 220 kV (IMO)
Scott - Buchanan N21W 220 kV (IMO)
2000 Summer
2850
3300
5North Meshoppen 230/115 kV (GPU)
Base Case - No Contingency
1999 Summer
2600
3500
5North Meshoppen 230/115 kV (GPU)
Homer City - Watercure 345 kV (GPU/NYSEG)
ECAR - NPCC
2001 Summer
4000
3300
4Scott - Buchanan N22W 220 kV (IMO)
Scott - Buchanan N21W 220 kV (IMO)
2000 Summer
4200
3500
5North Meshoppen 230/115 kV (GPU)
Homer City - Watercure 345 kV (GPU/NYSEG)
1999 Summer
2800
2100
5North Meshoppen 230/115 kV (GPU)
Homer City - Watercure 345 kV (GPU/NYSEG)
1.
Blairsville - Social Hall, East Sayre - North Waverly and Laurel Lake - Goudey circuits opened.
2.
Blairsville - Social Hall circuit opened.
3.
Blairsville - Social Hall and East Sayre - North Waverly circuits opened.
4.
Warren - Falconer and East Sayre - North Waverly circuits opened.
5.
Warren - Falconer circuit opened.
2001 Summer MEN Interregional Transmission System Reliability Assessment
21
Docket No. ER11-1844
Exhibit No. NYI-15
Page 26 of 41
RESULTS
Table 2
First Contingency Incremental Transfer Capability (FCITC)
4000 MW Transfer Level
FCITC
Limiting Facility / Contingency
Rating
TDF
ODF
OTF
Unless Otherwise Noted
(MVA)
%
%
%
NPCC - MAAC
3450
1Homer City 345/230 kV #2 (GPU) /
699
9.8
81.9
18.1
Homer City 345/230 kV #1 (GPU)
10.1
4200
2Glade - Glade Tap 230 kV (GPU) / No Contingency
492
5.2
---
---
4400
2Homer City - Shelocta 230 kV (GPU) /
854
13.5
30.5
13.6
Erie West - Wayne 345 kV (GPU)
1.4
NPCC - ECAR
3550
3Erie South - Erie East 230 kV (GPU) /
554
11.0
12.0
11.9
Erie West - Wayne 345 kV (GPU)
5.6
4050
3Homer City - Shelocta 230 kV (GPU) /
854
9.9
29.3
15.5
Erie West - Ashtabula - Perry 345 kV (GPU/FE)
19.2
4350
3Homer City 345/230 kV #2 (GPU) /
699
6.1
82.2
11.1
Homer City 345/230 kV #1 (GPU)
6.2
MAAC - NPCC
4050
4Scott - Buchanan N22W 220 kV (IMO) /
550
5.8
43.2
8.3
Scott - Buchanan N21W 220 kV (IMO)
5.8
4200
4North Meshoppen 230/115 kV (GPU) / No Contingency
136
4.4
---
---
ECAR - NPCC
4000
4Scott - Buchanan N22W 220 kV (IMO) /
550
7.3
43.0
10.4
Scott - Buchanan N21W 220 kV (IMO)
7.3
4650
4Erie West 345/115 kV (GPU) /
285
1.3
32.1
4.6
Erie West - Erie South 345 kV (GPU)
10.2
1.
3000 MW Transfer Level.
2.
East Sayre - North Waverly and Laurel Lake - Goudey circuits opened.
3.
Blairsville - Social Hall circuit opened.
4.
Warren - Falconer and East Sayre - North Waverly circuits opened.
2001 Summer MEN Interregional Transmission System Reliability Assessment
22
Docket No. ER11-1844
Exhibit No. NYI-15
Page 27 of 41
RESULTS
Figure 4
Location of Limiting Facilities
Scott
Buchanan
Erie East
Erie South
Glade
N. Meshoppen
Glade Tap
Erie West
Keystone
Shelocta
Homer City
Limitations
Transformer
Circuit
2001 Summer MEN Interregional Transmission System Reliability Assessment
23
Docket No. ER11-1844
Exhibit No. NYI-15
Page 28 of 41
BACKGROUND INFORMATION
3.
Background Information
Information regarding the basis for the analysis, the simulated test scenarios and the study
procedure are discussed in this section in order to help the reader understand how the
limitations were calculated in this assessment and to properly interpret the results
presented in this report.
A. B ase Case Development
The 2001 Summer Assessment base case was developed from the NERC/MMWG
2001 Summer peak load base case, which generally modeled firm, capacity backed
transfers. This case was updated with the most recent transmission system status
information and projected transfers. Appendix A provides information regarding the
expected 2001 summer system conditions. Table A-1 lists the transfers modeled in
this summer assessment as compared to those modeled in the 2000 Summer
assessment. The appendix includes a diagram of interregional and subregional ties,
interregional and subregional tie flows, regional flow diagrams, major EHV
generation and transmission additions, and phase angle regulator test settings.
B. Study Procedure
To examine the ability of the MEN network to support transfers between the member
regions, 4000 MW test transfer cases were developed for each of the four transfers
studied. In addition, a 3000 MW test transfer case was developed to establish NPCC
to MAAC transfer capability. Each test transfer case was created by imposing the test
transfer on the base case and making the necessary system adjustments required to
support the transfer. Linear analysis, which utilizes linear transfer response and
outage response factors, was used to screen the transmission system modeled in the
test transfer base cases. For the first transfer limit stated for each transfer analyzed,
the value reported was further verified by conventional AC load flow analysis. Once
determined, no attempts were made to optimize transfers between regions by
changing dispatches and/or phase angle regulator settings.
Ratings used in the determination of transfer capabilities include the following:
• The thermal facility ratings and bus voltages that are actually used in system
operations.
• Aggregate interface or line flows used to monitor stability or voltage performance.
Phase Angle Regulator (PAR) control is used on the four 345 kV ties and one 230 kV
tie between the Consolidated Edison Company (CON ED) and the Public Service
Electric and Gas Company (PSEG) to maintain an alternative transmission path
through the northern part of PSEG at Waldwick and into CON ED at Farragut and
Goethals. Power flow on the Branchburg (PSEG)-Ramapo (CON ED) 500 kV
interconnection is controlled by PARs
2001 Summer MEN Interregional Transmission System Reliability Assessment
24
Docket No. ER11-1844
Exhibit No. NYI-15
Page 29 of 41
BACKGROUND INFORMATION
B. Study Procedure (cont’d)
at Ramapo in accordance with the PJM/NYPP Unscheduled Transmission Service
Agreement between PJM and the New York Power Pool (NYISO). As defined by this
agreement, the PARs are adjusted in accordance with appropriate operating
agreements and instructions to relieve transmission and/or capacity limitations, which
may arise in either PJM or NYISO.
The Ramapo PARs are set to import 1000 MW (from Branchburg) for all NPCC
import simulations and to export 1000 MW (to Branchburg) for all NPCC export
simulations. In the base case, the Ramapo PAR scheduled flow is 530 MW from
Branchburg to Ramapo as compared to 550 MW in the 2000 Summer Assessment.
PAR control is also used between Ontario (NPCC) and Michigan (ECAR) to increase
transfer capability between NPCC and ECAR and to alleviate limit violations in these
areas. In the transfer cases, the Michigan-Ontario PARs are set to import 1000 MW
(from Michigan) for all NPCC import simulations and to export 2000 MW (to
Michigan) for all NPCC export simulations. Once the transfer base cases are built, the
Michigan-Ontario PARs are allowed to spill-over to support the generation shift when
determining the FCITCs. In the base case, the Michigan-Ontario PAR scheduled flow
is 600 MW from Ontario to Michigan. Table A-5 tabulates the PAR controlled
interchange for this summer study and for the 2000 Summer study.
Transfer response factors (see Tables B-1.1 through B-1.5) for selected interfaces and
transmission facilities were calculated for various transactions. Line outage
distribution factors (see Tables B-1.1 and B-1.2) were also determined for selected
transmission facilities. These factors provide a means of investigating the impact of
emergency transfers (either alone or in combination with other transfers) or a
variation in one of the economy transfers included in the base case.
For both NPCC export and import simulations, the proportion assumed in this study is
50% by NYISO and 50% by IMO.
The MEN Study Committee recognizes that a parallel effort is being pursued by
NERC to calculate Power Transfer Distribution Factors (PTDFs) to support the
Transmission Line Loading Relief (TLR) procedures. The PTDFs are calculated for a
set of defined Flowgates in response to specific source-sink Control Area transfers.
Apart from a very small number of the Flowgates, which are essentially the same as
some of the interfaces assessed in the MEN appraisal, the majority of the monitored
elements are very different. The parallel MEN and NERC efforts are therefore very
different in scope, products and users, and as such do not participate in any
overlapping effort. The MEN Study Committee thus holds the opinion that the
various sets of factors produced in the seasonal appraisal continues to be required as a
distinct effort, which provides significant value to the MEN system operation
community.
2001 Summer MEN Interregional Transmission System Reliability Assessment
25
Docket No. ER11-1844
Exhibit No. NYI-15
Page 30 of 41
REGIONAL APPRAISALS
4. Regional Appraisals
A. MAAC Appraisal
The ability of the MEN interconnected network to support transfers into and out of
MAAC was assessed for the 2001 summer peak load period. The transfer capabilities
between NPCC and MAAC are higher than those reported for the 2000 summer. The
increased capability can be attributed, in part, by the increased ability to control pre-
contingency flow on bulk power facilities due to the installation of the M/O PARs and
a resultant decrease in the Lake Erie circulation pattern.
As a result of the increased ability to control pre-contingency flow on bulk power
facilities, fewer base case overloads were encountered during the analysis and fewer
operating procedures were invoked as part of the analysis.
The transfer capability between PJM/NYISO east is dependent on the return of the
Linden-Goethals 230 kV river crossing and one of the parallel 230/345 kV
transformers supplying the Hudson-Farragut river crossing. Import capability into
New York City will continue to be restricted until these facilities are returned from
current long-term forced outages.
Base Case Conditions-Transfers
This summer, the net tie line flow out of MAAC is 74 MW compared with 124 MW
out of MAAC last summer. The net decrease in MAAC imports (50 MW) is due to a
decrease in transfers from MAAC to NPCC (-50 MW).
The base transfers from ECAR to MAAC of 950 MW this summer remain unchanged
from last summer (See Table A-1). The net ECAR to MAAC transfers of 650 MW
also remain unchanged from last summer. The net interchange from MAAC to NPCC
decreased by 50 MW to 392 MW. A 450 MW PJM sale to NYISO is assumed with
the total Homer City plant output going to MAAC. The MAAC to NPCC transfer is a
combination of extraterritorial generation (36 MW) and extraterritorial load (-94
MW) plus a 450 MW transaction to NYSEG. Net MAAC to VACAR transfers of
300 MW are scheduled this summer, which is the same as last summer.
Generation
As is typical for the MAAC region, discrete generation was forced out to model
typical unit maintenance and Effective Forced Outage Rates (EFOR).
Approximately 2500 MW of additional generation capacity is expected to be placed
in service prior to the summer peak, 2000 MW of which consists of new generation
facilities.
2001 Summer MEN Interregional Transmission System Reliability Assessment
26
Docket No. ER11-1844
Exhibit No. NYI-15
Page 31 of 41
REGIONAL APPRAISALS
A. MAAC Appraisal (cont’d)
Load
Load levels this summer are expected to approximate the load experienced during the
1999 summer heat wave. On July 6, 1999, the PJM Temperature Humidity Index
(THI) was 85.3 (the actual high temperature recorded was 98 in Philadelphia and 102
in Washington, D.C.). A THI this high is extremely unusual and is estimated to occur
only once every 25 years. As a result of the accompanying heat wave, a new peak
load of 51,600 MW was reached (with all load management programs and a 5%
voltage reduction in effect). This new peak load exceeded the 1999 50/50 probability
forecast peak load of 47,570 MW (with interruptible load removed) by almost 4,000
MW. The 5% voltage reduction is estimated to provide approximately 800 MW to
1,000 MW of load relief, which resulted in the July 6th load being closer to 5,000
MW above forecast levels.
With a return to more typical weather conditions, the load expected to be served at the
time of the summer PJM peak is 51,311 MW. This is the 50/50-load forecast with the
load management programs in effect and direct control load management interrupted.
The unrestricted PJM peak load is forecasted to be 52,930 MW.
Operating Procedures
Operating procedures can be employed in the course of study analysis to increase
transfer capabilities among the three regions. MAAC operating procedures exist
which allow system operators to open selected 115 kV and 138 kV tie lines with
surrounding Regions to relieve overloads under emergency transfer conditions.
Instances where these procedures have been employed are noted in Tables 1 and 2.
Coordinated operation with NYISO allows for readjustment of the Ramapo PAR
schedule, as well as the PS - Con Ed wheel PARs, to alleviate PJM system limits. For
the 2001 Summer peak load case, the Ramapo PARs were set to control the flow on
the Branchburg-Ramapo 500 kV line to 530 MW. This flow includes an additional
288 MW over and above the normally scheduled flows, to compensate for an
imbalance in the PS-CON ED wheel.
2001 Summer MEN Interregional Transmission System Reliability Assessment
27
Docket No. ER11-1844
Exhibit No. NYI-15
Page 32 of 41
REGIONAL APPRAISALS
B. ECAR Appraisal
The 2001 Summer Assessment included an evaluation of the ECAR region’s ability to
support transfers into or out of the NPCC region. For the 2001 Summer conditions
modeled, the ECAR region exhibits thermal limitations to regional transfers as shown
in Table 1.
The Erie East - Erie South 230 kV line for an outage of the Wayne - Erie West 345
kV line limits incremental and total transfer capabilities for the NPCC to ECAR path.
These transfer capabilities are 900 MW higher as compared to that reported for the
2000 Summer assessment. The increase is attributable primarily to the return to
service of Cook Unit 1, which reduced the loading on the Dumont 765/345 kV
transformer.
Incremental and total transfer capabilities for the ECAR to NPCC path are limited by
the Scott - Buchanan 220 kV line (N22W) for the outage of the parallel 220 kV circuit
(N21W). These transfer capabilities are 200 MW lower as compared to that reported
for the 2000 Summer assessment. The decrease is attributable primarily to increased
Lambton generation which increases the Scott to Buchanan flow.
Generation
The principal generation changes since Summer 2000 modeled in this study are:
• Over 4500 MW of additional generation within ECAR
• Return of Cook Unit 1
Refer to Table A-4 for a detailed listing of generator additions.
AEP’s Cook Unit 1 (1000 MW connected at 345 kV) returned to service in January
2001. The return to service of this unit reduces loadings on the Dumont and Cook
765/345 kV transformers (AEP), thus increasing transfer capability to the north and
west.
The 2001 Summer reliability assessment base case was developed from the
NERC/MMWG 2001 Summer peak load base case, and while this case was updated
with the most recent transmission system status information and projected transfers,
five FirstEnergy (FE) W. Lorain generators expected to be in-service by Summer
2001 were omitted from the case. The five 85 MW CT generators should have been
modeled at the FE ‘02Beaver 345’ bus. The ECAR - NPCC path was thought to be
most likely to exhibit any potential export/import transfer capability impacts
associated with these units in-service. Therefore, a sensitivity analysis on the transfer
capabilities between ECAR and NPCC was performed after appropriately dispatching
the five generators. The sensitivity findings indicate that there were no significant
changes in transfer limits (FCITC) for ECAR exports to NPCC. There were no
differences in the limiting facilities/contingencies comparing results with versus
without the W. Lorain CTs. Likewise, for NPCC exports to ECAR, there were no
2001 Summer MEN Interregional Transmission System Reliability Assessment
28
Docket No. ER11-1844
Exhibit No. NYI-15
Page 33 of 41
REGIONAL APPRAISALS
B. ECAR Appraisal (cont’d)
differences in the limiting facilities/contingencies although there were minor increases
in some FCITC limits with the W. Lorain generators. In summary, the W. Lorain
generators had no significant impact on the transfer limits found in Table 2.
Load
The projected load plus losses for ECAR modeled in this study is about 103,200 MW,
which is approximately 1,100 MW greater than the load modeled for Summer 2000,
an increase of 1.1%.
Transmission Facilities
Major transmission facility changes since Summer 2000 are:
• Orange 765/138 kV transformer in central Ohio
•
40 mile Foster - Bath 345 kV line between Cinergy and DPL
These and other ECAR facility additions are indicated in Table A-3.
The Michigan - Ontario interface and the Queenston Flow West (QFW) interface in
Ontario have been susceptible to large parallel flows and Transmission Loading
Relief (TLR) curtailments. The last of three new Phase Angle Regulating (PAR)
transformers, Lambton PS4, on the Michigan - Ontario Interface is scheduled to be in
operation by mid-August, 2001. DOE permitting must also be received before the
B3N PAR becomes operational. The PARs, one on each of the four interconnections,
will mitigate problems on the QFW by being normally operated to reduce
unscheduled flows from Ontario into Michigan. This operating mode, however,
increases loading on other critical ECAR facilities, such as the Dumont and Cook
765/345 kV transformers, by redirecting flows which would otherwise flow around
the north end of Lake Erie into Michigan. This may reduce transfer capability to the
north and west.
The Lake Erie Emergency Re-dispatch (LEER) procedure will facilitate emergency
re-dispatch among participating control areas surrounding Lake Erie (AEP, AP, FE,
MECS, NYISO, IMO and PJM) to avoid the shedding of firm load. Lake Erie
Security Coordinators and Control Areas will provide emergency aid in the form of
re-dispatch, re-configuration of the transmission system, and/or adjustment of phase
angle regulating transformers to maintain Firm Load service when possible.
Base Transfers
Base imports to ECAR in this study are approximately 100 MW lower than the 2000
Summer Study with approximately 50 MW less from VACAR. The base transfer
levels
2001 Summer MEN Interregional Transmission System Reliability Assessment
29
Docket No. ER11-1844
Exhibit No. NYI-15
Page 34 of 41
REGIONAL APPRAISALS
B. ECAR Appraisal (cont’d)
from NPCC to ECAR and ECAR to MAAC are unchanged. Refer to Tables A-1 and
A-2 for a detailed comparison of transfers in the 2001 vs. 2000 Summer Study.
Operating Procedures
As identified in Appendix C, various ECAR operating procedures are available at the
discretion of system operators. The Blairsville - Social Hall 138 kV (AP) operating
procedure was invoked to obtain several of the transfer limits reported in this study.
2001 Summer MEN Interregional Transmission System Reliability Assessment
30
Docket No. ER11-1844
Exhibit No. NYI-15
Page 35 of 41
REGIONAL APPRAISALS
C. NPCC Appraisal
The 2001 Summer MEN Reliability Assessment presents an evaluation of NPCC’s
ability to support exports to and imports from the MAAC and ECAR Regions. The
incremental and total transfer capabilities determined in this assessment are discussed
in Section 2, Results.
Base Transfers
NPCC’s base transfers include a net export of 682 MW to ECAR (unchanged from
2000 summer) and a net import of 392 MW from MAAC, a decrease of 50 MW as
compared to that scheduled in the 2000 summer case. In addition, as in last summer’s
base case, NPCC imports 200 MW from MAPP, scheduled from Manitoba Hydro to
Ontario. The net NPCC export is 90 MW in the 2001 summer case compared to a 40
MW export in the 2000 summer case. Table A-1 in Appendix A compares the
individual transfers in the 2000 and 2001 summer base cases.
Transmission System Performance
Transmission capabilities are expected to be adequate to meet this summer’s expected
conditions. The NPCC to MAAC, NPCC to ECAR and MAAC to NPCC transfer
capabilities are significantly higher than in 2000 summer with much of the increase
due to the addition of the Michigan-Ontario phase angle regulators. These regulators
provide some degree of control over Lake Erie power circulation and divert some
power flows away from facilities that would otherwise be limiting.
The existing Ontario operating procedures to relieve potential Buchanan Longwood
Input limitations (BLIP) and Ontario-Michigan interface limitations are identified in
Appendix C. These operating procedures will still be available at the discretion of
system operators as will the NYISO Security Constrained Dispatch procedure.
NPCC Area Appraisals
The NPCC region encompasses the five control areas of Ontario, New York, New
England, Quebec and the Maritimes. Individual appraisals are presented for all areas
except the Maritime Area, which, due to its location, has a minimal impact on the
determination of the MEN interregional transfer capabilities.
Ontario
For this study, an Ontario demand of 23,500 MW was modeled. Generation resources
and purchases will be adequate to meet this demand. Summer and winter peak
demands have been comparable for the past several years.
2001 Summer MEN Interregional Transmission System Reliability Assessment
31
Docket No. ER11-1844
Exhibit No. NYI-15
Page 36 of 41
REGIONAL APPRAISALS
C. NPCC Appraisal (cont’d)
The tower contingencies that limit transfers during normal operation are outside the
MEN study scope. Ontario can deliver about 2000 MW to New York over the
Niagara ties in the summer. Ontario can receive about 1000 MW from New York at
Niagara before circuits associated with the Queenston Flow West (QFW) interface
will become limiting. Another 400 MW can be transferred between Ontario and New
York at the eastern end of Lake Ontario over the phase angle regulator controlled St.
Lawrence-Moses 230 kV circuits L33P and L34P.
The in service date for the phase angle regulator in the Lambton-St. Clair 230 kV
circuit L4D has been delayed to August 2001. The flow on the Michigan-Ontario (M-
O) interface will be controlled to reduce parallel flows during normal operation, but
they will allow parallel flows during emergencies. With four Lambton units in
service, Ontario will be able to deliver about 2400 MW to Michigan and receive
about 1000 MW from Michigan. More power can be imported from Michigan when
Lambton generation is reduced.
The Scott to Buchanan circuits appear as the limiting elements for NPCC imports for
the following reasons:
• Lambton generation is higher than modeled in previous studies,
• the M-O phase angle regulators are assisting transfers pre-contingency, and
• the M-O phase angle regulators are not blocking generation shifts post-
contingency.
New York
The forecast peak for the New York Control Area (NYCA) is 30,620 MW. This
forecast is 1.0% higher than the all time peak of 30,311MW that occurred on July 6,
1999. For peak load normalization, the NYISO uses a temperature/humidity index
value of 82.6. At current load levels, each degree increase in the THI will result in
approximately 500 MW additional load.
The NYISO conducts an annual and monthly supplementary ICAP auctions. Based
on the forecast load, the installed capacity requirement is 36,132 MW based on the
18% planning reserve margin requirement. When allowances are taken for unplanned
outages (based on historical performance of 13.5% unavailable capacity), the net
available resources will be 31,254 MW, which will not be sufficient to meet the
NYCA load and operating reserve requirement during the peak load hours. A
negative reserve margin of approximately 1,166 MW is expected at peak conditions.
2001 Summer MEN Interregional Transmission System Reliability Assessment
32
Docket No. ER11-1844
Exhibit No. NYI-15
Page 37 of 41
REGIONAL APPRAISALS
C. NPCC Appraisal (cont’d)
The New York Power Authority plans eleven new units totaling 484 MW of natural
gas fired combustion turbines in the New York City metropolitan area. These units
were announced at the end of the summer 2000 and are on a very compressed
development schedule. Of the generation changes expected in the New York City
load zone, Astoria #2 (175 MW) has been completed, 204 MW are “likely” and 362
MW are considered “possible” by June 1, 2001.
Phase I of the Marcy Flexible AC Transmission System (FACTS) Demonstration
Project is scheduled for commercial operation in April 2001. This phase of the
project is a 200 MVAR shunt static compensator (STATCOM) that can dynamically
regulate the transmission system voltage during a system disturbance. In conjunction
with the STATCOM, a new 135 MVAR switched shunt capacitor bank has been
placed in service at the Oakdale 345 kV station. These additions increase the Central
East and Total East transfer capabilities (as limited by voltage) by approximately 60
MW and 120 MW, respectively.
A new 345/138 kV transformer near Middletown, NY, in the Orange and Rockland
service area will be connected to one of the Coopers Corners - Rock Tavern 345 kV
circuits. While this facility will not impact the overall bulk power system transfer
capability, it will enhance the reliability in the lower Hudson Valley region of New
York.
New England
The New England 2001 summer forecast peak demand (Net Internal Demand) is
23,650 MW. This projected peak demand is 1,731 MW (7.9%) higher than last year's
actual summer peak of 21,919 MW, which occurred on June 27, and it is 1,106 MW
higher (4.9%) than the all time peak of 22,544 MW, which occurred on July 6th, 1999.
The summer 2001 peak forecast is 400 MW (1.7%) greater than the summer 2000 peak
forecast of 23,250 MW. It should be noted that the summer of 2000 was, overall, a
cooler summer than normal. However, during May, New England, as well as many
other Control Areas in the Northeast, experienced record breaking temperatures that
resulted in extremely high loads for spring. The high loads coupled with the large
number of generators out-of-service as part of spring maintenance, required the
implementation of emergency operating procedures to mitigate the negative capacity
margin within New England at that time.
It is anticipated that ISO New England will have sufficient capacity to meet the
projected peak for the summer 2001 and the shoulder months. Net Operable Capacity
resources are 25,955 MW (August) and include 1,682 MW from new generation. In
2000, three of the new generators that were expected to be on-line for that summer
period were delayed into late fall. Since the in-service date of these new units will
2001 Summer MEN Interregional Transmission System Reliability Assessment
33
Docket No. ER11-1844
Exhibit No. NYI-15
Page 38 of 41
REGIONAL APPRAISALS
C. NPCC Appraisal (cont’d)
impact the summer capacity situation, ISO New England closely monitors the
construction and commissioning progress of these new generators. The forecast of
average monthly summer external capacity/energy purchases is approximately 1,116
MW, which includes 667 MW from Hydro-Québec, 324 MW from New Brunswick,
and 125 MW from New York.
ISO New England projects that there may be instances during summer 2001 when
New England will have insufficient operable capacity within the control area to meet
the region’s anticipated peak demands and operating reserve requirements.
Consequently, ISO New England expects to invoke operating procedures to mitigate
any short-term capacity deficiency.
ISO New England has in place Operating Procedure No. 4 (OP-4) that includes
purchasing emergency energy from the interconnected grid, interrupting interruptible
load customers, and implementing voltage reductions in the event of a capacity
shortage. This procedure provides load relief measures varying between 2,614 MW to
3,614 MW, depending on system conditions at the time, and used by system operators
as part of “normal” operations to mitigate capacity shortages.
In addition to OP-4 the ISO has implemented a Load Response Program for New
England that is target to commence June 1, 2001 and will continue indefinitely. The
objective of this interruptible load program is to contract an additional 300 to 500
MW of price-responsive load that will curtail demand when OP-4 is implemented.
There are no critical transmission circuits scheduled to be out-of-service during the
summer 2001 period. Also, the Phase Angle Regulating (PAR) transformer on the
Plattsburgh-Sandbar 115 kV PV-20 tie between New York and New England which
was out of service last summer has been returned to service in early February 2001
allowing “normal” transfer capabilities between New York to New England.
Furthermore, additional transmission resources are expected to become available for
the summer of 2001. These additions include:
• Two new 345kV substations; ANP Bellingham (Rhode Island) and Lake Road
(Connecticut), as part of the interconnection of two new generators:
• Shunt Static Compensator (STATCOM) devices to be installed at the Burlington,
VT substation that will increase transfer capabilities within Vermont
approximately 100 MVAR; and
• Two new breakers in the Long Mountain substation which will increase the New
York - New England transfer capability approximately 100 MW and within
southwest Connecticut by approximately 200 MW.
2001 Summer MEN Interregional Transmission System Reliability Assessment
34
Docket No. ER11-1844
Exhibit No. NYI-15
Page 39 of 41
REGIONAL APPRAISALS
C. NPCC Appraisal (cont’d)
Quebec
The forecast Hydro-Québec internal summer peak demand is 19800 MW. The actual
internal load for the summer 2000 period was 20598 MW, which occurred in
September of that year.
The net operable Hydro-Québec capacity is forecast to be 28500 MW. Firm capacity
sales are projected to be 900 MW which results in a net Capacity Margin of 9800
MW. For the purpose of this study, other non-capacity exports to neighboring utilities
have been simulated. The total exports simulated are 4067 MW. Total load is
therefore expected to be in the order of 23900 MW. All reserves (spinning, standby,
etc.) are expected to be well within limits.
No significant additions of generation or transmission capacity to the Hydro-Québec
system are projected for summer 2001. The Sainte-Marguerite-3 G.S. (800 MW
Hydro) is scheduled to be online for the 2001-2002 winter peak period and
commissioning will begin this summer. It is not considered in this study.
The following facilities are expected to be out of service during summer 2001:
• a synchronous condenser at Manicouagan.
• a synchronous condenser at Duvernay.
• a static var system at Laurentides.
• a static var system at Albanel.
Normal maintenance of system equipment such as generators, lines, breakers, reactors
and capacitor banks, is scheduled for the summer. Maintenance of major equipment
having an effect on capacity margins and transmission margins is scheduled so as not
to compromise these margins, with regards to internal demand and firm capacity
sales.
All existing interconnections with neighboring systems are expected to be in service
and at full summer capacity for the 2001 summer period.
2001 Summer MEN Interregional Transmission System Reliability Assessment
35
Docket No. ER11-1844
Exhibit No. NYI-15
Page 40 of 41
REGIONAL APPRAISALS
C. NPCC Appraisal (cont’d)
Transfer Capabilities Without Michigan-Ontario Interface Phase Angle
Regulators (PARs) Controlling Flows
The affects on interregional transfer capabilities for conditions when the Michigan-
Ontario phase angle regulators are not controlling power flows are discussed below.
In March, 2001 the final PAR to be installed in the Michigan-Ontario (M-O) interface
failed a factory test. In April, 2001 the in-service circuit L51D phase shifter was
automatically removed from service for an internal fault. These failures make it
unlikely that the M-O PARs will be able to provide significant inter-regional
emergency assistance before the end of the 2001 summer period. The following
discussion describes the sensitivity of the inter-regional transfer capability to an
unregulated Michigan-Ontario interface.
The table below shows M-O PAR angles and targets for the four 4000 MW transfer
cases reported in Table 2. In all four transfers, the PARs are pulling flow towards
Ontario (i.e., all of the net angles are positive).
ECAR to
MAAC to
NPCC to
NPCC to
NPCC
NPCC
ECAR
MAAC
M-O Target
1000 to Ont
1000 to Ont
2000 to Mich
2000 to Mich
B3N +o
14.4°
47.0°
39.4°
7.1°
(max 47)
L4D +m
-3.5°
-38.8°
-35.8°
-1.9°
(max 47)
L51D +m
-2.9°
-38.2°
-36.6°
-2.8°
(max 47)
J5D +o
-10.6°
23.6°
26.9°
-6.9°
(max 40)
net +o
10.3°
147°
139°
4.9°
(max 181)
+o positive shift angle tends to make flow towards Ontario
+m positive shift angle tends to make flow towards Michigan
The small net angle for ECAR to NPCC and NPCC to MAAC transfers indicates
these transfer capabilities would not materially change for an unregulated MO
interface.
Repeating the linear analysis with the M-O PARs not controlling flow for the MAAC
to NPCC transfer shows the continuous rating of the North Meshoppen transformer
2001 Summer MEN Interregional Transmission System Reliability Assessment
36
Docket No. ER11-1844
Exhibit No. NYI-15
Page 41 of 41
REGIONAL APPRAISALS
C. NPCC Appraisal (cont’d)
limits FCITC to 4000 MW. The corresponding FCITC indicated in Table 2 with the
PARs providing emergency assistance is 4050 MW. It is logical that a facility near
the NPCC-MAAC border becomes more limiting because the M-O PARs are no
longer pulling flow into Ontario. For this analysis the flow on the Keith-Waterman
230 kV circuit J5D is 250 MW into Ontario to follow past practice.
Repeating the linear analysis for the NPCC to ECAR transfer shows the Scott-Bunce
Creek 230 kV circuit B3N limits the FCITC to 3650 MW for the loss of the Lambton-
St. Clair 345 kV circuit L4D and a Lambton unit rejection. The corresponding FCITC
indicated in Table 2 with the PARs providing emergency assistance is 3550 MW. It
is expected that a facility nearer the NPCC-ECAR border would become limiting
because the M-O PARs are no longer pulling flow into Ontario. For this analysis the
flow on J5D is 350 MW into Michigan to follow past practice.
In summary, the delayed implementation of phase shifter control on the Michigan-
Ontario interface will not materially change the size of the inter-regional transfer
capabilities reported in Table 2. The delay will change the location of the most
limiting element for MAAC to NPCC and NPCC to ECAR transfers.
2001 Summer MEN Interregional Transmission System Reliability Assessment
37
DOCKET NO. ER11-1844
EXHIBIT NO. NYI-16
Docket No. ER11-1844
Exhibit No. NYI-16
Page 1 of 40
MAAC-ECAR-NPCC
Study Committee
2002 Summer
MEN Interregional Transmission System
Reliability Assessment
May 2002
NPCC
4000
4450
3750
382
18
3050
4000+
3500
MAAC
ECAR
321
260
4000+
534
4000+
4000+
2950
VACAR
Docket No. ER11-1844
Exhibit No. NYI-16
Page 2 of 40
MAAC - ECAR - NPCC Study Committee
Mr. W. L. Harm (Chairman)
PJM Interconnection
MAAC
Mr. J. C. Stephens
FirstEnergy Corporation
ECAR
Mr. T. Vitez
The Detroit Edison Company
ECAR
Mr. P. A. Roman
Northeast Power Coordinating Council
NPCC
Mr. S. Burns
Independent Electricity Market Operator
NPCC
Mr. R. W. Waldele
New York Independent System Operator
NPCC
Mr. D. Soulier
Hydro-Québec (TransÉnergie)
NPCC
Contributors
Mr. J. Mitchell
ECAR
ECAR
MAAC - ECAR - NPCC Operating Studies Working Group
Mr. D. J. Kidney (Chairman)
Northeast Power Coordinating Council
NPCC
Mr. D. G. Leitch
Consumers Energy
ECAR
Mr. J. M. Voldrich
FirstEnergy Corporation
ECAR
Mr. L. W. Hodge
PJM Interconnection
MAAC
Ms. L. Hopkins
New York Power Authority
NPCC
Mr. K. Layman
New York Independent System Operator
NPCC
Mr. P. Metsa
Hydro-Québec (TransÉnergie)
NPCC
2002 Summer MEN Interregional Transmission System Reliability Assessment
i
Docket No. ER11-1844
Exhibit No. NYI-16
Page 3 of 40
TABLE OF CONTENTS
1. Introduction
1
2. Results
A. Executive Summary
3
B. Simultaneous Transfer Capability
6
C. Discussion of Results
9
D. TLR Discussion
11
Exhibits
Figure 1A: Simultaneous Transfer Capability, MAAC to NPCC/ECAR
12
Figure 1B: Simultaneous Transfer Capability, ECAR to MAAC/NPCC
13
Figure 1C: Simultaneous Transfer Capability, NPCC to MAAC/ECAR
14
Figures 2A, 2B & 2C: Summer 2002 Study Simultaneous FCTTC
and Actual Scheduled Interchange
15
Figures 3A, 3B & 3C: Summer 2002 Study Simultaneous FCTTC
with Actual Scheduled Interchange and Tie Flow
18
Figure 4: Non-simultaneous Interregional Transfer Capability
21
Table 1: Comparison of Results (FCITC and FCTTC) with Previous Years
22
Table 2: First Contingency Incremental Transfer Capability (FCITC)
23
Figure 5: Location of Limiting Facilities
24
3. Background Information
A. Base Case Development
25
B. Study Procedure
25
4. Regional Appraisals
A. MAAC Appraisal
27
B. ECAR Appraisal
29
C. NPCC Appraisal
31
2002 Summer MEN Interregional Transmission System Reliability Assessment
ii
Docket No. ER11-1844
Exhibit No. NYI-16
Page 4 of 40
TABLE OF CONTENTS
Appendix A. System Description and Base Case Conditions
Figure A-1: Interconnection Flow Diagram
A-1
Figure A-2: MAAC Base Case Flow Diagram
A-2
Figures A-3W & A-3E: ECAR Base Case Flow Diagrams
A-3
Figure A-4: NPCC Base Case Flow Diagram
A-5
Table A-1: Comparison of Base Case Transfers
A-6
Table A-2: Interregional Extraterritorial Generation & Load
A-9
Table A-3: Major Transmission Facility Changes
A-10
Table A-4: Major Generation Changes
A-12
Table A-5: PAR Controlled Interchange
A-14
Table A-6: MEN/VEM Base Case Interchange Schedules
A-15
Appendix B. Distribution Factors
Tables B-1.1 & B-1.2: Transfer Distribution Factors
B-1
Appendix C. Regional Operating Procedures
MAAC Operating Procedures
C-1
ECAR Operating Procedures
C-2
NPCC Operating Procedures
C-3
Rating Criteria
C-4
Appendix D.
Definitions of Interfaces
D-1
Figure D-1: Location of Interfaces
D-4
Appendix E. Definitions
Glossary of Terms
E-1
Discussion of FCITC Calculations
E-3
FCITC Calculation Examples
E-4
System Abbreviations
E-6
2002 Summer MEN Interregional Transmission System Reliability Assessment
iii
Docket No. ER11-1844
Exhibit No. NYI-16
Page 5 of 40
INTRODUCTION
Report on the MAAC-ECAR-NPCC
2002 Summer Interregional Transmission System Reliability Assessment
1. Introduction
The MAAC - ECAR - NPCC (MEN) Working Group, under the direction of the MEN Study
Committee, has conducted an appraisal of the interregional transmission system performance
among the MEN regions for the conditions expected in the 2002 Summer period. The
purpose of this study is to provide:
• An analysis of First Contingency Incremental Transfer Capabilities (FCITC) for selected
transfers that may occur simultaneously among, or through, the MEN regions.
• First Contingency Incremental Transfer Capabilities (FCITC) and First Contingency Total
Transfer Capabilities (FCTTC), as defined in Appendix D, for non-simultaneous
emergency transfers between ECAR and NPCC and between MAAC and NPCC. Once
determined, no attempts have been made to optimize transfers between regions by
changing dispatches and/or phase angle regulator settings.
• A sensitivity analysis of study results.
• An appraisal for MAAC, ECAR, and NPCC regions.
The FCITCs and FCTTCs reported in this assessment reflect evolving market alliances and
system operations that do not mirror NERC reliability regions. In early March a portion of the
Rockland Electric Company load located in New Jersey was integrated into the MAAC
region. Allegheny Power (AP) was successfully integrated in the PJM energy market on
April 1, 2002. Other operational changes are discussed in the individual regional
assessments.
The reported FCITC and FCTTC values are based on predictions of many factors that could
change in daily operation of the power system. Among these variable factors are:
• Load forecasts and generation availability
• Geographic distribution of load and generation
• Transmission system configuration
• Simultaneous inter-system power transfers
• Operation based on regional requirements to respect additional contingencies
• Control settings of Phase Angle Regulators (PARs)
Distribution factors for several NERC Flowgates in the MEN Regions that have a significant
response to regional transfers are included in this report to aid system operators in the daily
operation of the interconnected network.
An appraisal of the interregional system performance among the VACAR-ECAR-MAAC
(VEM) regions is presented in the companion VEM Study Committee Report: 2002 VEM
Summer Interregional Transmission System Reliability Assessment dated May 2002.
2002 Summer MEN Interregional Transmission System Reliability Assessment
1
Docket No. ER11-1844
Exhibit No. NYI-16
Page 6 of 40
INTRODUCTION
1. Introduction (cont’d)
Available Transfer Capability vs. MEN Seasonal Study Incremental Transfer
Capability (ITC)
FERC Order 889 mandated that each US transmission provider calculate Available Transfer
Capability (ATC) and post such values to an Open Access Same Time Information System
(OASIS). FERC deferred the development of ATC methodology to NERC, which has
developed a series of technical references, including Available Transfer Capability
Definitions and Determination, which describes the methodology of calculating ATC/TTC
and the application of Transmission Reliability Margin (TRM) and the Capacity Benefit
Margin (CBM). The underlying concepts for both the ATC methodology and the
methodology used to perform MEN seasonal studies are found in the Transmission Transfer
Capability document published by NERC in 1995. These concepts include the First
Contingency Incremental Transfer Capability (FCITC) and First Contingency Total Transfer
Capability (FCTTC).
Thus, the methodology of ATC as calculated by transmission providers and the regional
transfer capabilities developed by MEN are similar. Both calculate incremental and total
transfer capabilities on a contingency basis, with the magnitude of transfer capability based
on increasing transfer levels until transmission limits are incurred.
The primary differences between ATC calculations and the MEN study are:
• Scope: ATC is calculated by transmission providers, which generally corresponds to the
control area level; MEN studies are calculated at the NERC regional level.
• Coordination: ATC is calculated by transmission providers using system representations
and procedures they deem appropriate. Transfer capacity is calculated by MEN using the
most up-to-date NERC system representation and procedures established by all three
regions.
• Margins: ATC determination uses margins (TRM/CBM) to provide for variation in
system operating conditions; MEN reports FCITCs without applying margins.
• Tie Capacity: ATC between adjacent control areas is limited by scheduling limits based
on the tie capacity between control areas; MEN reports inter-regional network transfer
capabilities regardless of scheduling limits between individual control areas.
• Timeframe: ATC is calculated hourly, daily, weekly, and monthly; MEN studies are
conducted semi-annually based on a snapshot of anticipated conditions.
• Publishing: ATC is posted to an OASIS for use by the commercial markets; MEN study
results are published for use as an interregional reliability assessment.
2002 Summer MEN Interregional Transmission System Reliability Assessment
2
Docket No. ER11-1844
Exhibit No. NYI-16
Page 7 of 40
INTRODUCTION
2. Results
A. Executive Summary
The following conclusions and observations can be made based on the results of the 2002
Summer Assessment:
1.
Assuming all transmission facilities are in service, power flows on the MAAC, ECAR,
and NPCC bulk power transmission systems are within acceptable limits for the base case
power transfers (Table A-1). Also, assuming all operating procedures are appropriately
employed, no single contingency on the bulk power transmission system will overload the
remaining facilities, which are significantly affected by the transfers reported in this study.
After a single contingency, voltage levels can be maintained within acceptable limits.
2.
Compared to the 2001 Summer Operating Study, changes in base conditions have
occurred and the net effect of these changes impact to varying degrees the loading on
critical interfaces and facilities. Section 2.C, as well as Tables 1, A-1 and A-5, provide
some year-to-year comparisons. Major changes in Base Case modeling from the 2001
Summer Transmission Assessment to the 2002 Summer Base Case include:
Additions:
• Michigan-Ontario Interface PAR status
� Due to manufacturing problems, the phase shifter for the Lambton - St. Clair
L4D circuit will not be in service until after the 2002 summer study period.
� Ontario and Michigan have not yet been able to reach an agreement regarding
the deployment of the new phase shifters installed in the Lambton-St. Clair
L51D and Scott - Bunce Creek B3N Circuits.
� For these reasons, only the phase shifter in Keith - Waterman J5D is used to
assist interregional transfers as per past practice.
• Approximately 9350 MW of new generation within ECAR
• Approximately 4100 MW of new generation within MAAC
• Approximately 4700 MW of new generation within NPCC
Net Interchanges:
• ECAR to MAAC is 300 MW lower
• NPCC to ECAR is 300 MW lower
• MAAC to NPCC is 410 MW lower
• ECAR to VACAR is 560 MW lower
Transfer Simulations
• The integration of PJM West into the PJM energy market operation for import and
export simulations
2002 Summer MEN Interregional Transmission System Reliability Assessment
3
Docket No. ER11-1844
Exhibit No. NYI-16
Page 8 of 40
RESULTS
3.
Figures 1A, 1B and 1C are plots of the FCTTC limits between MAAC, ECAR and NPCC
during simultaneous transfers. Table 1 presents the first reported FCITCs, and the
corresponding FCTTCs between MAAC and NPCC and between ECAR and NPCC, as
well as direct comparisons between the FCTTCs obtained in this study to those
determined in previous summer assessments. Table 2 details the 2002 Summer FCITCs
between MAAC and NPCC and between ECAR and NPCC. All transfer limits presented
in this report have AP and DLCO generation incorporated into the PJM energy market and
has been rounded down to the nearest 50 MW. The following facilities may be thermal
limits for regional transfers:
Homer City 345/230 kV
Oxbow - Lackawanna 230 kV
East Towanda - Hillside 230 kV
Scott - Buchanan 220 kV N22W
Homer City-Shelocta 230 kV
Beck - Middleport 230 kV Q30M
Keystone 500/230 kV
Scott - Bunce Creek 230 kV B3N
Erie West 345/115 kV
Erie South-Erie East 230kV
4.
Based on the analysis documented in this study, transfer limits changed as follows:
FCTTC Change
Transfer Path
from 2001 Summer
NPCC to MAAC
unchanged
NPCC to ECAR
50 MW lower
MAAC to NPCC
50 MW higher
ECAR to NPCC
300 MW higher
The FCTTC’s reported in this study are approximately the same as 2001 summer.
Specifics affecting transfer limits that may be encountered this summer are contained in
the individual regional appraisals.
5.
As evolution of the interconnected network continues Allegheny Power was integrated
into PJM’s energy market operations on April 1st, 2002. The AP/PJM/VP Reliability
Coordination Plan (RCP) will no longer be used to determine voltage limits along the
ECAR, MAAC and VACAR interface. A more detailed discussion of reactive limits is
contained in the companion VEM Study Committee Report:
2002 VEM Summer
Interregional Transmission System Reliability Assessment dated May 2002.
6.
Close coordination will be necessary to maintain adequate transmission reliability among
MEN systems.
2002 Summer MEN Interregional Transmission System Reliability Assessment
4
Docket No. ER11-1844
Exhibit No. NYI-16
Page 9 of 40
RESULTS
Dynamic Security
As part of its ongoing responsibility, the MEN Study Committee has reviewed the results of
dynamic security assessments that have been recently conducted. These assessments include
the MEN 1998 Summer Peak Load Dynamic Study and the dynamic assessment conducted as
part of the Michigan-Ontario PAR analysis by OHSC for NPCC. Based on this review the
Study Committee concludes that the MEN interconnected network is expected to be
dynamically secure at the steady state transfer limits in year 2002.
2002 Summer MEN Interregional Transmission System Reliability Assessment
5
Docket No. ER11-1844
Exhibit No. NYI-16
Page 10 of 40
RESULTS
B. Simultaneous Transfer Capability
The simultaneous transfer capability plots (Figures 1A, 1B and 1C) graphically portray the
anticipated effect on transfer capability when one system is simultaneously transferring
power to or from two separate systems. They reveal how the sensitivity of a particular
system limit to one transfer differs from the same limit’s sensitivity to the other transfer.
These results are based on linear analysis, while actual system performance is influenced
by a number of nonlinear factors.
The results of this analysis stress the continued need for close coordination and
communication among the users of the interconnected systems in order to maximize the
utilization of the network without jeopardizing its reliability.
Figure 1A shows the simultaneous transfers between MAAC and its opposing systems
NPCC and ECAR. Figure 1B shows the simultaneous transfers between ECAR and its
opposing systems MAAC and NPCC. Figure 1C shows the simultaneous transfers
between NPCC and its opposing systems MAAC and ECAR.
In the simultaneous transfer plots; the cross-hair symbol represents the base case level of
transfers between the study system and each of the two opposing systems. The shaded
region represents different combinations of simultaneous transfers between the study
system and each of the opposing systems, at which the system can be operated reliably
without encountering any pre-contingency or post-contingency overloads. The dark solid
lines represent points at which the first limit to transfers would be expected to be
encountered as transfers increase from the base case levels. The dashed lines represent
points at which a pre-contingency or post-contingency overload would be expected to
occur at levels of transfers beyond the first limit.
Simultaneous schedules within the shaded area of the respective Simultaneous Transfer
Capability plots will not overload any of the limiting facilities in the study model.
Retrospective on Summer 2001 FCTTC vs. Actual Scheduled Interchange
Figures 2A, 2B and 2C compare MEN 2001 Summer study results to the actual
interregional transfer schedules by superimposing the schedules on the Simultaneous
Transfer Capability results from the study. These plots validate the limits being identified
by the study and verify the selection of the base case operating point. Each data point
represents one day, and is the hourly-integrated, aggregate regional scheduled interchange
for hour ending 1700 on weekdays from 6/1/01 to 8/31/01.
Figures 2A, 2B and 2C show a pattern of NPCC to MAAC, ECAR to MAAC and ECAR
to NPCC schedules during summer peak conditions.
2002 Summer MEN Interregional Transmission System Reliability Assessment
6
Docket No. ER11-1844
Exhibit No. NYI-16
Page 11 of 40
RESULTS
B. Simultaneous Transfer Capabilities (cont’d)
As the vast majority of data points lie within the shaded boundaries, the thermal and
voltage limits identified by the study have valid correspondence with actual scheduling
activity, which is coupled to the availability of transmission service. The points outside of
the shaded area on Figures 2A (MAAC to ECAR/NPCC) and 2B (ECAR to
MAAC/NPCC) and the boundary occur for the region bounded by a reactive constraint:
the Hatfield-Black Oak 500 kV for L/O Pruntytown-Mt. Storm 500 kV. This illustrates
the volatility of reactive limits to system conditions. The voltage limit depicted on these
plots is highly dependent on the availability of units in western MAAC and eastern ECAR,
and the particular unit availability on those days provided sufficient reactive support to
facilitate these simultaneous transfers.
Retrospective on Summer 2001 Circulation
Figures 3A, 3B and 3C compare scheduled interregional transfers to actual interregional
tie flow, superimposed on the Simultaneous Transfer Capability results from the MEN
2001 Summer study. By incorporating actual interregional tie flow, these plots further the
goals of Figures 2A, 2B and 2C by providing a means of visually portraying the
circulating, or loop, flows that occur among the MEN and neighboring regions, as well as
verification of the Interregional Transfer Distribution Factors portrayed in Tables B-1.1
and B-1.2. Each data pair joined by a connecting line represents one day - the “plus-signs”
being the hourly-integrated, aggregate regional scheduled interchange, the “zeros” being
the hourly-integrated, aggregate regional tie flow - for hour ending 1700 on weekdays
from 7/1/01 to 7/31/01.
The actual circulating flows experienced by the MEN systems last July generally consisted
of the following elements:
• Counter-clockwise Lake Erie flow throughout the MEN systems
• SERC to MAAC transfers utilizing ECAR systems
The MAAC region generally experienced flows higher than scheduled imports from
ECAR and exports to NPCC. Using Figure 3A, this places the actual interregional tie flow
(‘0’) down and to the right of the schedule (‘+’). The counter-clockwise Lake Erie
circulation adds to the already increased ECAR to MAAC flows, and also increases the
MAAC to NPCC flow above schedule. Flow higher than scheduled imports from ECAR to
MAAC are composed primarily of SERC to MAAC transfers utilizing the ties between
ECAR and MAAC for a sizable portion of their transfers. On the other hand, NPCC to
MAAC flows were generally less than scheduled.
ECAR (Figure 3B) experienced higher flows than scheduled imports from NPCC and
higher export flows than scheduled to MAAC, the majority of which consisted of Lake
Erie circulation utilizing the NPCC to ECAR and then the MAAC to NPCC paths. SERC
to MAAC transfers also utilized the ties between ECAR and MAAC for a sizable portion
2002 Summer MEN Interregional Transmission System Reliability Assessment
7
Docket No. ER11-1844
Exhibit No. NYI-16
Page 12 of 40
RESULTS
B. Simultaneous Transfer Capabilities (cont’d)
of their transfers.
The NPCC plot (Figure3C) is purely composed of the Lake Erie circulation: higher flows
than scheduled exports from NPCC to ECAR and flow higher than scheduled imports
from MAAC to NPCC. The counter clockwise circulation, which ranged from several
hundred to 1,200 MW, will be mitigated by the Phase Angle Regulating transformers
being added on the Michigan-Ontario interface
2002 Summer MEN Interregional Transmission System Reliability Assessment
8
Docket No. ER11-1844
Exhibit No. NYI-16
Page 13 of 40
RESULTS
C.
Discussion of Results
The FCTTCs and FCITCs calculated were determined for peak load conditions as
presently forecasted and with mainly firm, capacity backed transfers. It should be noted
that the FCTTCs and FCITCs are used only as indicators of the relative strength of the
interconnected system. They cannot be used as absolute indices of operating capability of
the system because they are determined for the one set of specific conditions represented
in this study. Any changes to the system condition, such as variations in generation
dispatch or simultaneous transfers that are not modeled in this study, can significantly
affect transfer capabilities.
As noted earlier, the FCITCs and FCTTCs represent a possible method to compare and
measure the relative strength of the system from one season or appraisal period to the next.
Hence, a comparison of the FCTTC values determined for this summer and the
corresponding values determined for previous summers are provided in Table 1. The
FCITCs and FCTTCs reported in this study are based on simulated system operation with
PJM West fully integrated in the PJM energy market. Comparison of the limits reported in
this assessment with those reported in previous assessments must be tempered with the
realization that the study results reflect different operations due to different market
alliances.
Another difference between the 2001 and 2002 study is the representation of the four
Ontario-Michigan Interface circuit phase angle regulators (PARs). In anticipation of their
installation, these PARs were represented in service for the summer 2001 analysis and
were utilized to assist the MEN regional power transfers. However, because of failures of
some of the PARs and delays in restoring them to service, only the Keith-Waterman 230
kV J5D interconnection PAR is represented in the 2002 analysis.
Due to the integrated nature of the bulk supply network, power transfers between areas can
result in incremental power flows throughout all three MEN regions. In some cases, the
resulting power flow through a part of the region not involved in the transfer can be
significant.
When considered independently, these transfers may not appear to pose a problem within
the maximum permissible transfer value. But for certain combinations of simultaneous
power transfers, portions of the interconnected network could experience significant power
flow increases when the response to the transfer is in the same direction.
Conversely, a transaction may also decrease the prevailing flow and allow for increased
transfers. The responsiveness of selected elements within the MEN network to multiple
transfers can be evaluated by use of the transfer response factors given in Appendix B.
Using superposition, these tables enable the calculation of the power flows on facilities
and interfaces for combinations of simultaneous transfers. These response characteristics
demonstrate the possibility for strong interaction among certain transfers.
2002 Summer MEN Interregional Transmission System Reliability Assessment
9
Docket No. ER11-1844
Exhibit No. NYI-16
Page 14 of 40
RESULTS
C.
Discussion of Results (cont.)
Comparison of 2002 Summer Results with 2001 Summer Results
The following discussion of differences between the 2001 Summer and 2002 Summer
FCTTCs is based principally on the results presented in Table 1.
The use of the FCTTC values to compare results from one time period to another, as
opposed to using the FCITCs, is deemed more appropriate to capture the effect of variation
in base case transfers. The FCTTC values used in the comparison are the algebraic sums
of the FCITC values and the appropriate total interregional base case transfers.
NPCC Export Limits
NPCC (NYISO) to MAAC
The NPCC to MAAC transfer capability is unchanged from the results of the 2001
summer study.
NPCC (NYISO) to ECAR
The NPCC to ECAR transfer capability is essentially the same (50 MW decrease) as
reported in the 2001 Summer MEN Study. The limiting contingency is the same as 2001
Summer (Erie West-Wayne 345 kV).
NPCC Import Limits
MAAC to NPCC (NYISO/IMO)
The MAAC to NPCC transfer capability remained approximately the same as the results of
the 2001 summer study. The change in the location of the limiting facility is due to the
difference in the PAR representation.
ECAR to NPCC (NYISO/IMO)
The transfer capability from ECAR to NPCC is 300MW higher than was reported in the
2001 summer study. The limiting facility and contingency have shifted to northwestern
Pennsylvania, while the 2001 summer study limiting facility and contingency were located
in western Ontario. The Ontario-Michigan Interface PAR settings used in the 2001 study
contributed to the difference in results.
2002 Summer MEN Interregional Transmission System Reliability Assessment
10
Docket No. ER11-1844
Exhibit No. NYI-16
Page 15 of 40
RESULTS
D. TLR Discussion
The NERC Transmission Loading Relief (TLR) procedure has been implemented as an
interconnection-wide procedure to properly identify the causes of adverse parallel flows
and to assist in their relief in the event of thermal, voltage or stability limitations.
The use of the TLR procedures by MEN participants has been decreasing. TLR facilities
identified as limits to transfers in the past will be less restrictive than the FCITCs reported
in Table 1 for this upcoming summer period. Transfer distribution factors for all MEN
Region NERC ISN Flowgates that exhibit significant response to MEN Region transfers
are included in Table B-1.1. The facilities in this Table include those identified in this and
past MEN studies as limits to inter-regional transfers plus many of the facilities involved
in TLR actions during actual system operation (e.g. IMO-Michigan path, 500 kV and 345
kV in eastern Ohio-western Pennsylvania). Financial congestion management rather than
TLR actions are typically used to alleviate congestion problems in several MEN area
market systems (NYISO, PJM and IMO).
This decreasing trend is expected to continue due in part, to the integration of PJM West
into PJM’s energy market operation and the Phase Angle Regulating transformers on the
Michigan-Ontario interface.
2002 Summer MEN Interregional Transmission System Reliability Assessment
11
Docket No. ER11-1844
Exhibit No. NYI-16
Page 16 of 40
RESULTS
Figure 1A
Simultaneous Transfer Capability - MAAC to NPCC/ECAR
(see discussion under “Results, Simultaneous Transfer Capability”)
2002 Summer MEN Interregional Transmission System Reliability Assessment
12
Docket No. ER11-1844
Exhibit No. NYI-16
Page 17 of 40
RESULTS
Figure 1B
Simultaneous Transfer Capability - ECAR to MAAC/NPCC
(see discussion under “Results, Simultaneous Transfer Capability”)
2002 Summer MEN Interregional Transmission System Reliability Assessment
13
Docket No. ER11-1844
Exhibit No. NYI-16
Page 18 of 40
RESULTS
Figure 1C
Simultaneous Transfer Capability - NPCC to MAAC/ECAR
(see discussion under “Results, Simultaneous Transfer Capability”)
2002 Summer MEN Interregional Transmission System Reliability Assessment
14
Docket No. ER11-1844
Exhibit No. NYI-16
Page 19 of 40
RESULTS
Figure 2A
2001 Summer Study Simultaneous FCTTC
and Scheduled Interchange (’+’)
MAAC to NPCC/ECAR
2002 Summer MEN Interregional Transmission System Reliability Assessment
15
Docket No. ER11-1844
Exhibit No. NYI-16
Page 20 of 40
RESULTS
Figure 2B
2001 Summer Study Simultaneous FCTTC
and Scheduled Interchange (’+’)
ECAR to MAAC/ NPCC
2002 Summer MEN Interregional Transmission System Reliability Assessment
16
Docket No. ER11-1844
Exhibit No. NYI-16
Page 21 of 40
RESULTS
Figure 2C
2001 Summer Study Simultaneous FCTTC
and Scheduled Interchange (’+’)
NPCC to MAAC/ECAR
2002 Summer MEN Interregional Transmission System Reliability Assessment
17
Docket No. ER11-1844
Exhibit No. NYI-16
Page 22 of 40
RESULTS
Figure 3A
2001 Summer Study Simultaneous FCTTC
with Scheduled Interchange ('+') and Actual Tie Flow (‘0’)
MAAC to NPCC/ECAR
2002 Summer MEN Interregional Transmission System Reliability Assessment
18
Docket No. ER11-1844
Exhibit No. NYI-16
Page 23 of 40
RESULTS
Figure 3B
2001 Summer Study Simultaneous FCTTC
with Scheduled Interchange ('+') and Actual Tie Flow (‘0’)
ECAR to MAAC/NPCC
2002 Summer MEN Interregional Transmission System Reliability Assessment
19
Docket No. ER11-1844
Exhibit No. NYI-16
Page 24 of 40
RESULTS
Figure 3C
2001 Summer Study Simultaneous FCTTC
with Scheduled Interchange ('+') and Actual Tie Flow (‘0’)
NPCC to MAAC/ECAR
2002 Summer MEN Interregional Transmission System Reliability Assessment
20
Docket No. ER11-1844
Exhibit No. NYI-16
Page 25 of 40
RESULTS
Figure 4
Non-simultaneous Interregional Transfer Capability
NPCC
4000
4450
3750
382
18
3050
4000+
3500
MAIN
MAAC
252
ECAR
321
4000+
260
534
4000+
109
4000+
2950
VACAR
REMAINDER OF SERC
(Excluding SEPA Generation)
174
First Contingency
Incremental Transfer
This figure includes values obtained from the companion
Capability (FCITC)
2002 Summer VEM Interregional Transmission System
Reliability Assessment
Base Scheduled
Power Interchanges
(see Appendix A, Table A-1)
2002 Summer MEN Interregional Transmission System Reliability Assessment
21
Docket No. ER11-1844
Exhibit No. NYI-16
Page 26 of 40
RESULTS
Table 1
Comparison of Results (FCITC and FCTTC) with Previous Years
Transfer
FCITC
FCTTC
Limiting Facility
Contingency
NPCC - MAAC
2002 Summer
3050
3050
Homer City 345/230 kV #2 (FE)
Homer City 345/230 kV #1 (FE)
2001 Summer
3450
3050
Homer City 345/230 kV #2 (FE)
Homer City 345/230 kV #1 (FE)
2000 Summer
2800
2350
Homer City -Shelocta 230 kV (FE)
Base Case-No Contingency
NPCC - ECAR
2002 Summer
3750
4150
Homer City-Shelocta 230 kV #1 (FE)
Erie W - Wayne 345 kV (FE)
2001 Summer
3550
4200
Erie South-Erie East 230 kV (FE)
Erie West-Wayne 345 kV (FE)
2000 Summer
2650
3300
Dumont 765/345 kV (AEP)
Cook 765/345 kV (AEP)
MAAC - NPCC
2002 Summer
4450
4450
East Towanda-Hillside 230 kV (FE - NYSEG)
Homer City-Watercure 345 kV (FE - NYSEG)
2001 Summer
4050
4400
Scott-Buchanan N22W 220 kV (IMO)
Scott - Buchanan 220 kV N21W (IMO)
2000 Summer
2850
3300
North Meshoppen 230/115 kV (FE)
Base Case-No Contingency
ECAR - NPCC
2002 Summer
4000
3600
Erie West 345/115 kV #1 (FE)
Erie South 345/230 kV #1 (FE)
2001 Summer
4000
3300
Scott - Buchanan 220 kV N22W (IMO)
Scott - Buchanan 220 kV N21W (IMO)
2000 Summer
4200
3500
North Meshoppen 230/115 kV (FE)
Homer City - Watercure 345 kV (FE - NYSEG)
2002 Summer MEN Interregional Transmission System Reliability Assessment
22
Docket No. ER11-1844
Exhibit No. NYI-16
Page 27 of 40
RESULTS
Table 2
Limiting Facility / Contingency
Rating
TDF
ODF
OTF
Transfer Level -
FCITC
(MVA)
%
%
%
3000 MW & 4000 MW
1, 2
NPCC (NYISO) - MAAC
3050
Homer City 345/230 kV #2 (FE) /
699
12.9
81.8
23.7
Homer City 345/230 kV #1 (FE)
13.2
3700
2 Homer City -Shelocta 230 kV #1 (FE) /
854
17.4
46.0
18.1
Wayne-Handsome Lake 345 kV #1 (FE)
1.5
NPCC (NYISO) - ECAR
3750
3 Homer City-Shelocta 230 kV (FE) /
854
13.4
57.5
16.7
Erie West-Wayne 230 kV #1 (FE)
6.7
3800
3 Homer City 345/230 kV #2 (FE) /
699
8.6
79.9
11.2
Homer City 345/230 kV #1 (FE)
3.1
MAAC-NPCC
4450
4 East Towanda- Hillside 230 kV (FE - NYSEG) /
531
19.7
23.4
22.6
(NYISO-50%/IMO-50%)
Homer City - Watercure 345 kV (FE - NYSEG)
12.5
4550
4 Erie SE 230/115 #3 (FE)/
276
1.5
74.5
11.3
Erie So- Erie SE 230 kV #1 (FE)
13.0
ECAR-NPCC
4000
2 Erie West 345/115 kV #1 (FE)/
285
1.2
31.4
4.4
(NYISO-50%/IMO-50%)
Erie South 345/230 kV #1 (FE)
10.3
4050
2 Scott - Buchanan 220 kV N22W (IMO) /
556
7.5
42.2
9.7
Scott - Buchanan 220 kV N21W (IMO)
7.6
1)
3000 MW Transfer Level.
2) Warren-Falconer circuit opened.
3) East Sayre-North Waverly circuit opened.
4) Warren-Falconer and East Sayre-North Waverly circuits opened.
2002 Summer MEN Interregional Transmission System Reliability Assessment
23
Docket No. ER11-1844
Exhibit No. NYI-16
Page 28 of 40
RESULTS
Figure 5
Location of Limiting Facilities
Buchanan
Scott
Hillsdale
Erie S.
Erie W.
E. Towanda
Homer City
Shelocta
Transmission Circuit
Transformer
2002 Summer MEN Interregional Transmission System Reliability Assessment
24
Docket No. ER11-1844
Exhibit No. NYI-16
Page 29 of 40
BACKGROUND INFORMATION
3. Background Information
Information regarding the basis for the analysis, the simulated test scenarios and the study
procedure are discussed in this section in order to help the reader understand how the
limitations were calculated in this assessment and to properly interpret the results
presented in this report.
A. Base Case Development
The 2002 Summer Assessment base case was developed from the NERC/MMWG
2002 Summer peak load base case, which modeled firm, capacity backed transfers.
This case was updated with the most recent transmission system status information
and projected transfers. Appendix A provides information regarding the expected
2002 summer system conditions. Table A-1 lists the transfers modeled in this
summer assessment as compared to those modeled in the 2001 Summer assessment.
The appendix includes a geographical map of interregional and subregional ties,
interregional and subregional tie flows, regional flow diagrams, major EHV
generation and transmission additions, and modeled phase angle regulator settings.
B. Study Procedure
To examine the ability of the MEN network to support transfers between the member
regions, 3000 MW and 4000 MW test transfer cases were developed for each of the
four transfers studied. Each test transfer case was created by imposing the test
transfer on the base case and making the necessary system adjustments required to
support the transfer. Linear analysis, which utilizes linear transfer response and
outage response factors, was used to screen the transmission system modeled in the
test transfer base cases. For the first transfer limit stated for each transfer analyzed,
the value reported was further verified by conventional AC load flow analysis. Once
determined, no attempts were made to optimize transfers between regions by
changing dispatches and/or phase angle regulator settings.
Ratings used in the determination of transfer capabilities include the following:
• The thermal facility ratings which are actually used in system operations
• Bus voltage limits
• Aggregate interface or line flows used to monitor stability or voltage performance
Phase Angle Regulator (PAR) control is used on the four 345 kV ties and one 230 kV
tie between the Consolidated Edison Company (CON ED) and the Public Service
Electric and Gas Company (PSEG) to maintain an alternative transmission path
through the northern part of PSEG at Waldwick and into CON ED at Farragut and
Goethals. Power flow on the Branchburg (PSEG)-Ramapo (CON ED) 500 kV
interconnection is controlled by PARs at Ramapo in accordance with the PJM/NYPP
2002 Summer MEN Interregional Transmission System Reliability Assessment
25
Docket No. ER11-1844
Exhibit No. NYI-16
Page 30 of 40
BACKGROUND INFORMATION
B. Study Procedure (cont’d)
Unscheduled Transmission Service Agreement between PJM and the New York
Power Pool (NYISO). As defined by this agreement, the PARs are adjusted in
accordance with appropriate operating agreements and instructions to relieve
transmission and/or capacity limitations, which may arise in either PJM or NYISO.
The Ramapo PARs are set to import 1000 MW (from Branchburg) for all NPCC
import simulations and to export 1000 MW (to Branchburg) for all NPCC export
simulations. In the base case, the Ramapo PAR scheduled flow is 386 MW from
Branchburg to Ramapo as compared to 530 MW in the 2001 Summer Assessment.
PAR control is also used on the 230 kV tie J5D (Keith to Waterman) between Ontario
(NPCC) and Michigan (ECAR) to increase transfer capability between NPCC and
ECAR and to alleviate limit violations in these areas. The transfer capabilities have
been calculated with favorable J5D PAR settings. Table A-5 tabulates the PARs
controlled interchange for this summer study and for the 2001 Summer study.
Transfer response factors (see Tables B-1.2) for selected interfaces and transmission
facilities were calculated for various transactions. Line outage distribution factors
(see Tables B-2.1 through B-2.8) were also determined for selected transmission
facilities. These factors provide a means of investigating the impact of emergency
transfers (either alone or in combination with other transfers) or a variation in one of
the economy transfers included in the base case. Also, a number of generation bus
shift response factors (see Tables B-3.1 through B-3.6) were calculated for the same
selected interfaces and transmission facilities noted above. These factors provide a
means of determining the impact of the loss of generating capacity at any of the
several major power plants within the MEN systems.
For NPCC import simulations, the proportion assumed in this study is 50% by the
NYISO and 50% by IMO. For NPCC export simulations, the proportion assumed in
this study is 100% by the NYISO.
The MEN Study Committee recognizes the parallel effort by the NERC Interchange
Distribution Calculator Working Group (IDCWG) to calculate Power Transfer
Distribution Factors (PTDFs) to support the Transmission Line Loading Relief (TLR)
procedures. The PTDFs are calculated for a set of defined Flowgates in response to
specific source-sink Control Area transfers. Apart from a very small number of the
Flowgates, which are essentially the same as some of the interfaces assessed in the
MEN appraisal, the majority of the monitored elements are very different. The
parallel MEN effort and the IDCWG effort are therefore very different in scope,
products and users, and as such do not participate in an overlapping effort. The MEN
Study Committee thus holds the opinion that the various sets of factors produced in
the seasonal appraisal continues to be required as a distinct effort, which provides
significant value to the MEN system operation community.
2002 Summer MEN Interregional Transmission System Reliability Assessment
26
Docket No. ER11-1844
Exhibit No. NYI-16
Page 31 of 40
REGIONAL APPRAISALS
4. Regional Appraisals
A. MAAC Appraisal
The ability of the MEN interconnected network to support transfers into and out of
MAAC was assessed for the 2002 summer peak load period. On April 1st, 2002
Allegheny Power was fully integrated as part of PJM’s energy market operations and
became PJM West. Duquesne Light Company is expected to join PJM West on
September 1, 2002. In addition, in early March, a portion of Orange and Rockland
Utilities Inc. load located in New Jersey was incorporated into PJM’s pool operations
and MAAC.
Comparison of the limits reported in this assessment with those reported in previous
assessments must be tempered with the realization that this summer’s assessment
reflects the evolving market alliances and integrated operations that do not mirror
NERC reliability regions. The limits reported for transfer capabilities involving
MAAC are comparable to those reported for the 2001 Summer assessment
Base Conditions
This summer, the net tie line flow into MAAC is 599 MW compared with 74 MW out
of MAAC last summer.
The net ECAR to MAAC transfers decreased this summer to 321 MW from 618 MW
last summer. The net interchange from NPCC to MAAC of 18 MW reflects the
Orange and Rockland Utilities Inc. load located in New Jersey that was incorporated
into PJM’s pool operations and MAAC. As was the case last summer, there are no
MAAC to VACAR transfers represented.
Generation
As is typical for the MAAC region, discrete generation was forced out to model
typical unit maintenance and Effective Forced Outage Rates (EFOR). Table A-5
provides a complete listing of major generator outages. An aggregate of 4100 MW of
new generation is expected to be placed in service prior to the summer peak.
Transmission
A coordinated operation with NYISO allows for readjustment of the Ramapo PAR
schedule, as well as the PSEG - CON ED wheel PARs, to alleviate PJM system
limits.
2002 Summer MEN Interregional Transmission System Reliability Assessment
27
Docket No. ER11-1844
Exhibit No. NYI-16
Page 32 of 40
REGIONAL APPRAISALS
A. MAAC Appraisal (cont’d)
MAAC Operating Procedures
Operating procedures can be employed in the course of study analysis to increase
transfer capabilities among the three regions. MAAC operating procedures exist
which allow system operators to open selected 115 kV and 138 kV tie lines with
surrounding Regions to relieve overloads under emergency transfer conditions.
Instances where these procedures have been employed are noted in Table 1.
2002 Summer MEN Interregional Transmission System Reliability Assessment
28
Docket No. ER11-1844
Exhibit No. NYI-16
Page 33 of 40
REGIONAL APPRAISALS
B. ECAR Appraisal
The 2002 Summer Assessment included an evaluation of the ECAR region’s ability to
support transfers into or out of the NPCC region. For the 2002 Summer conditions
modeled, the ECAR region exhibits thermal limitations to regional transfers as shown
in Table 1. Functional control and operation of the Allegheny Power and the
Duquesne Light transmission systems will be performed by PJM this summer.
Therefore, the transfer capability analysis included AP and DLCO as part of the
MAAC dispatch for the 2002 Summer Assessment. For all other purposes AP and
DLCO are still represented as part of ECAR.
Incremental and total transfer capabilities for the NPCC to ECAR path are limited to
3750 MW and 4100 MW respectively by the Homer City - Shelocta 230 kV (FE) line
for an outage of the Erie West - Wayne 345 kV (FE) line. These transfer capabilities
are 200 MW higher and 100 MW lower as compared to the respective limits reported
for the 2001 Summer assessment. The decrease in FCTTC can be attributed primarily
to lower ECAR to MAAC base transfers.
Incremental and total transfer capabilities for the ECAR to NPCC path are limited to
4000 MW and 3600 MW respectively by the Erie West 345/115 kV Transformer #1
for an outage of the Erie South 345/230 kV Transformer 1. While the incremental
transfer limit was unchanged, the total transfer capability increased by 300 MW as
compared to the respective limit reported for the 2001 Summer assessment. The
increase in the FCTTC can be attributed primarily to lower ECAR to MAAC base
transfers.
The 2002 Summer reliability assessment base case was developed from the
NERC/MMWG 2002 Summer peak load base case and was updated with the most
recent Michigan to Ontario PAR transmission system status information and projected
transfers.
Generation
Since Summer 2001 over 9,200 MW of additional generation has been modeled
within ECAR. Refer to Table A-4 for a detailed listing of generator additions.
Load
The 2002 Summer ECAR load plus losses, including AP and DLCO, is about 105,000
MW, an increase of approximately 1,800 MW or 1.7% compared with that of the
2001 Summer model.
2002 Summer MEN Interregional Transmission System Reliability Assessment
29
Docket No. ER11-1844
Exhibit No. NYI-16
Page 34 of 40
REGIONAL APPRAISALS
ECAR Appraisal (cont’d)
Transmission Facilities
Major transmission facility changes since Summer 2001 are:
• A second Dumont 765/345 kV transformer.
• Generation connection facilities.
These and other ECAR facility additions are indicated in Table A-3.
Installation of a second 765/345 kV, 1,500 MVA transformer at the Dumont station in
Northern Indiana is currently under way, with an in-service date of June 1st, 2002. The
addition of this transformer will reduce contingency loadings on the existing Cook
and Dumont 765/345 kV (AEP) transformers, resulting in increased transfer
capability to the north and west.
The Michigan - Ontario interface and the Queenston Flow West (QFW) interface in
Ontario have been susceptible to large parallel flows and Transmission Loading
Relief (TLR) curtailments. Delays have prevented the three new Phase Angle
Regulating (PAR) transformers on the Michigan - Ontario Interface from becoming
operational. Transformer testing failures have impacted the Lambton PARs, L51D
and L4D, and operating agreements have impeded the B3N PAR from becoming
operational. The J5D PAR is the only operating unit modeled in the 2002 Summer
base case.
Base Transfers
ECAR’s base imports in this study are 53 MW higher than the 2001 Summer Study
with imports from VACAR essentially remaining the same. The 2002 Summer base
transfer levels from NPCC to ECAR are 300 MW less and the ECAR to MAAC
transfers are 500 MW less than the 2001 Summer Study.
Refer to Tables A-1 and A-2 for a detailed comparison of transfers in the 2002 vs.
2001 Summer Study.
Operating Procedures
As identified in Appendix C, various ECAR operating procedures are available at the
discretion of system operators.
The Warren - Falconer and East Sayre - North Waverly operating procedures were
invoked to obtain the ECAR export/import transfer limits in this study.
2002 Summer MEN Interregional Transmission System Reliability Assessment
30
Docket No. ER11-1844
Exhibit No. NYI-16
Page 35 of 40
REGIONAL APPRAISALS
C. NPCC Appraisal
The 2002 Summer MEN Reliability Assessment presents an evaluation of NPCC’s
ability to support exports to and imports from the MAAC and ECAR Regions. The
incremental and total transfer capabilities determined in this assessment are discussed
in Section 2, Results.
Base Transfers
NPCC’s base transfers include a net export of 382 MW to ECAR, a decrease of
300 MW from the 2001 Summer schedule, and a net import of 392 MW from
MAAC, unchanged from 2001 summer. Also, as in last summer’s base case, NPCC
imports 200 MW from MAPP, scheduled from Manitoba Hydro to Ontario. The net
NPCC export is -210 MW compared to a net export of 90 MW in the 2001 summer
case. Table A-1 compares the individual transfers for the 2001 and 2002 summer base
cases.
Transmission System Performance
Incremental and total transfer capabilities for NPCC to ECAR and MAAC to NPCC
show an increase compared to the 2001 summer study results, while those for NPCC
to MAAC show a decrease and ECAR to NPCC remains unchanged. Transmission
limits for all of these transfers are in the in the New York-Pennsylvania or Ontario-
Michigan Interface paths.
Refer to Figure 1C for simultaneous transfer capability information for NPCC-ECAR
and NPCC-MAAC transfers. The detailed incremental and total transfer capabilities
determined in this assessment are discussed in Section 2, Results. Of the Michigan-
Ontario Interface phase angle regulators (PARs) only the Keith-Waterman (J5D) PAR
is set to control MW flow in the 2002 summer Study. The return to service of the
Lambton-St. Clair circuit L4D PAR has been delayed past the expected summer peak.
The Scott-Bunce Creek B3N and Lambton-St. Clair L51D PARs are in service but are
operated on neutral tap.
The existing Ontario operating procedures to relieve potential Buchanan Longwood
Input limitations (BLIP) and Ontario-Michigan interface limitations are identified in
Appendix C. These operating procedures will still be available at the discretion of
system operators as will the NYISO Security Constrained Dispatch procedure.
NPCC Region Appraisal
The NPCC region encompasses the five control areas of Ontario, New York, New
England, Quebec and the Maritimes. Analyses of conditions in each of the NPCC
Areas are discussed except the Maritime Area. Because of its location, The
2002 Summer MEN Interregional Transmission System Reliability Assessment
31
Docket No. ER11-1844
Exhibit No. NYI-16
Page 36 of 40
REGIONAL APPRAISALS
Maritimes does not have significant impact on the determination of the MEN
interregional transfer capabilities.
Analysis of Load and Generation Resources
A total NPCC Region demand of over 102,000 MW was modeled in the 2002
Summer MEN studies. Overall, sufficient resources are expected to be available to
meet reserve requirements.
An Ontario demand of 23,100 MW was modelled for the MEN 2002 Summer case. The
Transfer capabilities reported are not strongly influenced by Ontario’s peak demand.
Generation resources and purchases will be adequate to meet this demand.
The tower contingencies that limit transfers during normal operation are outside the
MEN study scope. Ontario can deliver about 2000 MW to New York over the
Niagara ties in the summer. Ontario can receive about 1000 MW from New York at
Niagara before circuits associated with the Queenston Flow West (QFW) interface
will become limiting. Another 400 MW can be transferred between Ontario and New
York at the eastern end of Lake Ontario over the phase shifter controlled circuits
L33P and L34P.
For the summer of 2002, the Michigan-Ontario phase shifters are not expected to
materially reduce parallel flows. The phase shifters installed in B3N and L51D are
expected to remain on neutral tap. The L4D phase shifter shall be in service at the
end of 2002. With three Lambton units in service, Ontario will be able to deliver
about 2000 MW to Michigan and receive about 1300 MW from Michigan. More
power can be imported from Michigan when Lambton generation is reduced.
Changing practices have made it no longer possible to exploit the short time ratings of
the tie circuits on a day-to-day basis. Using the STE ratings would boost transfer by
about 100 MW towards Michigan and 200 MW to Ontario.
The Summer 2002 forecast peak for the New York Control Area is 30,475 MW,
which is 145 MW lower than the Summer 2001 forecast of 30,620 MW. This
forecast is 1.6% lower than the all time peak of 30,983MW that occurred on
August 9, 2001. For peak load normalization, the NYISO uses a Temperature-
Humidity Index (THI) value of 82.2. At forecast load levels, a one-degree increase in
the THI will result in approximately 500 MW of additional load. The forecast reflects
the transfer of the Rockland Electric Co. load (approximately 430 MW) from the NY
control area to the PJM control area.
The NYISO conducts semi-annual and monthly Installed Capability (ICAP) auctions.
Based on the forecast load for 2002, the ICAP requirement is 35,961 MW based on
the 18% installed reserve margin requirement. When allowances are taken for
unplanned outages (based on historical performance of 10.8% unavailable capacity),
2002 Summer MEN Interregional Transmission System Reliability Assessment
32
Docket No. ER11-1844
Exhibit No. NYI-16
Page 37 of 40
REGIONAL APPRAISALS
the net available resources will be 31,908 MW, which will not be sufficient to meet
the New York Control Area (NYCA) load and operating reserve requirement during
the peak load hours. A negative reserve margin of approximately 367 MW is
expected at peak conditions. NYISO expects approximately 1,100 MW of load relief
from emergency procedures that include internal load curtailment by the transmission
owners, public appeals and 5% system wide voltage reductions, and up to 400 MW
relief available from the Emergency Demand Response Program and Special Case
Resources participants.
Prior to the summer 2002 peak load period, NYISO expects up to 576 MW of
capacity additions and enhancements. Of these capacity additions 140 MW is located
in the New York City (NYC) load zone and 436 MW in the Long Island (LI) load
zone.
During the second half of 2001 and continuing into 2002, precipitation over much of
the NPCC Areas was below average and is approaching drought conditions.
Snowpack in the watershed areas continues well below normal through mid-winter
2002. Should water use restrictions arise; there are concerns about the impact on
generating capacity.
In addition to the traditional concern about the impact of drought conditions on
generating capacity, water-use restrictions may also impact the availability of
combustion turbine generators that use water for inlet air cooling (power recovery) or
for NOx control. NYISO is evaluating the potential impact of this particular scenario.
The New England 2002 summer peak demand (Net Internal Demand) is 24,200 MW.
This projected peak demand is 767 MW (3.2%) lower than last year’s actual summer
peak of 24,967 MW, which occurred on August 9th, and it is 2,423 MW higher
(10.7%) than the previous all time peak of 22,544 MW, which occurred on July 6th,
1999. New England set new all time peak loads on five separate occasions during the
summer of 2001. The record load levels were the result of unusually high heat and
humidity throughout New England.
New England is forecasting sufficient capacity to meet the projected peak for the
summer 2002 and the shoulder months. However, there are concerns that some sub-
regions within New England that have a greater loss of load expectation as a result of
load increasing faster than supply and internal transmission constraints. These sub-
regions include: southwest Connecticut; Norwalk, Connecticut; and Boston,
Massachusetts.
Net Operable Capacity resources from NEPOOL Participant and Non-Participant
sources of 27,032 MW (August) include 2,988 MW from new generation internal to
NEPOOL. Since the in-service date of these new units will impact the summer
capacity situation, ISO New England closely monitors the construction and
commissioning progress of these new generators. The known of average monthly
2002 Summer MEN Interregional Transmission System Reliability Assessment
33
Docket No. ER11-1844
Exhibit No. NYI-16
Page 38 of 40
REGIONAL APPRAISALS
summer external capacity purchases are approximately 537 MW, which includes 310
MW of NEPOOL Participant Entitlement Contracts from Hydro-Québec, 100 MW
from New Brunswick, and 127 MW from New York. It is expected that additional
capacity backed contracts for the summer period will be initiated before June 1.
The forecast Hydro-Québec internal demand for the summer of 2002 is 21,064 MW,
expected to occur in May. The forecast for the September 2002 monthly peak is
19,830 MW. The actual peak demand for the 2001 summer was 19,725 MW, which
occurred in August.
In September, the total capacity (including Churchill-Falls) sums up to 36,528 MW,
of which 6,924 MW are inoperable. The net operable capacity is therefore 29,604
MW. With purchases, other than Churchill-Falls, of 300 MW and full responsibility
sales expected to be 1225 MW the available capacity margin is evaluated at 8,849
MW for September. A minimum capacity margin of 7,777 MW is expected in
August.
Transmission System Analysis
Phase angle regulators (PARs) were installed on the Ontario-Michigan tie lines L51D
and B3N, to complement the PAR capability already installed on tie line J5D. The B3N
PAR is by-passed, while the L51D PAR is on neutral tap. A new PAR will be installed
on tie line L4D. Its projected in-service date is beyond the summer of 2002. When
operational, the four PARs will allow the Ontario-Michigan flows to be maintained
closer to schedule. The transfer capability between Ontario-Michigan will also improve
once the PARs are in-service and operated as intended.
Construction of the TransAlta - Sarnia Regional Cogeneration Plant (SRCP) project
in Sarnia is currently underway and full commercial operation is scheduled beyond
the summer of 2002. This project is to be incorporated into Scott Transformer Station
(TS) via 230 kV radial circuits N6S and N7S. Circuits N7S and N6S are composed of
two sections. The first section of circuit N6S, from Scott TS to Imperial Oil Complex
is an existing one and is already in service. The first section of circuit N7S, between
Scott TS and the Imperial Oil Complex, went into service March 19, 2002. The
remaining sections of circuit N7S and N6S, from the Imperial Oil Complex to
TransAlta - SRCP are expected to come into service May 2002.
Interregional transmission transfer capability studies have been conducted to determine
levels of external assistance that can be imported into Ontario during the forecast 2002-
summer peak demand. The study results are reflected in the FCITCs.
In New York there are no major transmission line additions scheduled for the bulk
power system for the summer 2002 period.
2002 Summer MEN Interregional Transmission System Reliability Assessment
34
Docket No. ER11-1844
Exhibit No. NYI-16
Page 39 of 40
REGIONAL APPRAISALS
Phase II of the Marcy Flexible AC Transmission System (FACTS) Demonstration
Project is scheduled to be available for operation during the Summer 2002. This first
step in the Phase II of this project expands the FACTS Convertible Static
Compensator (CSC) device to allow operation as a series synchronous static
compensator (SSSC) that can dynamically regulate the transmission system power
flows on either the Marcy - Coopers Corners or Marcy - New Scotland 345kV
circuits. Additional work to be performed later in the 3rd and 4th quarters of 2002 will
increase the total number of operating configurations of the CSC to eleven modes. In
addition to the CSC enhancements, the project also includes the addition of a 200
MVar shunt capacitor bank at the Edic 345 kV station.
A second 345/115 kV transformer will be placed in service at Central Hudson’s Rock
Tavern station. While this facility will not impact the overall power transfer
capability, it will enhance the reliability in the lower Hudson Valley region of New
York.
Transmission work associated with the Athens Generation project is expected to be
completed prior to the summer peak load period. The existing Leeds - Pleasant
Valley 345 kV circuit #91 will be reconfigured as the Leeds - Athens circuit #95 and
Athens - Pleasant Valley circuit #91. This transmission change will not have any
significant impact on system power flows during the peak load period.
In New England no critical transmission circuits are scheduled to be out-of-service
during the summer 2002 period. Additional transmission resources are expected to
become available for the summer of 2002.
These additions include:
• Boston Area transmission upgrades which include a new 345 kV line: between
Mystic and North Cambridge substations for the interconnection of the new
Mystic generator.
• South Agawam Substation reconfiguration such that the Berkshire Power
Plant could serve load in both western Massachusetts and Connecticut.
• Construction of a new 345 kV substation and replacement of terminal
equipment at the Card Street substation for the interconnection of the new
Lake Road generators in eastern Connecticut.
• Capacitor additions for voltage support in Southwest Connecticut and New
Hampshire.
• Cross Sound Cable Project, construction of a 330 MW HVdc line and HVdc
Converter Facilities between East Shore Substation in New Haven,
Connecticut and the Shoreham Substation on Long Island, New York.
2002 Summer MEN Interregional Transmission System Reliability Assessment
35
Docket No. ER11-1844
Exhibit No. NYI-16
Page 40 of 40
REGIONAL APPRAISALS
No significant upgrade by TransÉnergie of the high voltage transmission system is
planned for 2002 and no significant addition of capacity resources by Hydro-Québec
is expected.
Interregional transmission transfer capability studies have been conducted to determine
levels of external assistance that can be imported during the forecast 2002-summer peak
demand. The study results are reflected in the FCITCs.
All existing interconnections with neighboring utilities are expected to be available
for the summer period. No significant generation capacity has been added to the
system this year. No significant transmission facilities have been added either.
2002 Summer MEN Interregional Transmission System Reliability Assessment
36
DOCKET NO. ER11-1844
EXHIBIT NO. NYI-17
Docket No. ER11-1844
Exhibit No. NYI-17
Page 1 of 61
Northeast Power Coordinating Council
Reliability Assessment
For
Summer 2003
Approved by the Task Force on Coordination of Operation
May 2003
Docket No. ER11-1844
Exhibit No. NYI-17
Page 2 of 61
Table of Contents
Table of Contents
2
1. Executive Summary
4
2. Introduction
6
3. Demand Forecasts for 2003
7
4. Resource Adequacy
13
5. Potential Usage of Operating Procedures
19
6. Operational Readiness for 2003
24
7.
2002 Post-Seasonal Assessment and Historical Review
42
8.
2002 Reliability Assessments of Neighboring Regions
48
Appendix I - 2003 Expected Load and Capacity Forecasts
51
Appendix II - NPCC Operational Procedures
57
Appendix III - Web Sites
60
Appendix IV - References
61
Page 2
Docket No. ER11-1844
Exhibit No. NYI-17
Page 3 of 61
Information provided in this report has been provided by the Operations Planning
Working Group of the NPCC Task Force on Coordination of Operation with additional
information from Reliability Councils adjacent to NPCC.
The working group members are:
Robert Waldele (Chair)
New York ISO (NYISO)
Scott Hodgdon
ISO New England (ISO-NE)
Wendell Ingalls
Nova Scotia Power
Al Miller
Independent Electricity Market Operator (IMO)
Barry Milton
New Brunswick Power
Paul Roman
Northeast Power Coordinating Council (NPCC)
Robert Sauriol
TransEnergie
Information from neighboring Reliability Councils provided by:
Bill Harm
PJM Interconnection, LLC and Mid-Atlantic Area Council
(MAAC)
Jeff Mitchell
East Central Area Reliability Coordination Agreement
(ECAR)
Additional support by:
Phil Fedora (Chair CP-8)
Northeast Power Coordinating Council (NPCC)
Page 3
Docket No. ER11-1844
Exhibit No. NYI-17
Page 4 of 61
1. Executive Summary
This report focuses on the assessment of reliability within NPCC for the summer of
2003. Portions of this report are built on work previously done for the NPCC
Reliability Assessment for Summer 2002.
The Summer 2003 Operations Planning Working Group worked closely with the
representatives of the NPCC CP-8 Working Group to ensure results are based on
consistent data and modeling assumptions between the two studies.
Those aspects that the Summer Operations Planning Working Group have examined
to determine the reliability and adequacy for NPCC for the summer of 2003 are
discussed in detail in the specific report sections. The following Summary of Findings
address the significant points of the report discussion. These findings are based on
forecasted projections of: load requirements, resource configurations and
transmission configurations. This report evaluates NPCC and the associated Area’s
ability to deal with the differing resources and transmission configurations and
recommends several actions to reasonably ensure that NPCC and the associated Areas
are prepared to deal with possible uncertainties identified in this report.
Summary of Findings
• The following assessment of the forecasted capacity outlook was made for the
week with the lowest overall NPCC margin (week beginning June 22, 2003)1.
The lower NPCC net margin is influenced by lower net margins in New York and
Ontario. These lower margins can primarily be attributed to slightly higher
planned and/or unplanned generation outages than during the projected peak load
week. The overall resource adequacy for the NPCC region during this week
indicates that there will be approximately 8,100 MW of operable spare capacity.
However, during this week over half of this spare capacity is in the Quebec and
Maritimes Areas. The transfer capability between the Quebec and Maritimes
Control Areas to the remainder of NPCC will not permit the usage of all the
declared spare capacity. In addition, transmission constraints may limit the ability
to transmit the New Brunswick and southeastern New England capacity to other
NPCC Areas. Therefore, it is estimated that the net margins for NPCC are
reduced by approximately 2,800 MW over this week (June 22, 2003) to account
for this bottled capacity. As a result of this bottling, the spare capacity available
to the remainder of NPCC is approximately 5,300 MW over this week. While
New York and Ontario are projecting some relatively low margins during portions
of the report period, after accounting for bottled resources, there should be
sufficient resources to meet the forecasted load projections and operating reserve
requirements within NPCC.
1 Load and Capacity Forecast Summaries for NPCC, IMO, ISO-NE, NY-ISO, HQ and
the Maritime’s are included in Appendix 1.
Page 4
Docket No. ER11-1844
Exhibit No. NYI-17
Page 5 of 61
•
The projected spare capacity available to the remainder of NPCC during the peak
load week (week beginning July 6, 2003) is about 7,300 MW. This is projected to
occur two weeks following the week with the lowest overall NPCC margin (week
beginning June 22, 2003). By comparison the projected spare capacity, after
accounting for bottled in capacity, for the 2002 Summer peak load week was
about 3,400 MW.
•
New England and New York have market-based demand response programs in
place that are expected to provide load relief measures that are in addition to
measures available under emergency conditions. In addition, to address reliability
concerns in southwest Connecticut, an area of New England where demand may
exceed supply plus total transmission import limits, a Request For Proposal (RFP)
has been issued by Connecticut Light and Power Company in order to acquire
new peaking generation and load relief within that area. Ontario had a pilot
Emergency Demand Response Program in place for the summer of 2002. The
pilot program was to end on April 30, 2003. Work is in progress to extend the
program through the summer of 2003.
•
NPCC generation capacity additions for the 2003 Summer are anticipated to total
7,144 MW, including 2,900 MW in New England, 1,179 MW in New York, 2,565
MW in Ontario, 450 MW in Quebec and 50 MW in the Maritimes. It should be
noted that the Ontario addition includes the return to service of two Bruce units
(770 MW each) and a Pickering unit (515 MW). Even though NPCC as a whole
shows adequate resources through the report period, there remain load pockets
within the New England control area, specifically southwest Connecticut that may
be at greater risk of being capacity deficient.
•
The Areas of New England, New York and Ontario will also have adequacy
concerns under conditions of extreme weather-driven-demands or higher than
projected generating unit outages without assistance from outside their respective
Control Areas. The capability to assist adjoining NPCC Control Areas is
exacerbated by the lack of load diversity between Control Areas.
•
The shoulder months indicate that overall NPCC has significant margins of spare
generating capacity. Furthermore, measures are being taken to ensure these
margins are maintained to protect against maintenance over runs.
•
Any delays to the in-service date of new capacity in New England, New York and
Ontario will impact the overall capacity for these Areas. Similarly, removal of
existing generation in critical areas, may adversely affect capacity margins.
•
The working group has determined that each NPCC Area is reasonably prepared
or is reviewing the necessary strategies and procedures to deal with operational
problems and emergencies as they develop. However, the Resource and
Transmission Assessments are mere snapshots in time and base case studies.
Changes to the base case assumptions can alter this report’s findings.
Page 5
Docket No. ER11-1844
Exhibit No. NYI-17
Page 6 of 61
• An analysis of historical periods of high Geomagnetically Induced Currents
(GICs) was performed and the results indicate that present procedures for
managing them are adequate. As we are now on the downward trend of the 11-
year sunspot cycle, the probability of a major GIC event impacting generation or
transmission coincident with the occurrence of peak load is decreasing.
• Area environmental constraints, specifically state, provincial and local emission
regulations may have some impact at various times through the summer 2003
period.
• Since 2002, precipitation levels have restored most water reservoirs to near
normal levels. Hydroelectric generation output may still be impacted in some
isolated locations.
• Under specific conditions, some Control Areas have identified difficulties
controlling high or low voltages.
2. Introduction
The NPCC Task Force on Coordination of Operation established the Operations
Planning Working Group to review the projected 2003 summer2 conditions and assess
the overall reliability of the generation and transmission system in NPCC. The
objectives of the working group were to:
• Conduct a post-assessment review of 2002 Summer operating conditions.
• Examine historical summer operational experiences and assess their applicability
for the summer 2003 period.
• Assess the extent to which emergency operating procedures may be implemented
by the NPCC Areas during the summer of 2003.
• Study potential sensitivities that may impact resource adequacy, including
temperature variations, merchant plant delays, load forecast uncertainties,
evolving load response measures, solar magnetic activity and system voltage and
generator reactive capability limits.
• Ensure that timely and efficient communications with participants in all regional
markets will be in place in order to maximize reliance on the marketplace for
emergency support.
• Review the operational readiness of the NPCC Areas and recommend actions to
mitigate potential problems.
2 Summer 2003 is defined as the months of May to September inclusive.
Page 6
Docket No. ER11-1844
Exhibit No. NYI-17
Page 7 of 61
• Assess the implications of strategies adopted for the summer period on the
adequacy of supply in the shoulder months.
• Coordinate data and modeling assumptions with NPCC Working Group CP-8,
“Resource and Transmission Adequacy.” Document the methodology of each
Area in its projection of load forecasts; document the methodology of each Area
in its projection of unit unavailability rates.
• Provide coordination with the seasonal assessments conducted for the summer of
2003 by the NERC Reliability Assessment Subcommittee and the MAAC-ECAR-
NPCC (MEN) Study
3. Demand Forecasts for 2003
The non-coincident forecasted peak demand for NPCC during the summer of 2003 is
104,694 MW (May-September period). This peak demand translates to a coincident
peak demand of 103,013 MW and is expected during the week beginning July 6,
2003.
Ambient weather conditions are the single most important variable impacting the
demand forecasts during the summer months. As a result, each Area is aware that the
summer peak demand could occur during any week of the summer period as a result
of these weather variables. It should also be noted that the Maritimes and Quebec
experience late Spring loads that are influenced by heating load and occur during the
defined summer period.
The impact of extreme ambient weather conditions on load forecasts can be
demonstrated by various means. The IMO, Maritimes and TransÉnergie (transmission
operations division of Hydro-Quebec) represent the resulting load forecast
uncertainty in their respective Areas as a percentage of the base load. NYISO and
ISO-NE use a Temperature Humidity Index (THI) as a base and increase the load by
a MW factor for each degree above the base value.
As demonstrated in Section 7, historically the peak loads and temperatures between New
England and New York can have a high degree of correlation due to the relative
locations of their respective load centers. Depending upon the extent of the weather
system and duration, there is some potential for the Ontario peak demand to be
coincident with New England and New York.
The method each Area uses to determine the peak forecast demand and the associated
load forecast uncertainty relating to weather variables is described in greater detail in
the Control Area Summary of Forecasts below.
Page 7
Docket No. ER11-1844
Exhibit No. NYI-17
Page 8 of 61
Summary of Area Forecasts
Maritimes
Based on the Maritimes Area 2003 demand forecast, a peak of 3,474 MW is predicted
to occur for the June through August period during the week beginning June 1, 2003.
This is a less than a 1% increase over the Summer 2002 actual peak of 3,444 MW,
which occurred on August 16, 2002. Since the Maritimes Area is a winter-peaking
area, forecasted peaks for the months of May and September are normally higher than
for the June through August period. For the week beginning April 27, 2003, the
predicted peak is 3,813 MW; for the week beginning September 28, 2003, the
predicted peak is 3,511 MW.
The load forecast for the Maritimes Area represents the expected load for the Summer
2003 assessment period. It should be noted that the Maritimes Area load is simply the
mathematical sum of the forecasted weekly peak loads of the sub-areas (New
Brunswick, Nova Scotia, Prince Edward Island, and the area served by the Northern
Maine Independent System Administrator). As such, it does not take the effect of load
coincidence within the week into account. If the total Maritimes Area load included a
coincidence factor, the forecast load would be approximately 1-3% lower.
For New Brunswick Power, the load forecast is based on an End-use Model (sum of
forecasted loads by use e.g. water heating, space heating, lighting etc.) for residential
loads and an Econometric Model for general service and industrial loads, correlating
forecasted economic growth and historical loads. Each of these models is weather
adjusted using a 30-year historical average.
For Nova Scotia Power, the load forecast is based on a 30-year historical climate
normal for the major load center, along with analyses of sales history, economic
indicators, customer surveys, technological and demographic changes in the market,
and the price and availability of other energy sources.
Maritimes Electric Company Ltd.’s (Prince Edward Island) load forecast uses average
long-term weather for the peak period (typically December) and a time-based
regression model to determine the forecasted annual peak. The remaining months are
prorated on the previous year.
The Northern Maine Independent System Administrator performs a trend analysis on
historic data in order to develop an estimate of future loads.
New England
The New England Control Area’s forecasted summer 2003 peak demand is 25,120
MW. This is 360 MW (1.5%) higher than last years forecast for 2003 of 24,760 MW.
This reasoning for the increase in forecasted peak loads for 2003 can be summarized
by the following:
Page 8
Docket No. ER11-1844
Exhibit No. NYI-17
Page 9 of 61
• Using a seasonal regression, weather normalizing the forecasted 2002 summer
peak of 24,200 MW to 24,390 MW
• The weather normalizing and forecasting methodology was revised to use a
monthly regression, rather than a seasonal regression, for measuring the peak
load response to temperature/humidity. The weather normalized peak for
2002 is calculated to be 24,590 MW using the new methodology. This is a
200 MW (0.8%) increase over the seasonal regression normalization of 24,390
MW.
• Using the latest economic and historical data, the forecasted peak growth into
2003 was revised to 2.2%. This 2.2% growth is applied to the 24,590 MW
forecast to calculate the 2003 summer peak load forecast of 25,120 MW.
The actual summer peak experienced in 2002 was 25,348 MW. Using the
temperature experienced at the time of peak, the forecast would be re-calculated to be
25,125 MW using the monthly regression methodology. This peak of 25,348 MW is
the all time record of peak load for New England and surpassed the previous record
of 24,967 MW by 381 MW.
The demand forecast for New England is based on weekly weather distributions. The
weekly weather distributions were built using 30 years of data for the Temperature
Humidity Index (THI) at the time of daily peaks (for non-holiday weekdays). The
reference load forecast is based on a 50/50 probability of occurrence. While this
temperature sampling is used to project the temperature sensitive loads, a complete
process of sampling and econometric models are used to project the aggregate
demand. A reasonable approximation for the “normal weather” associated with this
projection is 90 degrees Fahrenheit and a dew point of 70 degrees. At these forecasted
load levels, a one-degree increase in the THI will result in approximately 700 to 800
MW of additional load. The amount of additional load depends on the total deviation
from the “normal weather” approximation.
As mentioned above, the reference case forecast of 25,120 MW has a 50% chance of
being exceeded. New England also produces a load forecast that has a 10% chance of
being exceeded that would be equivalent to an increase in the load forecast of
approximately 1,630 MW.
The following graph illustrates the range of potential peak demands that ISO-NE may
experience this summer and compares them to historical peaks. It should be noted
that the historical peak values illustrated below are the peak loads reconstituted to
reflect Operating Procedures that may have been implemented at that time.
Page 9
Docket No. ER11-1844
Exhibit No. NYI-17
Page 10 of 61
NEW ENGLAND SUMMER 2003 LOAD PROFILES
27,000
26,000
25,000
24,000
23,000
22,000
21,000
20,000
19,000
Reference
18,000
Extreme
Historical (1980 - 2002)
17,000
16,000
Week Beginning
New York
The forecast peak for the New York Control Area is 31,430 MW, which is 955 MW
higher than last year’s forecast of 30,475 MW. This forecast is 1.4% higher than the
all time peak of 30,983 MW that occurred on August 9, 2001. The forecast is based
on the forecasts for the transmission districts by the Transmission Owners and
municipal agencies. For peak load normalization, the NYISO uses a Temperature-
Humidity Index (THI) value of 81.31 degrees. At forecast load levels, a one-degree
increase in the THI will result in approximately 500 MW additional load.
The following illustration provides the range of potential peak demands that the New
York Area may experience this summer.
Page 10
Docket No. ER11-1844
Exhibit No. NYI-17
Page 11 of 61
New York Summer 2003 Load Profiles
35000
33000
31000
29000
27000
25000
23000
21000
19000
17000
15000
Week Beginning
Extreme Load
Normal Load
Historical Load
Ontario
The forecasted weather normal, summer hourly peak demand for 2003 is 23,684 MW.
This is forecasted to occur during the week beginning July 6, 2003. The forecast is
derived from an analysis of demands using 30 years of historical weather based on a
weekly resolution. The normal weather equates to an approximate average daily
temperature of 28 degrees Celsius and 65% relative humidity.
As was seen in 2001 and again in 2002, weather extremes can drive the demands
significantly higher than the weather normal values. The demand models used to
create the 2003 load profiles have been updated to increase the sensitivities to hot
weather as a result of experiences during the summer and fall of 2002.
Since peak demands are highly weather sensitive, Load Forecast Uncertainty (LFU) is
used to capture, in MW, the impact of the variations from normal weather. Therefore
the peak demands can be derived and given a probability of occurring based on the
likelihood of observing the normal weather. For this forecast, there is a 50% chance
the peak demand in any given week will exceed the weather normal base demands.
LFU represents the impact on the peak demand of one standard deviation in the
weather elements. The values of LFU associated with this analysis ranges from 4% to
9% of the predicted normal weather demands. The highest values of LFU for Ontario
appear during those weeks just prior to and after the traditional summer vacation
periods of July and August. For the peak week, LFU equates to a potential increase in
demand of about 1,160 MW.
Page 11
Docket No. ER11-1844
Exhibit No. NYI-17
Page 12 of 61
For the summer period the extreme weather demand for any given week is
determined by using the hottest day in the past thirty years as the reference point.
Depending upon the week in this study period, the values that could be experienced
under extreme weather conditions can be 10 -17% higher than the normal weather
prediction. For the peak week, this can equate to an increase of approximately 2,600
MW over the normal weather prediction. During the shoulder months of May and
September, the impact of extreme weather over normal weather forecasted demand
can reach as high as 3,300 MW.
The following graph shows the forecast range of potential demands that the IMO may
experience in each week.
Ontario
Weekly Demand Profiles
Summer 2003
26,500
25,500
24,500
23,500
22,500
21,500
20,500
Load Forecast Weather Normal
Load Forecast 1 LFU
19,500
Load Forecast Weather Extreme
18,500
Week Beginning
Page 12
Docket No. ER11-1844
Exhibit No. NYI-17
Page 13 of 61
Quebec
The forecasted summer peak for the Quebec Control Area in 2003 is 21,257 MW.
This is 1,266 MW (5.6%) lower than last summer's peak of 22,523 MW which
happened on an unseasonably cold day at the beginning of May, with temperatures
around the freezing point all over the province. If we exclude this anomaly, the
forecasted summer peak for 2003 is 732 MW (3.5%) above the peak of 20,525 MW
reached on September 9th of last year, when temperatures reached 33 degrees Celsius
with a high Heat and Humidity Index on the major load centers in the south of the
province while regions in the northeast had to resort to residential heating with
temperatures around 5 degrees Celsius. The forecast is based on 35 years of
historical weather with an offset of ±3 days for every date, which amounts to the
equivalent of 245 years of sampling. Being exposed over the year to all kinds of
extremes in weather, TransÉnergie uses three different load forecasting models
(autumn, winter and spring). For the purpose of this assessment, the spring model is
used up to the middle of August and the autumn model is used for the remaining of
the period. The boundaries of the parameters of these models are regularly calibrated
by comparing the results to the last two years of historical weather to reflect any new
tendencies. Finally, TransÉnergie defines load forecast uncertainty (LFU) as a
percentage calculated on a monthly resolution. The value for LFU is approximately
3% for the summer months, which represents from 600 to 700 MW. This value is
accounted for in the Load and Capacity table provided in this assessment.
4. Resource Adequacy
NPCC Summary for 2003
The following assessment of resource adequacy was made for the week with the
lowest overall NPCC margin (week beginning June 22, 2003)3. The lower net margin
is influenced by lower net margins in New York and Ontario. These lower margins
can primarily be attributed to slightly higher known and/or unplanned generation
outages than during the projected peak load week. The overall resource adequacy for
the NPCC region during this week indicates that there will be approximately 8,100
MW of operable spare capacity. However, during this week over half of this spare
capacity is in the Quebec and Maritimes Area. The transfer capability between the
Quebec and Maritimes Control Areas to the remainder of NPCC will not permit the
usage of all the declared spare capacity. In addition, transmission constraints may
limit the ability to transmit the New Brunswick and southeastern New England
capacity to other NPCC Areas. Therefore it is estimated that the net margins for
NPCC are reduced by approximately 2,800 MW over this week to account for this
bottled capacity. As a result of this bottling, the spare capacity available to the
remainder of NPCC is approximately 5,300 MW over this week.
3 Load and Capacity Forecast Summaries for NPCC, Ontario, New England, New York,
Quebec and the Maritime’s are included in Appendix 1.
Page 13
Docket No. ER11-1844
Exhibit No. NYI-17
Page 14 of 61
The projected spare capacity available to the remainder of NPCC during the peak
load week (week beginning July 6, 2003) is about 7,300 MW. By comparison the
projected spare capacity for the 2002 Summer peak load week was about 3,400 MW.
While New York and Ontario are projecting some relatively low margins during
portions of the report period, after accounting for bottled resources, there should be
sufficient resources to meet the forecasted load projections and operating reserve
requirements within NPCC.
The above assessment was performed on the basis of projected available capacity.
Inadequate fuel supply, lower than normal water reservoirs, higher than anticipated
forced outages or delays in anticipated new facilities can impact these capacity
projections. Based on Control Area assessments there should be little impact to the
overall capacity projections from these additional variables.
The following are the Area assessments supporting this overall resource adequacy
assessment.
Projected Load and Capacity Analysis by Area
Maritimes
When allowances for unplanned outages (based on a discrete MW value representing
a typical forced outage) are considered, the Maritimes Area is projecting more than
adequate capacity margins for the Summer 2003 assessment period. Net margins
ranging from 20% to 45% are projected over the period May through September
2003.
New England
Operable capacity within New England is forecasted to be sufficient to meet
operating reserve requirements during all weeks of the summer peak load period. A
positive capacity margin ranging from 1,600 MW to 5,700 MW is anticipated.
Available capacity is based on known outages, an approximation of unknown
outages, anticipated new generation additions, projected firm purchases, and capacity
from Demand Response Programs.
While it is projected that operable capacity is expected to be surplus for the New
England region, the southwest Connecticut region may face reliability problems due
to transmission constraints into and within that region. To meet critical near-term
electric system reliability needs in southwest Connecticut for the summer of 2003,
Connecticut Light and Power Company has implemented an emergency plan for the
period of June 1, 2003 through September 31, 2003 that includes:
• Issuing of a Request for Proposals (RFP) for the installation of up to 80 MW
of temporary generation, seeking the preferred, clean-burning natural gas-
Page 14
Docket No. ER11-1844
Exhibit No. NYI-17
Page 15 of 61
powered generation to address reliability needs and other power emergencies
this summer;
• Installing voltage stabilization and performance equipment to maximize
transmission import capabilities into southwest Connecticut; and
• Aggressively supporting and participating in ISO New England-administered
Demand Side Management (DSM) programs that could potentially reduce this
summer's peak load by up to 20 MW in southwest Connecticut.
Transmission constraints are also affecting import limits into the Boston Area and
Northwest Vermont.
Maine, Southeast Massachusetts, and Rhode Island are areas within New England
where supply exceeds native load but the existing transmission system limits the
amount of excess energy that can be used to serve the demand in other areas.
In addition to known maintenance, an allowance for unplanned outages is also
included. Unknown outages are based on historical trends and are estimated to be
between 2,100 MW and 3,400 MW. However, if higher than expected resource
unavailability or higher than expected load occurs in New England, then system
operators may have to take load curtailment actions if sufficient assistance cannot be
obtained from interconnecting areas. If necessary, New England would implement its
Operating Procedures, which provide load and capacity relief to balance demand and
supply and maintain adequate operating reserves.
New York
The NYISO conducts semi-annual and monthly Installed Capability (ICAP) auctions.
Based on the forecast load for 2003, the ICAP requirement is 37,087 MW based on
the 18% installed reserve margin requirement. When allowances are taken for
unplanned outages (based on historical performance of 10. 2% unavailable capacity),
the net available resources will be 33,230 MW, which will be sufficient to meet the
New York Control Area (NYCA) load and operating reserve requirement during the
peak load hours; a capacity margin of zero MW is expected at peak conditions.
Generation resources which are external to the New York Control Area (NYCA) that
provide ICAP to the NY market are included in the ICAP total of the NY Load and
Capacity assessment. Resources within the NYCA that provide firm capacity to an
entity external to the NYCA are not included in the ICAP total (i.e. this generation
cannot participate in the ICAP market).
NYISO expects approximately 1,100 MW of load relief from emergency operating
procedures that include internal load curtailment by the transmission owners, public
appeals and 5% system wide voltage reductions. Participation in the Emergency
Demand Response Program represents an additional 700 MW available through the
market.
Page 15
Docket No. ER11-1844
Exhibit No. NYI-17
Page 16 of 61
Ontario
The new TransAlta-Sarnia Cogeneration Project, which provides a net capacity
increase of 510 MW, became fully dispatchable to the IMO controlled grid on March
27, 2003.
The return to service of three nuclear units that were laid up in the late 1990's is
scheduled to begin in 2003. Bruce A units G4 and G3 are scheduled to be generating
electricity April 29 and the end of June respectively. Each unit will provide a net
capacity addition of 770 MW to the IMO-controlled grid. Pickering A G4 is
scheduled to begin generating electricity by June 2003. This unit will provide a net
capacity addition of 515 MW.
The IMO is anticipating positive capacity margins within Ontario to meet expected
load and operating reserve requirements for peak hours of the report period based on
weather normal demands.
This analysis is based on the assumption that the returning nuclear generation
resources will meet their in service projections, a review of known outages, a
projection of unknown outages, a forecast of price responsive loads, and the inclusion
of known firm purchases that supplement the installed generating capability.
Known outages include those resources that are scheduled to be on planned outages,
transmission constrained resources as well as the difference between the installed
capacity and the dependable capacity associated with certain resources. For example
hydroelectric capacity is reduced by varying amounts through portions of the study
period to account for the energy available under median water conditions.
Unknown outages represent the average value of forced outages experienced in this
same study period during previous years.
A value of 300 MW of price responsive load has been assumed to be available for this
forecast based on past operational experience.
The net capacity margins, in table 5 of Appendix I, depict an estimate of the operable
capacity margin that does not consider all the additional off-market control actions
available to the IMO. For example, the IMO can institute a 3% or 5% voltage
reduction. These control actions have the effect of reducing the demand by 1.7% to
2.5%, which, equates to approximately 390 MW to 500 MW on the peak week.
The risks associated with this analysis are that demands may be heavier than expected
due to extreme weather, outages may not return to service as scheduled or delays to
new and returning units. Of particular concern for this summer are the large number
units on outage that are expected to return to service just prior to the summer period.
Page 16
Docket No. ER11-1844
Exhibit No. NYI-17
Page 17 of 61
The adjustment of outage programs and securing of assistance (via market
mechanisms or acquisition of emergency energy) from other control areas may be
required during those periods that the margin of available capacity in Ontario is
forecast to be insufficient to meet the expected Ontario demands plus operating
reserve requirements.
The projected margins and controls actions available to the IMO are continuously
assessed to determine the appropriate course of action.
Quebec
TransÉnergie is projecting more than adequate capacity margins for the Quebec
Control Area during this period. Being a winter peaking region, the summer is the
season during which maintenance work is performed, but margins in the range of
3,500 to 6,500 MW above load and firm sales projections are nevertheless expected.
Delays to In-service of New Generation Resources
Maritimes
The Maritimes Area has a 50 MW gas-fired combustion turbine scheduled for
commercial operation on September 1, 2003. This unit was previously scheduled to
be in service in October 2002.
New England
In the New England Control Area, from April 2001 through February 2003,
approximately 4,300 MW (summer rating) of new capacity has been added with an
additional forecast of 2,900 MW to be in service prior to June 1, 2003. Of the new
generation assumed to be online this summer approximately 1,400 MW will be
located in Boston. Past experience indicates that new projects with aggressive
construction schedules, new designs or are large in magnitude, are frequently delayed
due to unforeseen circumstances. ISO New England closely monitors the
construction and commissioning progress of new generators. However, any delay in
the commissioning of the new generation will decrease the projected capacity
margins.
New York
Resource additions totaling 1,179 MW are expected to be available for service prior
to the summer peak. Of this, 1080MW represents a new natural gas fired combined-
cycle merchant plant located near Athens, NY, and the remaining 99 MW are simple-
cycle combustion turbines in the Long Island zone. This resource assessment is based
on the forecast of commercially available capacity at the start of the summer season
so that any new capacity additions would serve to enhance the projected margin.
Page 17
Docket No. ER11-1844
Exhibit No. NYI-17
Page 18 of 61
Ontario
Ontario will see the return to service of three laid-up nuclear units for the summer of
2003. The greatest concern to the summer capability period is the fact that no nuclear
unit in Ontario has been returned to service from the laid-up state. Timing of the
return to service of these units is critical to resource adequacy. The IMO recognizes
the risks associated with the timing of the return to service and continuously monitors
the resource adequacy margins.
Quebec
The commissioning of the Sainte Marguerite-3 hydro plant (900 MW) has been
delayed again. It is likely that only one of its two 450 MW units shall be online for
this summer. This assumption is used in this assessment. No other significant
generation is expected.
Fuel Infrastructure by Area
The following is a self-assessment by each Area of the expected fuel supply
infrastructure.
Maritimes
The fuel supply in the Maritimes Area is very diverse and includes Nuclear, Natural
Gas, Coal, Oil (both light and residual), Orimulsiontm, Petroleum Coke, Hydro, Tidal,
Municipal Waste, and Wood.
The Maritimes Area does not anticipate any restrictions in capacity due fuel supply.
Units that have been converted to the Orimulsiontm fuel retain their full capability on
oil. Moreover, the Area anticipates normal hydro conditions and the reservoirs are
expected to be full.
New England
Historically, fuel supplies have been readily available to generators within New England
during the summer months. For the summer of 2003, ISO New England does not foresee
any fuel supply or delivery constraints.
New York
Traditionally, the New York Control Area generation mix has been dependent on
fossil fuels for the largest portion of the installed capacity. Recent capacity additions
or enhancements now available use natural gas as the primary fuel. While some
existing units in southeastern New York have “dual-fuel” capability, use of residual
or distillate oil as an alternate may be limited by environmental regulations.
Page 18
Docket No. ER11-1844
Exhibit No. NYI-17
Page 19 of 61
Adequate supplies of all fuel types are expected to be available for the summer
period.
Ontario
The majority of generation facilities operating on the IMO-controlled grid are
represented by three basic types of fuel (Hydroelectric, Nuclear and Fossil). The
fossil fueled facilities are predominately fired by coal. A portion of these fossil fired
resources is fueled by natural gas or oil. A majority of the oil-fired capability is dual
fueled by natural gas and oil. Adequate supplies of these fuels are expected to be
available and there is no expectation of fuel delivery infrastructure problems for the
summer period. Additionally, the hydroelectric installed capacity is reduced through
portions of the study period to account for reductions in capacity when the available
water falls below the dependable value. Dependable hydroelectric capacity is the
capacity that is sustainable for a minimum of one hour per day, five days per week.
Quebec
Most of the generation resources in the Quebec Control Area are hydroelectric (95%)
and hydraulic conditions are adequate. For the summer peak of 2003, TransÉnergie
does not foresee any problems in meeting both its internal demand and full
responsibility sales while still being able to assist neighboring Areas as needed.
5. Potential Usage of Operating Procedures
The NPCC CP-8 Working Group performed a probabilistic analysis to estimate the
annual Loss of Load Expectation (LOLE) and projected use of Area Operating
Procedures designed to mitigate resource shortages for the summer of 2003 under
various conditions. This section is based on the CP-8 Study results.
The scenarios included expected and extreme load patterns. Detailed study results for
each of these scenarios can be obtained from the NPCC CP-8 Working Group -
Summer 2003 Multi-Area Probabilistic Reliability Assessment.
The study results indicate that all Areas demonstrated an annual LOLE of 0.1
days/year or less, under the Base Case and Severe Case assumptions for the expected
load (the expected load is the weighted average of seven load levels, weighted by the
probabilities assumed for each). They also indicate that New England and New York
may experience conditions during the summer of 2003 that require the use of
operating procedures designed to mitigate resource shortages. Use of these operating
procedures is not anticipated for the Québec, Ontario, or the Maritimes Areas during
the summer of 2003.
The potential use of these operating procedures in New England and New York is
more likely to occur in Southwest Connecticut and New York City, respectively, if
reductions in anticipated resources or increases in transmission constraints materialize
coincident with higher than expected loads.
Page 19
Docket No. ER11-1844
Exhibit No. NYI-17
Page 20 of 61
The actual number of times NPCC Area operating procedures were used to mitigate
resource shortages for the summer of 2002 was within the range of last year’s
estimate.
As compared to last year’s analysis, the identified additional resources, improved
transmission transfer capability, and Demand Response Programs have reduced the
estimated need for implementing operating procedures to maintain reliability within
NPCC.
For the May - September 2003 period, Figure EX-1 shows the potential range of use
of the indicated operating procedures under Base Case and Severe Case assumptions,
expected and extreme load levels.
Figure EX-1
Potential Range of Use of Indicated Operating Procedures for Summer 2003
Considering Base and Severe Case assumptions (May - September)
(Expected and Extreme load levels)
5
4
3
Estimated Number
of Occurrences
2
(days/period)
1
0
NE NY ON MT HQ
Reduce 30-min Reserve Voltage Reduction Reduce 10-min Reserve
Transmission Adequacy
Many Inter-Regional and Intra-Area transmission studies are in the preliminary stages
of assessment. Therefore, the transmission adequacy assessment for this report was
made utilizing assumptions based on consultation with the staff in the appropriate
area of expertise for Inter-Regional transfer capability, supplemented by Intra-Area
Transmission assessments of each Control Area and a review of last years operating
experience for equipment outage that occurred during the summer of 2002.
Page 20
Docket No. ER11-1844
Exhibit No. NYI-17
Page 21 of 61
The following is a transmission adequacy assessment from the perspective of the
ability to support energy transfers for the differing levels, Inter-Region, Inter-Area
and Intra-Area.
Inter-Regional Transmission Adequacy
Evolution of the interconnected network is continuing in the northeastern U. S.
Present plans are for the integration of the AEP and Dayton Power & Light systems
as part of PJM’s energy market operations prior to this summer with Commonwealth
Edison and Dominion Resources following later in 2003. However, there have been
regulatory/political challenges to those plans, which has resulted in the deferral of the
plans for AEP, Dayton Power & Light and has made the Dominion Resources plan
uncertain.
The final phase angle regulator installation on the Michigan-Ontario Interface (345
kV circuit L4D) is not expected to be completed until the end of August. The B3N
(230 kV circuit Scott - Bunce Creek) phase angle regulator was forced from service in
March 2003. The return to service of the PAR is not known at this time. This has
created additional uncertainty to the projection of having all Michigan-Ontario
Interface phase angle regulators in service for any portion of the summer operating
period. Therefore it is assumed that the Michigan-Ontario Ties will remain free
flowing for a major portion of the study period.
In addition, a tower on the B3N circuit was damaged, which forced the circuit out of
service. The tower must be replaced and the expected return date for the circuit is
July 31, 2003. During this time the ability to import energy into Ontario on the
Ontario-Michigan Interface will be reduced by approximately 150 MW from the
normal level.
It is expected that the transmission system is adequate to support the anticipated Inter-
Regional transfers.
Inter Area Transmission Adequacy
The transfer capability between the NPCC sub-Area containing the Quebec Control
Area and the Maritimes Area with the remainder of NPCC is less than the surplus
capacity in this sub-Area. This accounts for the adjustment to the Net NPCC Margins
in the Resource Adequacy assessment (Section 6). The estimated transfer capabilities
used in the CP-8 probabilistic assessment were used to calculate the remaining
transfer capability after known transactions are taken into account. These estimated
transfer capabilities are illustrated in Diagram 1 NPCC Transfer Limits CP-8 Base
Case.
Page 21
Docket No. ER11-1844
Exhibit No. NYI-17
Page 22 of 61
Diagram 1
Assumed Transfer Limits Between Areas
NPCC Transfer Limits - CP-8 Study - Base Case
MAN
275
(Assumed Ratings)
ONT
Total Ontario
324
95 S
PEI
4,050 In
NW
110 W
5,500 Out
NS
140
200
0
90
222
HQ
NBM
350
1,500
300
MN
0
440 S
200
124
2,690
535 W
325
65 S
1,000
BEAU
350
84 W
740 S
NB
ONT
LG2A
1,000 S
1,385
760 W
690
1,100 W
375
SE
325
0
400
1,300 S
1,500
225
1,700
1,500 W
700
1,500
BHE
1,800 S
D
150
2,000 W
TE
TE
East
West
VT
CMA
A
500
F
C
800
500
W-
1,000
Σ
MA
1,000
2,100 S
G
550
800
2,200 W
1,100
330 (CSC)
500
K
CT
J
2,550
286 (eff. 6/1/03)
ECAR
1,000
NOR
2,000
Total NY-NE
2,150
1,550/950 S
MAAC
0
975/2,050 W
MAAC-D
(Excludes CSC)
Cross Sound Cable
(CSC) present only in
Severe Case.
Transmission Adequacy Assessment by Area
Maritimes
There have been no major additions to the Maritimes bulk transmission system.
Interconnection capability remains unchanged and is expected to deliver up to 700
MW to New England and be capable of delivering up to 700 MW to Quebec.
New England
The following transmission upgrades are expected to be implemented during or prior
to the summer of 2003:
• The installation of one 345/115 kV transformer at the Canal substation along with
four additional circuit breakers to improve transmission reliability to the Cape
Cod area;
Page 22
Docket No. ER11-1844
Exhibit No. NYI-17
Page 23 of 61
• the addition of a 345/115 kV transformer at the West Rutland substation to
improve reliability to the northwest Vermont region;
• Re-energizing the Coolidge to West Rutland line at 345kV will also improve the
reliability to northwest Vermont;
• In order to improve reliability in the Boston area, the West Medway to Waltham
230 kV line is expected to be modified by increasing the sag limit.
For the summer of 2003, upgrades will be completed in the southwest Connecticut
area that will provide some increases in the import capability. Specifically, two +/- 8
MVAR DVAR devices will be installed at the Stony Hill Bus as well as one at the
Bates Rock Bus. Along with the DVAR devices, capacitor banks will be installed at
the buses. The installation of these DVAR devices, along with the capacitor banks,
will reduce the likelihood of load shedding in the southwest Connecticut area this
summer.
Even with these scheduled improvements, there are still transmission constrained
areas such as metropolitan Boston and southwest Connecticut. During periods of
high demand, voltage and thermal limits may impact transfer capability into and
within these transmission constrained load pockets.
New York
There are no major transmission facility additions to the New York bulk power
system for the summer 2003 period.
Construction of the Cross Sound Cable, a 330 MW HVdc merchant transmission line
and HVdc Converter Facilities between East Shore Substation in New Haven, CT,
and the Shoreham, NY, has been completed. Commercial operation of the facility has
been delayed due to regulatory issues. Parties involved in the operation of this
facility are seeking an order from the FERC to allow emergency power transfer on
this interconnection.
Phase II of the Marcy Flexible AC Transmission System (FACTS) Demonstration
Project is scheduled for completion during the Spring 2003. The addition of static
synchronous series compensator (SSSC) capability to FACTS Convertible Static
Compensator (CSC) device will provide dynamic control of the transmission system
power flows on either the Marcy - Coopers Corners or Marcy - New Scotland 345kV
circuits. The new functionality and enhanced controls being installed in the 2nd
quarter of 2003 will increase the number of operating configurations of the CSC to
eleven modes.
Ontario
There are no new major transmission facilities scheduled to be placed in service prior
to the summer operating period to change the overall transmission adequacy outlook
from 2002. Studies indicate that there will be sufficient transmission capability to
Page 23
Docket No. ER11-1844
Exhibit No. NYI-17
Page 24 of 61
meet the projected requirements under most conditions. However, there will continue
to be limitations to the outage program during extreme weather driven demands in
certain sub-areas of the province.
While several new small and one large capacitor bank installation that is expected to
be available for the summer of 2003, the Windsor area and Toronto area will continue
to experience low system voltages during extreme weather condition. As was
experienced in 2002 maintaining acceptable voltage profiles will require diligent
assessment of outage plans, and dispatch/deployment of reactive resources.
Quebec
No major maintenance outages are scheduled on the interconnections with
neighboring Areas from May to September. Transfer capabilities will be at their
maximum throughout the summer. Internal Transmission outage plans are assessed to
meet load, firm sales, expected additional sales plus additional uncertainty margins.
An experimental 100 MW Variable Frequency Transformer (VFT) is currently being
installed at the Langlois substation near the Les Cedres generating plant. It will begin
testing in the summer of 2003 and could eventually increase the transfer capacity via
lines CD1 and CD2 from Dennison (Niagara Mohawk, NYISO). The additional
margin is not expected to be commercially available before 2004. This
interconnection is currently being fed by islanding generation at the Les Cedres plant
and this VFT will also increase switching flexibility by reducing the number of
islanding operations.
6.
Operational Readiness for 2003
The Resource and Transmission adequacy assessments are key elements in
determining NPCC’s ability to meet the demands of the summer, but they are mere
“snapshots in time” or simulations of conditions based on predictions of specific
configurations. To mitigate the uncertainty surrounding load forecasts, forced outages
and other conditions that cannot be controlled or predicted, the Control Areas of
NPCC need to be prepared to deal with contingencies in real time.
The following is a synopsis of some of the most prevalent uncertainties affecting the
ability to handle the projected demand and the mitigating actions NPCC Control
Areas can take to diminish their impact during the summer 2003 period.
Reactive Capability of Generating Units
Heavy demand during the summer period requires that the transmission system
voltages and the end-use reactive loads be supported by substantial reactive resources
in relation to the real power requirements. While static VAR devices and shunt
capacitors provide a known quantity of support based on design rating, the actual
reactive capabilities of generators can vary significantly from the design capability.
Page 24
Docket No. ER11-1844
Exhibit No. NYI-17
Page 25 of 61
The following is a discussion of each Areas methodology to monitor reactive
capability.
Maritimes
The Maritimes Area, in addition to the reactive capability of the generating units,
employs a number of capacitors and reactors in order to provide local area voltage
control. The Area employs Static VAR Compensators and several synchronous
condensers in key load centers to provide high-speed reactive power control. Further,
the Maritimes Area is a winter peaking system and the loading of the transmission
lines in summer is, in general, lower resulting in lower VAR consumption.
New England
ISO-NE and its satellite control centers continually monitor voltage and VAR
conditions throughout the system to ensure reliability of the bulk power grid in New
England. As transmission upgrades and new generators are added to the system,
engineering analyses are conducted to determine appropriate voltage and VAR levels.
New York
Each generator providing voltage support service under the NYISO Tariff to the New
York market is required to perform annual testing of reactive capability within 90%
of its claimed operating capability. The NYISO staff reviews the test data and, if
necessary, will perform appropriate voltage analysis to determine operating limits
based on the reactive capability testing. In preparation for the summer peak period,
the NYISO staff has reviewed the test data to ensure that all voltage support service
providers are in compliance with the testing and reporting requirements for this
ancillary service. The NYISO staff has also requested Transmission Owners and
Generation Owners to identify local (in plant or station) issues that might limit a
particular generator’s voltage support capability.
Ontario
The IMO has the authority to test the declared reactive capabilities of generating
units. Testing of generating units, critical to the support of key portions of the IMO-
controlled grid has been performed. Analysis of the test results are underway to
ensure that the demonstrated reactive capability is sufficient to meet system voltage
support requirements.
Quebec
Being a winter peaking area, TransÉnergie does not encounter voltage collapse
problems during the summer. On the contrary, controlling overvoltages on the 735kV
network during off-peak hours is the concern. This is accomplished mainly with
ample provision of shunt reactors.
Page 25
Docket No. ER11-1844
Exhibit No. NYI-17
Page 26 of 61
Environmental Impacts
The major Federal rules that apply to electric generating sources in the northeastern
United States are the Acid Rain regulations, New Source Performance Standards
(NSPS) and State Implementation Plans (SIPs). The Acid Rain regulations require
power plants to reduce both SO2 and NOx emissions on a year round basis. The
NSPS regulations set regulations for new power plants and States develop SIPs to
meet National Ambient Air Quality Standards (NAAQS). In the northeast U. S., the
NAAQS of most concern is the ozone NAAQS. In order to meet the NAAQS, states
in the northeast have developed a summer time NOx Budget Trading Program that
has been in effect for the last three summers. Under this program, sources in
participating States will be allocated around 212,838 allowances. Last summer these
same sources emitted around 193,000 tons. In the three summers prior to 2002, a
bank of 78,746 tons had been saved. However, according to the Clean Air Markets
Division of the EPA there will be zero banked allowances carried forward into the
2003 ozone season because the NOx Budget Program is transitioning to the NOx
State Implementation Plan (SIP) Call Program.
The environmental regulations affecting electric generating sources in Regions 1 and
2 (northeastern US) for the summer 2003 include both market based cap-and-trade
programs and traditional command and control programs. EPA’s Acid Rain Program
and the northeast’s NOx Budget Program are cap-and-trade programs that encourage
sources to find the most cost effective means of meeting environmental goals while
promoting energy efficiency. Other programs such as the New Source Performance
Standards are command and control programs based on emission rates for given
boiler types. Permitting issues related to new generation placement are a major
portion of the command and control rules.
Short-term impacts on individual unit operation during 2003 summer are more
influenced by the summer time regulations as opposed to the annual regulations
because these regulations are more stringent. For the NOx Budget Program, sources
may either install NOx control technologies or buy allowances from sources that have
been overcontrolled. It is possible that fuel switching between oil and gas can be a
problem. Quick start-up of mothballed units is also allowed under the rules.
Overall, it is not expected that EPA rules will have a major impact on electric system
reliability through its environmental programs during 2003 summer. State, provincial
and local environmental rules are expected to have more of an impact on electric
system reliability that is described in more detail by Control Area.
Another environmental impact influencing generation during the summer is water
level. This was a significant issue during the Summer 2002. With the exception of
the Great Lakes, the above average precipitation during the latter half of 2002 and
continuing into 2003 has allowed most reservoirs in the northeastern states to recover
to normal condition. Snowpack depth in the watershed areas of the northeast is also
near normal levels. Based on current forecast information, it is anticipated that hydro
Page 26
Docket No. ER11-1844
Exhibit No. NYI-17
Page 27 of 61
generation and other generating facilities that use water for purposes of emission
control or cooling are not likely to be impacted. Generators are encouraged to
monitor water levels as the Summer peak season approaches.
The following are the Area assessments discussing environmental related issues.
Maritimes
The Maritimes Area closely monitors air emissions and other environmental
discharges to ensure compliance with standards and limits set forth by Canadian
Federal and Provincial environmental regulations. For the summer 2003 period, there
may be occasions when some units are required to be de-rated in order to meet these
regulations. However, these occasions are expected to be infrequent and of short
duration.
New England
ISO-NE is mindful of environmental restrictions and constraints on New England’s
generating capacity and usually conducts an annual pre-seasonal review. In
preparation for the summer of 2003, a letter will be sent to all generating facilities
within New England inquiring about the status of their environmental permits and
potential impacts on operations due to environmental constraints. Generators are
encouraged to pursue temporary waivers of their environmental permits during
periods of extreme capacity deficiencies.
New York
There is a limited possibility that there may be a shortage of available capacity in the
New York City metropolitan area due to environmental constraints. An extended
period of high temperatures and high humidity leading to an unacceptable level of
ozone in the region may limit the availability of generation to meet load. In 2001 the
NYISO obtained a waiver from the New York State Department of Environmental
Conservation (DEC) to address such an air quality emergency and is continuing to
work with the DEC staff on this concern. Should such a situation arise, it is
incumbent on the NYISO to maximize the availability of generation outside the
effected area and insure that all other steps are taken in accordance with the capacity
emergency procedures (NYISO Emergency Operations Manual). After this the DEC
would allow operation outside of emission limits to avoid curtailment of firm load in
New York.
During the second half of 2001 and continuing into 2002, precipitation over much of
the Region was below average and was approaching drought conditions. As noted
above, near average rainfall in the latter half of 2002, and precipitation levels and
snowpack depth in the watershed areas of upstate NY are above normal approaching
the end of Winter 2003. Should precipitation levels remain near average, water use
Page 27
Docket No. ER11-1844
Exhibit No. NYI-17
Page 28 of 61
restrictions are not likely, and are not expected to effect generating availability or
capacity.
Ontario
There are many environmental issues that specifically affect the operation of facilities
in Ontario during the summer operating period. Compliance with these standards is
strictly monitored by the facility owner.
Some facilities have annual energy limitations to observe permissible emission limits.
These annual limits are not expected to impact the overall energy and capacity
projections for the summer operating period.
It is also recognized that there is a potential to restrict generation to respect
environmental regulations due to cooling water temperatures etc. The timing and the
overall impact of any restrictions are unpredictable.
Currently it is the facility owner that would request the appropriate authority to
permit a variance from these obligations to assist in a capacity deficiency. Experience
gained in 2002 was utilized to revise procedures where the IMO requests the facility
owner to obtain variances to environmental obligations under emergency procedures.
These revised procedures should expedite any request to obtain an environmental
variance if it is required.
Quebec
The bulk of generation in Quebec is hydroelectric based, therefore the environmental
concerns, as they pertain to this report are not of concern.
Geomagnetically Induced Currents (GICs)
Past experiences have shown the serious effect that geomagnetic disturbances can
have on the NPCC bulk power system. Quasi-DC currents induced in power lines
flow to ground through transformer neutral connections. This can result in saturation
of the transformer core leading to a variety of problems, including increased heating
that has resulted in transformer failures. In addition, the harmonics generated in the
transformer, as a result of the saturation, may produce unanticipated relay operations,
such as sudden tripping of transmission lines or shunt capacitors.
GICs are produced by the magnetic field variations that occur when a mass of
electrically charged particles from a solar coronal mass ejection impacts the earth’s
magnetic field. Because of the low frequency compared to the AC frequency, the
geomagnetically induced currents appear to a transformer as a slowly varying DC
current.
Page 28
Docket No. ER11-1844
Exhibit No. NYI-17
Page 29 of 61
GIC flowing through the transformer winding produces extra magnetization, during
the half-cycles when the AC magnetization is in the same direction this effect can
saturate the core of the transformer. This also results in severe distortion of the AC
waveform with increased harmonic levels that can cause incorrect operation of relays
and other equipment on the system and may lead to problems ranging from trip-outs
of individual lines, transformers or shunt capacitors to collapse of the whole system.
GIC activity correlates to 11-year sunspot cycles. We are presently in Cycle 23
(twenty third cycle recorded runs approximately from 1996 through 2007), which
began in 1996 and is predicted to end about January 2007. During the portion of the
solar cycle that has greater sunspot activity, there is a higher probability of GICs
occurring, which could impact the NPCC system. Observations of sunspot activity
only provide insights as to the timing of the release of energy; it is the solar winds
that ultimately determine the intensity and duration of a geomagnetic storm and those
areas of the earth that will be ultimately affected. A satellite, positioned between the
earth and the sun is capable of determining the intensity of the storm. The timing
between when this satellite senses the magnitude of the storm and when the effects
are noted on the earth is less than 1 hour.
Within NPCC the CO-8 Operations Managers Working Group has explored ways to
obtain accurate and timely forecasts of solar magnetic disturbances and the resulting
GICs for the NPCC Control Areas. NPCC has contracted for GIC forecasting
services from Solar Terrestrial Dispatch (STD) for a three year period. Forecast
information is provided directly to the control centers in the NPCC Areas.
Regarding recent GIC activity by the end of 2001 it was apparent sunspot activity had
achieved a second peak late in the year. Activity is now on the declining side of solar
cycle 23, and the minimum is predicted to occur in late 2006 or early January 2007.
Significant GIC activity was observed in the months of April and October of 2002;
however, no direct power system impact was identified. The following graph
illustrates past geomagnetic disturbance levels and projections of future solar activity.
on historical experience, the affects of GICs to reliability should be manageable with
our present procedures.
Page 29
Docket No. ER11-1844
Exhibit No. NYI-17
Page 30 of 61
The following is a summary of each Area’s experiences of GIC activity through the
recent “high period” as evidence of the potential impact to NPCC Control Areas as
well as a summary of control actions in place to reduce the impact of GIC.
Maritimes
The Maritimes Area did not experience any significant disturbances in 2002 and no
major problems are anticipated for 2003. The Maritimes Area Operating Procedures
are consistent with NPCC Operating Procedures for GIC activity.
New England
On several occasions during 2002, New England received geomagnetic storm
warnings. Proper notifications were made and applicable actions were taken in
accordance with NPCC document C-15 entitled, “Procedures for Solar Magnetic
Disturbances on Electrical Power Systems.” On May 23, 2002, several Level 1 GIC
alarms were reported at the Chester Static VAR Compensator (SVC) in Maine. On
that day, scheduled imports over the HQ HVDC Phase II facility and the tie with New
Brunswick were temporarily reduced to ensure transmission reliability.
Page 30
Docket No. ER11-1844
Exhibit No. NYI-17
Page 31 of 61
New York
During 2002, NYISO received notification of observed K-7 three times. There were
no effects experienced that were comparable to the storms of March and November
2001, and there were no GIC power system effects observed.
Ontario
The IMO received numerous geomagnetic storm warnings throughout the period
extending from 2001 into 2003. No actions beyond those required by the existing
procedures were taken and no operating problems beyond elevated neutral currents
were observed through this period.
Quebec
During the summer of 2002, there were two occurrences of GICs. Alerts were called
on May 24, 2002 and on September 7, 2002. The alerts predicted Kp levels of 7-8
and they actually reached 7 on both occurrences and no adverse effects on the bulk
system were recorded. Maximum voltage asymmetry recorded was 1.3%. Some
transfer limitations on the bulk system were imposed but Interconnection capacities
were not affected.
Operating Procedures
Detailed NPCC Operating Criteria, Procedures, Guides and Reference Documents
provide the Areas with the necessary material to develop and maintain a concise set
of operating procedures that are relevant to maintaining the security of the Control
Area by observing local operating parameters. Listings and descriptions of the
documents related to operational readiness for the summer months are summarized in
Appendix II.
TFCO is systematically replacing operations-related “B” and “C” documents by
adding the requirements language from these documents to “A” documents, creating
Reference Documents with the non-requirements content.
Since the Reliability Assessment for Summer 2002, the following revisions to NPCC
documentation have occurred:
The A-3 “Emergency Operation Criteria” and the A-6 “Operating Reserve Criteria”
documents have been revised and approved by the NPCC membership. In addition,
definitions required in the A-3 and A-6 documents have been added to the A-7
“Glossary of Terms” Document. New Reference Documents RD-04 “Operating
Procedures for AEC Diversity Interchange” and RD-05 “Procedure for Operating
Reserve Assistance” have been created. Also, draft versions of Reference Documents
RD-06 “Monitoring Procedures for Operating Reserve Criteria” and RD-07
Page 31
Docket No. ER11-1844
Exhibit No. NYI-17
Page 32 of 61
“Procedures for Shared Activation of Ten Minute Reserve” have been developed as
revisions to the present C-9 and C-12 documents, respectively.
Major revisions to the A-3 Document include: inclusion of the requirements and
specificity defined in former documents B-20, “Guidelines for Identifying Key
Facilities and Their Critical Components for System Restoration,” and C-31, “Testing
and Reporting Procedure for Key Facilities and Their Critical Components Required
for System Restoration”. These requirements needed to be relocated into a criterion
document. In addition, the monitoring of these requirements by the NPCC
Compliance Monitoring and Assessment Subcommittee is specified.
Major revisions to the A-6 document include: the 30 minute restoration requirement
for ten minute reserve deficiencies was changed to be consistent with the latest
version of NERC Policy 1. This allows 90 minutes after the disturbance recovery
period (15 minutes) for the contingency reserve to be restored - effectively 105
minutes from the start of the contingency and the synchronized reserve recovery
requirement is extended from 10 to 15 minutes.
To be prepared to deal with the constantly changing conditions on the power system,
NPCC routinely conducts weekly operational planning calls between Reliability
Coordinators to coordinate short-term system operations. NPCC has also refined and
expanded its emergency conference call mechanism to enable operational security
entities in NPCC and neighboring regions to communicate current operating
conditions and facilitate the procurement of assistance under emergency conditions.
These calls may be initiated upon the request of any Reliability Coordinator and is
coordinated by NPCC Staff. Due to the commercially sensitive real-time nature of
the material discussed, only signatories to the NERC Confidentiality Agreement for
Electric System Security Data may be party to these calls. The CO-8 Operations
Managers Working Group has recently streamlined the emergency conference call
procedure to be more focused on the situation causing the emergency and to limit
discussion to the entities requesting emergency assistance and to those that could
provide help. In addition, several security-related CO-8 conference calls have been
held.
Each Area in NPCC is required under Document C-13, to review its coming twelve-
week capacity margin projection on a weekly basis. This information is
communicated to NPCC for review during the weekly conference operational calls
held in accordance with C-13, “Operational Planning Coordination.” In addition to
this review of twelve-week capacity margin projections, the weekly conference call
discusses operations for the coming ten-day period as well as any information that
may impact operations.
Each Control Area has complemented the NPCC Procedures and Guidelines with
instructions as they apply to their local conditions. The following is a summary of
activity that Areas have taken to ensure that instructions remain current.
Page 32
Docket No. ER11-1844
Exhibit No. NYI-17
Page 33 of 61
Maritimes
The Maritimes Area Operating Procedures are in compliance with the NPCC
Operating Procedures and are supplemented with local procedures.
New England
On March 1, 2003, ISO-NE implemented the Standard Market Design (SMD). This
new market aims to identify Locational Marginal Prices (LMP), resolving seams
issues with surrounding control areas, and introduces many new features to New
England’s wholesale electricity markets. New features include: a Day Ahead Market
(DAM), Real Time Market (RTM), Financial Transmission Rights (FTRs), LMP,
Auction Revenue Rights (ARRs), and significant modifications to existing market
rules and procedures.
In order to efficiently convert to the new markets, ISO-NE and NEPOOL Participants
have been involved in a number of market trials. These market trials were designed
to simulate the proposed markets under future conditions and provide training to all
stakeholders. Market trials were completed by February 1, 2003 and any problems
arising from them were managed by March 1, 2003.
In parallel with the implementation of SMD, a considerable amount of effort was
focused on reviewing and revising New England’s Market Rules and Operating
Procedures. New England’s Operating Procedures are in compliance with the NPCC
Operating Procedures and NERC requirements.
New York
The NYISO continues to review and refine operating and market processes based on
experience gained through the sustained peak load periods of the previous summers.
The positive experience with the initial implementation of the Emergency Demand
Response Program during that period means that program will continue and expand.
Staff will continue the review of Operating Procedures to insure that these procedures
remain consistent with NERC and NPCC requirements and with the interconnection
agreements and coordinating procedures with the adjacent Areas.
Ontario
The IMO continuously reviews and revises all operating procedures to ensure that
they are consistent with both NERC and NPCC requirements as well as with the
Market Rules for Ontario.
Throughout the summer operating period, additional NERC Certified System
Operators will be available to supplement Control Room Operations staff as
conditions dictate.
Page 33
Docket No. ER11-1844
Exhibit No. NYI-17
Page 34 of 61
Quebec
In the event of a capacity deficiency, TransEnergie would first ask Hydro-Quebec
Marketing (HQM) to find additional generation in or out of the Control Area. After
this step, Emergency Operating Procedures, compliant with NERC and NPCC are
implemented.
Changes to Operating Procedures in Shoulder Months
As previously indicated in this report, the uncertainties associated with weather
variability and maintenance overruns in the spring months can quickly lead to
resource shortfalls. Past history has indicated that resource assessment procedures
need special attention during this time frame. As a result of these capacity shortfalls,
many of the Areas have taken actions to prevent a reoccurrence and are described
below.
Maritimes
The Maritimes Area Operating Procedures for the shoulder and summer period are
essentially the same as for the summer of 2002 and no changes are anticipated for the
summer of 2003.
New England
ISO-NE’s Outage Coordination staff has reviewed the proposed maintenance
schedules for generators in the Control Area and, where appropriate, have worked
with the owners to adjust their outages in anticipation of load levels that may be
experienced in the weeks prior to or following the summer peak load exposure period.
However, there is a large amount of capacity scheduled out-of-service in May and if
many of these units experience maintenance overruns, the operable capacity margins
projected for June could be adversely degraded.
New York
NYISO Scheduling staff has reviewed the proposed maintenance outage schedules for
generators in the Control Area and, where appropriate, have worked with the
generator owners to adjust the outage schedules in anticipation of load levels that may
be experienced in the weeks prior to or following the peak load exposure period.
Ontario
As stated above, the IMO has performed an extensive review of reliability procedures
prior to incorporation into new market manuals. This includes the procedure for
maintaining reserve margins and rectifying negative margins. These procedures will
be enforced to ensure that the necessary control actions are taken in the appropriate
time frame if needed to ensure that planning obligations are met.
Page 34
Docket No. ER11-1844
Exhibit No. NYI-17
Page 35 of 61
Quebec
The TransÉnergie Operating Procedures are updated on a continuous basis to reflect
changes in the regulations, market rules and local procedures. There is not, however,
any special Operating Procedures in the summer or shoulder months because
TransÉnergie is a winter peaking system.
Load Response Programs
Each Area utilizes various methods of demand management associated with
interruptible loads. In those Areas where market based structures have been
implemented or are evolving there has been a shift in contractual obligations of the
interruptible loads. The move is an attempt to manage load interruption, as a result of
demand exceeding resources, by giving industrial and commercial customers the
ability to respond to price signals in the wholesale electricity marketplace. Many of
these programs are in varying degrees of development. The following is a summary
of current interruptible load programs available or in development to be available for
the summer period in each Area.
Maritimes
The Maritimes Area is a winter peaking area and does not have any Load Response
Programs. Interruptible and Dispatchable loads are available for use when corrective
action is required within the Control Area.
New England
During times of capacity deficiencies, ISO-NE declares NEPOOL Operating
Procedure No. 4 (“Action During a Capacity Deficiency OP-4”) that includes;
purchasing emergency energy from the neighboring control areas, interrupting
dispatchable and interruptible load customers, implementing voltage reductions, and
public appeals for conservation. This Emergency Operating Procedure (EOP)
provides load relief measures estimated to be between 1,700 MW to 2,700 MW4.
In addition to OP-4, ISO-NE and NEPOOL Participants are continuing the Load
Response Program (LRP) with the goal of temporarily reducing peak electricity
demand by large power users. Through the LRP, NEPOOL Participants or Demand
Response Providers enrolled directly with ISO-NE can enter into agreements with
retail customers to encourage them to reduce their electricity consumption during
periods of high prices or peak demand.
4 This value is based on the NEPOOL OP-4 document as of November 20, 2002 which
ne.com/cmsmss/Standard_Market_Design/Operating_Procedures/
Page 35
Docket No. ER11-1844
Exhibit No. NYI-17
Page 36 of 61
Within the LRP, an asset can reside in one of four distinct programs:
1 - Day-Ahead Demand Response Program
2 - Real-Time Demand Response Program
3 - Real-Time Price Response Program
4 - Real-Time Profiled Response Program
Participants in the Day-Ahead Demand Response Program will offer an amount of
energy into the Day-Ahead market and, if cleared, will be required to interrupt as
offered. Those participants that do not clear in the Day-Ahead Demand Response
Program have the option to participate in the Real-Time Price Response Program.
Within this program, participants will have the option to voluntarily reduce energy
consumption in real time when the Zonal Price produced by the Day-Ahead Energy
Market is greater than or equal to $100/MWh.
Participants involved in the Real-Time Demand Response and Real-Time Profiled
Response Programs will be activated during pre-determined actions of OP-4. Further
details pertaining to the four programs can be found in the ISO-NE Load Response
Manual.
New York
The NYISO introduced a new load response program for the New York Market in
May 2001. The Emergency Demand Response Program is a program in which
Customers would be paid to reduce their consumption by either interrupting load or
switching to emergency standby generation when requested by the NYISO. During
the Summer 2002 period, NYISO activated the EDRP on two occasions. NYISO
received 663MW on July 30, and 636MW on August 14.
The Emergency Demand Response Program is continuing for Summer 2003, and
NYISO estimates that approximately 700MW of load relief will be available to
support the New York State power system during capacity emergency periods
through this program. This program is in addition to the relief obtained through the
emergency procedures for Operating Reserve Peak Forecast Shortage (Section 4.4.1
NYISO Emergency Operations Manual) or in response to the major emergency state
(Section 3.2 NYISO Emergency Operations Manual).
Ontario
As mentioned in the resource adequacy assessment, under the IMO-Administered
Market, there are about 300 MW of price responsive loads. A majority of these loads
are treated as a resource that will be dispatched off the system by the IMO once the
price of energy in the real time market has exceeded the bid (to Buy) price submitted
by the load. The subject load must then reduce their demand according to the dispatch
instructions or the load will face compliance proceedings.
Page 36
Docket No. ER11-1844
Exhibit No. NYI-17
Page 37 of 61
In 2002, the IMO instituted an Emergency Demand Response Program to provide
additional demand relief under emergency conditions. The pilot program, which runs
until April 30, 2003, saw an additional 340 MW of customers involved in this
contracted ancillary service. The customers would reduce their demand on a
voluntary basis. This step was implemented just prior to the interruption of firm load.
The effectiveness of the pilot program has been reviewed and work is underway to
extend the program for the summer of 2003.
Quebec
The Quebec Area is a winter peaking system and does not usually need to resort to
the load response programs during the summer, although, of the 1,356 MW of
interruptible power available in winter, 667 MW could be called on if needed during
the summer.
Emergency Communications Systems with Customers
There is nominally some time lag for control actions to take effect to rectify a
resource deficiency. In the evolving market places there are now many players in
Areas where at one time there were only a few. As a result, simultaneous
communications need to be timely and efficient for multiple resources to respond to
directions by the Reliability Coordinator to quickly mitigate the need for emergency
control actions, including the shedding of load.
Below is a summary of the communication medium that each Area utilizes to
communicate emergency situations with generators, transmitters and customers.
Maritimes
The individual Control Centers within the Maritimes Area provide timely and
accurate information regarding the status of the power system to customers via
websites, news releases, high volume Interactive Voice Response System and
telephone contact through Public Affairs and Customer Services departments or Call
Centers.
New England
In the event of a capacity deficiency, ISO-NE’s website provides real time
information to the general public regarding the status of the power system and the
amount of Emergency Energy Transactions requested during peak periods. In
addition, Control Room Operations will convey the necessary information to ISO-
NE’s Customer Service & Training and the Media and Corporate Communications
Departments so that they can make the necessary communications to federal and state
regulatory agencies and the media. Operations personnel convey the details of any
capacity deficiency to the Satellite Control Centers and neighboring NPCC Areas as
appropriate.
Page 37
Docket No. ER11-1844
Exhibit No. NYI-17
Page 38 of 61
In addition, ISO-NE creates a seven-day forecast that is posted to the ISO web site.
This posting includes a capacity analysis for the peak hour of each day, detailing the
forecasted amount of surplus/deficient capacity for each future day to illustrate
anticipated system conditions.
New York
The NYISO is continuing implementation of its Inter-Control Center
Communications Protocol communications system (ICCP) allowing bi-directional
data communication directly from the NYISO control center systems to the
generating plants. In normal operation this facilitates the transmitting of schedules
and base-points from the NYISO dispatch system to the generators, and improves the
accuracy and timeliness of generator real and reactive power metering.
The NYISO website now displays information including actual control area load in
addition to the real-time zonal pricing information and transmission outage schedules.
Market Participants may also access a “dispatcher notes” page that provides
information on current NYISO system operating conditions.
Ontario
On a daily and weekly basis the IMO will be issuing Security and Adequacy
Assessments (SAA). These supply the Market Participants with detailed adequacy
projections on an hourly resolution for a period of 14 days into the future and on a
weekly resolution for the following two weeks.
The IMO also publishes to Market Participants a System Status Report (SSR) three
times daily by Market Forecasts and Integration during the pre-dispatch period
outlining deviations from the SAA published for days 1 and 2.
The SSR has capability to identify to Market Participants the following Advisories:
Major Change Advisory, System Advisory and, System Emergency Advisory.
To address global adequacy concerns when there is insufficient energy or capacity
available to the IMO-controlled grid or when there are insufficient offers in the real-
time dispatch of the IMO-administered markets, the IMO shift staff can also issue a
SSR. The SSR can be prepared on very short notice. A notice is sent to Market
Participants via their dispatch workstations notifying them that a new SSR has been
issued with the details of the SSR being published to the IMO Public Web site.
To address local area adequacy concerns, the IMO will direct Market Participants to
submit offers, either via the Market Participant's dispatch workstation or telephone.
The IMO also recognizes the need to communicate with the general public at times
when there might be supply shortfalls. To achieve this, the IMO created a public
communications process to ensure that consumers and industries in the general public
Page 38
Docket No. ER11-1844
Exhibit No. NYI-17
Page 39 of 61
were given all the information they need to make informed choices. The procedures
proved to be an effective tool in 2002 for managing load during what proved to be the
hottest summer in Ontario history.
Quebec
To satisfy demands in Quebec, TransÉnergie solicits additional capacity requirements
it may need through Hydro Quebec Marketing (HQM). If HQM cannot secure the
additional capacity required or there is not sufficient time to fulfill the need identified,
TransÉnergie would take actions including the securing of emergency energy from
neighboring systems, cutting of available interruptible loads and instituting voltage
reductions. If these measures are deemed to be insufficient and there is adequate time
a public appeal would be instituted through commercial media. The probability of
resorting to these measures during the summer is very low.
Acquisition of Emergency Energy between Areas
In May of 2000, the NPCC Task Force on the Coordination of Operation adopted a
Memorandum of Understanding for NPCC Area Emergency Assistance. This
document outlines the steps to be taken when there is either a forecast or actual
shortage of operating reserves. The objective of the process is to maximize the
reliance on the marketplace to resolve resource inadequacies, minimizing the need for
emergency transactions between Areas.
While all Areas are resolved to let the market place solve such inadequacies, there
may be occasions where market forces cannot respond in the appropriate manner or
time frame. The following is a summary of ability to transact emergency energy
between adjacent Areas.
Maritimes
The Maritimes Area, through existing agreements with neighboring Control Areas,
namely, ISO-NE and TransÉnergie, has established procedures for the acquisition of
emergency energy.
New England
ISO-NE, through a bid based energy market, has procedures in place to determine the
availability of emergency assistance from its neighboring control areas when
necessary.
New York
During 2002, the NYISO completed updating of the emergency energy provisions in
the interconnection agreements with the Control Areas neighboring New York.
Page 39
Docket No. ER11-1844
Exhibit No. NYI-17
Page 40 of 61
Ontario
The IMO negotiated new operating agreements with the adjacent Reliability
Authorities in 2002 as part of the steps to the new Market. These operating
agreements contain provisions for the transaction of emergency energy into and out of
Ontario and are only implemented in the event that market based solutions are
ineffective.
Quebec
TransÉnergie has agreements with all the Control Areas neighboring Quebec that
detail the conditions and procedures for acquiring emergency energy.
Training Programs
The Control Area operators routinely receive training as a regular part of their regime.
NERC is willing to offer the possibility to System Operators to replace their re-
certification requirement (every five years) by a proof of attendance to 16 hours per
year of training coming from certified courses or programs. This would only be
required for the last 2 years prior their recertification renewal (year 4 and 5) for a total
of 32 hours for operators having been certified with the actual exam and, after having
provided such a proof of attendance, every 2 years. These recognised hours of
attendance would give operators CEH (Continuing Education Hours). Courses or
programs providing those CEH would have to be certified by the NERC CERWG
(Continuing Education Review Working Group). In April, a workshop will be
offered in St. Louis for course and program providers to understand more the
requirements that they will need to meet to be able to provide CEH. In summer,
courses and programs certified to issue CEH could be offered by these providers and
finally, in October or November the NERC Board of Trustees could approve this new
process. More information is available on the NERC Web site
The following is a summary of those activities planned prior to the summer operating
period of 2003.
NPCC will be conducting a dispatcher seminar at ISO-New England on May 1 and 2,
2003, for dispatchers from each of the Control Areas in NPCC to share views and
experiences. It is also a presentation vehicle for issues of concern to all NPCC Area
operators. The keynote topic will be the New York-New England common market
development. The seminar will also include the summer outlook for each Area, a
summary of recent events within NPCC, developments coming from NERC, an
update on NPCC policy and procedures, and a review of recent events in the industry.
The agenda and seminar are developed by the NPCC CO-2 Working Group on
Dispatcher Training, in conjunction with CO-8 System Operations Managers.
Page 40
Docket No. ER11-1844
Exhibit No. NYI-17
Page 41 of 61
Maritimes
The Member companies that comprise the Maritimes Area routinely conduct their
own operator training sessions and participate in NPCC Operators training seminars.
Only the operators in the New Brunswick Power Control Center are required to be
certified by NERC, although other operators have received certification. The
Maritimes Area participates in the CO-2 Dispatcher Training Working Group.
New England
In late spring of 2003, ISO-NE Operators and satellite control center personnel will
participate in training sessions in preparation for the summer peak load period.
During these training sessions, applicable NPCC procedures and NEPOOL EOPs are
reviewed in detail. The summer capacity assessment is also reviewed as well as area-
specific voltage control issues and intra-area communication procedures. Training of
ISO-NE Operations staff, including the Satellites, is continually on-going.
New York
NYISO Dispatcher Training staff will be conducting two weeks of in-house training
for each crew of NYISO dispatchers prior to the summer of 2003. These sessions
will address operations issues, updates on NERC activities (Policy 9, Infrastructure
Protection Initiative, E-tag, etc.), NPCC policy changes, updates on NYISO market
operations and market design, updates to NYISO applications and procedures.
NYISO Dispatcher Training staff also presented a series of one week System
Operator Training Seminars for a combined audience of the NYISO dispatch staff and
New York Transmission Owner (TO) system control operators. This program
reviewed selected NYISO operating policies, recent system events, the system
outlook for the Summer 2003, and issues of mutual concern to both TO and NYISO
dispatchers. NYISO emergency operation procedures (Back-up Dispatch System,
Alternate Control Center operation, and Restoration) were also reviewed in
preparation for the spring drills.
Ontario
The IMO continuously operates a training program to ensure that the control room
staff maintains awareness of current and new NERC, NPCC and local operating
procedures.
In preparation for the summer operating period, the IMO has set aside time in the
training program for Shift Operations staff to review results of the IMO summer
assessment, review reactive dispatching techniques as well as, a review of the
changes to emergency procedures.
Page 41
Docket No. ER11-1844
Exhibit No. NYI-17
Page 42 of 61
Additionally, the IMO plans and participates in drills and exercises on a regular basis
to hone emergency preparedness skills and test procedures by simulating real events.
On October 2, 2002 the IMO led an integrated power system restoration exercise to
enhance and improve the response capabilities of the IMO, Market Participants and
Emergency Response organization during emergency situations. Exercise 2002
successfully met all objectives through a comprehensive simulated power system
restoration of southern Ontario excluding the portion east of Toronto. The Exercise
involved the shift operations from the IMO and 23 other organizations. These
included 11 major Distributors, 2 Transmitters, 5 Connected Wholesale Customers,
the Ministry of Energy, Emergency Management Ontario, and 3 Generators.
The IMO will also perform a Rotational Load Shedding simulation exercise prior to
the summer operating market commencement. This exercise will test procedures and
training as well as verify communication methodologies and validate revised load
shedding schedules.
Quebec
Aside from continually on-going training of the operations personnel, there are
monthly and seasonal meetings where anticipated conditions are discussed and new
procedures are explained.
7.
2002 Post-Seasonal Assessment and Historical Review
2002 Post-Seasonal Assessment
At the request of the Task Force on Coordination of Operation the Operations Planning
Working Group conducted an assessment that reviewed 2002 summer actual operating
conditions versus the 2002 Summer NPCC Reliability Assessment Report projections.
The following summarizes some highlights of the review. Please refer to the 2002
Summer Report for details on projections.
Page 42
Docket No. ER11-1844
Exhibit No. NYI-17
Page 43 of 61
Ontario
The 2002 summer was one of the warmest on Record. Hot humid conditions were
experienced throughout the summer in Ontario. As a comparison, the actual weekly
average temperature at Toronto exceeded the historical average temperature in every
week of the report period except four. The chart below shows the average weekly
temperature in 2002 plotted against the 30-year weekly average temperature as
Average Weekly Temperature - Toronto
26
24
22
20
18
16
14
2002 Actual Average Weekly Temperature
Historical Weekly Average Temperature
12
10
8
6
Week Beginning
recorded at Toronto's Pearson Airport.
While the above graph shows the average temperatures for the summer exceeded the
historical average, it is important to point out that there were 40 days where the
maximum daily temperature exceeded 30 degrees Celsius (The historical average is
normally only 12 to 13 days per summer). Additionally, there were 5 periods in the
summer where this temperature extreme lasted 4 or more consecutive days with the
longest lasting 8 days. Also of note were the above normal temperatures experienced
though most of the month of September.
Page 43
Docket No. ER11-1844
Exhibit No. NYI-17
Page 44 of 61
May
June
July
August
September
Days Max
Historical
11.8
23.6
30.1
28.8
16.7
Temperature
2002
9
21
31
30
26
above 20oc
Days Max
Historical
0.43
2.3
5.7
3.2
0.8
Temperature
2002
0
6
16
12
6
above 30oc
With the higher than expected temperatures came higher than expected demands.
The following chart shows the actual Ontario hourly peak against the three curves
illustrated in the 2002 TFCO Summer Operating Reliability assessment. The load
exceeded 25,000 MW on 6 days through the report period for a total of 23 hours.
2002 Predicted Vs Actual Demands
26,000
25,000
24,000
23,000
22,000
21,000
Normal Weather (Predicted - 20 Min Peak)
Normal Weekly Peak + LFU (Predicted - 20 Min Peaks)
20,000
Extreme Weather (Predicted - 20 Min Peak)
2002 Actuals (Hourly Peaks)
19,000
18,000
Week Beginning
Monthly Peak Hourly Demand for Ontario
Month
Day
HE
Hourly Demand
May
30
16
20,068
June
26
16
23,578
July
3
16
25,330
August
13
14
25,414
September
8
17
25,062
Page 44
Docket No. ER11-1844
Exhibit No. NYI-17
Page 45 of 61
With no new generation resources forecasted it was highlighted in the 2002 TFCO
Summer Reliability Assessment that extreme weather impacts and /or higher than
forecast outage rates would require the IMO control area to have a high reliance on
imports. This was true throughout the summer operating period and into September.
The maximum import attained was approximately 4200 MW, which is also close to
the maximum simultaneous transfer capability into Ontario.
While the IMO relied upon market mechanisms to provide the required energy and
operating reserve to the maximum extent possible, off market control actions,
including the purchase of Emergency Energy from Neighbouring Reliability
Coordinators were required on several occasions to supplement Energy and Operating
Reserves. An emergency operating state was declared twice to maximize transmission
capability. An EEA 3 alert and a 3% voltage reduction were implemented on one
occasion. During an EEA 3 alert firm load interruption is imminent or in progress.
The IMO requested generators to seek environmental variances from outflow
discharge temperatures limits at fossil facilities on two occasions. This request was
made to ensure that the IMO had adequate energy in the event that the IMO suffered
its single largest contingency. The approvals were granted, but the variances were not
exercised.
The IMO effectively utilized the NPCC emergency conference calls 34 times and
periodically joined the MISO Planning Conference call to ensure Neighbouring
Reliability Coordinators in NPCC, PJM and MISO of the current or predicted
operating state of the system.
The IMO maintained contact with Market Participants through System Status Reports
(SSR) and System Adequacy Assessments (SAA) to identify the current and
projected status of the IMO-administered market and the IMO-controlled grid.
Additionally, as resources became strained, the IMO issued public advisories and
warnings to the general public through normal media facilities.
The transmission system performed well with minimum voltages being observed at
all times, although marginally during certain periods.
The IMO completed a number of activities in preparation for the summer such as
training, additional reliability studies under high demand conditions and the
contracting for Emergency Demand Responsive loads. Utilization of the Emergency
Demand Responsive loads was not required. These measures allowed the IMO staff
to operate the system in a reliable manner through the period.
Page 45
Docket No. ER11-1844
Exhibit No. NYI-17
Page 46 of 61
New England
During the summer of 2002, there were 12 days in which the temperature exceeded
90 oF in New England. The total New England Power Pool’s (NEPOOL) electrical
load exceeded the reference peak load forecast of 24,200 MW (50% probability of
forecast being exceeded) in 4 differing weeks. The summer 2002 New England peak
load was 25,348 MW. Emergency Operating Procedures (EOPs) were implemented
on six different days. Assistance from neighboring systems was utilized when
necessary but overall, generation performed well and there were no major operating
problems.
The load response program for the summer of 2002 included, at the time of the peak
load, more than 250 customers providing a total of approximately 202 MW (including
nearly 100MW in Southwest Connecticut). While the voluntary, price response
program was implemented on twelve occasions during the summer of 2002, the
mandatory demand response program was not activated during the summer.
About 3,800 MW of new generation had been projected to become commercial
during the summer. Of this, only 350 MW actually went into service. Regional
drought conditions did not have much impact on system operation.
Quebec
The Quebec summer peak load was 20,525 MW on September 9, 2002, which is
about 1,000 MW above the expected peak. A late winter peak of 22,523 MW
occurred on May 14 with temperatures at or below the freezing point all over the
province. In July and August, major forest fires came near some major substations
and the heavy smoke caused some insulator flashovers that resulted in a few lines
tripping. Some transmission limitations were applied but did not affect the ability of
TransÉnergie to provide outside assistance.
New York
NY experienced some unseasonably warm weather in the spring where the demands
exceeded the winter peak demand. The summer of 2002 also saw several hot and
humid days when demand exceeded 30,000 MW. The NYISO served demand greater
than 30,000MW for a total of 25 hours and six separate days. The NY Control Area
peak load was 30,664MW on July 29.
New capacity additions to the NYISO system during the summer totaled 435 MW,
consisting of 10 natural gas fired combustion turbines on Long Island. The Long
Island Power Authority also entered into a short-term lease for 10 truck-mounted
combustion turbines for emergency energy supply during the summer peak load
period. These units were used on several occasions during the peak load period.
Page 46
Docket No. ER11-1844
Exhibit No. NYI-17
Page 47 of 61
A second Rock Tavern 345/115 kV transformer was placed in service. The Athens
345 kV substation was established on one of the existing Leeds - Pleasant Valley
345kV circuits as part of the preparation for the new Athens Generating Station
expected to be operational during the Summer 2003. Construction of the HVdc Cross
Sound Cable was completed between New Haven Harbor (ISO-NE) and Shoreham
(NY) in August, and operational testing was conducted, but did not become available
for commercial operation during the period.
Maritimes
The peak load experienced by the Maritimes Area during the May - September
period was 3,731 MW, which was approximately 184 MW (5.2%) higher than last
year’s forecast of 3,547 MW. This is due to the peak occurring in May while
experiencing below normal temperatures. This resulted in a greater electric heating
load than would normally be the case.
The Maritimes Area did not anticipate, nor did it experience, any capacity shortages
during the summer of 2002. In fact, it was able to supply up to 700 MW
(interconnection limit) to New England. However, transmission constraints due to
excess generation in Northern New England sometimes reduced the power that could
be transmitted.
Historical Review (Pre-2002)
As summarized in the table below, the forecasted 2003 summer peak is projected to
be below the 2001 and 2002 actual peak for the NPCC Area. This is primarily due to
slower economical growth and the fact that the previous years peak demand was the
result of extreme weather conditions. If extreme weather conditions are experienced
again this summer, it is likely that the forecast below will be exceeded.
Table 1
Historical Peak Demands by Area Occurring May to September5
Total
New
New
Year
Ontario6
Maritimes
Quebec
NPCC
England
York
Demand
1993
20,883
2,773
19,570
25,998
17,500
86,724
1994
20,918
2,797
20,519
27,062
17,562
88,858
1995
21,674
2,958
20,499
27,206
17,960
90,297
1996
21,378
2,937
19,507
25,587
18,193
87,602
1997
21,613
3,252
20,569
28,700
17,983
92,117
1998
22,443
3,314
21,406
28,166
18,463
93,792
5 Peak Demand in MW
6 20 minute Peak Demand
Page 47
Docket No. ER11-1844
Exhibit No. NYI-17
Page 48 of 61
1999
23,435
3,249
22,544
30,311
18,965
98,504
2000
23,222
3,630
22,049
28,138
20,600
97,639
2001
25,269
3,640
24,967
30,983
20,052
104,911
2002
25,414
3,731
25,348
30,664
20,525
105,764
20037
23,684
3,813
25,120
31,430
20,740
104,436
Forecast
Percent
-6.81%
+2.20%
-0.90%
+2.50%
+1.01%
-1.26%
Difference8
8.
2003 Reliability Assessments of Neighboring Regions
East Central Area Reliability Coordination Agreement (ECAR)
Information from the ECAR 2003 Summer Assessment of Load and Capacity is not
available for release at this time pending review and approval of the ECAR members.
The following information is taken from the “Preview of 2003 Summer Conditions”
that is contained in ECAR’s 2002/2003 Winter Assessment of Load and Capacity.
The projected summer peak demand in ECAR for the summer of 2003 is 101,800
MW for Total Internal Demand. This 2003 summer peak is derived from demand
forecasts received in January 2002 with any updates through August 2002. Therefore,
actual operating experience from the last half of 2002 was not considered in
developing this peak demand forecast.
Total capacity for the summer of 2003 is projected to be 128,090 MW. This assumes
7,475 MW of announced capacity additions within the ECAR region are in service by
July 2003. Net scheduled interchange into the ECAR region at the time of the peak is
anticipated to be 2,590 MW, making total Capacity Resources of 130,680 MW.
Capacity Margins for the summer of 2003 are forecast to be higher than the margins
forecast for the summer of 2002, based on the level of announced generation projects.
The capacity margin based on Total Internal Demand (interruptible and direct control
loads are served) and scheduled interchange is 28,880 MW (22.1% of Net Capacity
Resources). This assumes the announced capacity additions within the ECAR region
are in service by July 2003.
Recent experience indicates that a minimal amount of capacity (263 MW) is expected
to be scheduled out of service during the summer peak. This scheduled capacity
7 This value is the weather normal demand used for the base case analysis. A graph in
Section 4 represents the ranges of potential demands that the IMO could experience as a
result of weather variables.
8 Percent Change reflects the increase/decrease in projected peak for the 2003 summer
over the actual peak for the 2002 summer.
Page 48
Docket No. ER11-1844
Exhibit No. NYI-17
Page 49 of 61
outage along with a 4% operating reserve requirement (4,072 MW) means that the
Margin for Contingencies is expected to be 24,545 MW at the time of the ECAR
peak. Recent random outage experience suggests that there is less than a 1%
probability that random outages will exceed this Margin for Contingencies. This is
the probability that the ECAR members will have to rely on supplemental capacity
resources at the time of the peak. Supplemental capacity resources can include
additional imports of power from outside the region, and/or the curtailment of
contractually interruptible loads.
Under a severe condition scenario which assumes a combination of adverse
conditions, (an additional 5% of load due to extreme hot weather, none of the
projected capacity additions in service, and greater than 13% unavailable capacity),
the ECAR Region will not have sufficient resources without supplemental power
purchases. However, based on the import capability, there should be sufficient
resources for this severe condition scenario.
Transmission assessment information is contained in the 2003 Summer Assessment
of Transmission System Performance, ECAR report 02-TSPP-3. This report will be
published in mid-May 2003.
The bulk transmission systems in ECAR are expected to perform reliably under a
wide range of conditions. However, there will be a greater need for the Reliability
Coordinators and Transmission Operators to communicate and coordinate their
actions to preserve the continued reliability of the ECAR systems. It is anticipated
that the ECAR transmission systems could become constrained as a result of unit
unavailability and/or economic transactions that have historically resulted in large
unanticipated power flows within and through the ECAR systems. If these conditions
occur again this summer, local operating procedures, as well as the NERC
Transmission Loading Relief procedure, will need to be invoked in order to maintain
transmission system security. As long as transmission limitations are identified and
available operating procedures are implemented when required, the ECAR bulk
transmission systems are anticipated to perform reliably. During times of heavy
regional and interregional transfers, it will be essential that Reliability Coordinators
and Transmission Operators have timely and adequate information on the sources and
sinks of scheduled transfers in order to identify appropriate corrective actions.
Mid-Atlantic Area Council (MAAC)
The MAAC 2003 summer forecast net peak demand is 53,591MW. This forecast includes
the effects of interruptible demand and load management capabilities which are estimated to
be 17,998 MW. The forecast peak assumes normal summer weather conditions. This
forecast is 2,412 MW lower than the actual MAAC all-time summer peak of 56,003 MW that
occurred on August 14, 2002.
Between June 1, 2002 and June 1, 2003, MAAC’s summer generating capacity is
expected to increase by a net of 4,663 MW to 65,871 MW. 1,927 MW of the
expected increase is already in service. All nuclear units should be in service and at
Page 49
Docket No. ER11-1844
Exhibit No. NYI-17
Page 50 of 61
full capacity (13,030 MW) at the time of the peak. MAAC also has 488 MW of
external capacity resources under contract through the summer peak period. Also, 11
MW of generating capacity is expected to be added between June 1st and the
forecasted peak in July. With the planned new generation, existing internal
generation, and external capacity resources included, the MAAC capacity margin is
forecasted to be 19.2% at the time of the forecasted peak.
The MAAC reserve margin is expected to be 23.8% at the time of the forecasted
peak. With the 11 MW of generating capacity that is expected to be added within the
summer demand period of June through the end of September, the reserve margin will
remain at 23.8%.
MAAC expects to have sufficient generating capacity to serve the 2003 forecast
summer peak demand. When MAAC served its all-time summer peak on August 14,
2002 no emergency procedures were implemented.
MAAC has a net of 698 MW of long-term firm transmission service in place for
energy sales out of MAAC through the summer peak period. Presently, these
transactions are not capacity backed and therefore can be curtailed in the event of a
PJM Capacity Emergency. Historically, approximately 1,200 MW of external
capacity has been transferred out of MAAC on peak summer days and could therefore
decrease the capacity margin by 1.5%.
PJM, the Regional Transmission Organization (RTO) in the MAAC region, is well
prepared for operating emergencies should they occur. Regular drills have been
conducted to exercise procedures in preparation should there be an extremely hot
summer.
The bulk transmission system is expected to perform adequately over various system
conditions.
Page 50
Docket No. ER11-1844
Exhibit No. NYI-17
Page 51 of 61
Appendix I - 2003 Expected Load and Capacity Forecasts
Table 1--NPCC Summary
Revised May 1, 2003
Req.
Week
Installed
Firm
Net
Load
Interruptible
Known
Unplanned
Bottled
Revised
Firm Sales
Operating
Net Margin
Beginning
Capcity
Purchases
Capacity
Forecast
Load
Maint./Derat.
Outages
Resources
Margin
Reserve
Sunday
MW
MW
MW
MW
MW
MW
MW
MW
MW
MW
MW
MW
4/27/2003
141,690
1,202
2,360
140,532
82,750
1,767
25,505
7,108
8,808
18,128
4290
13,838
5/4/2003
142,154
1,202
2,360
140,996
82,191
1,805
25,110
7,108
9,652
18,740
4645
14,095
5/11/2003
142,154
1,202
2,360
140,996
84,046
1,805
22,960
7,108
9,851
18,836
4594
14,242
5/18/2003
142,424
1,202
2,360
141,266
85,901
1,805
19,374
7,108
9,918
20,770
4642
16,128
5/25/2003
142,924
1,202
2,360
141,766
87,970
1,805
18,347
7,108
9,954
20,192
4858
15,334
6/1/2003
142,840
1,197
2,360
141,677
90,659
1,785
16,677
7,108
9,460
19,557
3889
15,668
6/8/2003
142,440
1,197
2,360
141,277
97,073
1,785
16,103
7,108
9,467
13,311
3288
10,023
6/15/2003
142,440
1,197
2,360
141,277
98,356
1,785
15,189
7,108
9,473
12,936
3485
9,451
6/22/2003
142,840
1,197
2,360
141,677
102,098
1,785
16,659
7,108
9,473
8,124
2812
5,311
6/29/2003
142,566
1,197
2,360
141,403
102,610
1,802
13,499
7,108
9,473
10,514
4569
5,945
7/6/2003
141,966
1,197
2,360
140,803
103,013
1,799
13,422
7,108
8,773
10,286
3030
7,256
7/13/2003
142,736
1,197
2,360
141,573
102,425
1,799
13,116
7,108
8,773
11,950
3951
7,998
7/20/2003
142,740
1,197
2,360
141,577
102,257
1,799
11,478
7,108
8,773
13,760
5563
8,196
7/27/2003
142,740
1,197
2,360
141,577
102,396
1,799
11,700
7,108
8,773
13,398
4520
8,878
8/3/2003
143,331
1,197
2,360
142,168
102,772
1,817
12,015
7,108
8,773
13,317
4748
8,568
8/10/2003
143,331
1,197
2,360
142,168
102,715
1,817
12,147
7,108
8,773
13,242
4752
8,489
8/17/2003
143,431
1,197
2,360
142,268
102,529
1,817
12,862
7,108
8,773
12,813
4270
8,542
8/24/2003
142,731
1,197
2,360
141,568
102,669
1,817
13,280
7,108
8,773
11,555
3684
7,871
8/31/2003
142,782
982
2,345
141,419
100,487
1,802
14,758
7,108
8,773
12,094
4031
8,063
9/7/2003
142,790
982
2,145
141,627
92,618
1,792
17,838
7,021
8,746
17,196
2472
14,724
9/14/2003
144,590
982
2,145
143,427
90,271
1,792
18,503
7,021
8,692
20,731
4093
16,638
9/21/2003
144,590
982
2,145
143,427
88,539
1,792
21,794
7,021
8,564
19,300
3694
15,606
9/28/2003
144,590
982
2,145
143,427
88,019
1,797
21,534
7,021
8,449
20,201
3654
16,546
Page 51
Docket No. ER11-1844
Exhibit No. NYI-17
Page 52 of 61
Table 2--Maritimes
Revised March 21, 2003
Week
Installed
Firm
Firm
Net
Load
Interruptible
Known
Req. Operating
Unplanned
Net
Beginning
Capacity
Purchases
Sales
Capacity
Forecast
Load
Maint./Derat.
Reserve
Outages
Margin
Sunday
MW
MW
MW
MW
MW
MW
MW
MW
MW
MW
4/27/2003
6,507
0
850
5,657
3,813
556
913
528
266
693
5/4/2003
6,507
0
850
5,657
3,720
594
1,018
528
266
719
5/11/2003
6,507
0
850
5,657
3,668
594
1,027
528
266
762
5/18/2003
6,507
0
850
5,657
3,597
594
1,044
528
266
816
5/25/2003
6,507
0
850
5,657
3,547
594
1,030
528
266
880
6/1/2003
6,507
0
850
5,657
3,474
574
1,046
528
266
917
6/8/2003
6,507
0
850
5,657
3,442
574
1,037
528
266
958
6/15/2003
6,507
0
850
5,657
3,419
574
759
528
266
1,259
6/22/2003
6,507
0
850
5,657
3,401
574
1,093
528
266
943
6/29/2003
6,507
0
850
5,657
3,369
591
973
528
266
1,112
7/6/2003
6,507
0
850
5,657
3,335
588
1,119
528
266
998
7/13/2003
6,507
0
850
5,657
3,332
588
1,168
528
266
951
7/20/2003
6,507
0
850
5,657
3,338
588
1,088
528
266
1,025
7/27/2003
6,507
0
850
5,657
3,336
588
1,114
528
266
1,001
8/3/2003
6,507
0
850
5,657
3,342
606
1,181
528
266
946
8/10/2003
6,507
0
850
5,657
3,310
606
1,152
528
266
1,007
8/17/2003
6,507
0
850
5,657
3,266
606
1,093
528
266
1,110
8/24/2003
6,507
0
850
5,657
3,219
606
994
528
266
1,257
8/31/2003
6,556
0
850
5,706
3,196
591
958
528
266
1,349
9/7/2003
6,556
0
650
5,906
3,215
581
1,659
441
266
906
9/14/2003
6,556
0
650
5,906
3,271
581
1,630
441
266
879
9/21/2003
6,556
0
650
5,906
3,348
581
1,624
441
266
808
9/28/2003
6,556
0
650
5,906
3,511
586
1,627
441
266
647
Notes:
1 Installed Capacity includes IPP.
2 Load Forecast is expected weekly peak.
Page 52
Docket No. ER11-1844
Exhibit No. NYI-17
Page 53 of 61
Table 3--New England
Revised April 23, 2003
Req.
Week
Installed
Firm
Net
Load
Interruptible
Known
Unplanned
Firm Sales
Operating
Net Margin
Beginning
Capcity1
Purchases4
Capacity
Forecast2
Load3
Maint./Derat.
Outages
Reserve
Sunday
MW
MW
MW
MW
MW
MW
MW
MW
MW
MW
4/27/2003
29,962
1,002
-
30,964
17,078
244
4,000
1,700
2,700
5,730
5/4/2003
29,962
1,002
-
30,964
17,052
244
4,300
1,700
3,400
4,756
5/11/2003
29,962
1,002
-
30,964
18,978
244
4,100
1,700
3,400
3,030
5/18/2003
29,962
1,002
-
30,964
19,860
244
2,300
1,700
3,400
3,948
5/25/2003
29,962
1,002
-
30,964
20,679
244
600
1,700
3,400
4,829
6/1/2003
30,818
997
-
31,815
21,578
244
1,000
1,700
2,800
4,981
6/8/2003
30,818
997
-
31,815
25,120
244
800
1,700
2,800
1,639
6/15/2003
30,818
997
-
31,815
25,120
244
800
1,700
2,800
1,639
6/22/2003
30,818
997
-
31,815
25,120
244
800
1,700
2,800
1,639
6/29/2003
30,827
997
-
31,824
25,120
244
100
1,700
2,800
2,348
7/6/2003
30,827
997
-
31,824
25,120
244
100
1,700
2,100
3,048
7/13/2003
30,827
997
-
31,824
25,120
244
100
1,700
2,100
3,048
7/20/2003
30,827
997
-
31,824
25,120
244
100
1,700
2,100
3,048
7/27/2003
30,827
997
-
31,824
25,120
244
100
1,700
2,100
3,048
8/3/2003
30,818
997
-
31,815
25,120
244
100
1,700
2,100
3,039
8/10/2003
30,818
997
-
31,815
25,120
244
100
1,700
2,100
3,039
8/17/2003
30,818
997
-
31,815
25,120
244
200
1,700
2,100
2,939
8/24/2003
30,818
997
-
31,815
25,120
244
300
1,700
2,100
2,839
8/31/2003
30,817
782
-
31,599
25,120
244
500
1,700
2,100
2,423
9/7/2003
30,817
782
-
31,599
23,100
244
1,100
1,700
2,100
3,843
9/14/2003
30,817
782
-
31,599
21,852
244
800
1,700
2,100
5,391
9/21/2003
30,817
782
-
31,599
21,520
244
2,000
1,700
2,100
4,523
9/28/2003
30,817
782
-
31,599
21,437
244
1,200
1,700
2,100
5,406
Please note that the infromation in this spreadsheet is commercially sensitive, therefore highly confidential
1 Includes IPP and other known generation
2 Load forecast is expected weekly peak (Hourly)
3 Includes Interruptible and Dispatchable Loads used for 2003/2004 Objective Capability calculations + assumed RFP values
4 Firm purchases from NB, NY, and HQ obtained from CP-8 Representative
Page 53
Docket No. ER11-1844
Exhibit No. NYI-17
Page 54 of 61
Table 4--New York
Revised March 11, 2003
Req.
Week
Installed
Firm
Net
Load
Interruptible
Known
Unplanned
Firm Sales4
Operating
Net Margin
Beginning
Capcity1
Purchases4
Capacity
Forecast2
Load3
Maint./Derat.
Outages
Reserve
Sunday
MW
MW
MW
MW
MW
MW
MW
MW
MW
MW
4/27/2003
37,087
37,087
21,805
5,432
1,800
3,292
4,758
5/4/2003
37,087
37,087
22,113
4,049
1,800
3,436
5,689
5/11/2003
37,087
37,087
22,355
2,139
1,800
3,635
7,158
5/18/2003
37,087
37,087
23,382
1,493
1,800
3,702
6,710
5/25/2003
37,087
37,087
24,388
1,146
1,800
3,738
6,015
6/1/2003
37,087
37,087
24,794
121
1,800
3,844
6,528
6/8/2003
37,087
37,087
26,704
60
1,800
3,851
4,672
6/15/2003
37,087
37,087
27,660
0
1,800
3,857
3,770
6/22/2003
37,087
37,087
31,430
0
1,800
3,857
(0)
6/29/2003
37,087
37,087
31,430
0
1,800
3,857
(0)
7/6/2003
37,087
37,087
31,430
0
1,800
3,857
(0)
7/13/2003
37,087
37,087
31,430
0
1,800
3,857
(0)
7/20/2003
37,087
37,087
31,430
0
1,800
3,857
(0)
7/27/2003
37,087
37,087
31,430
0
1,800
3,857
(0)
8/3/2003
37,087
37,087
31,430
0
1,800
3,857
(0)
8/10/2003
37,087
37,087
31,430
0
1,800
3,857
(0)
8/17/2003
37,087
37,087
31,430
0
1,800
3,857
(0)
8/24/2003
37,087
37,087
31,430
0
1,800
3,857
(0)
8/31/2003
37,087
37,087
31,430
0
1,800
3,857
(0)
9/7/2003
37,087
37,087
25,938
262
1,800
3,830
5,257
9/14/2003
37,087
37,087
25,499
779
1,800
3,776
5,233
9/21/2003
37,087
37,087
24,072
2,006
1,800
3,648
5,560
9/28/2003
37,087
37,087
23,140
3,116
1,800
3,533
5,498
Please note that the infromation in this spreadsheet is commercially sensitive, therefore highly confidential
1 NYISO Installed Capacity (ICAP) requirement.
2 Load forecast is expected weekly peak hourly (load+losses)
3 Type II and III DSM not reported. NYISO Emergency Demand Response Program (EDRP) and Special Case Resources (SCR) are
emergency procedures involving committed market resources.
4 "Full Responsibility" Purchases/Sales are included as ICAP resources.
Page 54
Docket No. ER11-1844
Exhibit No. NYI-17
Page 55 of 61
Table 5--Ontario
Revised March 18, 2003
Week
Installed
Total
Load
Interruptible
Known
Req. Operating
Unplanned
Net
Beginning
Capacity
Purchases
Sales
Capacity
Forecast
Load
Maint./Derat.
Reserve
Outages
Margin
Sundays
MW1
MW
MW
MW
MW2
MW3
MW4
MW
MW5
MW
4/27/2003
30,700
200
0
30,900
18,797
300
8,804
1,580
1,350
669
Minimum Margin week.
5/4/2003
30,700
200
0
30,900
18,566
300
8,735
1,580
1,350
969
5/11/2003
30,700
200
0
30,900
18,972
300
7,925
1,580
1,350
1,373
5/18/2003
31,470
200
0
31,670
19,538
300
6,713
1,580
1,350
2,789
5/25/2003
31,470
200
0
31,670
19,942
300
7,289
1,580
1,350
1,809
6/1/2003
31,470
200
0
31,670
21,658
300
5,904
1,580
1,350
1,478
6/8/2003
31,470
200
0
31,670
22,550
300
5,460
1,580
1,350
1,030
6/15/2003
31,470
200
0
31,670
22,875
300
4,805
1,580
1,350
1,360
6/22/2003
31,470
200
0
31,670
22,827
300
5,222
1,580
1,350
991
6/29/2003
31,470
200
0
31,670
23,479
300
4,645
1,580
1,350
916
7/6/2003
31,470
200
0
31,670
23,684
300
3,829
1,580
1,350
1,527
Summer Peak.
7/13/2003
32,240
200
0
32,440
23,616
300
3,925
1,580
1,350
2,269
7/20/2003
32,240
200
0
32,440
23,523
300
3,820
1,580
1,350
2,467
7/27/2003
32,240
200
0
32,440
23,164
300
3,497
1,580
1,350
3,149
8/3/2003
32,240
200
0
32,440
23,305
300
3,657
1,580
1,350
2,848
8/10/2003
32,240
200
0
32,440
23,285
300
3,756
1,580
1,350
2,769
8/17/2003
32,240
200
0
32,440
23,169
300
3,719
1,580
1,350
2,922
8/24/2003
32,240
200
0
32,440
23,321
300
4,138
1,580
1,350
2,351
8/31/2003
32,240
200
0
32,440
21,554
300
5,312
1,580
1,350
2,944
9/7/2003
32,240
200
0
32,440
20,983
300
5,900
1,580
1,350
2,927
9/14/2003
32,240
200
0
32,440
20,049
300
6,443
1,580
1,350
3,318
9/21/2003
32,240
200
0
32,440
19,571
300
7,413
1,580
1,350
2,826
9/28/2003
32,240
200
0
32,440
19,226
300
7,638
1,580
1,350
2,946
Notes
1 Includes all generation registered in the IMO Administered Market.
2 Load forecast is the weekly 60-minute peak demand, based on weather normal case and median growth.
3 Estimated 300 Mw of Price responsive loads.
4 Based on the historical average amount of generation experiencing outages during the period May to September, from 1998 to 2001.
Page 55
Docket No. ER11-1844
Exhibit No. NYI-17
Page 56 of 61
Table 6--Quebec
Revised March 21, 2003
Week
Installed
Firm
Firm
Net
Load
Interruptible
Known
Req. Operating
Unplanned
Net
Beginning
Capacity1
Purchases
Sales2
Capacity
Forecast3
Load
Maint./Derat.
Reserve
Outages4
Margin
Sundays
MW
MW
MW MW
MW
MW
MW
MW
MW
MW
4/27/2003
37,434
0
1,510
35,924
21,257
667
6,356
1,500
1,200
6,278
5/4/2003
37,898
0
1,510
36,388
20,740
667
7,008
1,500
1,200
6,607
5/11/2003
37,898
0
1,510
36,388
20,073
667
7,769
1,500
1,200
6,513
5/18/2003
37,398
0
1,510
35,888
19,524
667
7,824
1,500
1,200
6,507
5/25/2003
37,898
0
1,510
36,388
19,414
667
8,282
1,500
1,200
6,659
6/1/2003
36,957
0
1,510
35,447
19,155
667
8,606
1,500
1,200
5,653
6/8/2003
36,557
0
1,510
35,047
19,257
667
8,746
1,500
1,200
5,011
6/15/2003
36,557
0
1,510
35,047
19,282
667
8,825
1,500
1,200
4,907
6/22/2003
36,957
0
1,510
35,447
19,320
667
9,544
1,500
1,200
4,550
6/29/2003
36,674
0
1,510
35,164
19,212
667
7,781
1,500
1,200
6,138
7/6/2003
36,074
0
1,510
34,564
19,444
667
8,374
1,500
1,200
4,713
7/13/2003
36,074
0
1,510
34,564
18,927
667
7,923
1,500
1,200
5,681
7/20/2003
36,078
0
1,510
34,568
18,846
667
6,470
1,500
1,200
7,219
7/27/2003
36,078
0
1,510
34,568
19,346
667
6,989
1,500
1,200
6,200
8/3/2003
36,678
0
1,510
35,168
19,575
667
7,077
1,500
1,200
6,483
8/10/2003
36,678
0
1,510
35,168
19,570
667
7,139
1,500
1,200
6,426
8/17/2003
36,778
0
1,510
35,268
19,544
667
7,850
1,500
1,200
5,841
8/24/2003
36,078
0
1,510
34,568
19,579
667
7,848
1,500
1,200
5,108
8/31/2003
36,081
0
1,495
34,586
19,187
667
7,988
1,500
1,200
5,378
9/7/2003
36,089
0
1,495
34,594
19,382
667
8,917
1,500
1,200
4,262
9/14/2003
37,889
0
1,495
36,394
19,600
667
8,851
1,500
1,200
5,910
9/21/2003
37,889
0
1,495
36,394
20,028
667
8,751
1,500
1,200
5,582
9/28/2003
37,889
0
1,495
36,394
20,705
667
7,953
1,500
1,200
5,703
Please note that the infromation in this spreadsheet is commercially sensitive, therefore highly confidential
1 Includes IPP and other known generation (Churchill Falls & Labrador Co.).
2 Includes transmission losses of 6%. Does not include firm sale of 45 MW to Cornwall Ontario - Load is supplied radially from Quebec Control Area
3 Load forecast is expected weekly peak (Hourly).
4 This value also includes a load forecast uncertainty (LFU) of 3%.
Page 56
Docket No. ER11-1844
Exhibit No. NYI-17
Page 57 of 61
Appendix II - NPCC Operational Procedures
A-3
Emergency Operation Criteria
Description: O bjectives, principles and requirements are presented to
assist the NPCC Areas in formulating plans and procedures
to be followed in an emergency or during conditions which
could lead to an emergency.
A-6
Operating Reserve Criteria
Description: T his Criteria establishes standard terminology and minimum
requirements governing the amount, availability and distribution of
operating reserve. Procedures are included for corrective action and
mutual assistance in case of operating reserve shortages. The
objective is to ensure a high level of reliability in the NPCC Region
that is, as a minimum, consistent with the standards specified by the
North American Electric Reliability Council (NERC).
B-3
Guidelines for Inter-Area Voltage Control
Description: This document establishes procedures and principles to be
considered for occasions where a deficiency or an excess of
reactive power can affect bulk power system voltage levels
in a large portion of an Area or in two adjacent Areas.
B-12
Guidelines for On-Line Computer System Performance During Disturbances
Description: Establishes guidelines for the performance of NPCC Area
on-line computer systems during a power system disturbance.
B-20
Guidelines for Identifying Key Facilities and Their Critical Components for
System Restoration”
Description: Establishes requirements and guidelines for the
identification of Key Facilities and their Critical
Components that are required for restoration of the power
system following a partial or total system blackout.
Page 57
Docket No. ER11-1844
Exhibit No. NYI-17
Page 58 of 61
C-4
Monitoring Procedures for Guidelines for Inter-Area Voltage Control
Description: T his procedural document establishes TFCO's monitoring
and reporting requirements for conformance with NPCC's
Guidelines for Inter-AREA Voltage Control (Document B-3).
C-5
Monitoring Procedures for Emergency Operation Criteria
Description: T his procedural document establishes TFCO's monitoring
and reporting requirements for conformance with NPCC's
Emergency Operation Criteria (Document A-3).
C-7
Monitoring Procedures for Guide for Rating Generating Capability
Description: This procedural document establishes the TFCO's monitoring
and reporting requirements for conformance with the NPCC,
Guide for Rating Generating Capability (Document B-9).
C-8
Monitoring Procedures for Control Performance Guide
During Normal Conditions
Description: This procedural document establishes a performance measure
for NPCC Areas and systems and outlines the reporting
function for NPCC Control Performance Guide During
Normal Conditions (Document B-2)
C-9
Monitoring Procedures for Operating Reserve Criteria (This Document has
recently been revised and will have a new designation as Reference Document
RD-06)
Description: This procedural document establishes the TFCO's monitoring
and reporting requirements for conformance with the NPCC
Operating Reserve Criteria (Document A-6)
C-11
Monitoring Procedures for Interconnected System
Frequency Response (This Document has recently been revised and will have a
new designation as Reference Document RD-10)
Description: T his procedural document defines procedures for monitoring
frequency responses to large generation losses.
C-12
Procedures for Shared Activation of Ten Minute Reserve (This Document has
recently been revised and will have a new designation as Reference Document
RD-07)
Page 58
Docket No. ER11-1844
Exhibit No. NYI-17
Page 59 of 61
Description: This procedural document outlines procedures to share the activation
of ten-minute reserve on an Area basis. The methods prescribed by
the procedure are intended to ensure that lost generation or energy
purchases are quickly replaced by several areas simultaneously
loading generation in the few minutes immediately following a loss.
C-13
Operational Planning Coordination
Appendix D - NPCC Critical Facilities List
Description: This document coordinates the notification of planned facility
outages among the Areas. It also establishes formal
procedures for Area communications in advance of a period
of likely capacity shortages as well as for weekly and
emergency NPCC conference call among the Areas.
C-15
Procedures for Solar Magnetic Disturbances on
Electrical Power Systems
Description: This procedural document clarifies the reporting channels
and information available to the operator during solar alerts
and suggests measures that may be taken to mitigate the
impact of a solar magnetic disturbance.
C-19
Procedures During Shortages of Operating Reserve
Description: This procedure is intended to provide specific instructions for
the redistribution of Operating Reserve among the Areas
when one or more Area(s) are experiencing an Operating
Reserve deficiency.
C-20
Procedures During Abnormal Operating Conditions
Description: This procedure is intended to complement the Emergency
Operation Criteria (Document A-3) by providing specific
instructions to the System Operator during such conditions in
an NPCC Area or Areas.
RD-01 NPCC Emergency Preparedness Conference Call Procedures-NPCC
Security Conference Call Procedures
RD-02 NPCC Inter-Control Area Power System Restoration Refernce Document
RD-03 Procedures for Communications During Emergencies
RD-04 Operating Procedures for ACE diversity Interchange
RD-05 Procedure for Operating Reserve Assistance
Page 59
Docket No. ER11-1844
Exhibit No. NYI-17
Page 60 of 61
Appendix III - Web Sites
ECAR
Independent Electricity Market Operator
ISO- New England
LEER Members
MAAC
MAPP
Maritimes
Maritimes Electric Company Ltd.
New Brunswick Power
Nova Scotia Power
Northern Maine Independent System Administrator
New York ISO
North East Power Coordinating Council
TransEnergie
Drought Predictors
Canadian
Page 60
Docket No. ER11-1844
Exhibit No. NYI-17
Page 61 of 61
United States
Appendix IV - References
NPCC Summer 2003 Multi-Area Probabilistic Reliability Assessment -May 2003
NPCC Reliability Assessment for Summer 2002 - May 1, 2002
Draft 2003 Summer MEN Interregional Transmission System Reliability Assessment
Page 61
DOCKET NO. ER11-1844
EXHIBIT NO. NYI-18
Docket No. ER11-1844
Exhibit No. NYI-18
Page 1 of 71
Northeast Power Coordinating Council
Reliability Assessment
For
Summer 2004
Approved by the Task Force on Coordination of Operation
May 2004
Docket No. ER11-1844
Exhibit No. NYI-18
Page 2 of 71
Table of Contents
Table of Contents
2
1. Executive Summary
4
2. Introduction
7
3. Demand Forecasts for 2004
8
4. Resource Adequacy
14
5. Potential Usage of Operating Procedures
22
6. Transmission Adequacy
24
7. Operational readiness for 2004 ……………………………………………………… 29
8. Impact of NERC Blackout Recommendations
49
9. 2003 Post-Seasonal Assessment and Historical Review
52
10. 2004 Reliability Assessments of Neighboring Regions
57
Appendix I - 2004 Expected Load and Capacity Forecasts
60
Appendix II - NPCC Operational Criteria and Procedures
67
Appendix III - Web Sites
70
Appendix IV - References
71
Page 2 of 71
Docket No. ER11-1844
Exhibit No. NYI-18
Page 3 of 71
Information provided in this report has been provided by the Operations Planning
Working Group (CO-12) of the NPCC Task Force on Coordination of Operation with
additional information from Reliability Councils adjacent to NPCC.
The working group members are:
Scott Hodgdon
ISO New England
Wendell Ingalls
Nova Scotia Power
Dean Landers
New Brunswick Power
Al Miller (Chair)
Independent Electricity Market Operator
Paul Roman
Northeast Power Coordinating Council
Robert Sauriol
TransEnergie
Robert Waldele
New York ISO
Information from neighboring Reliability Councils provided by:
Bill Harm
PJM Interconnection, LLC and Mid-Atlantic Area Council
(MAAC)
Mona Megeed
PJM Interconnection, LLC and Mid-Atlantic Area Council
(MAAC)
Kim Sauerwine
PJM Interconnection, LLC and Mid-Atlantic Area Council
(MAAC)
Jeff Mitchell
East Central Area Reliability Coordination Agreement
(ECAR)
Additional support by:
Phil Fedora (Chair CP-8)
Northeast Power Coordinating Council
Page 3 of 71
Docket No. ER11-1844
Exhibit No. NYI-18
Page 4 of 71
1. Executive Summary
This report focuses on the assessment of reliability within NPCC for the summer of
2004. Portions of this report are based on work previously done for the NPCC
Reliability Assessment for Summer 2003.
The NPCC Operations Planning Working Group (CO-12) worked closely with the
representatives of the NPCC CP-8 Working Group to ensure results are based on
consistent data and modeling assumptions between the two studies.
Those aspects that the CO-12 Working Group have examined to determine the
reliability and adequacy for NPCC for the summer of 2004 are discussed in detail in
the specific report sections. The following Summary of Findings address the
significant points of the report discussion. These findings are based on forecasted
projections of: load requirements, resource configurations and transmission
configurations. This report evaluates NPCC and the associated Area’s ability to deal
with the differing resources and transmission configurations identifying NPCC and
the associated Areas preparations to deal with possible uncertainties identified in this
report.
Summary of Findings
The forecasted capacity outlook for NPCC during the peak week (week beginning
July 04, 2004)1 indicates a forecasted margin of approximately 14,300 MW of
operable spare capacity. During this week approximately 8,200 MW of the spare
capacity is in the Quebec and Maritimes Areas. The transfer capability between the
Quebec and Maritimes Control Areas to the remainder of NPCC will not permit the
usage of all this forecasted spare operable capacity. This limitation could reduce the
overall capacity by approximately 3,900 MW. During high transfers from New
Brunswick to New England, capacity located north of the Maine- New Hampshire
interface may be bottled or locked in due to existing transmission constraints. This
will reduce the overall spare capacity to NPCC by up to another 500 MW. As a result,
the spare capacity available to the remainder of NPCC in the peak week is reduced to
approximately 10,000 MW. This forecasted value of spare operable capacity available
for the summer of 2004 represents a significant increase over the actual capacity
margins observed during the summer of 2003.
• The week with the forecasted minimum margin occurs during the week beginning
June 27, 2004 where the operable spare capacity available to NPCC after bottling
is forecasted to be around 8,800 MW.
• Approximately 2,500 MW of new capacity (300 MW in New England and 755
MW in Ontario and 1,434 MW in NY) is still to be commissioned before summer.
1 Load and Capacity Forecast Summaries for NPCC, IMO, ISO-NE, NY-ISO, HQ and
the Maritime’s are included in Appendix 1.
Page 4 of 71
Docket No. ER11-1844
Exhibit No. NYI-18
Page 5 of 71
The sizeable spare operable Capacity Margins forecasted for this summer should
counteract any negative impact delays to these capacity additions may have to the
overall NPCC reliability assessment
•
Even though NPCC as a whole shows adequate resources through the report
period, there remains a load pocket within the New England Control Area,
specifically in the southwestern portion of Connecticut that may be at greater risk
of being capacity deficient. The concerns should see some relief this summer as
500 MW of new generation has or will be commissioned in this area since last
summer.
•
ISO-NE is addressing reliability concerns in southwest Connecticut, an area
where demand may exceed supply plus total transmission import limits. A
Request For Proposal (RFP) has been issued for up to 300 MW of quick-start
capacity through the combination of generation resources, demand response
resources, or peak-load reducing Conservation and Load Management (CL&M)
projects.
•
New England and New York have market-based demand response programs in
place that are expected to provide load relief measures that are in addition to
measures available under emergency conditions. Ontario had an Emergency
Demand Response Program in place for the summers of 2002 and 2003. Work is
in progress to extend the program through the summer of 2004.
•
The shoulder months indicate that overall NPCC has significant margins of spare
generating capacity.
•
An analysis of historical periods of high Geomagnetically Induced Currents
(GICs) was performed. While GIC's experienced in late October 2003 were
elevated (K9 Intensity) and caused some entities to take additional actions within
their procedures, the results indicate that these procedures were adequate for
managing the phenomenon.
•
Area environmental constraints, specifically state, provincial and local emissions
regulations may have some impact at various times through the summer 2004
period. The sizeable spare operable Capacity Margins forecasted for this summer,
combined with the procedures in place should minimize any possible effects that
may compromise the power system’s reliability.
•
Since 2002, precipitation levels have restored most water reservoirs to near
normal levels. Hydroelectric generation output may still be impacted in some
isolated locations but is not expected to jeopardize the reliability of the system.
•
Under specific conditions, Quebec and Ontario have identified difficulties
controlling high or low voltages. As indicated in this report, these concerns should
be manageable though effective management of outage programs.
Page 5 of 71
Docket No. ER11-1844
Exhibit No. NYI-18
Page 6 of 71
• The CP-8 Working Group results indicate that all NPCC Areas demonstrated an
annual Loss of Load Expectation (LOLE) of 0.1 days/year or less, under the Base
Case assumptions. The potential use of operating procedures in response to a
capacity shortage this summer is more likely to be required in southwest
Connecticut, Boston, MA, New York City and Long Island, NY if reductions in
anticipated resources and/or additional transmission limitations into NPCC
materialize coincident with higher than expected loads.
• The Communication protocols in place are sufficient to ensure the timely and
efficient communications in all regions to maximize reliance on the marketplace
for emergency support.
• The CO-12 Working Group believes that NPCC and the associated Areas have
adequate generation and transmission for the Summer Operating Period and have
developed the necessary strategies and procedures to deal with operational
problems and emergencies as they may develop. However, the Resource and
Transmission Assessments in this report are mere snapshots in time and base case
studies. Continued vigilance is required to monitor changes to any of the
assumptions that can alter this report’s findings.
Page 6 of 71
Docket No. ER11-1844
Exhibit No. NYI-18
Page 7 of 71
2. Introduction
The NPCC Task Force on Coordination of Operation established the Operations
Planning Working Group (CO-12) to conduct overall assessments of the reliability of
the generation and transmission system in the NPCC Region for the Summer
Operating Period (defined as the months of May through September2) and for other
conditions as requested by the NPCC Task Force on Coordination of Operation.
For the operating period to be considered the CO-12 Working Group:
•
Examined historical summer operational experiences and assessed their
applicability for the period to be studied.
•
Assessed the extent to which emergency operating procedures may be
implemented by the NPCC Areas during the summer of interest.
•
Reported potential sensitivities that may impact resource adequacy on an Area
basis. These sensitivities included temperature variations, merchant plant delays,
load forecast uncertainties, evolving load response measures, solar magnetic
activity and system voltage and generator reactive capability limits.
•
Reviewed the communications protocols with participants to ensure that timely
and efficient communications will be in place in all regions to maximize reliance
on the marketplace for emergency support.
•
Reviewed the operational readiness of the NPCC and actions to mitigate potential
problems.
•
Assessed the implications of strategies adopted for the summer period on the
adequacy of supply in the shoulder months.
•
Coordinated data and modeling assumptions with NPCC Working Group CP-8,
“Resource and Transmission Adequacy” and documented the methodology of
each Area in its projection of load forecasts.
•
Provided as appropriate, coordination with other parallel seasonal operational
assessments including MAAC-ECAR-NPCC (MEN) and NERC RAS.
•
Reviewed the actions that are being taken with respect to known
recommendations that resulted from the August 14, 2003 Blackout.
2 For the purpose of this report, the Summer Operating Period is defined as the week
beginning May 02, 2004 to the week beginning September 26, 2004 inclusive.
Page 7 of 71
Docket No. ER11-1844
Exhibit No. NYI-18
Page 8 of 71
3. Demand Forecasts for 2004
The non-coincident forecasted peak demand for NPCC during the summer of 2004 is
106,642 MW (May-September period). This peak demand translates to a coincident
peak demand of 104,520 MW which is expected during the week beginning July 04,
2004.
Ambient weather conditions are the single most important variable impacting the
demand forecasts during the summer months. As a result, each Area is aware that the
summer peak demand could occur during any week of the summer period as a result
of these weather variables. It should also be noted that the non coincident peak
demand calculation is impacted by the fact that the Maritimes and Quebec experience
late Spring demands that are influenced by heating loads that occur during the defined
Summer Operating Period.
The impact of extreme ambient weather conditions on load forecasts can be
demonstrated by various means. The IMO, Maritimes and TransÉnergie (transmission
operations division of Hydro-Quebec) represent the resulting load forecast
uncertainty in their respective Areas as a percentage of the base load. NYISO and
ISO-NE use a Temperature Humidity Index (THI) as a base and increase the load by
a MW factor for each degree above the base value.
Historically the peak loads and temperatures between New England and New York can
have a high degree of correlation due to the relative locations of their respective load
centers. Depending upon the extent of the weather system and duration, there is some
potential for the Ontario peak demand to be coincident with New England and New
York.
The method each Area uses to determine the peak forecast demand and the associated
load forecast uncertainty relating to weather variables is described in greater detail in
the Control Area Summary of Forecasts below.
Summary of Area Forecasts
Maritimes
Based on the Maritimes Area 2004 demand forecast, a peak of 3,604 MW is predicted
to occur for the summer period of June through August, during the week beginning
June 6, 2004. This is a 2.3% increase over the Summer 2003 actual peak of 3,523
MW, which occurred on June 27, 2003. Since the Maritimes Area is a winter-
peaking area, forecasted peaks for the shoulder months of May and September are
normally higher than the summer period. For the week beginning May 2, 2004, the
predicted peak is 3,922 MW; for the week beginning September 26, 2004, the
predicted peak is 3,640 MW.
Page 8 of 71
Docket No. ER11-1844
Exhibit No. NYI-18
Page 9 of 71
The load forecast for the Maritimes Area represents the expected load for the 2004
Summer Operating Period. It should be noted that the Maritimes Area load is simply
the mathematical sum of the forecasted weekly peak loads of the sub-areas (New
Brunswick, Nova Scotia, Prince Edward Island, and the area served by the Northern
Maine Independent System Operator). As such, it does not take the effect of load
coincidence within the week into account. If the total Maritimes Area load included a
coincidence factor, the forecast load would be approximately 1 - 3% lower.
For New Brunswick Power, the load forecast is based on an End-use Model (sum of
forecasted loads by use e.g. water heating, space heating, lighting etc.) for residential
loads and an Econometric Model for general service and industrial loads, correlating
forecasted economic growth and historical loads. Each of these models is weather
adjusted using a 30-year historical average.
For Nova Scotia Power, the load forecast is based on a 30-year historical climate
normal for the major load center, along with analyses of sales history, economic
indicators, customer surveys, technological and demographic changes in the market,
and the price and availability of other energy sources.
Maritimes Electric Company Ltd.’s
(Prince Edward Island) load forecast uses
average long-term weather for the peak period (typically December) and a time-
based regression model to determine the forecasted annual peak. The remaining
months are prorated on the previous year.
The Northern Maine Independent System Administrator performs a trend analysis on
historic data in order to develop an estimate of future loads.
New England
The New England Control Area’s forecasted summer 2004 peak demand is 25,735
MW. This is 615 MW (2.4%) higher than last year's forecast for 2003 of 25,120
MW. In order to arrive at the forecast for summer 2004, last years forecast was first
weather normalized to 25,170 MW and using this value, the forecast for 2004 is 565
MW (2.2%) higher.
In comparison to actual historical peak loads, the summer 2004 forecast is 1,050
MW (4.3%) higher than last year's actual peak electrical load of 24,685 MW. The all
time electrical peak load for New England is 25,348 MW. This load was
experienced on August 14, 2002.
The demand forecast for New England is based on weekly weather distributions.
The weekly weather distributions were built using 30 years of Temperature Humidity
Index (THI) data at the time of daily peaks (for non-holiday weekdays). The
reference load forecast is based on a 50/50 probability of occurrence. While this
temperature sampling is used to project temperature sensitive loads, a complete
process of sampling and econometric models are used to project the overall
Page 9 of 71
Docket No. ER11-1844
Exhibit No. NYI-18
Page 10 of 71
aggregate demand. A reasonable approximation for “normal weather” associated
with this projection is 90 degrees Fahrenheit (32 degrees Celsius) and a dew point of
70 degrees Fahrenheit (21 degrees Celsius). At these forecasted load levels, a one-
degree Fahrenheit increase in the THI (Fahrenheit) will result in approximately 800
MW of additional load. The amount of additional load depends on the total
deviation from the “normal weather” approximation.
The reference case forecast of 25,735 MW has a 50% chance of being exceeded.
New England also produces a load forecast of 27,305 MW that has only a 10%
chance of being exceeded. This would be equivalent to an increase in the 50% load
forecast of approximately 1,570 MW.
The following graph illustrates the range of potential peak demands that ISO-NE
may experience this summer and compares them to historical peaks. It should be
noted that the historical peak values illustrated below are the peak loads reconstituted
to reflect power system invoked load relief procedures (Operating Procedures) that
may have been implemented at such times.
New England Summer 2004 Load Profiles
29,000
27,000
25,000
23,000
21,000
19,000
Reference Load
Extremer Load
Historical Peak (1980 - 2003)
17,000
15,000
Week Beginning
New York
The forecast peak for the New York Control Area is 31,800 MW, which is 370 MW
higher than last year’s forecast of 31,430 MW. This forecast is 2.6 % higher than the
all time peak of 30,983 MW that occurred on August 9, 2001. The forecast is based
on the forecasts for the transmission districts by the Transmission Owners and
municipal agencies. For peak load normalization, the NYISO uses a Temperature-
Page 10 of 71
Docket No. ER11-1844
Exhibit No. NYI-18
Page 11 of 71
Humidity Index (THI) value of 81 degrees Fahrenheit (27 degrees Celsius). At
forecast load levels, a one-degree increase in the THI (Fahrenheit) will result in
approximately 500 MW additional load. The extreme weather forecast peak is 33,390
MW.
The following illustration provides the range of potential peak demands that the New
York Control Area may experience this summer.
Ontario
The forecasted weather normal, summer hourly peak demand for 2004 is 23,668 MW.
This hourly peak is forecasted to occur during the week beginning July 04, 2004. The
weather normal forecast is derived from an analysis of the average demands using 30
years of historical weather based on a weekly resolution. The normal weather equates
to an approximate average daily temperature of 28 degrees Celsius (82 degrees
Fahrenheit) and 65% relative humidity and represents the average weather that can be
experienced during any given week during the assessment period.
The load model and resultant demands have been updated to reflect the latest median
economic growth forecasts for Ontario. As was seen in 2001 and 2002, weather
extremes can propel the demands significantly higher than the weather normal values.
Since peak demands are highly weather sensitive the impacts of additional weather
scenarios need to be understood as part of the assessment.
Page 11 of 71
Docket No. ER11-1844
Exhibit No. NYI-18
Page 12 of 71
Load Forecast Uncertainty (LFU) is used to capture, in MW, the impact of these
variations from normal weather. Therefore demands can be derived and given a
probability of occurring based on the likelihood of observing the normal weather. For
this forecast, there is a 50% chance the peak demand in any given week will exceed
the weather normal base demands. LFU represents the impact on the peak demand of
one standard deviation in the weather elements. The values of LFU associated with
this analysis ranges from about 5% to 9% of the predicted normal weather demands.
The highest values of LFU for Ontario appear during those weeks just prior to and
after the traditional summer vacation periods of July and August. LFU equates to a
potential increase in demand of about 1,200 MW over the weather normal for the
peak week.
Lastly, the summer period can experience extreme weather driven demands where the
system is likely to be under duress. For any given week, the IMO forecasts extreme
weather demand by using the hottest day in the past thirty years as the reference
point. Depending upon the week in this assessment period, the values that could be
experienced under extreme weather conditions can be 8 - 17% higher than the normal
weather prediction. This can equate to an increase of approximately 2,600 MW over
the normal weather prediction on the peak week. During the shoulder months of May
and September, the impact of extreme weather over normal weather forecasted
demand can reach as high as approximately 3,200 MW.
The following graph indicates the range of possible demands that Ontario may
experience over the assessment period.
Ontario Forecast Demands Summer 2004
26,000
25,000
24,000
23,000
22,000
21,000
Weather Normal Forecast Demands
Weather Normal + 1 lFU Forecast Demands
Weather Extreme Forecats Demands
20,000
19,000
Week Beginning
Quebec
Page 12 of 71
Docket No. ER11-1844
Exhibit No. NYI-18
Page 13 of 71
The forecasted summer peak for the Quebec Control Area in 2004 is 21,517 MW.
This is 296 MW (1.3%) lower than last summer's peak of 21,813 MW which
happened on an unseasonably cold day at the beginning of May, with temperatures
around 5 degrees Celsius (41 degrees Fahrenheit). If we exclude this anomaly, the
forecasted summer peak for 2004 is 966 MW (4.7%) above the peak of 20,551 MW
reached on June 26th of last year, when temperatures reached 33 degrees Celsius (92
degrees Fahrenheit) with a Heat and Humidity Index of 42 degrees Celsius (108
degrees Fahrenheit) on the major load centers.
The forecast is based on 35 years of historical weather with an offset of ±3 days for
every date, which amounts to the equivalent of 245 years of sampling. Being exposed
over the year to all kinds of extremes in weather, TransÉnergie uses three different
load forecasting models (autumn, winter and spring). For the purpose of this
assessment, the spring model is used up to the middle of August and the autumn
model is used for the remainder of the period. The boundaries of the parameters of
these models are regularly calibrated by comparing the results to the last two years of
historical weather to reflect any new tendencies. Finally, TransÉnergie defines load
forecast uncertainty (LFU) as a percentage calculated on a monthly resolution. The
value for LFU is approximately 3% for the summer months, which represents from
600 to 700 MW. This value is accounted for in the Load and Capacity table provided
in this assessment.
Page 13 of 71
Docket No. ER11-1844
Exhibit No. NYI-18
Page 14 of 71
4. Resource Adequacy
NPCC Summary for 2004
The following assessment of resource adequacy indicates the week with the highest
overall NPCC demand is July 04, 20043.
With the addition of resources the overall net margin for NPCC has improved over
the assessment for 2003. The majority of the resource increase is in Ontario and
involves generation that has already returned to service. Therefore, if the expected
additional resources do not materialize, the overall effect on the projected operable
spare capacity for the 2004 Summer Period should be minimal.
During the peak week for NPCC the overall spare operable capacity is forecasted to
be slightly greater than 14,300 MW. However, a portion of this spare operable
capacity is in the Quebec and Maritimes Area. If conditions materialize as expected,
transmission transfer capability between these Areas and the remainder of the NPCC
Areas will limit the usage of all of these resources.
Additionally, under conditions of high transfers from New Brunswick to New
England up to 500 MW of resources may become bottled north of the Maine / New
Hampshire border due to possible transmission constraints.
The overall net margins for NPCC have been reduced by approximately 2,600 to
5,400MW during the period of mid June to late August to account for this bottled
capacity. After accounting for possible transmission constraints within NPCC,
approximately 8,800 MW of spare operable capacity is forecasted for the week with
the lowest net margin.
The following graph highlights the projection of NPCC Demands, a Projected
Resources Scenario and an Existing Resource Scenario for the Summer Operating
Period. The projection of NPCC Demand is a summation of each Areas projected
demand on a weekly basis. The Projected Resources Scenario is a summation of each
Areas; Projected Installed Capacity plus a projection of Interruptible Demands less
Operating Reserve requirements, a projection of Known Outages, a projection of
Unknown Outages, Bottled Resources and the Net of Firm Imports / Exports to
NPCC. The Existing Resource Scenario uses the same elements as the Projected
Resources Scenario but assumes that none of the resources that are currently
undergoing commissioning or are forecast to be in service will be available at any
time for the summer.
3 Detailed Load and Capacity Forecast Summaries specific to NPCC and each Area are
included in Appendix I.
Page 14 of 71
Docket No. ER11-1844
NPCC Demand and Resource Projections
Exhibit No. NYI-18
Peak Week Margin 9,990 MW
Page 15 of 71
115000
Minimum Margin - 8,832 MW
110000
Projected Peak 104,520
105000
100000
95000
NPCC Demand Forecast
Net Projected Resources Available
Existing Resource Scenario
90000
85000
Week Beginning
The assessment was performed on the basis of projected available capacity.
Inadequate fuel supply, lower than normal water reservoirs, higher than anticipated
forced outages or delays in anticipated new facilities can have an adverse impact on
these capacity projections.
The following are the Area assessments supporting this overall resource adequacy
assessment.
Projected Load and Capacity Analysis by Area
Maritimes
When allowances for unplanned outages (based on a discrete MW value representing
a typical forced outage) are considered, the Maritimes Area is projecting more than
adequate capacity margins for the Summer 2004 assessment period. Net margins
ranging from 4% to 37% are projected over the period May through September 2004.
New England
Operable capacity within New England is forecasted to be sufficient to meet load plus
operating reserve requirements during the 2004 Summer Operating Period. The
lowest projected operable capacity margin of 388 MW is expected to occur during the
week beginning June 6, 2004 while the highest projected capacity margin of 8,038
MW is expected to occur during the week beginning May 2, 2004 if all assumed
Page 15 of 71
Docket No. ER11-1844
Exhibit No. NYI-18
Page 16 of 71
system conditions materialize. Available operable capacity is based on known
outages, an allowance for unplanned outages4, anticipated generation additions and
retirements, projected firm purchases and sales, and the impact of expected Demand
Response Programs.
While ISO-NE expects to have adequate operable capacity margins for this summer, if
operable capacity shortages occur due to higher than expected resource unavailability
or higher than expected load conditions, ISO-NE may have to implement NEPOOL
Operating Procedure No. 4 - Action During a Capacity Deficiency (OP-4). OP-4 is
designed to provide additional generation and load relief needed to balance electric
demand and supply while striving to maintain appropriate operating reserves.
Although it is projected that operable capacity is surplus for the ISO-NE Control Area,
the southwestern Connecticut region may face reliability problems due to transmission
constraints into and within that region. Pursuant to planning studies conducted for the
2003 and 2004 Regional Transmission Expansion Plans, ISO-NE has identified
concerns regarding electric transmission reliability in the southwestern Connecticut
sub-region. Under certain conditions, the electric load in the southwestern
Connecticut region could exceed the combined ability of the electric generating
resources in the region, and the available transmission capacity to import electric
energy into the region. Under these conditions, the generation and transmission
systems within the region may not be able to supply the electric load without
overloading lines or causing low voltage. In order to address this reliability concern,
ISO-NE has issued a Request For Proposal (RFP) for up to 300 MW of quick-start
capacity through the combination of generation resources, demand response resources,
or peak-load reducing Conservation and Load Management (CL&M) projects. This
RFP defines a contract term of up to four years, covering 2004 - 2007, with an option
for a one-year extension.
New York
NYISO forecasts available capacity of 38,518 MW for the peak week resulting in a
capacity margin of 1,543 MW.
These resources represent all generation capability located physically within the New
York Control Area and are able to participate in NYISO ICAP market. In addition to
these generation resources within the NYCA, generation resources external to the
NYCA can also participate in the NY ICAP market. Resources within the NYCA
that provide firm capacity to an entity external to the NYCA are not qualified to
participate in the ICAP market.
4 The allowance for unplanned outages is based on historical trends and is estimated to be
between 2,100 MW and 3,400 MW during the summer.
Page 16 of 71
Docket No. ER11-1844
Exhibit No. NYI-18
Page 17 of 71
NYISO conducts semi-annual and monthly Installed Capability (ICAP) auctions.
Based on the forecast load for 2004, the ICAP requirement is 37,524 MW based on
the 18% installed reserve margin requirement. When allowances are taken for
unplanned outages (based on historical performance of 9.7 % unavailable capacity),
the net available resources will be 33,865 MW, which will be sufficient to meet the
New York Control Area (NYCA) load and operating reserve requirement during the
peak load hours, with a reserve margin of approximately 265 MW expected at peak
conditions.
NYISO expects approximately 1,100 MW of load relief from emergency operating
procedures that include internal load curtailment by the transmission owners, public
appeals and 5% system wide voltage reductions. Participation in the Emergency
Demand Response Program and Special Case Resources programs represents an
additional 877 MW available through the market. NYISO Emergency Demand
Response Program (EDRP) and Special Case Resources (SCR) are emergency
procedures involving committed market resources but are not considered as
interruptible load in the Load & Capacity table calculations of net margin.
New York Resource additions, totaling 1, 434 MW are expected to be available for
service prior to the summer peak. The Athens station represents 1073 MW of the
total, and will connect to the 345 kV transmission system in upstate New York. The
plant has completed testing and is expected to be commercial prior to the Summer
peak period. Ravenswood 4 will have a real power output of 221 MW and will
connect to the 138 kV system in New York City. These units are undergoing final
testing and are expected to be commercial prior to the Summer peak period. Both
Athens and Ravenswood 4 are natural gas fired combined cycle plants.
Two natural gas fired combustion turbines with a combined capability of 91 MW are
being installed at Freeport in Long Island zone. Both are expected to be in service
prior to July 1. Additionally, the Long Island Power Authority (LIPA) is installing
two 48MW blocks of emergency generation at the Holtsville and Shoreham stations.
These units are expected to be available for service June 1 through October 31, 2004.
As in previous years as part of the peak period capacity assessment, the NYISO
determines the locational capacity requirements for the NYC and Long Island load
zones in addition to the statewide capacity requirement. For the Summer 2004,
based on the installed capacity as of February 2004, there was a projected deficiency
of 270MW statewide, 109MW for the NYC load zone, and an 83MW surplus for the
Long Island load zone. New capacity additions prior to the Summer will satisfy the
statewide and locational requirements. The capacity additions on Long Island will
further enhance the locational capacity margin in that zone.
Page 17 of 71
Docket No. ER11-1844
Exhibit No. NYI-18
Page 18 of 71
Ontario
The return to service of three nuclear units that were laid up in the late 1990's began
in 2003. Bruce A units G4 and G3 and Pickering G4 unit began generating electricity
in the later half of 2003. This represented a net capacity addition of 2,065 MW to
Ontario.
The IMO is anticipating an additional 755 MW of gas fired operating capacity for the
2004 summer operating period. The generation addition at Imperial Oil is expected to
complete commissioning by the Summer Operating Period adding 98 MW of
capacity. The IMO also expects 625 MW of generation at Brighton Beach by June 30,
2004 and 32 MW at Northland Power - Kirkland Lake to be in commercial service by
August 1, 2004.
With these additions, the IMO is anticipating positive spare operable capacity margin
of 2,440 MW on the peak week based on the expected the weather normal load
forecast.
This forecast of spare operable capacity is based on the assumption that the new
generating resources will meet their in service projections, known outages will
proceed as planned, a projection of unknown outages, and a forecast of price
responsive loads.
Known outages include the following; those resources that are scheduled to be on
planned outages, transmission constrained resources and the difference between the
installed capacity and the dependable capacity. For example, hydroelectric capacity is
reduced by varying amounts through portions of the study period to account for the
energy available under median water conditions.
Unknown outages represent the average value of forced outages experienced in this
same study period during previous years.
A value of 300 MW of price responsive load has been assumed to be available for this
forecast based on past operational experience.
The net capacity margins, in Table 5 of Appendix I, depict an estimate of the operable
capacity margin that does not consider all the additional off-market control actions
available to the IMO. For example, the IMO can institute a 3% or 5% voltage
reduction. These control actions have the effect of reducing the demand by 1.7% to
2.5%, which, equates to approximately 390 MW to 500 MW on the peak week.
The risks associated with this analysis are that demands may be heavier than expected
due to extreme weather, units on outage may not return to service as scheduled or
there are delays to new and returning units. Of some concern for this summer are the
number of units on outage that are expected to return to service before the end of
June. While Ontario has a spare operable capacity margin of 1,200 MW or more
Page 18 of 71
Docket No. ER11-1844
Exhibit No. NYI-18
Page 19 of 71
during this period, the IMO will monitor the capacity balance and take appropriate
actions where necessary.
Quebec
TransEnergie is projecting more than adequate capacity margins for the Quebec
Control Area during this period. Being a winter peaking region, the summer is the
season during which maintenance work is performed, but margins in the range of
4,700 to 7,000 MW above load and firm sales projections are nevertheless expected.
Delays to In-service of New Generation Resources
Maritimes
The Maritimes Area has no new generation resources scheduled for commercial
operation during the summer period May through September 2004.
New England
In the New England Control Area, from April 2001 through February 2003,
approximately 7,200 MW (summer rating) of new capacity has been added to the
system with an additional forecast of approximately 300 MW to be in service prior to
June 1, 2004. Of the new generation assumed to be commercial this summer,
approximately 250 MW will be located in southwestern Connecticut. This additional
capacity will enhance the reliability of southwest Connecticut and assist in meeting
the overall electricity demands during summer peak periods.
ISO New England closely monitors the construction and commissioning of new
generators as well as transmission projects. However, any delay in the
commissioning of the projected new generation within New England will decrease
projected capacity margins.
New York
Construction at the Ravenswood and Athens sites is essentially complete, and the
units have completed capability testing, these units are expected to be in commercial
operation well in advance of the summer peak period.
The Ravenswood unit #4 became commercial on March 29 2004 and will satisfy the
locational capacity deficiency noted in the NYC load zone. The balance of any
statewide shortfall would be satisfied by Athens, new resources in the Long Island
load zone or by external ICAP resources. The Long Island zone shows a surplus for
the locational capacity assessment. Any delay in the operation of the planned units is
Page 19 of 71
Docket No. ER11-1844
Exhibit No. NYI-18
Page 20 of 71
not expected to have a reliability impact. In addition, the installation of two 48MW
blocks of emergency generation at the Shoreham and Holtsville sites will further
enhance system reliability for the summer period.
Ontario
With the recent return to service of the three laid up nuclear units the impact of a
delayed in service of new generation to the resource adequacy margin is not expected
to be significant under normal weather conditions for the Summer Operating Period.
The IMO recognizes the risks associated with the timing of the in service of new
generation facilities as well as the impact of weather on the demands. The IMO
continuously monitors the in service date and the associated impact on the resource
adequacy margins.
Quebec
The Sainte Marguerite-3 hydro plant (900 MW) was finally commissioned after a
two year delay over the initial planning target. However, its total output continues to
be restricted to 580 MW until a solution to problems with the turbines is found and
implemented. This will not be done before the summer of 2004. No other significant
generation is expected.
Fuel Infrastructure by Area
The following is a self-assessment by each Area of the expected fuel supply
infrastructure.
Maritimes
The fuel supply in the Maritimes Area is very diverse and includes Nuclear, Natural
Gas, Coal, Oil (both light and residual), Orimulsiontm, Petroleum Coke, Hydro, Tidal,
Municipal Waste, and Wood.
The Maritimes Area does not anticipate any restrictions in capacity due to fuel
supply. Units that have been converted to the Orimulsiontm fuel retain their full
capability on oil. Moreover, the Area anticipates normal hydro conditions and the
reservoirs are expected to be full.
New England
In July of 2003, ISO New England formed the Fuel Diversity Working Group
(FDWG) as a subcommittee reporting to the Transmission Expansion Advisory
Committee (TEAC). The FDWG provides an arena for all stakeholders to discuss
Page 20 of 71
Docket No. ER11-1844
Exhibit No. NYI-18
Page 21 of 71
and assess the reliability impacts resulting from the range of fuel mix and fuel
delivery options available to electric generators serving New England.
Historically, traditional fuel supply and delivery options have been readily available
to generators within New England during the summer months. For the summer of
2004, ISO New England does not foresee any fuel supply or delivery constraints.
New York
Traditionally, the New York Control Area generation mix has been dependent on
fossil fuels for the largest portion of the installed capacity. Recent capacity additions
or enhancements now available use natural gas as the primary fuel. While some
existing units in southeastern New York have “dual-fuel” capability, use of residual
or distillate oil as an alternate may be limited by environmental regulations.
Adequate supplies of all fuel types are expected to be available for the summer
period.
Ontario
The majority of generation facilities operating on the IMO-controlled grid are
represented by three basic types of fuel (Hydroelectric, Nuclear and Fossil). The
fossil-fueled facilities are predominately fired by coal. A portion of these fossil-fired
resources is fueled by natural gas or oil. A majority of the oil-fired capability is dual
fueled by natural gas and oil. The IMO does not anticipate any fuel supply inventory
or delivery infrastructure concerns over the Summer Operating Period. While there
are storage lakes associated with most hydroelectric facilities, the ability to predict
hydroelectric energy is difficult as water flow conditions are primarily influenced by
precipitation. To counter this, the hydroelectric installed capacity is reduced through
portions of the study period to account for reductions in capacity when the available
water historically falls below the dependable value. For the purposes of this
assessment, dependable hydroelectric capacity is the capacity that is sustainable for a
minimum of one hour per day, five days per week.
Quebec
Most of the generation resources in the Quebec Control Area are hydroelectric (95%)
and hydraulic conditions are adequate. For the summer peak of 2004, TransÉnergie
does not foresee any problems in meeting both its internal demand and full
responsibility sales while still being able to assist neighboring Areas as needed.
Page 21 of 71
Docket No. ER11-1844
Exhibit No. NYI-18
Page 22 of 71
5. Potential Usage of Operating Procedures
The NPCC CP-8 Working Group performed a probabilistic analysis to estimate the
annual Loss of Load Expectation (LOLE) and projected use of Area Operating
Procedures designed to mitigate resource shortages for the summer of 2004 under
various conditions. This section is based on the CP-8 Study results.
The scenarios included expected and extreme load patterns. Detailed study results for
each of these scenarios can be obtained from the NPCC CP-8 Working Group -
Summer 2004 Multi-Area Probabilistic Reliability Assessment.
The study results indicate that all NPCC Areas demonstrated an annual loss of Load
expectation (LOLE) of 0.1 days/year or less, under the Base Case assumptions for the
expected load (the expected load is the weighted average of seven load levels,
weighted by the probabilities assumed for each). Recent capacity added in New
England, New York and Ontario, in addition to the capacity and Demand Response
Programs planned to be available this year are contributing factors that tend to reduce
the need for the use of operating procedures designed to mitigate resource shortages
in 2004, as compared to last year’s analysis, under the identified expected conditions.
For the May - September 2004 period, Figure EX-1 shows the estimated potential
range of use of the indicated operating procedures under Base Case assumptions.
Figure EX-1 displays the results for the expected load and the extreme load (the
extreme load level represents the second to highest load level).
2
1
Estimated Number
of Occurrences
(days/period)
0
NE NY ON MT Q
Reduce 30-min Reserve
Voltage Reduction
Reduce 10-min Reserve
Appeals
Disconnect Load
New York issues appeals prior to reducing 10-min Reserve
Figure EX-1
Potential Range of Use of Indicated Operating Procedures for Summer 2004
Considering Base Case Assumptions (May - September)
(Expected and Extreme load levels)
Page 22 of 71
Docket No. ER11-1844
Exhibit No. NYI-18
Page 23 of 71
However, the potential use of these operating procedures is more likely to be
required in southwest Connecticut and Boston MA and New York City and Long
Island, NY, if reductions in anticipated resources and/or additional transmission
limitations into NPCC materialize coincident with higher than expected loads.
Page 23 of 71
Docket No. ER11-1844
Exhibit No. NYI-18
Page 24 of 71
6. Transmission Adequacy
Many Inter-Regional and Intra-Area transmission studies are in the preliminary stages
of assessment. Therefore, the transmission adequacy assessment for this report was
made utilizing assumptions based on consultation with the staff in the appropriate
area of expertise for Inter-Regional transfer capability, supplemented by Intra-Area
Transmission assessments of each Control Area and a review of the actual operating
experience during the summer of 2003.
The following is a transmission adequacy assessment from the perspective of the
ability to support energy transfers for the differing levels, Inter-Region, Inter-Area
and Intra-Area.
Inter-Regional Transmission Adequacy
Evolution of the interconnected network is continuing in the northeastern U. S.
Present plans are for the integration of Commonwealth Edison as part of PJM’s
energy market operations prior to this summer with AEP and Dominion Resources
following later in 2004
A tower on the B3N circuit between Ontario and Michigan (230 kV circuit Scott -
Bunce Creek) was damaged in April of 2003. The options to return the circuit to
service are still being explored. At the current time, it is estimated that the circuit will
not return until after the summer operating period.
As a result, the ability to transfer energy into / out of Ontario on the Ontario-
Michigan Interface will remain the same as last summer.
The B3N phase angle regulator (PAR) was forced from service in March 2003. The
return to service of the PAR is not known at this time. Additionally, the final phase
angle regulator installation on the Michigan-Ontario Interface (Lambton-St. Clair 345
kV circuit L4D) is not expected to be completed until the end of September. For the
study period it has been assumed that the Michigan-Ontario Ties will remain free
flowing.
It is expected that the transmission system is adequate to support the anticipated Inter-
Regional transfers.
Page 24 of 71
Docket No. ER11-1844
Exhibit No. NYI-18
Page 25 of 71
Inter Area Transmission Adequacy
The transfer capability between the NPCC sub-Area containing the Quebec Control
Area and the Maritimes Area with the remainder of NPCC is less than the surplus
capacity in this sub-Area. The estimated transfer capabilities used in the CP-8
probabilistic assessment were used to calculate the remaining transfer capability after
known transactions are taken into account.
Above this restrictive condition, high transfer conditions from New Brunswick to
New England can bottle up to an additional 500 MW of operable spare capacity north
of the Maine / New Hampshire border. This accounts for the adjustment to the Net
NPCC Margins in the Resource Adequacy assessment (Section 4).
The installation of the PAR at Sandbar is part of the Northwest Vermont Reliability
Project, and was expedited due the failure of the Plattsburgh PAR in April 2003.
The new Sandbar PAR will be used to regulate the flow on the PV20 tie line between
New York and Vermont. This new PAR will provide greater regulating range than
the previous Plattsburgh PAR.
After August 14 the Long Island Power Authority obtained an emergency order from
the US Department of Energy to operate the Cross-Sound Cable HVdc tie-line
between New Haven Harbor (ISO-NE) and Shoreham (NYISO). Since that time the
tie-line has been operated under this order, however, it is not yet considered
commercially available and operation of it during the Summer Operating Period is not
a certainty.
The following diagram indicates the assumed transfer capability used in the CP-8
Probabilistic studies. These same transfer capabilities were used in this report for the
determination of Inter-Area / Inter-Region transmission adequacy and the calculation
of bottled resources within NPCC.
Page 25 of 71
Docket No. ER11-1844
Exhibit No. NYI-18
Page 26 of 71
Diagram 1
Assumed Transfer Limits Between Areas
262 S
330 S
NPCC Transfer Limits- 2004 Summer Assessment
274 W
342 W
(Assumed Ratings)
MAN
65 S
275
NE
84 W
95 S
324
110 W
PEI
NW
140
750
400
200
0
NS
90
Ottawa
222
HQ
NBM
1,500
300
MN
0
440 S
124
West
2,690
535 W
200
400
BEAU
350
750
1,000
1,900 S
East
NB
2,000 W
LG2A
1,000 S
Niagara
690
1,100 W
1,475
740 S
760 W
0
1,300 S
Total Ontario
1,500 W
400
4,050 In
225
700
5,550 Out
1,500
1,500
BHE
1,800 S
2,000 W
D
0
150
VT
CMA
A
500
F
C
500
800
G
W-
1,100
MA
1,100
1,600 S
800
1,700 W
330
(CSC)
K
550
J
CT
2,550
286
ECAR
1,100
1,000
NOR
2,000
Total NY-NE
1,225 / 925 S
1,475 W
2,150
MAAC
0
(Excludes CSC)
Transmission Adequacy Assessment by Area
Maritimes
There have been no major additions to the Maritimes bulk transmission system.
Interconnection capability remains unchanged and is expected to deliver up to 700
MW to New England and be capable of delivering up to 700 MW to Quebec.
New England
During the summer of 2004 there are a few transmission upgrades that are expected
to become in-service. These include the Sandbar Phase Angle Regulator (PAR)
located in Vermont, the addition of a second Scobie Transformer in New Hampshire,
and the Glenbrook STATCOM project that includes the tapping of the Darien-
Southend 115 kV 1977 line located in CT.
Page 26 of 71
Docket No. ER11-1844
Exhibit No. NYI-18
Page 27 of 71
As noted in the InterArea transmission adequacy review, the Sandbar PAR will be
used to regulate the flow on the PV20 tie line between New York and Vermont.
The second Scobie autotransformer improves the regional reliability in the
Manchester-Nashua area of New Hampshire. Due to area load growth, the existing
autotransformer has recently experienced heavy loadings.
The Glenbrook STATCOM project and the tapping of the 1977 line into the
Glenbrook Substation improve dynamic voltage and thermal response to
contingencies in the Norwalk-Stamford area.
In November of 2003, the ISO-NE’s Board for Directors approved the 2003
Regional Transmission Expansion Plan (RTEP03). RTEP03 is a comprehensive
electrical engineering assessment comprised of numerous studies and analyses of
New England’s bulk electric power system.
RTEP03 concluded that the southwestern Connecticut (SWCT) region remains the
first area of concern as it lacks the required transmission infrastructure needed to
provide adequate reliability.
New York
There are no major transmission facility additions to the New York bulk power
system expected for the 2004 Summer Operating Period.
After August 14 the Long Island Power Authority obtained an emergency order from
the US Department of Energy to operate the Cross-Sound Cable HVdc tie-line
between New Haven Harbor (ISO-NE) and Shoreham (NYISO). This line continues
to operate under this condition, and is not considered commercially available for
operation.
Ontario
There are no new major transmission facilities scheduled to be placed in service prior
to the Summer Operating Period to change the overall transmission adequacy outlook
from 2003. Studies indicate that there will be sufficient transmission capability to
meet the projected requirements under most conditions.
The installation of capacitor banks totaling 375 MVAr (250 MVAr scheduled for
installation before summer and 125 MVAr installed late last summer), along with the
reactive output of the new Brighton Beach Generation facility should ease voltage
concerns previously identified in the Windsor, Burlington and Toronto areas. While
the concerns may be eased, maintaining acceptable voltage profiles in these areas will
Page 27 of 71
Docket No. ER11-1844
Exhibit No. NYI-18
Page 28 of 71
still require diligent assessment of outage plans, and dispatch/deployment of reactive
resources.
Quebec
The Levis 315kV substation will see a major overhaul of its configuration this
summer. This will permit, in the future, to diminish the impacts of outages on the
transfer capability to New Brunswick. The work will run from April to November and
some steps will have major impacts on the transfer capability to New Brunswick
(during 4 days in August, the capability will be around 200 MW versus a maximum
capability of 1050 MW). The transfer capability from New Brunswick to Quebec will
not be affected for the outages planned during the Summer Operating Period.
An experimental 100 MW Variable Frequency Transformer (VFT) has been installed
at the Langlois substation near the Les Cedres generating plant. It will still be in tests
for the summer of 2004 and could eventually increase the transfer capacity via lines
CD1 and CD2 from Dennison (Niagara Mohawk, NYISO). The additional margin is
not expected to be commercially available for 2004. This interconnection is currently
being fed by islanding generation at the Les Cedres plant and this VFT will also
increase switching flexibility by reducing the number of islanding operations.
Apart from the preceding, no major maintenance outages are scheduled on the
interconnections with neighboring Areas from May to September. Transfer
capabilities will be at their maximum throughout the summer. Internal Transmission
outage plans are assessed to meet load, firm sales, expected additional sales plus
additional uncertainty margins.
Page 28 of 71
Docket No. ER11-1844
Exhibit No. NYI-18
Page 29 of 71
7. Operational Readiness for 2004
The Resource and Transmission adequacy assessments are key elements in
determining NPCC’s ability to meet the demands of the summer, but they are mere
“snapshots in time” or simulations of conditions based on predictions of specific
configurations. To mitigate the uncertainty surrounding load forecasts, forced outages
and other conditions that cannot be controlled or predicted, the Control Areas of
NPCC need to be prepared to deal with contingencies in real time.
The following is a synopsis of some of the most prevalent uncertainties affecting the
ability to handle the projected demand and the mitigating actions NPCC Control
Areas can take to diminish their impact during the summer 2004 period.
Reactive Capability of Generating Units
Heavy demand during the summer period requires that the transmission system
voltages and the end-use reactive loads be supported by substantial reactive resources
in relation to the real power requirements. While static VAR devices and shunt
capacitors provide a known quantity of support based on design rating, the actual
reactive capabilities of generators can vary significantly from the design capability.
The following is a discussion of each Areas methodology to monitor reactive
capability.
Maritimes
The Maritimes Area, in addition to the reactive capability of the generating units,
employs a number of capacitors and reactors in order to provide local area voltage
control. The Area employs Static VAR Compensators and several synchronous
condensers in key load centers to provide high-speed reactive power control. Further,
the Maritimes Area is a winter peaking system and the loading of the transmission
lines in summer is, in general, lower resulting in lower VAR consumption.
New England
ISO-NE and its satellite control centers continually monitor voltage and VAR
conditions throughout the system to ensure reliability of the bulk power grid in New
England. Major generating stations throughout New England have specified voltage
schedules, which are maintained as closely as possible in system operations. In
addition to voltage schedules, minimum and maximum voltage limits at several key
generating or transmission stations have been established to promote system reliability
during adverse voltage/reactive conditions. Also, a Tariff has been in place since
August of 2001 that compensates New England generators for VAR support.
Page 29 of 71
Docket No. ER11-1844
Exhibit No. NYI-18
Page 30 of 71
As part of the NERC transmittal entitled “Near-Term Actions to Assure Reliable
Operations” as a result of the August 14 blackout, ISO-NE has surveyed the status of
all generators in New England to ensure that Automatic Voltage Regulators (AVR)
exist and are normally in-service for the resources as required by NEPOOL Operating
Procedure No. 14 - Technical Requirements for Generation, Dispatchable and
Interruptible Loads (OP-14).
New York
Each generator providing voltage support service under the NYISO Tariff to the New
York market is required to perform annual testing of reactive capability within 90 %
of its claimed operating capability. The NYISO staff reviews the test data and, if
necessary, will perform appropriate voltage analysis to determine operating limits
based on the reactive capability testing. In preparation for the summer peak period,
the NYISO staff has been reviewing the test data to ensure that all voltage support
service providers are in compliance with the testing and reporting requirements for
this ancillary service. The NYISO staff has also requested Transmission Owners and
Generation Owners to identify local (in plant or station) issues that might limit a
particular generator’s voltage support capability.
Ontario
The IMO has the authority to test the declared reactive capabilities of generating
units. Testing of generating units, critical to the support of key portions of the IMO-
controlled grid was completed in February 2004. Analyses of the test results are
underway to ensure that the demonstrated reactive capability is sufficient to meet
system voltage support requirements. The results of the tests will be incorporated
into the detailed capability studies for the summer.
Quebec
Being a winter peaking area, TransÉnergie does not expect to encounter voltage
collapse problems during the summer. On the contrary, controlling overvoltages on
the 735kV network during off-peak hours is the concern. This is accomplished mainly
with ample provision of shunt reactors.
Environmental Impacts
The major Federal rules that apply to electric generating sources in the northeastern
United States are the Acid Rain regulations, New Source Performance Standards
(NSPS) and State Implementation Plans (SIPs). The Acid Rain regulations require
power plants to reduce both SO2 and NOx emissions on a year round basis. The
Page 30 of 71
Docket No. ER11-1844
Exhibit No. NYI-18
Page 31 of 71
NSPS regulations set regulations for new power plants and States develop SIPs to
meet National Ambient Air Quality Standards (NAAQS). In the northeast U. S., the
NAAQS of most concern is the ozone NAAQS. In order to meet the NAAQS, states
in the northeast have developed a summer time NOx Budget Trading Program that
has been in effect for the last three summers.
Short-term impacts on individual unit operation during 2004 summer are more
influenced by the summer time regulations as opposed to annual regulations because
these regulations are more stringent. For the NOx Budget Program, sources may
either install NOx control technologies or buy allowances from sources that have
been overcontrolled. It is possible that fuel switching between oil and gas can be a
problem. Quick start-up of mothballed units is also allowed under the rules.
Overall, it is not expected that EPA rules will have a major impact on electric system
reliability through its environmental programs during 2004 summer. State, provincial
and local environmental rules are expected to have more of an impact on electric
system reliability that is described in more detail by Control Area.
Another environmental impact influencing generation during the past few summers
was water level. Water levels have improved considerably and for 2004 Summer
Operating Period this is not expected to be a significant concern.
The following are the Area assessments discussing environmental related issues.
Maritimes
The Maritimes Area closely monitors air emissions and other environmental
discharges to ensure compliance with standards and limits set forth by Canadian
Federal and Provincial environmental regulations. For the summer 2004 period, there
may be occasions when some units are required to be de-rated in order to meet these
regulations. However, these occasions are expected to be infrequent and of short
duration.
New England
ISO-NE is mindful of environmental restrictions and constraints on New England’s
generating capacity, however it is the responsibility of the resource owners to
monitor their compliance with state or federal standards. In order to mitigate the
impact that these restrictions may have on the availability of generating units within
New England, generator owners are encouraged to pursue temporary waivers to their
environmental permits especially during periods of extreme capacity deficiencies.
In addition, ISO-NE includes discussions on the air emission impacts from the
generating units within the 2003 RTEP report. Results of this analysis illustrate that
air emissions by fossil-fueled generating units are highly dependent upon fuel prices
Page 31 of 71
Docket No. ER11-1844
Exhibit No. NYI-18
Page 32 of 71
(because of prices’ effect on dispatch of such units), but show less correlation with
transmission improvements.
New York
There is a limited possibility that there may be a shortage of available capacity in the
New York City metropolitan area due to environmental constraints. An extended
period of high temperatures and high humidity leading to an unacceptable level of
ozone in the region may limit the allowable dispatch of generation to meet load. In
2001 the NYISO obtained a waiver from the New York State Department of
Environmental Conservation (DEC) to address such an air quality emergency and is
continuing to work with the DEC staff on this concern. Should such a situation arise,
it is incumbent on the NYISO to maximize the availability of generation outside the
effected area and insure that all other steps are taken in accordance with the capacity
emergency procedures (NYISO Emergency Operations Manual). After this the DEC
would allow operation outside of emission limits to avoid curtailment of firm load in
New York.
Ontario
There are many environmental issues that specifically affect the operation of
facilities in Ontario during the Summer Operating Period. Compliance with these
standards is strictly monitored by the facility owner.
Some facilities have annual energy limitations to observe permissible emission
limits. These annual limits are not expected to impact the overall energy and capacity
projections for the Summer Operating Period.
It is also recognized that there is a potential to restrict generation to respect
environmental regulations due to cooling water temperatures etc. The timing and the
overall impact of any restrictions are unpredictable.
Currently it is the facility owner that would request the appropriate authority to
permit a variance from these obligations to assist in a capacity deficiency.
Experience gained in 2002 was utilized to revise procedures where the IMO requests
the facility owner to obtain variances to environmental obligations under emergency
procedures.
Quebec
The bulk of generation in Quebec is hydroelectric based, therefore the environmental
concerns, as they pertain to this report are not of concern.
Page 32 of 71
Docket No. ER11-1844
Exhibit No. NYI-18
Page 33 of 71
Geomagnetically Induced Currents (GICs)
Past experiences have shown the serious effect that geomagnetic disturbances can
have on the NPCC bulk power system. Quasi-DC currents induced in power lines
flow to ground through transformer neutral connections. This can result in saturation
of the transformer core leading to a variety of problems, including increased heating
that has resulted in transformer failures. In addition, the harmonics generated in the
transformer, as a result of the saturation, may produce unanticipated relay operations,
such as sudden tripping of transmission lines or shunt capacitors.
GICs are produced by the magnetic field variations that occur when a mass of
electrically charged particles from a solar coronal mass ejection impacts the earth’s
magnetic field. Because of the low frequency compared to the AC frequency, the
geomagnetically induced currents appear to a transformer as a slowly varying DC
current.
GIC flowing through the transformer winding produces extra magnetization, during
the half-cycles when the AC magnetization is in the same direction this effect can
saturate the core of the transformer. This also results in severe distortion of the AC
waveform with increased harmonic levels that can cause incorrect operation of relays
and other equipment on the system and may lead to problems ranging from trip-outs
of individual lines, transformers or shunt capacitors to collapse of the whole system.
GIC activity correlates to 11-year sunspot cycles. We are presently in Cycle 23,
which began in 1996 and is predicted to end about January 2007. During the portion
of the solar cycle that has greater sunspot activity, there is a higher probability of
GICs occurring, which could impact the NPCC system. Observations of sunspot
activity only provide insights as to the timing of the release of energy; it is the solar
winds that ultimately determine the intensity and duration of a geomagnetic storm and
those areas of the earth that will be ultimately affected. A satellite positioned between
the earth and the sun is capable of determining the intensity of the storm. The timing
between when this satellite senses the magnitude of the storm and when the effects
are noted on the earth is less than 1 hour.
The CO-8 Operations Managers Working Group explored ways to obtain accurate
and timely forecasts of solar magnetic disturbances and the resulting GICs for the
NPCC Control Areas. As a result, NPCC contracted for GIC forecasting services
from Solar Terrestrial Dispatch (STD) for a three-year period that began mid-2003.
Forecast information is provided directly to the control centers in the NPCC Areas.
Activity is now on the declining side of solar cycle 23 and the minimum is predicted
to occur in late 2006 or early January 2007. Even though we are on the declining side
of the solar cycle there were a number of occasions during 2003 and early into 2004
in which STD provided alerts of solar activity that could reach K7 index of intensity
or above. These alerts were provided for May 29, October 28-30, and November 4, 6,
Page 33 of 71
Docket No. ER11-1844
Exhibit No. NYI-18
Page 34 of 71
18-20 of 2003 as well as January 19-20 of 2004. The most significant activity
occurred on October 29, 2003 when intensity reached K9.
The following chart indicates the solar activity up to February 2004.
Monthly updates to this chart and further information can be found at
With regard to expectations from STD of GIC activity during summer 2004 it is
important to emphasize that it is not possible to predict several months in advance the
extreme episodes of activity such as those that occurred during late October 2003.
While we are well on our way toward solar minimum in terms of sunspot counts, the
geomagnetic activity cycle lags the sunspot cycle by several years. As a result, we are
still very close to the maximum (perhaps just beginning to edge down off the
maximum of the geomagnetic activity peak).
The biggest source of enhanced geomagnetic activity will continue to come from
coronal hole-based sources over the next year. Although these sources of activity tend
to be less of a concern, they are still quite capable of producing periods of GIC
activity.
Minor to major geomagnetic storm intervals (K-indices of 5 to 6) will continue to be
possible for several days each month during the summer months. Severe storm
Page 34 of 71
Docket No. ER11-1844
Exhibit No. NYI-18
Page 35 of 71
intervals (K-indices of 7) will also be slightly possible for a few days during the
summer months. Coronal hole-based disturbances rarely produce activity greater than
K-indices of 7. Therefore, it is not expected that many events will exceed K-indices
of 6 or 7, unless there is another burst of unexpected solar activity.
Overall, the summer should be fairly stable, with modestly elevated risks of GIC
activity occurring for a few days approximately once (at most twice) each month
during the summer months. GIC activity should remain confined to mostly weak
levels when it occurs, but may infrequently (if at all, and then probably only briefly)
reach moderate levels in some regions.
If the trend continues (and this is dependent upon whether new coronal holes form
and/or old coronal holes maintain their structure), the last week and/or the first week
of each month during the summer may see elevated levels of geomagnetic activity
due to coronal hole disturbances.
In summary, there is no ability to forecast any significant solar activity in advance of
this summer, it is very possible something could materialize.
The following is a summary of each Area’s experiences of GIC activity through the
recent “high period” in October 2003. The resultant impact observed in the NPCC
Control Areas indicates that the control actions that are in place appear to reasonably
reduce the impact of GIC.
Maritimes
The Maritimes Area did not experience any significant disturbances in 2003 and no
major problems are anticipated for 2004. The Maritimes Area did perform some
limited control actions reducing exports on interconnections. On March 17, 2003
New England reduced imports from the Maritimes due to increased solar activity
(K7). During the period October 29-30, 2003 exports to Hydro Quebec and, internally
on the interconnection between New Brunswick and Nova Scotia were reduced
according to procedures as a precaution due to the solar activity (K7).
The Maritimes Area Operating Procedures are consistent with NPCC Operating
Procedures for GIC activity.
New England
In late October and early November of 2003, the New England Area experienced a
significant amount of solar activity. Although these solar storms did not cause any
major problems within the region, specific actions were taken as a result of the storms
intensity in order to maintain the reliability of the system. Specifically, certain
transmission maintenance outages were called back to service and energy transactions
Page 35 of 71
Docket No. ER11-1844
Exhibit No. NYI-18
Page 36 of 71
with surrounding Control Areas were reduced during several observed Solar Magnetic
Disturbances.
New York
The major solar storm that occurred in late October 2003 did not produce any
perceptible impact on the New York system.
The NYISO System Operations Advisory Subcommittee is investigating the inclusion
of an exclusive contingency set that would incorporate contingencies that have a
higher probability of occurring during high levels of solar activity. The contingency
list would be activated in the NYISO Security Constrained Dispatch program when a
high level of GIC activity is present, and would help to mitigate the potential impact
of these contingencies on the system.
Ontario
Throughout the period extending from 2001 into 2003, no actions beyond those
required by the existing procedures were taken by the IMO. During the period of
elevated GIC forecasts for the October 29 to 30 2003 solar storm period, the IMO
undertook additional actions as indicated within procedures. These actions included
the recall of certain planned transmission outages and the starting of additional units
beyond normal requirements. While the IMO noted minor swings on the real and
reactive power outputs at certain generating stations no specific operations can be
attributed directly to the solar storm.
Quebec
During the summer of 2003, there were three occurrences of GICs. Alerts were
called on May 29th, June 2nd and August 18th. The alerts predicted Kp levels of 7-8
and they actually reached a level of 8 in May and August, and only 6 in June. No
adverse effects on the bulk system were recorded. Maximum voltage asymmetry
recorded was 2 - 53% at the Châteauguay substation at 21h20 on May 29. Some
transfer limitations on the bulk system were imposed but Interconnection capacities
were not affected.
However, it is important to mention that at the end of October 2003, a massive storm
hit the Quebec network as well as its neighbors with a maximum Kp level of 9
observed at 01h14 and at 12h15 on October 29. On the main grid, the 735kV network
having all its lines series-compensated, the effects on the main grid were minor. The
most severe impacts were felt on the Brisay to Tilly 315kV network in the north of
James Bay (1,000 miles north of Montreal), which was not series-compensated. The
maximum voltage asymmetry (7 - 15%) and quantity of even harmonics (9 - 8%)
were both recorded at the Tilly substation where this 315kV subnetwork joins the
Page 36 of 71
Docket No. ER11-1844
Exhibit No. NYI-18
Page 37 of 71
main grid. This brought the voltage to as low as 722kV at Tilly, which is only a minor
violation of the low operating limit of 725kV. No equipment was lost during the
storm that lasted 25 hours. During the two nights, imports from New England to
Quebec on Phase-2 were limited to 200 MW by ISO-NE instead of the scheduled
values between 500 and 600 MW.
Operating Procedures
Detailed NPCC Operating Criteria, Procedures, Guides and Reference Documents
provide the Areas with the necessary material to develop and maintain a concise set
of operating procedures that are relevant to maintaining the security of the Control
Area by observing local operating parameters. Listings and descriptions of the
documents related to operational readiness for the summer months are summarized in
Appendix II.
TFCO is systematically replacing the existing operations-related “B” and “C”
documents by adding the requirement language from these documents to “A”
documents. Over the past few years several Reference Documents had been
developed, which have similar content to the “C” documents and have no requirement
language. TFCO has now agreed to keep the “C” designation for the existing
Procedures. These will be periodically reviewed and updated, as necessary. In
addition, the Reference Documents will be reviewed and re-designated as new “C”
documents. This will be a gradual process.
Since the Reliability Assessment for Summer 2003, the following revisions to NPCC
documentation have occurred:
The C-9 “Monitoring Procedures for Operating Reserve Criteria” and C-12
“Procedures for Shared Activation of Ten Minute Reserve” Documents have been
updated. Modifications had been made to the C-9 Document to make this document
consistent with NERC DCS and with the NPCC A-06 Document (Operating Reserve
Criteria). Modifications made to the C-12 Document addressed counterflows in the
examples and included a number of editorial changes.
It should also be noted that the A-2 Document, “Basic Criteria for Design and
Operation of Interconnected Power Systems” had gone through a review period of
about one and a half years and recently received approval by the Reliability
Coordinating Committee at a March 18, 2004 meeting. This document will still need
to receive approval of the full NPCC membership before it is fully adopted.
To be prepared to deal with the constantly changing conditions on the power system,
NPCC routinely conducts weekly operational planning calls between Reliability
Coordinators to coordinate short-term system operations. NPCC has also refined and
expanded its emergency conference call mechanism to enable operational security
entities in NPCC and neighboring regions to communicate current operating
Page 37 of 71
Docket No. ER11-1844
Exhibit No. NYI-18
Page 38 of 71
conditions and facilitate the procurement of assistance under emergency conditions.
These calls may be initiated upon the request of any Reliability Coordinator and is
coordinated by NPCC Staff. Due to the commercially sensitive real-time nature of
the material discussed, only signatories to the NERC Confidentiality Agreement for
Electric System Security Data may be party to these calls. Eighteen of these
emergency preparedness conference calls were successfully conducted during 2003.
Each Area in NPCC is required under Document C-13, to review its coming twelve-
week capacity margin projection on a weekly basis. This information is
communicated to NPCC for review during the weekly conference operational calls
held in accordance with C-13, “Operational Planning Coordination.” In addition to
this review of twelve-week capacity margin projections, the weekly conference call
discusses operations for the coming ten-day period as well as any information that
may impact operations.
Each Control Area has complemented the NPCC Procedures and Guidelines with
instructions as they apply to their local conditions. The following is a summary of
activity that Areas have taken to ensure that instructions remain current.
Maritimes
The Maritimes Area Operating Procedures are in compliance with the NPCC
Operating Procedures and are supplemented with local procedures.
New England
Since the implementation of the Standard Market Design (SMD) in March 2003,
ISO-NE has placed a considerable amount of effort reviewing and revising as
necessary, New England’s Market Rules and Operating Procedures. New England’s
Operating Procedures are in compliance with the NPCC Operating Procedures and
are supplemented with local procedures.
New York
The NYISO continues to review and refine operating and market processes based on
experience gained through the sustained peak load periods of previous summers. The
positive experience with the initial implementation of the Emergency Demand
Response Program during that period means that program will continue and expand.
Staff will continue the review of Normal and Emergency Operating Procedures to
improve the implementation and usefulness of that and other programs. There
continue to be refinements to the NYISO Market operation based on the experience
gained during peak load period operation, and new products and facilities are being
added.
Page 38 of 71
Docket No. ER11-1844
Exhibit No. NYI-18
Page 39 of 71
Ontario
The IMO continuously reviews and revises all operating procedures to ensure that
they are consistent with both NERC and NPCC requirements as well as with the
Market Rules for Ontario.
As a result of the Blackout in August 2003, specific emphasis was placed on the
review of Reactive Dispatch Procedures and Procedures for Loss of Telemetry.
Throughout the summer operating period, additional NERC Certified System
Operators will be available to supplement Control Room Operations staff as
conditions dictate.
Quebec
In the event of a capacity deficiency, TransEnergie would first ask Hydro-Quebec
Marketing to find additional generation in or out of the Control Area. After this step,
Emergency Operating Procedures, compliant with NERC and NPCC are
implemented.
Operating Procedures in Shoulder Months
The uncertainties associated with weather variability and maintenance overruns in the
spring months can quickly lead to resource shortfalls. Past history has indicated that
resource assessment procedures need special attention during this time frame. As a
result of these capacity shortfalls, many of the Areas have taken actions to prevent a
reoccurrence and are described below.
Maritimes
The Maritimes Area Operating Procedures for the shoulder and summer period are
essentially the same as for the summer of 2003 and no changes are anticipated for the
summer of 2004.
New England
ISO-NE’s Outage Coordination staff has reviewed the proposed maintenance
schedules for generators in the Control Area and, where appropriate, has worked
with the owners to adjust their outages in anticipation of load levels that may be
experienced in the weeks prior to or following the summer peak load exposure
period. However, there is a significant amount of capacity scheduled out-of-service
in May. Since much of the generation on maintenance in May consists of large
Page 39 of 71
Docket No. ER11-1844
Exhibit No. NYI-18
Page 40 of 71
generator outages, a delay in the return to service date of one or two generators could
have a considerable impact on the operable capacity margin projected for June.
New York
NYISO Scheduling staff has reviewed the proposed maintenance outage schedules for
generators in the Control Area and, where appropriate, have worked with the
generator owners to adjust the outage schedules in anticipation of load levels that may
be experienced in the weeks prior to or following the peak load exposure period.
Ontario
As stated above, the IMO performs extensive reviews of reliability procedures on a
regular basis. This includes the procedure for maintaining reserve margins and
rectifying negative margins. These procedures are enforced during the shoulder
months to ensure that the necessary control actions are taken in the appropriate time
frame if needed to ensure that planning obligations are met.
Quebec
The TransÉnergie Operating Procedures are updated on a continuous basis to reflect
changes in the regulations, market rules and local procedures. There is not, however,
any special Operating Procedures in the summer or shoulder months because
TransÉnergie is a winter peaking system.
Load Response Programs
Each Area utilizes various methods of demand management associated with
interruptible loads. In those Areas where market based structures have been
implemented or are evolving there has been a shift in contractual obligations of the
interruptible loads. The move is an attempt to manage load interruption, as a result of
demand exceeding resources, by giving industrial and commercial customers the
ability to respond to price signals in the wholesale electricity marketplace. Many of
these programs are in varying degrees of development. The following is a summary
of current interruptible load programs available or in development to be available for
the summer period in each Area.
Page 40 of 71
Docket No. ER11-1844
Exhibit No. NYI-18
Page 41 of 71
Maritimes
The Maritimes Area is a winter peaking area and does not have any Load Response
Programs. Interruptible and Dispatchable loads are available for use when corrective
action is required within the Control Area.
New England
During times of capacity deficiencies, ISO-NE declares NEPOOL Operating
Procedure No. 4 - Action During a Capacity Deficiency (OP-4) that includes;
interrupting customers within Real-Time Demand and Profiled Response Program,
purchasing emergency energy from the neighboring Control Areas, implementing
voltage reductions, and public appeals for conservation. This emergency operating
procedure provides load relief measures estimated to be between 3,000 to 4,000
MW5.
In addition to load relief measures from OP-4, Enrolling Participants or Demand
Response Providers enrolled in the Real-Time Price Response Program have the
option to voluntarily reduce energy consumption in real-time on the days ISO-NE
activates the program and during the hours specified. ISO-NE typically activates the
Real-Time Price Response Program when hourly Zonal Price are forecasted to be
greater than or equal to $100/MWh.
New York
The NYISO introduced two load response programs for the New York Market in May
2001. The Emergency Demand Response Program (EDRP) is a program in which
Customers would be paid to reduce their consumption by either interrupting load or
switching to emergency standby generation when requested by the NYISO. During
the Summer 2003 period the NYISO did not experience peak conditions that required
activation of the EDRP. However, load response programs were useful to maintain
the balance between generation and load, during the system restoration period
following the August 14, 2003 blackout.
The Emergency Demand Response Program is continuing for Summer 2004, and
NYISO estimates potentially 900 MW of load relief, with 225 MW of that total being
designated as “reliable.” This load relief will be available to support the New York
State power system during capacity emergency periods. This program is in addition
to the relief obtained through the emergency procedures for Operating Reserve Peak
Forecast Shortage (Section 4.4.1 NYISO Emergency Operations Manual) or in
5 This value is based on the NEPOOL OP-4 documents as of February 3, 2004 which can
be found on the ISO-NE website.
Page 41 of 71
Docket No. ER11-1844
Exhibit No. NYI-18
Page 42 of 71
response to the major emergency state (Section 3.2 NYISO Emergency Operations
Manual).
Ontario
Under the IMO-Administered Market, there are about 300 MW of price responsive
loads. A majority of these loads are treated as a resource that will be dispatched off
the system by the IMO once the price of energy in the real time market has exceeded
the bid (to Buy) price submitted by the load. The subject load must then reduce their
demand according to the dispatch instructions or the load will face compliance
proceedings.
In 2002, the IMO instituted an Emergency Demand Response Program to provide
additional demand relief under emergency conditions. The program involves 16
different customer sites with approximately 400 MW of load contracted in this
ancillary service. When requested, the customers would reduce their demand on a
voluntary basis. This demand response program would be implemented just prior to
the interruption of firm load. The effectiveness of the program has been reviewed and
approvals have been received to extend the program beyond the summer of 2004.
Quebec
The Quebec Area is a winter peaking system and does not usually need to resort to
the load response programs during the summer, although, of the 1713 MW of
interruptible power available in winter, 1054 MW could be called on if needed during
the summer.
Communications Systems with Operators and Customers
There is nominally some time lag for control actions to take effect to rectify a
resource deficiency. In the evolving market places there are now many players in
Areas where at one time there were only a few. As a result, simultaneous
communications need to be timely and efficient for multiple resources to respond to
directions by the Reliability Coordinator to quickly mitigate the need for emergency
control actions, including the shedding of load.
Below is a summary of the communication medium that each Area utilizes to
communicate emergency situations with generators, transmitters and customers.
Maritimes
The individual Control Centers within the Maritimes Area provide timely and
accurate information regarding the status of the power system to customers via
websites, news releases, high volume Interactive Voice Response System and
Page 42 of 71
Docket No. ER11-1844
Exhibit No. NYI-18
Page 43 of 71
telephone contact through Public Affairs and Customer Services departments or Call
Centers.
New England
In the event of a capacity deficiency, ISO-NE’s website provides real-time
information to stakeholders and the general public regarding the status of the power
system and the amount of Emergency Energy Transactions requested during peak
periods. In addition, Control Room operations will convey the necessary
information to ISO-NE’s Customer Service and Corporate Communications
Departments so that they can make the necessary communications to federal and
state regulatory agencies and the media. Operations personnel convey the details of
any capacity deficiency to the Satellite Control Centers and neighboring Control
Areas as appropriate.
In addition, ISO-NE creates a seven-day forecast that is posted to the ISO-NE web
site. This posting includes a capacity analysis for the peak hour of each day,
detailing the forecasted amount of surplus/deficient capacity for each future day to
illustrate anticipated system conditions.
New York
The NYISO is continuing implementation of its Inter-Control Center
Communications Protocol communications system (ICCP) allowing bi-directional
data communication directly from the NYISO control center systems to the
generating plants. In normal operation this facilitates the transmitting of schedules
and base-points from the NYISO dispatch system to the generators, and improves the
accuracy and timeliness of generator real and reactive power metering.
The NYISO website now displays information including actual Control Area load in
addition to the real-time zonal pricing information and transmission outage schedules.
Market Participants may also access a “dispatcher notes” page that provides
information on current NYISO system operating conditions.
Ontario
On a daily and weekly basis the IMO issues Security and Adequacy Assessments
(SAA). These supply the Market Participants with detailed adequacy projections on
an hourly resolution for a period of 14 days into the future and on a weekly
resolution for the following two weeks.
The IMO also publishes to Market Participants a System Status Report (SSR) three
times daily by Market Forecasts and Integration during the pre-dispatch period
outlining deviations from the SAA published for days one and two.
Page 43 of 71
Docket No. ER11-1844
Exhibit No. NYI-18
Page 44 of 71
The SSR has capability to identify to Market Participants the following Advisories:
Major Change Advisory, System Advisory and, System Emergency Advisory.
To address global adequacy concerns when there is insufficient energy or capacity
available to the IMO-controlled grid or when there are insufficient offers in the real-
time dispatch of the IMO-administered markets, the IMO shift staff can also issue a
SSR. The SSR can be prepared on very short notice. A notice is sent to Market
Participants via their dispatch workstations notifying them that a new SSR has been
issued with the details of the SSR being published to the IMO Public Web site.
To address local area adequacy concerns, the IMO will direct Market Participants to
submit offers, either via the Market Participant's dispatch workstation or telephone.
During the summer of 2004 the IMO will be introducing Multi Interval Optimization
into the dispatch process. A benefit of this enhancement to the dispatch process is
that Market Participants will now receive, in addition to actual dispatch instructions
for the next interval, a dispatch advisory that will project out in time the potential
dispatch requirements.
While the phone systems and associated infrastructure worked adequately during the
blackout of 2003, the IMO recognized a number of areas of improvement. At the
time of the blackout a Request for Proposal (RFP) was in place to replace the IMO
phone system. This RFP was subsequently revised to include additional
requirements, and the upgraded phone system will be in place prior to the summer
operating period.
The IMO also recognizes the need to communicate with the general public at times
when there might be supply shortfalls. To achieve this, the IMO created a public
communications process to ensure that consumers and industries in the general
public were given all the information they need to make informed choices. This
process for communicating to the general public on resource issues proved to be an
effective tool in 2003 for managing the resource shortfalls during the post blackout
period. On April 1, 2004 the IMO corporate web site was revised with a number of
enhancements. One of the enhancements will be placing an increased emphasis on
resource adequacy issues by placing postings in a more prominent manner.
Quebec
To satisfy demands in Quebec, TransÉnergie solicits additional capacity requirements
it may need through Hydro Quebec Marketing (HQM). If HQM cannot secure the
additional capacity required or there is not sufficient time to fulfill the need identified,
TransÉnergie would take actions including the securing of emergency energy from
neighboring systems, cutting of available interruptible loads and instituting voltage
reductions. If these measures are deemed to be insufficient and there is adequate time
Page 44 of 71
Docket No. ER11-1844
Exhibit No. NYI-18
Page 45 of 71
a public appeal would be instituted through commercial media. The probability of
resorting to these measures during the summer is very low.
Acquisition of Emergency Energy between Areas
In May of 2000, the NPCC Task Force on the Coordination of Operation adopted a
Memorandum of Understanding for NPCC Area Emergency Assistance. This
document outlines the steps to be taken when there is either a forecast or actual
shortage of operating reserves. The objective of the process is to maximize the
reliance on the marketplace to resolve resource inadequacies, minimizing the need for
emergency transactions between Areas.
While all Areas are resolved to let the marketplace solve such inadequacies, there
may be occasions where market forces cannot respond in the appropriate manner or
time frame. The following is a summary of ability to transact emergency energy
between adjacent Areas.
Maritimes
The Maritimes Area, through existing agreements with neighboring Control Areas,
namely, ISO-NE and Trans-Energie, has established procedures for the acquisition of
emergency energy.
New England
When the NEPOOL Control Area experiences or is forecasted to experience a
shortage of operating capacity, ISO-NE will request NEPOOL Participants to submit
Emergency Energy Transactions (EETs) through the NEPOOL Market System.
Through this bid based energy market, procedures are in place to determine the
availability of the emergency assistance from its neighboring Control Areas when
necessary.
New York
During 2002, the NYISO completed the process to review and update the emergency
energy provisions in the interconnection agreements with the Control Areas
neighboring New York.
Ontario
The IMO negotiated new operating agreements with the adjacent Reliability
Authorities in 2002 as part of the steps to the new Market. These operating
agreements contain provisions for the transaction of emergency energy into and out of
Page 45 of 71
Docket No. ER11-1844
Exhibit No. NYI-18
Page 46 of 71
Ontario and are only implemented in the event that market based solutions are
ineffective.
Quebec
TransÉnergie has agreements with all the Control Areas neighboring Quebec that
detail the conditions and procedures for acquiring emergency energy.
Training Programs
The Control Area operators routinely receive training as a regular part of their
regime.
NPCC will be conducting a dispatcher and schedulers seminar in Toronto on May 5
and 6, 2004, for dispatchers and schedulers from each of the Control Areas in NPCC
to share views and experiences. It is also a presentation vehicle for issues of concern
to all NPCC Area operations staff. The keynote topic for the shift operations staff
will be a through review of NPCC Inter-Control Area Restoration Coordination
including a table top exercise. The seminar will also include the summer outlook for
each Area, a summary of recent events within the industry and NPCC, developments
coming from NERC, an update on NPCC policy and procedures, and a review of
recent events in the industry. The schedulers in attendance will review the intricacies
of their system and the impact of other areas on their system.
The agenda and seminar are developed by the NPCC CO-2 Working Group on
Dispatcher Training, in conjunction with CO-8 System Operations Managers. The
agenda for the scheduler's sessions is developed by an ad hoc group of Scheduling
staff at the various areas also under the auspices of CO-8.
Maritimes
The Member companies that comprise the Maritimes Area routinely conduct their
own operator training sessions and participate in NPCC Operators training seminars.
Only the operators in the New Brunswick Power Control Center are required to be
certified by NERC, although other operators have received certification. The
Maritimes Area participates in the CO-2 Dispatcher Training Working Group.
New England
Throughout the year, ISO-NE Operators and satellite control center personnel
participate in training session in preparation for both the summer and winter peak
load periods. During the training sessions, applicable NPCC procedures and
NEPOOL emergency operating procedures are reviewed in detail. The summer
capacity assessment is also reviewed as well as area-specific voltage control issues
Page 46 of 71
Docket No. ER11-1844
Exhibit No. NYI-18
Page 47 of 71
and intra-area communication procedures. The NERC certification program at ISO-
NE is a NERC accredited training program.
New York
NYISO Dispatcher Training staff will be conducting two weeks of in-house training
for each crew of NYISO dispatchers prior to the summer of 2004. The training
includes detailed review of the August 14, 2003 blackout, NERC and NPCC issues
affected operations, full-scale system simulation emergency exercises, and
acclimation to the upcoming hardware and software replacement of the NYISO EMS
(SMD2).
NYISO Dispatcher Training staff will also present one week System Operator
Training Seminars (SOTS) for a combined audience of the NYISO and New York
Transmission Owner (TO) dispatcher crews. The topics addressed include an update
on the NYISO EMS/Market tools replacement, back-up dispatch, restoration
exercises, review of major emergencies, review of operating policies, update on the
August 14, 2003 blackout and restoration, system protection, effects of GIC, regional
issues, the summer outlook and a NYISO/industry update.
Single crews will participate in a statewide Restoration Drill and an Alternate Control
Center Drill.
The combination of In-House Training, simulation and SOTS will meet the NERC
Board of Trustees Blackout Recommendation #6 requirement for training prior to
June 30, 2004.
Ontario
The IMO continuously operates a training program to ensure that the control room
staff maintains awareness of current and new NERC, NPCC and local operating
procedures.
In preparation for the summer operating period, the IMO has set aside time in the
training program for Shift Operations staff to review results of the IMO summer
capability assessment, review reactive dispatching techniques as well as, a review of
the changes to emergency procedures.
Ontario will also adhere to the training recommendation set out in the NERC Board
of Trustees Recommendations on the August 14, 2003 Blackout.
Additionally, the IMO plans and participates in drills and exercises on a regular basis
to hone emergency preparedness skills and test procedures by simulating real events.
On November 26, 2003 the IMO led the annual integrated power system restoration
exercise to enhance and improve the response capabilities of the IMO, Market
Page 47 of 71
Docket No. ER11-1844
Exhibit No. NYI-18
Page 48 of 71
Participants and Emergency Response organization during emergency situations.
Exercise 2003 successfully met all objectives through a comprehensive simulated
power system restoration of northern Ontario. The Exercise involved the shift
operations from the IMO and 23 other organizations. These included nine major
Distributors, two Transmitters, ten Connected Wholesale Customers operating from
15 different sites, the Ministry of Energy, Emergency Management Ontario, and
seven Generators operating from 14 different sites.
Lastly, each shift at the IMO will perform a Rotational Load Shedding simulation
exercise prior to the summer operating market commencement. This exercise will
test procedures and training as well as verify communication methodologies and
validate revised load shedding schedules.
Quebec
Aside from continually on-going training of the operations personnel, there are
monthly and seasonal meetings where anticipated conditions are discussed and new
procedures are explained.
Page 48 of 71
Docket No. ER11-1844
Exhibit No. NYI-18
Page 49 of 71
8. Impact of NERC Blackout Recommendations
The Blackout of August 14, 2003 has had repercussion throughout the industry. The
NPCC Area was hardest hit and, as a result, is particularly sensitive to ensure that
actions are taken to prevent a reoccurrence.
To this end, NPCC has formed a Blackout Investigation Team (BIT). The NPCC-
BIT provides oversight and monitoring of the activities of the NPCC Areas and the
various Working Groups and Task Forces within NPCC to ensure that any near term
operations related actions are completed prior to the summer of 2004. It is not
intended for this report to provide a detailed account of the activities of this team.
However, the CO-12 Working Group noted that there are three areas that deserve
specific recognition in this report.
These are:
• Situational Awareness (By the Reliability Coordinator of events beyond the
Reliability Coordinator Boundaries)
• Reactive Burden on the Power System
• Communication between Reliability Coordinators (RC) and Control Areas
Prior to the blackout, each RC in NPCC and PJM had access to power system data
from beyond their boundaries. As a result of the blackout, New England, New York
and Ontario are reviewing the interconnection data they receive, requesting
additional telemetered data points from neighbouring interconnections and beyond,
making this data readily accessible to the operations staff and providing the data in
an easy to assimilate format. Each Area expects to have this work completed prior to
the summer operating period.
During the month of April NERC-sponsored teams conducted reliability readiness
audits of the IMO, NYISO, and ISO-NE. This included an on-site review of policies,
procedures, facilities of each of these Control Area and Reliability Coordinator
functions at each location. The teams also interviewed management, supervisory,
and control center staff. Reports and findings are expected in May.
With respect to reactive burden to the power system, NPCC Document B3 -
Guidelines for Inter-AREA Voltage Control provides general principles and guidance
for effective inter-Area voltage control within NPCC. The procedure recognizes
local control actions as the most effective method for voltage regulation, along with
outlining steps to be taken when an area becomes deficient in reactive resources.
While each Area is committed to reactive dispatching methodologies that will ensure
compliance to this procedure, the TFCO at its March 4, 2004 meeting, took an action
to review the procedure, and each Areas conformance prior to the Summer Operating
Period.
Page 49 of 71
Docket No. ER11-1844
Exhibit No. NYI-18
Page 50 of 71
Section 7 of this report outlines all Areas operational readiness to communicate with
their customers quickly and take required actions needed to mitigate the need for
emergency control actions. Communication between NPCC Areas benefited from the
significant capacity deficiencies experienced by NPCC members in recent years by
the development of well defined communication protocols to deal with emerging
issues such as forecast and real-time energy and capacity deficiencies. These
communication protocols have evolved and are now well defined and understood by
all operations staff.
The PJM operations staff is in frequent communication with neighboring systems to
the south and west and also has a close working relationship with NYISO.
These Inter-Region communication protocols have proven to be effective as was
demonstrated during the restoration efforts of August 14, 2003 and the subsequent
capacity deficiencies experienced by Ontario and NYISO in the following days.
The NERC Board of Trustees (BoT) approved a set of 14 recommendations to
prevent and mitigate the impacts of future blackouts in February of 2004. Specific to
the recommendations were remedial actions to be completed by June 30, 2004 along
with associated readiness audits of PJM, MISO and First Energy.
The NERC BoT recommendations also outlined specific “reliability readiness”
audits of Control Areas and Reliability Coordinators in the Eastern Interconnection
to6 be performed to ensure these Reliability Coordinators and Control Areas can
perform well, particularly under emergency conditions, and to strive for excellence
in their assigned reliability functions and responsibilities.
The PJM, MISO and First Energy Audits were completed by the end of February and
the results were presented at the NERC:OC meeting in March. NERC:OC accepted
the Audit Reports for each of these entities, subject to completion of any outstanding
actions identified. The Control Area Audits will be completed by the end of April
with results known by late June.
PJM and MISO formulated remedial action plans to address BoT Blackout
Recommendations specific to their Reliability Areas. The action plans were reviewed
and approved at the March NERC:OC meeting with a requirement to have all tasks
outlined in the plan verified as completed by June 30, 2004.
Synopses of the plans are as follows:
PJM
• Significant effort is being placed on improving communications with MISO. A
Joint Operating Agreement (JOA) that is close to execution will detail a number
6 ISO-NE, NYISO, IMO, AEP, MECS, Cinergy and LG&E
Page 50 of 71
Docket No. ER11-1844
Exhibit No. NYI-18
Page 51 of 71
of processes where MISO and PJM will exchange data, respect limits in
operation, and communicate status with each other to ensure that each
organization is fully informed. Upon approval, the JOA will set a new standard in
communications and coordination between RCs.
• Improve Operator and Reliability Coordinator Training - The recent NERC Audit
found PJM’s Operator/RC training to be high quality. PJM’s use of realistic
simulators as well as a comprehensive training program ensures that the PJM
Operations team is capable of rapidly responding to any emergency.
• Evaluate Reactive Power and Voltage Control Practices - PJM’s On-line Reactive
Transfer Monitoring continues to set the standard for advanced applications.
With the expansion of the PJM EMS Model to now include AEP, DPL, and
ComEd and beyond this wide area capability is further enhanced. PJM has started
work on the joint development and monitoring of critical reactive interfaces near
our various seams.
• Detailed protocols currently being drafted include - Outage Coordination,
Emergency Operations, and Restoration - Ensure that emergency action plans and
procedures are in place to safeguard the system under emergency conditions by
defining actions operators may take to arrest disturbances and prevent cascading.
MISO
• The state estimator has been fully tested and was implemented on December 31,
2003. A new System Topology processor that will display each topology change
by exception without any delay, and capable of running independent of the state
estimator will be in service by June 30, 2004.
• Several wide area overviews of both the MISO footprint and beyond were
implemented on December 31, 2003. The overviews allow the system operator to
narrow the field of view and zero in on smaller segments of the system.
• Prior to June 30, 2004 all MISO operators will have completed the mandatory five
days of system emergency training. The training will include regional / sub
regional restoration drills, table-top drills with MISO and member company staff,
and operations simulator training on a range of emergency conditions.
• Communication protocols have been reevaluated and improved along with
associated procedures for emergency response and conservative operating.
Neighbouring Reliability Coordinators (including the IMO) now receive a copy of
MISO's Next-day and current day security analysis.
• A review of agreements with all entities that MISO performs Reliability
Coordination Services for has been undertaken.
Page 51 of 71
Docket No. ER11-1844
Exhibit No. NYI-18
Page 52 of 71
9. 2003 Post-Seasonal Assessment and Historical Review
The following summarizes some highlights of the review. Please refer to the NPCC
Reliability Assessment for Summer 2003 for details on projections.
Maritimes
The peak load experienced by the Maritimes Area during the May - September
period was 3,902 MW, which was approximately 88 MW (2.3%) higher than last
year’s forecast of 3,813 MW. This is due to the peak occurring in May while
experiencing below normal temperatures. This resulted in a greater electric heating
load than would normally be the case.
The Maritimes Area did not anticipate, nor did it experience, any capacity shortages
during the summer of
2003. In fact, it was able to supply up to
700 MW
(interconnection limit) to New England. However, transmission constraints due to
excess generation in Northern New England sometimes reduced the power that could
be transmitted.
New England
The peak demand for the summer of 2003 was 24,685 MW and occurred hour ending
15:00 on August 22. This was 663 MW less than the all time summer peak demand
of 25,348 MW that was experienced during the summer of 2002.
Overall, the weather during the 2003 summer was mild. Although it was a relatively
humid summer, the ambient temperature only approached 90degrees Fahrenheit (32
degrees Celsius) towards the end of June and again at the end of August. Because of
the mild weather, no extreme peaks were experienced.
NEPOOL Operating Procedure No. 4 - Action During a Capacity Deficiency (OP-4)
was called once during the summer of 2003. These actions were only required
within the state of Connecticut in an effort to aid in the system restoration following
the August 14 blackout.
All of the new generation projects that had been expected to become commercial
during the summer 2003 were in-service and participating in New England’s energy
market in time for the summer peak. Drought conditions did not have a significant
effect on operations.
Page 52 of 71
Docket No. ER11-1844
Exhibit No. NYI-18
Page 53 of 71
New York
The New York Control Area did not experience temperatures associated with design
conditions during the summer of 2003, and therefore did not realize the forecast peak
of 31,430 MW. The summer 2003 NYISO peak load of 30,333 MW occurred on
June 26.
Ontario
The peak demand for the summer of 2003 was 24,753 MW and occurred on June 26,
2003. The date of the summer peak is reflective of the milder weather experienced in
Ontario through most of July, compounded by the affects of the blackout that
occurred on August 14, 2003. Had a request for conservation due to resource
concerns not been issued, it is likely that the summer peak would have been set
during the week following the blackout.
The following charts indicate the correlation of weather experienced during the
summer on the resultant demands by displaying the average weekly temperature in
Toronto for the summer of 2003 as compared to the historical average weekly
temperature and the number of days the maximum daily temperature exceeded the
historical average maximum.
Page 53 of 71
Docket No. ER11-1844
Exhibit No. NYI-18
Page 54 of 71
Weekly Average Temperature Summer 2003
25
23
21
19
17
15
2003 Average Weekly Temperature
Historical Average Weekly Temperature
13
11
9
Week Beginning
May
June
July
August
September
Days Max
Historical
11.8
23.6
30.1
28.8
16.7
Temperature
2003
6
22
30
31
22
above 20oc
Days Max
Historical
0.43
2.3
5.7
3.2
0.8
Temperature
2003
0
4
4
6
0
above 30oc
The following chart shows the actual Ontario hourly peak demands for each week
against the demand curves forecasted in the NPPC Reliability Assessment for
Summer 2003. It can be noted that the lower demands in July are consistent with the
temperatures experienced.
Page 54 of 71
Docket No. ER11-1844
Exhibit No. NYI-18
Page 55 of 71
26,000
Demands Actuals vs Expected
25,000
24,000
23,000
22,000
21,000
20,000
Weather Normal
1 LFU
Weather Extreme
2003 Actuals
Emergency Operation
19,000
Post Blackout
18,000
Week Beginning
Monthly Peak Hourly Demand for Ontario for 2003
Month
Date
HE
Hourly Demand
(MW)
May
5
17
18,741
June
26
16
24,753
July
4
13
23,175
August
14
15
23,891
September
11
16
20,700
After excluding the events associated with August 14, the demands were met without
use of any extraordinary control actions beyond the issuance of Energy Emergency
Alerts (EEA). The IMO issued EEA 1 notifications on 8 days through the summer
and proceeded to an EEA 2 on 1 day. Almost all notifications were attributed to a
sudden loss of resources within the day and not an overall adequacy concern.
Quebec
The Quebec summer peak load was 20,551 MW on June 26 2003, which is about 200
MW below the expected peak. A late winter peak of 21,813 MW occurred on May 2
with temperatures at or near the freezing point all over the province. The summer of
2003 was quite uneventful with no significant things to report as far as forced
outages, weather conditions, forest fires, etc…
Historical Review (Pre-2003)
The previous non-coincident peaks for each NPCC Area, the forecasted 2004 summer
peak for each NPCC Area and the NPCC Coincident peak for 2004 are summarized
in the table below.
Page 55 of 71
Docket No. ER11-1844
Exhibit No. NYI-18
Page 56 of 71
Table 1
Historical Peak Demands by Area Occurring May to September (MW)
Total
New
New
Year
Ontario7
Maritimes
Quebec
NPCC
England
York
Demand
1993
20,883
2,773
19,570
25,998
17,500
86,724
1994
20,918
2,797
20,519
27,062
17,562
88,858
1995
21,674
2,958
20,499
27,206
17,960
90,297
1996
21,378
2,937
19,507
25,587
18,193
87,602
1997
21,613
3,252
20,569
28,700
17,983
92,117
1998
22,443
3,314
21,406
28,166
18,463
93,792
1999
23,435
3,249
22,544
30,311
18,965
98,504
2000
23,222
3,630
22,049
28,138
20,600
97,639
2001
25,269
3,640
24,967
30,983
20,052
104,911
2002
25,414
3,731
25,348
30,664
20,525
105,764
2003
23,684
3,813
25,120
31,430
20,740
104,436
Forecast
2003 Actual
24,753
3,902
24,685
30,333
20,551
104,223
2004
23,6688
3,922
25,735
31,800
21,517
104,5209
Forecast
Percent
-..44%11
0.54%
+4.25%
+4.84%
+4.7%
+.28%
Difference10
7 20 minute Peak Demand 1993 to 2001, peak hourly demand thereafter
8 This value is the weather normal demand used for the base case analysis. A graph in
Section 4 represents the ranges of potential demands that the IMO could experience as a
result of weather variables.
9 Forecast NPCC Coincident Peak Demand, not the sum of each individual Areas
Forecasted Peak Demand.
10 Percent Change reflects the increase/decrease in projected peak for the 2004 Summer
Operating Period over the actual peak for the 2003 summer.
11 Based on the extreme weather case, the IMO could experience a peak of 26,430, which
represents an increase of 6.77% over the 2003 actual. This would translate into an NPCC
Coincident Peak Demand of 107,282 MW for a 2.94 % increase over 2003.
Page 56 of 71
Docket No. ER11-1844
Exhibit No. NYI-18
Page 57 of 71
10. 2004 Reliability Assessments of Neighboring Regions
East Central Area Reliability Coordination Agreement (ECAR)
Information from the ECAR 2004 Summer Assessment of Load and Capacity is not
available for release at this time pending review and approval of the ECAR members.
The following information is taken from the “Preview of 2004 Summer Conditions”
that is contained in ECAR’s 2003/2004 Winter Assessment of Load and Capacity.
The projected summer peak demand in ECAR for the summer of 2004 is 102,724
MW for Total Internal Demand. This 2004 summer peak is derived from demand
forecasts received in January 2003 with any updates through August 2003. Therefore,
actual operating experience from the last half of 2003 was not considered in
developing this peak demand forecast.
Total capacity for the summer of 2004 is projected to be 127,115 MW. This assumes
1,420 MW of announced capacity additions within the ECAR region are in service by
July 2004. Net scheduled interchange into the ECAR region at the time of the peak is
anticipated to be 2,337 MW, making total Capacity Resources of 129,452 MW.
Capacity Margins for the summer of 2004 are forecast to be slightly higher than the
margins forecast for the summer of 2003, based on the level of announced generation
projects. The capacity margin based on Total Internal Demand (interruptible and
direct control loads are served) and scheduled interchange is 26,728 MW (20.6% of
Net Capacity Resources). This assumes the announced capacity additions within the
ECAR region are in service by July 2004.
Recent experience indicates that a minimal amount of capacity (1,197 MW) is
expected to be scheduled out of service during the summer peak. This scheduled
capacity outage along with a 4% operating reserve requirement (4,109 MW) means
that the Margin for Contingencies is expected to be 21,422 MW at the time of the
ECAR peak. Recent random outage experience suggests that there is less than a 1%
probability that random outages will exceed this Margin for Contingencies. This is
the probability that the ECAR members will have to rely on supplemental capacity
resources at the time of the peak. Supplemental capacity resources can include
additional imports of power from outside the region, and/or the curtailment of
contractually interruptible loads.
Under a severe condition scenario which assumes a combination of adverse
conditions, (an additional 5% of load due to extreme hot weather, none of the
projected capacity additions in service, and greater than 14% unavailable capacity),
the ECAR Region will not have sufficient resources without supplemental power
purchases. However, based on the import capability, there should be sufficient
resources for this severe condition scenario.
Page 57 of 71
Docket No. ER11-1844
Exhibit No. NYI-18
Page 58 of 71
Transmission assessment information is contained in the 2004 Summer Assessment
of Transmission System Performance, ECAR report 04-TSPP-3. This report will be
published in mid-May 2004.
The bulk transmission systems in ECAR are expected to perform reliably under a
wide range of conditions. However, there will be a greater need for the Reliability
Coordinators and Transmission Operators to communicate and coordinate their
actions to preserve the continued reliability of the ECAR systems. It is anticipated
that the ECAR transmission systems could become constrained as a result of unit
unavailability and/or economic transactions that have historically resulted in large
unanticipated power flows within and through the ECAR systems. If these conditions
occur again this summer, local operating procedures, as well as the NERC
Transmission Loading Relief procedure, will need to be invoked in order to maintain
transmission system security. As long as transmission limitations are identified and
available operating procedures are implemented when required, the ECAR bulk
transmission systems are anticipated to perform reliably. During times of heavy
regional and interregional transfers, it will be essential that Reliability Coordinators
and Transmission Operators have timely and adequate information on the sources and
sinks of scheduled transfers in order to identify appropriate corrective actions.
Page 58 of 71
Docket No. ER11-1844
Exhibit No. NYI-18
Page 59 of 71
Mid-Atlantic Area Council (MAAC)
The MAAC 2004 summer forecast net peak demand is 56,201 MW. This forecast
includes the effects of interruptible demand and load management capabilities, which are
estimated to be 1,129 MW. The forecast peak assumes normal summer weather
conditions. This forecast is 632 MW higher than the actual MAAC all-time summer peak
of 55,569 MW that occurred on August 14, 2002.
Between June 1, 2003 and mid-July 2004, MAAC’s summer generating capacity is
expected to increase by a net of 5,020 MW to 68,903 MW. 1,459 MW of the expected
increase is already in service. All nuclear units should be in service and at full capacity
(13,320 MW) at the time of the peak. MAAC also has 488 MW of external capacity
resources under contract through the summer peak period. With the planned new
generation, existing internal generation, and external capacity resources included, the
MAAC capacity margin is forecasted to be 19.0% at the time of the forecasted peak.
The MAAC reserve margin is expected to be 23.5% at the time of the forecasted peak.
MAAC expects to have sufficient generating capacity to serve the 2004 forecast summer
peak demand. When MAAC served its all-time summer peak on August 14, 2002 no
emergency procedures were implemented.
MAAC has a net of 1,979 MW of long-term firm transmission service in place for energy
sales out of MAAC through the summer peak period. Presently, these transactions are
not capacity backed and therefore can be curtailed in the event of a PJM Capacity
Emergency. Historically, approximately 1,200 MW of external capacity has been
transferred out of MAAC on peak summer days and could therefore decrease the capacity
margin by 1.4%.
PJM, the Regional Transmission Organization (RTO) for the MAAC region, is well
prepared for operating emergencies should they occur. PJM's certified operating staff are
trained and participate in regular emergency drills that include the criteria for declaring
emergencies, prioritized action plans, staffing and responsibilities in preparation should
there be an extremely hot summer.
The bulk transmission system is expected to perform adequately over various system
conditions.
Page 59 of 71
Docket No. ER11-1844
Exhibit No. NYI-18
Page 60 of 71
Appendix I - 2004 Expected Load and Capacity Forecasts
Table 1 - NPCC Summary
Updated -April 19, 2004
Week
Installed
Firm
Firm
Total
Load
Interruptible
Known
Req. Operating
Unplanned
Net
Bottled
Revised
Beginning
Capacity
Purchases
Sales
Capacity
Forecast
Load
Maint./Derat.
Reserve
Outages
Margin
Resources
Net Margin
Sundays
MW
MW1
MW2
MW
MW
MW
MW
MW
MW
MW
MW
MW
02-May-04
145,839
36
176
145,699
86,908
2,342
23,752
7,006
9,860
20,515
3,219
17,296
09-May-04
145,999
36
176
145,859
89,129
2,342
23,323
7,006
9,860
18,884
3,102
15,782
16-May-04
145,835
36
176
145,695
90,018
2,342
21,726
7,006
9,862
19,426
3,919
15,507
23-May-04
144,819
36
176
144,679
92,119
2,342
18,862
7,006
9,862
19,173
1,983
17,190
30-May-04
142,458
36
176
142,318
94,411
2,316
19,097
7,006
9,862
14,259
1,676
12,583
06-Jun-04
142,598
36
176
142,458
99,482
2,316
14,992
7,229
9,262
13,810
2,863
10,947
13-Jun-04
142,598
36
176
142,458
101,073
2,316
13,379
7,229
9,262
13,832
3,648
10,184
20-Jun-04
142,598
36
176
142,458
101,370
2,316
12,659
7,229
9,262
14,255
4,243
10,011
27-Jun-04
143,763
36
176
143,623
103,952
2,316
11,728
7,229
9,262
13,769
4,936
8,832
04-Jul-04
143,810
36
176
143,670
104,520
2,339
11,320
7,229
8,562
14,379
4,388
9,990
11-Jul-04
143,980
36
176
143,840
104,435
2,339
11,597
7,229
8,562
14,357
3,865
10,491
18-Jul-04
143,480
36
176
143,340
103,845
2,339
10,427
7,229
8,562
15,617
5,101
10,515
25-Jul-04
143,381
36
176
143,241
103,260
2,339
10,222
7,229
8,562
16,307
5,396
10,911
01-Aug-04
143,739
36
176
143,599
104,185
2,347
11,321
7,229
8,562
14,650
4,003
10,646
08-Aug-04
143,909
36
176
143,769
104,236
2,347
11,575
7,229
8,562
14,515
3,680
10,835
15-Aug-04
143,909
36
176
143,769
103,946
2,347
11,863
7,229
8,562
14,517
3,498
11,018
22-Aug-04
143,909
36
176
143,769
104,207
2,347
12,300
7,229
8,562
13,819
3,613
10,206
29-Aug-04
143,317
36
176
143,177
102,751
2,322
14,865
7,229
8,562
12,093
2,641
9,451
05-Sep-04
143,422
36
176
143,282
95,922
2,333
15,320
7,229
8,562
18,584
3,591
14,993
12-Sep-04
144,162
36
176
144,022
92,874
2,333
16,607
7,229
8,562
21,085
3,157
17,927
19-Sep-04
144,162
36
176
144,022
91,389
2,333
20,321
7,229
8,562
18,856
3,555
15,300
26-Sep-04
144,162
36
176
144,022
90,913
2,333
20,850
7,229
8,562
18,802
3,184
15,618
Notes
1. Firm Purchases represent firm purchases from entities external to NPCC to be delivered at the PJM / NY interface
2 Firm Sales represent firm sales to entities external to NPCC to be delivered at the PJM / NY interface
Page 60 of 71
Docket No. ER11-1844
Exhibit No. NYI-18
Page 61 of 71
Table 2 - Maritimes
Revised
19-Mar-04
Week
Installed
Total
Load
Interruptible
Known
Req.
Unplanned
Net
Operating
Beginning
Capacity
Purchases
Sales
Capacity
Forecast
Load
Maint./Derat
Reserve
Outages
Margin
Sundays
MW
MW
MW
MW
MW
MW
MW
MW
MW
MW
02-May-04
6,172
0
200
5,972
3,922
506
1,441
626
263
226
09-May-04
6,172
0
200
5,972
3,863
506
1,441
626
263
286
16-May-04
6,172
0
200
5,972
3,790
506
1,333
626
265
465
23-May-04
6,172
0
200
5,972
3,728
506
1,331
626
265
529
30-May-04
6,172
0
200
5,972
3,633
480
1,439
626
265
490
06-Jun-04
6,172
0
200
5,972
3,604
480
1,001
849
265
734
13-Jun-04
6,172
0
200
5,972
3,592
480
1,312
849
265
435
20-Jun-04
6,172
0
200
5,972
3,530
480
1,171
849
265
637
27-Jun-04
6,172
0
200
5,972
3,522
480
940
849
265
876
04-Jul-04
6,172
0
200
5,972
3,529
503
904
849
265
928
11-Jul-04
6,172
0
200
5,972
3,571
503
842
849
265
948
18-Jul-04
6,172
0
200
5,972
3,516
503
842
849
265
1,003
25-Jul-04
6,172
0
200
5,972
3,530
503
825
849
265
1,006
01-Aug-04
6,172
0
200
5,972
3,557
511
666
849
265
1,146
08-Aug-04
6,172
0
200
5,972
3,560
511
816
849
265
994
15-Aug-04
6,172
0
200
5,972
3,474
511
816
849
265
1,079
22-Aug-04
6,172
0
200
5,972
3,405
511
816
849
265
1,149
29-Aug-04
6,172
0
200
5,972
3,351
486
1,137
849
265
856
05-Sep-04
6,172
0
200
5,972
3,333
497
808
849
265
1,216
12-Sep-04
6,172
0
200
5,972
3,410
497
933
849
265
1,013
19-Sep-04
6,172
0
200
5,972
3,508
497
808
849
265
1,040
26-Sep-04
6,172
0
200
5,972
3,640
497
976
849
265
740
Notes
1. Installed capacity includes capacity associated with IPPs.
2. Load forecast is expected weekly peak.
Please note that the information on this page is commercially sensitive, therefore confidential.
Page 61 of 71
Docket No. ER11-1844
Exhibit No. NYI-18
Page 62 of 71
Table 3—New England
Week
Installed
Total
Load
Known
Req.
Unplanned
Net
Interruptible
Operating
Beginning
Capacity
Purchases
Sales
Capacity
Forecast
Load
Maint./Derat.
Reserve
Outages
Margin
Sundays
MW
MW
MW
MW
MW
MW
MW
MW
MW
MW
02-May-04
33,434
452
0
33,886
17,330
482
3,900
1,700
3,400
8,038
09-May-04
33,434
452
0
33,886
19,443
482
4,500
1,700
3,400
5,325
16-May-04
33,434
452
0
33,886
20,346
482
4,600
1,700
3,400
4,322
23-May-04
33,434
452
0
33,886
21,185
482
3,500
1,700
3,400
4,583
30-May-04
30,889
452
0
31,341
22,106
482
3,000
1,700
3,400
1,617
06-Jun-04
30,889
452
0
31,341
25,735
482
1,200
1,700
2,800
388
13-Jun-04
30,889
452
0
31,341
25,735
482
700
1,700
2,800
888
20-Jun-04
30,889
452
0
31,341
25,735
482
500
1,700
2,800
1,088
27-Jun-04
30,898
452
0
31,350
25,735
482
500
1,700
2,800
1,097
04-Jul-04
30,898
452
0
31,350
25,735
482
100
1,700
2,100
2,197
11-Jul-04
30,898
452
0
31,350
25,735
482
100
1,700
2,100
2,197
18-Jul-04
30,898
452
0
31,350
25,735
482
100
1,700
2,100
2,197
25-Jul-04
30,898
452
0
31,350
25,735
482
100
1,700
2,100
2,197
01-Aug-04
30,889
452
0
31,341
25,735
482
100
1,700
2,100
2,188
08-Aug-04
30,889
452
0
31,341
25,735
482
100
1,700
2,100
2,188
15-Aug-04
30,889
452
0
31,341
25,735
482
100
1,700
2,100
2,188
22-Aug-04
30,889
452
0
31,341
25,735
482
100
1,700
2,100
2,188
29-Aug-04
30,888
452
0
31,340
25,735
482
400
1,700
2,100
1,887
05-Sep-04
30,888
452
0
31,340
23,666
482
900
1,700
2,100
3,456
12-Sep-04
30,888
452
0
31,340
22,387
482
1,000
1,700
2,100
4,635
19-Sep-04
30,888
452
0
31,340
22,047
482
1,900
1,700
2,100
4,075
26-Sep-04
30,888
452
0
31,340
21,962
482
1,300
1,700
2,100
4,760
Notes
- Installed capacity includes unit addition and retirement assumptions as outlined for the 04-05 OC and CP-8 MARS analysis
- Purchases assumed are those noted in 2004 CELT report with minor
adjustments made (NY) for consistency purposes
- Load Forecast as determined for CELT 2004 and has a 50% chance of being exceeded
- Interruptible Loads include 100% of the Day-Ahead Demand Response, Real-Time Demand Response, Real-Time Profiled Response; 50% of the Real-
Time Price Response; and 200 MW assumed for SWCT RFP
- Known Maintenance and Derating as April 5, 2004
- Required operating reserve based on the first contingency (Generator at 1,160 MW) plus 1/2 the second contingency (Generator at 1,145MW)
Unplanned outages includes: forced outages and maintenance outages scheduled less than 14 day sin advance
Page 62 of 71
Docket No. ER11-1844
Exhibit No. NYI-18
Page 63 of 71
Table 4—New York
Revised April 16, 2004
Week
Available
Firm
Firm Sales4
Net
Load
Interruptible
Known
Req. Operating
Unplanned
Net Margin
Beginning
Capcity1
Purchases4
Capacity
Forecast2
Load3
Maint./Derat.
Reserve
Outages
Saturday
MW
MW
MW
MW
MW
MW
MW
MW
MW
MW
5/02/04
38,331
586
302
38,615
25,046
0
3,311
1,800
3,647
4,811
5/09/04
38,331
586
302
38,615
25,713
0
2,394
1,800
3,647
5,061
5/16/04
38,331
586
302
38,615
26,380
0
2,028
1,800
3,647
4,760
5/23/04
38,331
586
302
38,615
27,047
0
417
1,800
3,647
5,704
5/30/04
38,331
586
302
38,615
27,713
0
342
1,800
3,647
5,113
6/06/04
38,471
586
302
38,755
28,380
0
62
1,800
3,647
4,866
6/13/04
38,471
586
302
38,755
29,047
0
0
1,800
3,647
4,261
6/20/04
38,471
586
302
38,755
29,713
0
0
1,800
3,647
3,595
6/27/04
38,471
586
302
38,755
31,800
0
0
1,800
3,647
1,508
7/04/04
38,518
586
302
38,802
31,800
0
0
1,800
3,647
1,555
7/11/04
38,518
586
302
38,802
31,800
0
0
1,800
3,647
1,555
7/18/04
38,518
586
302
38,802
31,800
0
12
1,800
3,647
1,543
7/25/04
38,518
586
302
38,802
31,800
0
0
1,800
3,647
1,555
8/01/04
38,518
586
302
38,802
31,800
0
0
1,800
3,647
1,555
8/08/04
38,518
586
302
38,802
31,800
0
0
1,800
3,647
1,555
8/15/04
38,518
586
302
38,802
31,800
0
0
1,800
3,647
1,555
8/22/04
38,518
586
302
38,802
31,800
0
0
1,800
3,647
1,555
8/29/04
38,518
586
302
38,802
31,800
0
0
1,800
3,647
1,555
9/05/04
38,518
586
302
38,802
27,965
0
0
1,800
3,647
5,390
9/12/04
38,518
586
302
38,802
26,954
0
265
1,800
3,647
6,136
9/19/04
38,518
586
302
38,802
25,943
0
1,769
1,800
3,647
5,643
9/26/04
38,518
586
302
38,802
24,931
0
1,778
1,800
3,647
6,646
Important Notes
1 Includes all known generation, including new generation expected to be online in the New York Control Area
2 Load forecast is expected weekly peak hourly (load+losses)
3 Type II and III DSM not reported. NYISO Emergency Demand Response Program (EDRP) and Special Case Resources (SCR) are emergency procedures
involving commited market resources.
4 "Full Responsibility" Purchases/Sales are represented as per NYISO ICAP rules.
Please note that the information on this page is commercially sensitive, therefore confidential.
Page 63 of 71
Docket No. ER11-1844
Exhibit No. NYI-18
Page 64 of 71
Table 5--Ontario Summary
Updated - March 26, 2004
Week
Installed1
Total
Load2
Interruptible3
Known 4
Req. Operating
Unplanned5
Net
Beginning
Capacity
Purchases
Sales
Capacity
Forecast
Load
Maint./Derat.
Reserve
Outages
Margin
Sundays
MW
MW
MW
MW
MW
MW
MW
MW
MW
MW
02-May-04
30,599
0
0
30,599
19,093
300
8,427
1,380
1,350
649
09-May-04
30,599
0
0
30,599
19,264
300
7,307
1,380
1,350
1,598
16-May-04
30,599
0
0
30,599
19,321
300
6,221
1,380
1,350
2,627
23-May-04
30,599
0
0
30,599
20,217
300
4,847
1,380
1,350
3,105
30-May-04
30,599
0
0
30,599
21,464
300
4,650
1,380
1,350
2,055
06-Jun-04
30,599
0
0
30,599
22,314
300
3,960
1,380
1,350
1,895
13-Jun-04
30,599
0
0
30,599
23,176
300
3,756
1,380
1,350
1,237
20-Jun-04
30,599
0
0
30,599
22,879
300
3,760
1,380
1,350
1,530
27-Jun-04
31,224
0
0
31,224
23,383
300
2,982
1,380
1,350
2,429
04-Jul-04
31,224
0
0
31,224
23,668
300
2,686
1,380
1,350
2,440
11-Jul-04
31,224
0
0
31,224
23,441
300
2,412
1,380
1,350
2,941
18-Jul-04
31,224
0
0
31,224
23,378
300
2,439
1,380
1,350
2,977
25-Jul-04
31,224
0
0
31,224
22,994
300
2,439
1,380
1,350
3,361
01-Aug-04
31,256
0
0
31,256
23,225
300
2,496
1,380
1,350
3,105
08-Aug-04
31,256
0
0
31,256
23,112
300
2,420
1,380
1,350
3,294
15-Aug-04
31,256
0
0
31,256
22,894
300
2,455
1,380
1,350
3,477
22-Aug-04
31,256
0
0
31,256
23,271
300
2,890
1,380
1,350
2,665
29-Aug-04
31,256
0
0
31,256
21,917
300
4,698
1,380
1,350
2,211
05-Sep-04
31,256
0
0
31,256
21,107
300
5,370
1,380
1,350
2,349
12-Sep-04
31,256
0
0
31,256
20,045
300
5,423
1,380
1,350
3,358
19-Sep-04
31,256
0
0
31,256
19,438
300
7,604
1,380
1,350
1,784
26-Sep-04
31,256
0
0
31,256
19,611
300
8,801
1,380
1,350
414
Important notes
1. Includes all generation registered in the market.
2. Load forecast is median growth, normal weather case, weekly 60-minute peaks.
3. 300 MW of price-responsive demand is assumed.
4. Includes known outages, deratings and allowances for hydroelectric capacity.
5. Is based on the average amount of generation in forced outage during May, June, July, August, and September, from 1998 to 2001.
Please note that the information on this page is commercially sensitive, therefore confidential.
Page 64 of 71
Docket No. ER11-1844
Exhibit No. NYI-18
Page 65 of 71
Table 6--Quebec Summary
2004 TransEnergie - Load and Capacity Forecast for Quebec
Revised April 23, 2004
Week
Installed
Firm
Firm
Net
Load
Interruptible
Known
Req. Operating
Unplanned
Net
Beginning
Capacity1
Purchases
Sales2
Capacity
Forecast3
Load
Maint./Derat.
Reserve
Outages4
Margin
Sundays
MW
MW
MW
MW
MW
MW
MW
MW
MW
MW
02-May-04
37303
200
837
36666
21517
1054
6673
1500
1200
6830
09-May-04
37463
200
837
36826
20846
1054
7681
1500
1200
6653
16-May-04
37299
200
837
36662
20181
1054
7544
1500
1200
7291
23-May-04
36283
200
837
35646
19942
1054
8767
1500
1200
5291
30-May-04
36467
200
837
35830
19495
1054
9666
1500
1200
5023
06-Jun-04
36467
200
837
35830
19449
1054
8769
1500
1200
5966
13-Jun-04
36467
200
837
35830
19523
1054
7611
1500
1200
7050
20-Jun-04
36467
200
837
35830
19513
1054
7228
1500
1200
7443
27-Jun-04
36998
200
837
36361
19512
1054
7306
1500
1200
7897
04-Jul-04
36998
200
837
36361
19788
1054
7630
1500
1200
7297
11-Jul-04
37168
200
837
36531
19888
1054
8243
1500
1200
6754
18-Jul-04
36668
200
837
36031
19416
1054
7034
1500
1200
7935
25-Jul-04
36569
200
837
35932
19201
1054
6858
1500
1200
8227
01-Aug-04
36904
200
837
36267
19868
1054
8059
1500
1200
6694
08-Aug-04
37074
200
837
36437
20029
1054
8239
1500
1200
6523
15-Aug-04
37074
200
837
36437
20043
1054
8492
1500
1200
6256
22-Aug-04
37074
200
837
36437
19996
1054
8494
1500
1200
6301
29-Aug-04
36483
200
837
35846
19948
1054
8630
1500
1200
5622
05-Sep-04
36588
200
837
35951
19851
1054
8242
1500
1200
6212
12-Sep-04
37328
200
837
36691
20078
1054
8986
1500
1200
5981
19-Sep-04
37328
200
837
36691
20453
1054
8240
1500
1200
6352
26-Sep-04
37328
200
837
36691
20769
1054
7995
1500
1200
6281
1) Includes IPP and other known generation (Churchill Falls & Labrador Co.).
2) Includes transmission losses of 6%. Does not include firm sale of 45 MW to Cornwall Ontario - Load is supplied radially from Quebec Control Area
3) Load forecast is expected weekly peak (Hourly).
4) This value also includes a load forecast uncertainty (LFU) of 3%.
Please note that the information on this page is commercially sensitive, therefore highly confidential.
Page 65 of 71
Docket No. ER11-1844
Exhibit No. NYI-18
Page 66 of 71
Table 7 - NPCC Bottled Capacity Calculations
CP-8 Assumed Transfer Capability
Revised April 19, 2004
Transaction Breakdown April 19, 2004
TE to ON
1540
Maritimes to NE
0
TE to NY
1500
TE to NE
326
TE to NE
1500
TE to NY
550
NB to NE
700
876
Total Transfer Capability
5240
876 Transactions between TE/ Maritimes and Remainder of NPCC
4364 ATC - TE plus Maritmes to remainder of NPCC
Week
TE Margin
Maritimes
Net Margin
Avaliable
Bottled NE
Bottled Resources
Beginning
Margin
Transfer
resources
Sunday
Capability
02-May-04
6,857
226
7,083
4,364
500
3,219
09-May-04
6,680
286
6,966
4,364
500
3,102
16-May-04
7,318
465
7,783
4,364
500
3,919
23-May-04
5,318
529
5,847
4,364
500
1,983
30-May-04
5,050
490
5,540
4,364
500
1,676
06-Jun-04
5,993
734
6,727
4,364
500
2,863
13-Jun-04
7,077
435
7,512
4,364
500
3,648
20-Jun-04
7,470
637
8,107
4,364
500
4,243
27-Jun-04
7,924
876
8,800
4,364
500
4,936
04-Jul-04
7,324
928
8,252
4,364
500
4,388
Peak Week
11-Jul-04
6,781
948
7,729
4,364
500
3,865
18-Jul-04
7,962
1,003
8,965
4,364
500
5,101
25-Jul-04
8,254
1,006
9,260
4,364
500
5,396
01-Aug-04
6,721
1,146
7,867
4,364
500
4,003
08-Aug-04
6,550
994
7,544
4,364
500
3,680
15-Aug-04
6,283
1,079
7,362
4,364
500
3,498
22-Aug-04
6,328
1,149
7,477
4,364
500
3,613
29-Aug-04
5,649
856
6,505
4,364
500
2,641
05-Sep-04
6,239
1,216
7,455
4,364
500
3,591
12-Sep-04
6,008
1,013
7,021
4,364
500
3,157
19-Sep-04
6,379
1,040
7,419
4,364
500
3,555
26-Sep-04
6,308
740
7,048
4,364
500
3,184
Page 66 of 71
Docket No. ER11-1844
Exhibit No. NYI-18
Page 67 of 71
Appendix II - NPCC Operational Criteria and Procedures
A-2
Basic Criteria for Design and Operation of Interconnected Power Systems
Description: T his Criteria establishes the basic principles and requirements for the
design and the operation of the NPCC bulk power system.
A-3
Emergency Operation Criteria
Description: O bjectives, principles and requirements are presented to
assist the NPCC Areas in formulating plans and procedures
to be followed in an emergency or during conditions which
could lead to an emergency.
A-6
Operating Reserve Criteria
Description: T his Criteria establishes standard terminology and minimum
requirements governing the amount, availability and distribution of
operating reserve. Procedures are included for corrective action and
mutual assistance in case of operating reserve shortages. The
objective is to ensure a high level of reliability in the NPCC Region
that is, as a minimum, consistent with the standards specified by the
North American Electric Reliability Council (NERC).
B-3
Guidelines for Inter-Area Voltage Control
Description: This document establishes procedures and principles to be
considered for occasions where a deficiency or an excess of
reactive power can affect bulk power system voltage levels
in a large portion of an Area or in two adjacent Areas.
B-12
Guidelines for On-Line Computer System Performance During Disturbances
Description: Establishes guidelines for the performance of NPCC Area
on-line computer systems during a power system disturbance.
B-20
Guidelines for Identifying Key Facilities and Their Critical Components for
System Restoration”
Description: Establishes requirements and guidelines for the
identification of Key Facilities and their Critical
Components that are required for restoration of the power
system following a partial or total system blackout.
Page 67 of 71
Docket No. ER11-1844
Exhibit No. NYI-18
Page 68 of 71
C-4 Monitoring Procedures for Guidelines for Inter-Area Voltage Control
Description: T his procedural document establishes TFCO's monitoring
and reporting requirements for conformance with NPCC's
Guidelines for Inter-AREA Voltage Control (Document B-3).
C-5 Monitoring Procedures for Emergency Operation Criteria
Description: T his procedural document establishes TFCO's monitoring
and reporting requirements for conformance with NPCC's
Emergency Operation Criteria (Document A-3).
C-7 Monitoring Procedures for Guide for Rating Generating Capability
Description: This procedural document establishes the TFCO's monitoring
and reporting requirements for conformance with the NPCC,
Guide for Rating Generating Capability (Document B-9).
C-8 Monitoring Procedures for Control Performance Guide
During Normal Conditions
Description: This procedural document establishes a performance measure
for NPCC Areas and systems and outlines the reporting
function for NPCC Control Performance Guide During
Normal Conditions (Document B-2)
C-9 Monitoring Procedures for Operating Reserve Criteria
Description: This procedural document establishes the TFCO's monitoring
and reporting requirements for conformance with the NPCC
Operating Reserve Criteria (Document A-6)
C-11 Monitoring Procedures for Interconnected System
Frequency Response (This Document has recently been revised and will have a
new designation as Reference Document RD-10)
Description: T his procedural document defines procedures for monitoring
frequency responses to large generation losses.
C-12 Procedures for Shared Activation of Ten Minute Reserve
Page 68 of 71
Docket No. ER11-1844
Exhibit No. NYI-18
Page 69 of 71
Description: This procedural document outlines procedures to share the activation
of ten-minute reserve on an Area basis. The methods prescribed by
the procedure are intended to ensure that lost generation or energy
purchases are quickly replaced by several areas simultaneously
loading generation in the few minutes immediately following a loss.
C-13 Operational Planning Coordination
Appendix D - NPCC Critical Facilities List
Description: This document coordinates the notification of planned facility
outages among the Areas. It also establishes formal
procedures for Area communications in advance of a period
of likely capacity shortages as well as for weekly and
emergency NPCC conference call among the Areas.
C-15 Procedures for Solar Magnetic Disturbances on
Electrical Power Systems
Description: This procedural document clarifies the reporting channels
and information available to the operator during solar alerts
and suggests measures that may be taken to mitigate the
impact of a solar magnetic disturbance.
C-19 Procedures During Shortages of Operating Reserve
Description: This procedure is intended to provide specific instructions for
the redistribution of Operating Reserve among the Areas
when one or more Area(s) are experiencing an Operating
Reserve deficiency.
C-20 Procedures During Abnormal Operating Conditions
Description: This procedure is intended to complement the Emergency
Operation Criteria (Document A-3) by providing specific
instructions to the System Operator during such conditions in
an NPCC Area or Areas.
RD-01 NPCC Emergency Preparedness Conference Call Procedures-NPCC
Security Conference Call Procedures
RD-02 NPCC Inter-Control Area Power System Restoration Refernce Document
RD-03 Procedures for Communications During Emergencies
RD-04 Operating Procedures for ACE diversity Interchange
RD-05 Procedure for Operating Reserve Assistance
Page 69 of 71
Docket No. ER11-1844
Exhibit No. NYI-18
Page 70 of 71
Appendix III - Web Sites
ECAR
Independent Electricity Market Operator
ISO- New England
LEER Members
MAAC
MAPP
Maritimes
Maritimes Electric Company Ltd.
New Brunswick Power
Nova Scotia Power
Northern Maine Independent System Administrator
New York ISO
North East Power Coordinating Council
TransEnergie
Drought Predictors
Canadian
Page 70 of 71
Docket No. ER11-1844
Exhibit No. NYI-18
Page 71 of 71
United States
Appendix IV - References
NPCC Summer 2004 Multi-Area Probabilistic Reliability Assessment -May 2004
NPCC Reliability Assessment for Summer 2003 - May 1, 2003
Draft 2004 Summer MEN Interregional Transmission System Reliability Assessment
Page 71 of 71
DOCKET NO. ER11-1844
EXHIBIT NO. NYI-19
Docket No. ER11-1844
Exhibit No. NYI-19
Page 1 of 82
Northeast Power Coordinating Council
Reliability Assessment
For
Summer 2005
Conducted by the
NPCC CO-12 Working Group
April 2005
Docket No. ER11-1844
Exhibit No. NYI-19
Page 2 of 82
TABLE OF CONTENTS
1.
EXECUTIVE SUMMARY
5
SUMMARY OF FINDINGS
5
2.
INTRODUCTION
8
3.
DEMAND FORECASTS FOR 2005
9
SUMMARY OF AREA FORECASTS
9
4.
RESOURCE ADEQUACY
15
NPCC SUMMARY FOR 2005
15
PROJECTED LOAD AND CAPACITY ANALYSIS BY AREA
16
DELAYS TO IN-SERVICE OF NEW GENERATION RESOURCES
19
FUEL INFRASTRUCTURE BY AREA
20
5.
POTENTIAL USAGE OF OPERATING PROCEDURES
23
6.
TRANSMISSION ADEQUACY
25
INTER-REGIONAL TRANSMISSION ADEQUACY
25
INTER AREA TRANSMISSION ADEQUACY
25
TRANSMISSION ADEQUACY ASSESSMENT BY AREA
26
7.
OPERATIONAL READINESS FOR 2005
29
REACTIVE CAPABILITY OF GENERATING UNITS
29
ENVIRONMENTAL IMPACTS
30
GEOMAGNETICALLY INDUCED CURRENTS (GICS)
32
OPERATING PROCEDURES
36
OPERATING PROCEDURES IN SHOULDER MONTHS
38
LOAD RESPONSE PROGRAMS
39
COMMUNICATIONS SYSTEMS WITH OPERATORS AND CUSTOMERS
41
ACQUISITION OF EMERGENCY ENERGY BETWEEN AREAS
43
TRAINING PROGRAMS
44
8.
2004 POST-SEASONAL ASSESSMENT AND HISTORICAL REVIEW
47
SUMMER 2004 POST-SEASONAL ASSESSMENT
47
WINTER 2004/2005 POST-SEASONAL ASSESSMENT
50
HISTORICAL REVIEW (PRE-2004)
53
9.
2005 RELIABILITY ASSESSMENTS OF NEIGHBORING REGIONS
54
EAST CENTRAL AREA RELIABILITY COORDINATION AGREEMENT (ECAR)
54
MID-ATLANTIC AREA COUNCIL (MAAC)
58
APPENDIX I - 2004 EXPECTED LOAD AND CAPACITY FORECASTS
61
TABLE 1 - NPCC SUMMARY
61
TABLE 2 - MARITIMES
62
TABLE 3 - NEW ENGLAND
63
Page 2 of 82
Docket No. ER11-1844
Exhibit No. NYI-19
Page 3 of 82
TABLE 4 - NEW YORK
64
TABLE 5 - ONTARIO
65
TABLE 6 - QUEBEC
66
TABLE 7 - NPCC BOTTLED CAPACITY CALCULATIONS
67
APPENDIX II - SUMMARY OF NORMAL AND EXPECTED FEASIBLE
TRANSFER CAPABILITY UNDER PEAK CONDITIONS
68
APPENDIX III - NPCC OPERATIONAL CRITERIA AND PROCEDURES
77
APPENDIX IV - WEB SITES
80
APPENDIX V - REFERENCES
82
Page 3 of 82
Docket No. ER11-1844
Exhibit No. NYI-19
Page 4 of 82
Information provided in this report has been provided by the Operations Planning
Working Group of the NPCC Task Force on Coordination of Operation with additional
information from Reliability Councils adjacent to NPCC.
The working group members are:
Scott Hodgdon (Chair) ISO New England (ISO-NE)
Wendell Ingalls
Nova Scotia Power
Dean Landers
New Brunswick System Operator (NBSO)
Ken Layman
New York ISO (NYISO)
Al Miller
Independent Electricity System Operator (IESO)
Paul Roman
Northeast Power Coordinating Council (NPCC)
Robert Sauriol
TransÉnergie
Don Weaver
New Brunswick System Operator (NBSO)
Information from neighboring Reliability Councils provided by:
Bill Harm
PJM Interconnection, LLC and Mid-Atlantic Area Council
(MAAC)
Mona Megeed
PJM Interconnection, LLC and Mid-Atlantic Area Council
(MAAC)
Kim Sauerwine
PJM Interconnection, LLC and Mid-Atlantic Area Council
(MAAC)
Jeff Mitchell
East Central Area Reliability Coordination Agreement
(ECAR)
Additional support by:
Phil Fedora (Chair CP-8) Northeast Power Coordinating Council
Page 4 of 82
Docket No. ER11-1844
Exhibit No. NYI-19
Page 5 of 82
1.
Executive Summary
This report focuses on the assessment of reliability within NPCC for the summer of 2005.
Portions of this report are based on work previously completed for the NPCC Reliability
Assessment for Summer 20041.
The NPCC Operations Planning Working Group (CO-12) works closely with the
representatives of the NPCC CP-8 Working Group to ensure results are based on
consistent data and modeling assumptions between the two studies.
Those aspects that the CO-12 Working Group have examined to determine the reliability
and adequacy for NPCC for the summer of 2005 are discussed in detail in the specific
report sections. The following Summary of Findings address the significant points of the
report discussion. These findings are based on projections of: electric demand
requirements, available resources and transmission configurations. This report evaluates
NPCC and the associated Areas’ ability to deal with the differing resources and
transmission configurations identifying NPCC and the associated Areas’ preparations to
deal with possible uncertainties identified in this report.
Summary of Findings
The forecasted capacity outlook for NPCC during the peak week (week beginning July
10, 2005)2 indicates a forecasted available capacity margin of 13,006 MW. During this
week, 6,850 MW of the spare capacity is in the Quebec and Maritimes Areas. The
transfer capability between the Quebec and Maritimes Control Areas to the remainder of
NPCC will not permit the usage of all this forecasted spare operable capacity. This
limitation could reduce the overall capacity margin by approximately 3,375 MW. During
high transfers from New Brunswick to New England, capacity located north of the
Maine- New Hampshire interface may be bottled or locked in due to existing
transmission constraints. This will reduce the overall spare capacity to NPCC by up to
another 400 MW. As a result, the spare capacity available to the remainder of NPCC in
the peak week is reduced to approximately 9,630 MW.
• The week with the forecasted minimum margin occurs during the week beginning
June 26, 2005 where the operable spare capacity available to NPCC after bottling
is forecasted to be 9,100 MW.
• Approximately 1,469 MW of new capacity (8 MW in New England, 810 MW in
New York, 626 MW in Quebec, and 25 MW in Ontario) is still to be
commissioned before the summer. The sizeable spare operable capacity margins
1 The NPCC Reliability Assessment for Summer 2004 can be downloaded from the NPCC members
website.
2 Load and Capacity Forecast Summaries for NPCC, IESO, ISO-NE, NY-ISO, HQ and the Maritimes are
included in Appendix 1.
Page 5 of 82
Docket No. ER11-1844
Exhibit No. NYI-19
Page 6 of 82
forecasted for this summer should counteract any negative impact delays to these
capacity additions may have to the overall NPCC reliability assessment.
•
While Ontario is anticipating adequate resources to meet forecasted weather
normal demands, Ontario may require support from neighboring areas when
extreme weather conditions or higher than normal outage rates are experienced.
•
New England may experience negative capacity margins in June if assumed
demand and generator availability occurs. Under this scenario, New England
would require assistance from surrounding Control Areas and the implementation
of operating procedures to help maintain power system reliability.
•
Even though NPCC as a whole shows adequate resources through the Summer
Operating Period, there remains a load pocket within the New England Control
Area where there are still supply concerns, specifically in the southwestern
portion of Connecticut. In order to address this reliability concern, ISO-NE issued
a Request For Proposal (RFP) in December 2003 for quick-start capacity through
the combination of generation resources, demand response resources, or peak-
load reducing Conservation and Load Management (CL&M) projects. Under this
RFP, approximately 218 MW of capacity is available for the summer of 2005.
•
New England and New York have market-based demand response programs in
place that are expected to provide load relief measures that are in addition to
measures available under emergency conditions. Ontario had an Emergency
Demand Response Program in place for the summer of 2002 through 2004. This
program has been extended to October 31, 2005.
•
During the months of May and September (Shoulder Months), there is forecasted
to be a significant amount of spare operable capacity.
•
An analysis of historical periods of high Geomagnetically Induced Currents
(GICs) was performed. While GICs experienced in late 2004 and early 2005
caused some entities to take action to minimize the effect of the solar storms, the
results of the procedures indicate that they are adequate for managing the
phenomenon.
•
Area environmental constraints, specifically state, provincial and local emissions
regulations may have some minor impact at various times through the 2005
Summer Operating Period. The sizeable spare operable capacity margins
forecasted for this period, combined with the procedures in place, should
minimize any possible effects that may compromise the power system’s
reliability.
•
Control Areas within NPCC have procedures in place to monitor and operate the
system as needed to maintain desired voltage levels. As indicated in this report,
controlling over voltages on the 735kV in Quebec network during off-peak hours
is a concern.
•
The CP-8 Working Group results indicate that all NPCC Control Areas
demonstrated an annual Loss of Load Expectation (LOLE) of 0.1 days/year or
less, under Base Case assumptions. The use of the indicated operating procedures
Page 6 of 82
Docket No. ER11-1844
Exhibit No. NYI-19
Page 7 of 82
designed to mitigate resource shortages (specifically, reducing 30-minute reserve,
voltage reduction, reducing 10-minute reserve, and public appeals) is not
anticipated (risk significantly less than one occurrence) for the NPCC Areas
during the summer of 2005 period, assuming the expected load (represents the
weighted average of the probabilities associated with seven load levels, having a
50% chance of being exceeded) and Base Case conditions materialize.
• Communication protocols in place are sufficient to ensure the timely and efficient
communications in all regions to maximize reliance on the marketplace for
emergency support.
• The CO-12 Working Group believes that NPCC and the associated Areas have
adequate generation and transmission for the Summer Operating Period and have
developed the necessary strategies and procedures to deal with operational
problems and emergencies as they may develop. However, the resource and
transmission assessments in this report are mere snapshots in time and base case
studies. Continued vigilance is required to monitor changes to any of the
assumptions that can alter this report’s findings.
Page 7 of 82
Docket No. ER11-1844
Exhibit No. NYI-19
Page 8 of 82
2.
Introduction
The NPCC Task Force on Coordination of Operation (TFCO) established the CO-12
Working Group to conduct overall assessments of the reliability of the generation and
transmission system in the NPCC Region for the Summer Operating Period (defined as
the months of May through September3) and for other conditions as requested by the
TFCO.
For the 2005 Summer Operating Period, the CO-12 Working Group:
•
Examined historical summer operational experiences and assessed their
applicability for the period to be studied.
•
Assessed the extent to which the NPCC Areas may implement emergency
operating procedures.
•
Reported potential sensitivities that may impact resource adequacy on an Area
basis. These sensitivities included temperature variations, delays to in-service of
new generation resources, load forecast uncertainties, evolving load response
measures, solar magnetic activity, system voltage and generator reactive
capability limits.
•
Reviewed the communications protocols with participants to ensure that timely
and efficient communications will be in place in all regions to maximize reliance
on the marketplace for emergency support.
•
Reviewed the operational readiness of the NPCC and actions to mitigate potential
problems.
•
Assessed the implications of strategies adopted for the Summer Operating Period
on the adequacy of supply in the shoulder months.
•
Coordinated data and modeling assumptions with NPCC Review of Resource and
Transmission Adequacy Working Group (CP-8) and documented the
methodology of each Area in its projection of load forecasts.
•
Provided as appropriate, coordination with other parallel seasonal operational
assessments including MAAC-ECAR-NPCC (MEN) and the NERC Reliability
Assessment Subcommittee (RAS).
3 For the purpose of this report, the Summer Operating Period is defined as the week beginning May 1,
2005 to the week beginning September 25, 2005 inclusive.
Page 8 of 82
Docket No. ER11-1844
Exhibit No. NYI-19
Page 9 of 82
3.
Demand Forecasts for 2005
The non-coincident forecasted peak demand for NPCC over the 2005 Summer Operating
Period is 108,297 MW. This peak demand translates to a coincident peak demand of
106,618 MW which is expected during the week beginning July 10, 2005. The actual
NPCC coincident peak demand during the 2004 Summer Operating Period was 97,296
MW at hour 16:00 on July 22. This was relatively low because of the moderate weather
experienced during 2004 summer.
Ambient weather conditions are the single most important variable impacting the demand
forecasts during the summer months. As a result, each Area is aware that the summer
peak demand could occur during any week of the summer period as a result of these
weather variables. It should also be noted that the non-coincident peak demand
calculation is impacted by the fact that the Maritimes and Quebec experience late spring
demands that are influenced by heating loads that occur during the defined Summer
Operating Period.
The impact of extreme ambient weather conditions on load forecasts can be demonstrated
by various means. The IESO, Maritimes and TransÉnergie (transmission operations
division of Hydro-Quebec) represent the resulting load forecast uncertainty in their
respective Areas as a percentage of the base load. NYISO and ISO-NE use a
Temperature Humidity Index (THI) as a base and increase the load by a MW factor for
each degree above the base value.
Historically the peak loads and temperatures between New England and New York can
have a high degree of correlation due to the relative locations of their respective load
centers. Depending upon the extent of the weather system and duration, there is some
potential for the Ontario peak demand to be coincident with New England and New
York.
The method each Area uses to determine the peak forecast demand and the associated
load forecast uncertainty relating to weather variables is described in greater detail in the
Summary of Area Forecasts below.
Summary of Area Forecasts
Maritimes
Based on the Maritimes Area 2005 demand forecast, a peak of 3,705 MW is predicted to
occur for the summer period, June through August, during the week beginning May 29,
2005. This is a 4.96% increase over the Summer 2004 actual peak of 3,529 MW which
occurred on June 25, 2004 (The 2004 Summer Operating Period peak was 3,635 MW and
occurred on May 25). Since the Maritimes Area is a winter-peaking area, forecasted
peaks for the shoulder months of May and September are normally higher than the
summer period. For the week beginning May 1, 2005, the predicted peak is 4,000 MW;
for the week beginning September 25, 2005, the predicted peak is 3,711 MW.
Page 9 of 82
Docket No. ER11-1844
Exhibit No. NYI-19
Page 10 of 82
The load forecast for the Maritimes Area represents the expected load for the Summer
2005 assessment period. It should be noted that the Maritimes Area load is simply the
mathematical sum of the forecasted weekly peak loads of the sub-areas (New Brunswick,
Nova Scotia, Prince Edward Island, and the area served by the Northern Maine
Independent System Operator). As such, it does not take the effect of load coincidence
within the week into account. If the total Maritimes Area load included a coincidence
factor, the forecast load would be approximately 1-3% lower.
For the NBSO, the load forecast is based on an End-use Model (sum of forecasted loads
by use e.g. water heating, space heating, lighting etc.) for residential loads and an
Econometric Model for general service and industrial loads, correlating forecasted
economic growth and historical loads. Each of these models is weather adjusted using a
30-year historical average.
For Nova Scotia Power, the load forecast is based on a 30-year historical climate normal
for the major load center, along with analyses of sales history, economic indicators,
customer surveys, technological and demographic changes in the market, and the price
and availability of other energy sources.
Maritimes Electric Company Ltd.’s (Prince Edward Island) load forecast uses average
long-term weather for the peak period (typically December) and a time-based regression
model to determine the forecasted annual peak. The remaining months are prorated on
the previous year.
The Northern Maine Independent System Administrator performs a trend analysis on
historic data in order to develop an estimate of future loads.
New England
The New England Control Area's forecasted summer 2005 peak electric load demand is
26,355 MW assuming historically based expected summer peak weather conditions (90.4
degrees Fahrenheit). This is 595 MW (2.3%) higher than the 2004 weather normal
summer peak of 25,760 MW, based on growth in economic and demographic factors as
well as increased load sensitivity to weather. The average annual change in weather
normal summer peak is 560 MW (2.7%) from 1994-2004.
The all time electrical peak electric load for New England is 25,348 MW (occurring at
93.5 degrees Fahrenheit) and was experienced on August 14, 2002. Last summer's actual
peak of 24,116 MW occurred on August 30 with much cooler than expected weather
(82.3 degrees Fahrenheit).
The demand forecast for New England is based on weekly weather distributions. The
weekly weather distributions were built using 30 years of Temperature Humidity Index
(THI) data at the time of daily peaks (for non-holiday weekdays). The reference load
forecast is based on a 50/50 probability of occurrence. While this temperature sampling
is used to project temperature sensitive loads, a complete process of sampling and
econometric models are used to project the overall aggregate demand. A reasonable
approximation for “normal weather” associated with this projection is 90 degrees
Page 10 of 82
Docket No. ER11-1844
Exhibit No. NYI-19
Page 11 of 82
Fahrenheit (32 degreed Celsius) and a dew point of 70 degrees. At these forecasted load
levels, a one-degree increase in the THI will result in approximately 700 MW of
additional load. The amount of additional load depends on the total deviation from the
“normal weather” approximation.
The reference case forecast of 26,355 MW has a 50% chance of being exceeded. New
England also produces a load forecast that has only a 10% chance of being exceeded.
The peak electric load for this forecast is 27,985 MW. This would be equivalent to an
increase in the 50% load forecast of approximately 1,630 MW.
The following graph illustrates the range of potential peak demands that ISO-NE may
experience this summer and compares them to historical peaks. It should be noted that
the historical peak values illustrated below are the peak loads reconstituted to reflect
power system invoked load relief procedures (Operating Procedures) that may have been
implemented at such times.
Figure 1: New England 2005 Summer Operating Period Load Profiles
29,000
27,000
25,000
23,000
21,000
19,000
2005 Reference Load
2005 High Load
Historical Peak (1980-2004)
17,000
15,000
Week Beginning
New York
The forecast peak for the New York Control Area is 31,962 MW, which is 162 MW
higher than last year’s forecast of 31,800 MW. This forecast is 3.2 % higher than the all
time peak of 30,982 MW that occurred on August 9, 2001. The forecast is developed by
the NYISO using a Temperature-Humidity Index (THI) value of 81.31 degrees, which is
representative of weather conditions during peak load conditions. At forecast load levels,
a one-degree Fahrenheit increase in the THI will result in approximately 500 MW
additional load.
Page 11 of 82
Docket No. ER11-1844
Exhibit No. NYI-19
Page 12 of 82
The following illustration provides the range of potential peak demands that New York
may experience this summer.
Figure 2: New York 2005 Summer Operating Period Load Profiles
New York Summer 2005 Load Profiles
35000
33000
31000
29000
27000
25000
23000
21000
19000
17000
15000
Week Beginning
Extreme Load
Normal Load
Historical Load
Ontario
The forecasted weather normal, summer hourly peak demand for 2005 is 23,897 MW.
This hourly peak is forecasted to occur during the week beginning July 10, 2005. The
weather normal forecast is derived from an analysis of the average demands using 30
years of historical weather based on a weekly resolution. The normal weather equates to
an approximate average daily temperature of 28 degrees Celsius (82 degrees Fahrenheit)
and 65% relative humidity and represents the average weather that can be expected
during any given week during the assessment period.
The load model and resultant demands have been updated to reflect the latest economic
growth forecasts for Ontario for 2005.
As was seen in 2001 and 2002, weather extremes can propel the demands significantly
higher than the weather normal values. Since peak demands are highly weather sensitive,
the impacts of additional weather scenarios need to be understood as part of the
assessment.
Load Forecast Uncertainty (LFU) is used to capture, in MW, the impact of these
variations from weather normal predictions. Therefore demands can be derived and given
a probability of occurring based on the likelihood of observing the normal weather. For
this forecast, there is a 50% chance the peak demand in any given week will exceed the
weather normal demands. LFU represents the impact on the peak demand of one standard
deviation in the weather elements. The values of LFU associated with this analysis ranges
from about 3% to 10.5% of the predicted weather normal demands during the Summer
Operating Period. The highest values of LFU for Ontario appear during those weeks just
Page 12 of 82
Docket No. ER11-1844
Exhibit No. NYI-19
Page 13 of 82
prior to and after the traditional summer vacation periods of July and August. LFU
equates to a potential increase in demand of about 1,125 MW over the weather normal for
the peak week.
Lastly, the summer period can experience extreme weather driven demands where the
system is likely to be under duress. For any given week, the IESO forecasts extreme
weather demand by using the hottest day in the past thirty years as the reference point.
Depending upon the week in this assessment period, the values that could be experienced
under extreme weather conditions can be between 8.5% and 22% higher than the weather
normal prediction. This equates to a potential increase of approximately 2,485 MW over
the normal weather prediction on the peak week. During the shoulder months of May and
September, the impact of extreme weather over normal weather forecasted demand can
reach as high as approximately 4,500 MW.
The following graph indicates the range of possible demands that Ontario may experience
over the assessment period.
Figure 3: Ontario 2005 Summer Operating Period Forecast Demands
26,250
25,250
24,250
23,250
22,250
21,250
Normal Forecast (MW)
Normal + 1 LFU (MW)
20,250
Extreme Forec ast (MW)
19,250
18,250
Week Beg inn in g
Quebec
The forecasted summer peak demand for the Quebec Control Area in 2005 is 22,083
MW. This is 134 MW (0.6%) higher than last summer's actual peak demand of 21,949
MW which happened on May 4, an unseasonably cold day for the season with
temperatures around 3 degrees Celsius (37 degrees Fahrenheit) at the major load centers.
The forecast is based on 35 years of historical weather with an offset of ±3 days for every
date, which amounts to the equivalent of 245 years of sampling. Being exposed over the
year to all kinds of extremes in weather, TransÉnergie (transmission operations division
Page 13 of 82
Docket No. ER11-1844
Exhibit No. NYI-19
Page 14 of 82
of Hydro-Quebec) uses three different load forecasting models (autumn, winter and
spring). For the purpose of this assessment, the spring model is used up to the middle of
August and the autumn model is used for the remainder of the period. The boundaries of
the parameters of these models are regularly calibrated by comparing the results to the
last two years of historical weather to reflect any new tendencies. Finally, TransÉnergie
defines load forecast uncertainty (LFU) as a percentage calculated on a monthly
resolution. The value for LFU is approximately 3% for the summer months, which
represents about 600 MW. This value is accounted for in the Load and Capacity table
provided in this assessment.
Page 14 of 82
Docket No. ER11-1844
Exhibit No. NYI-19
Page 15 of 82
4.
Resource Adequacy
NPCC Summary for 2005
The following assessment of resource adequacy indicates the week with the highest
overall NPCC demand is July 10, 20054.
During the peak week for NPCC the overall spare operable capacity is forecasted to be
approximately 13,000 MW. However, a portion of this spare operable capacity is in the
Quebec and Maritimes Area. If conditions materialize as forecasted, transmission transfer
capability between these Areas and the remainder of the NPCC Areas will limit the usage
of all of these resources.
Additionally, under conditions of high transfers from New Brunswick to New England up
to 400 MW of resources may become bottled north of the Maine - New Hampshire
border due to possible transmission constraints.
The overall net margins for NPCC have been reduced by approximately 1,380 MW to
5,110 MW during the period of mid June to late August to account for this bottled
capacity. After accounting for possible transmission constraints within NPCC,
approximately 9,100 MW of spare operable capacity is forecasted for the week beginning
June 26 which is forecasted to be the week with the lowest spare operable capacity.
The following graph highlights the projection of NPCC Demands, a Projected Resources
Scenario and an Existing Resource Scenario for the Summer Operating Period. The
projection of NPCC Demand is a summation of each Areas projected demand plus
operating reserves on a weekly basis. The Projected Resources Scenario is a summation
of each Areas; Projected Installed Capacity plus a projection of Interruptible Demands
less Operating Reserve requirements, a projection of Known Outages, a projection of
Unknown Outages, Bottled Resources and the Net of Firm Imports / Exports to NPCC.
The Existing Resource Scenario uses the same elements as the Projected Resources
Scenario but assumes that none of the resources that are currently undergoing
commissioning or are forecast to be in service will be available at any time for the
summer.
4 Detailed Projected Load and Capacity Forecast Summaries specific to NPCC and each Area are included
in Appendix I.
Page 15 of 82
Docket No. ER11-1844
Exhibit No. NYI-19
Page 16 of 82
Figure 4: Projection of NPCC Net Capacity and Peak Demand Plus Operating
Reserves - 2005 Summer Operating Period
130,000
125,000
120,000
115,000
110,000
105,000
Net Capacity Resources
100,000
Net Capacity Resources without
capacity additions
Forecasted Load Plus Operating
95,000
Reserves
90,000
Week Beginning
The assessment was performed on the basis of projected available capacity. Inadequate
fuel supply; lower than normal water reservoirs; higher than anticipated forced outages;
or delays in anticipated new facilities can have an adverse impact on these capacity
projections.
The following are the Area assessments supporting this overall resource adequacy
assessment.
Projected Load and Capacity Analysis by Area
Maritimes
When allowances for unplanned outages (based on a discrete MW value representing a
typical forced outage) are considered, the Maritimes Area is projecting more than
adequate capacity margins for the Summer 2005 assessment period. Net margins ranging
from 20% to 42% are projected over the period May through September 2005.
New England
Operable capacity within New England is forecasted to be sufficient to meet load plus
operating reserve requirements during the 2005 Summer Operating Period under the
reference load forecast (50% chance of being exceeded). The lowest projected operable
Page 16 of 82
Docket No. ER11-1844
Exhibit No. NYI-19
Page 17 of 82
capacity margin of -31 MW is expected to occur during the week beginning June 19,
2005 while the highest projected capacity margin of 5,189 MW is expected to occur
during the week beginning May 22, 2005 if all assumed system conditions materialize.
Available operable capacity is based on known outages, an allowance for unplanned
outages5, anticipated generation additions and retirements, projected firm purchases and
sales, and the impact of expected Demand Response Programs.
Under the high load forecast (10% chance of being exceeded), the lowest projected
operable capacity margin of -1,661 MW is expected to occur during the week beginning
June 19, 2005. If this load or higher than expected resource unavailability occurs, ISO-
NE will have to implement ISO New England Operating Procedure No. 4 - Action
During a Capacity Deficiency (OP-4). OP-4 is designed to provide additional generation
and load relief needed to balance electric demand and supply while striving to maintain
appropriate operating reserves.
As it has been in past years, the Connecticut region may face reliability problems due to
transmission constraints into and within that region. Pursuant to planning studies
conducted for the 2003 and 2004 Regional Transmission Expansion Plans, ISO-NE has
identified concerns regarding electric transmission reliability in the southwestern
Connecticut sub-area. Under certain conditions, the electric load in these areas could
exceed the combined ability of the electric generating resources in the area and the
available transmission capacity to import electric energy into the region to meet the
demand. Under these conditions, the generation and transmission systems within the
region may not be able to supply the electric load without extremely low transmission
system voltages and/or overloading lines. In order to address this reliability concern,
ISO-NE issued a Request For Proposal (RFP) in December 2003 for quick-start capacity
through the combination of generation resources, demand response resources, or peak-
load reducing Conservation and Load Management (CL&M) projects. Under this RFP,
approximately 218 MW of capacity is available for the summer of 2005. These MWs are
accounted for in the Load and Capacity tables located in Appendix I.
ISO-NE is also mindful of the reliability of the Boston area -- a major demand center in
New England -- during the 2005 Summer Operating Period. If higher than expected
loads and/or higher than expected resource unavailability occurs, then ISO-NE is
prepared to utilize established operating procedures to help balance supply and demand
and maintain system reliability.
New York
NYISO forecasts available capacity of 39,237 MW for the peak week resulting in a
capacity margin of 4,057 MW.
5 The allowance for unplanned outages is based on historical trends and is estimated to be between 2,100
MW and 3,400 MW during the summer.
Page 17 of 82
Docket No. ER11-1844
Exhibit No. NYI-19
Page 18 of 82
These resources represent all generation capability located physically within the New
York Control Area (NYCA) and are able to participate in NYISO ICAP market. In
addition to these generation resources within the NYCA, generation resources external to
the NYCA can also participate in the NYISO ICAP market. Resources within the NYCA
that provide firm capacity to an entity external to the NYCA are not qualified to
participate in the ICAP market.
NYISO conducts semi-annual and monthly Installed Capability (ICAP) auctions. Based
on the forecast load for 2005, the ICAP requirement is 37,715 MW based on the 18%
installed reserve margin requirement. When allowances are taken for unplanned outages
(based on historical performance of 8.68 % unavailable capacity), the net available
resources will be 34,441 MW, which will be sufficient to meet the New York Control
Area (NYCA) load and operating reserve requirement during the peak load hours, with a
reserve margin of approximately 679 MW expected at peak conditions.
NYISO expects approximately 700 MW of load relief from emergency operating
procedures that include internal load curtailment by the transmission owners, public
appeals and 5% system wide voltage reductions. Participation in the Emergency Demand
Response Program and Special Case Resources programs represents an additional 1,166
MW available through the market. NYISO Emergency Demand Response Program
(EDRP) and Special Case Resources (SCR) are emergency procedures involving
committed market resources but are not considered as interruptible load in the Load &
Capacity table calculations of net margin.
Resource additions, totaling 810 MW are expected to be available for service prior to the
summer peak. The new Bethlehem Energy Center is a 750 MW natural gas-fired
combined-cycle plant. This project includes the retirement of the existing Albany Steam
station at the same site, which removes 356 MW of capacity for a net increase of 394
MW installed capacity in the NYCA. Two new 144 MW gas turbines will be located in
New York City (NYC); and the remaining 128 MW are two simple-cycle combustion
turbines in the Long Island zone; all are expected to be in-service by July.
Ontario
All new resources that were projected to be in service for the Summer 2004 and Winter
2004 / 2005 assessments have been declared in service and the IESO is anticipating
positive spare operable capacity margin of approximately 740 MW on the peak week
based on the expected weather normal demand forecast. This represents a decrease of
spare operable capacity from what was experienced during the summer of 2004. The
majority of this decrease is a result of the removal of four coal-fired units at Lakeview,
which represents a net loss of 1,148 MW. The shutdown of the facility is expected before
April 30, 2005
The IESO is anticipating an additional 25 MW of new generating capacity to become
available during the 2005 summer operating period. This increase is due to the upgrading
of an existing unit and is expected to be complete by early June.
Page 18 of 82
Docket No. ER11-1844
Exhibit No. NYI-19
Page 19 of 82
This forecast of spare operable capacity is based on the assumption that the uprated
generating resources will meet its in service projections, known outages will proceed as
planned, and the projections of unknown outages, or price responsive loads are accurate.
Known outages include the following; those resources that are scheduled to be on
planned outages, transmission constrained resources and the difference between the
installed capacity and the dependable capacity. For example, hydroelectric capacity is
reduced by varying amounts through portions of the study period to account for the
energy available under median water conditions.
Unknown outages represent the average value of forced outages experienced in a similar
study period.
The IESO has seen a steady growth in the dispatchable load available since the summer
of 2004. Based on participant projected commitments, a value of between 400 MW to
430 MW of price responsive load has been assumed to be available for this forecast
period.
The net capacity margins, in Table 5 of Appendix I, depicts an estimate of the operable
capacity margin that does not consider all the additional off-market control actions
available to the IESO. For example, the IESO can institute a 3% or 5% voltage reduction.
These control actions have the effect of reducing the demand by 1.7% to 2.6%, which,
equates to reductions of approximately 400 MW for 3% reductions and 620 MW for 5%
reductions based on the weather normal demands for the peak week.
The risks associated with this analysis are that demands may be heavier than expected
due to extreme weather, units on outage may not return to service as scheduled or there
are delays to new and returning units. The IESO will monitor the capacity balance and
take appropriate actions where necessary.
Quebec
TransÉnergie is projecting more than adequate capacity margins for the Quebec Control
Area during the Summer Operating Period. Being a winter peaking region, the summer is
the season during which maintenance work is performed, but margins in the range of
1,900 MW to 7,400 MW above load and firm sales projections are nevertheless expected.
The Sainte Marguerite-3 hydro plant (900 MW) continues to be restricted by a problem
with its turbines and its total output continues to be limited to 580 MW. No correction to
this condition is expected in 2005.
Delays to In-service of New Generation Resources
Maritimes
The Maritimes Area has no new generation resources scheduled for commercial
operation during the summer period May through September 2005.
Page 19 of 82
Docket No. ER11-1844
Exhibit No. NYI-19
Page 20 of 82
New England
Approximately 8 MW of new generating resources are expected to be in-service in New
England for the Summer Operating Period. If this capacity is not operational in time for
the peak demand period, it will only have a marginal effect on net capacity margins.
New York
As in previous years as part of the peak period capacity assessment, the NYISO
determines the locational installed capacity requirements for the NYC and Long Island
load zones in addition to the statewide ICAP requirement. For the Summer 2005, based
on the locational ICAP installed capacity as of February 2005, there were projected
negative margins of 116 MW for the NYC load zone (before including 288 MW of
expected additional new capacity or the expected SCR total of 158 MW), and 10 MW for
the Long Island load zone (before including new generation of 128 MW or expected SCR
90 MW). Both locational margins are expected to be covered when the SCR totals are
finalized, and the commercial availability of the new generators. Unexpected delays to
these units would require the load zones to procure enough SCR to cover any projected
deficiency to meet NYISO and New York State Reliability Council requirements. The
ability to meet the statewide ICAP requirement would not be impacted by any delays to
proposed generation.
Ontario
Given the minimal change to the resource scenario for this Summer Operating Period,
delays to the in service of new generation will not dramatically impact the resource
adequacy scenario.
Quebec
A new hydroelectric power plant located east of the Manicouagan power complex will be
put in service in 2005. The Toulnustouc plant will have a total output of 526 MW. The
first of its two generators (263 MW) is planned to be commissioned at the beginning of
May and the second one at the beginning of July. No delays have been announced.
Also, about 100 MW (nameplate capacities) of wind power generators shall be put in
service this summer. These are the first of at least 1,300 MW of wind power generators
planned until 2012 in Quebec
Fuel Infrastructure by Area
The following is a self-assessment by each Area of the expected fuel supply
infrastructure.
Page 20 of 82
Docket No. ER11-1844
Exhibit No. NYI-19
Page 21 of 82
Maritimes
The fuel supply in the Maritimes Area is very diverse and includes Nuclear, Natural Gas,
Coal, Oil (both light and residual), Orimulsiontm, Petroleum Coke, Hydro, Tidal,
Municipal Waste, and Wood.
The Maritimes Area does not anticipate any restrictions in capacity due to fuel supply.
Units that have been converted to the Orimulsiontm fuel retain their full capability on oil.
Moreover, the Area anticipates normal hydro conditions and the reservoirs are expected
to be full.
New England
Historically, traditional fuel supply and delivery options have been readily available to
generators within New England during the summer months. For the summer of 2005,
ISO New England does not foresee any fuel supply or delivery constraints.
New York
Traditionally, the New York Control Area generation mix has been dependent on fossil
fuels for the largest portion of the installed capacity. Recent capacity additions or
enhancements now available use natural gas as the primary fuel. While some existing
units in southeastern New York have dual-fuel capability, use of residual or distillate oil
as an alternate may be limited by environmental regulations. Adequate supplies of all
fuel types are expected to be available for the summer period.
Ontario
The majority of generation facilities operating on the IESO-controlled grid are
represented by three basic types of fuel (Hydroelectric, Nuclear and Fossil). The fossil-
fueled facilities are predominately fired by coal. A portion of the fossil-fired resources is
fueled by natural gas or oil. A majority of the oil-fired capability is dual fueled by natural
gas and oil. Adequate supplies of these all of these fuels are expected to be available and
there is no expectation of fuel delivery infrastructure problems for the Summer Operating
Period.
While there are storage lakes associated with most hydroelectric facilities, the ability to
predict hydroelectric energy is difficult as water flow conditions are primarily influenced
by precipitation. To counter this, the hydroelectric installed capacity is reduced through
portions of the study period to account for reductions in capacity when the available
water falls below the dependable value. For the purposes of this assessment, dependable
hydroelectric capacity is the capacity that is sustainable for a minimum of one hour per
day, five days per week. This reduction is one of the components of the Known Maint. /
Derating column in Table 5 of Appendix I.
Page 21 of 82
Docket No. ER11-1844
Exhibit No. NYI-19
Page 22 of 82
Quebec
Most of the generation resources in the Quebec Control Area are hydroelectric (95%) and
hydraulic conditions are adequate. For the Summer Operating Period of 2005,
TransÉnergie does not foresee any problems in meeting both its internal demand and full
responsibility sales while still being able to assist neighboring Areas as needed.
Page 22 of 82
Docket No. ER11-1844
Exhibit No. NYI-19
Page 23 of 82
5.
Potential Usage of Operating Procedures
The NPCC CP-8 Working Group has performed a probabilistic analysis to estimate the
annual Loss of Load Expectation (LOLE) and projected use of Area Operating
Procedures designed to mitigate resource shortages for the summer of 2005 under various
conditions. This section is based on the CP-8 Study results. Detailed study results for
each of these scenarios can be obtained from the NPCC CP-8 Working Group - Summer
2005 Multi-Area Probabilistic Reliability Assessment.
All NPCC Areas demonstrated an annual LOLE of 0.1 days/year or less, under the Base
Case assumptions for the expected load (the expected load is the weighted average of
seven load levels, weighted by the probabilities assumed for each).
For the May - September 2005 period, Figure 5 shows the estimated potential range of
use of the indicated operating procedures under Base Case assumptions. Figure 5
displays the range of results for the expected load level (the expected load level results
were based on the probability-weighted average of the seven load levels simulated) and
the extreme load level (represents the second to highest load level, having approximately
a 6% chance of being exceeded).
Figure 5
Potential Range of Use of Indicated Operating Procedures for Summer 2005
Considering Base Case Assumptions (May - September)
(Expected and Extreme Load Levels)
5
4
Reduce 30-min Reserve
Voltage Reduction
3
Reduce 10-min Reserve
Estimated
Appeals
Number of
2
Disconnect Load
Occurrences
(days/period)
1
New York issues
appeals prior to
0
reducing 10-min
NE NY ON MT Q
Reserve
Page 23 of 82
Docket No. ER11-1844
Exhibit No. NYI-19
Page 24 of 82
For the May - September 2005 period, Figure 6 shows the estimated use of the indicated
operating procedures under the Severe Case assumptions for the extreme load level
(represents the second to highest load level, having approximately a 6% chance of being
exceeded).
Figure 6
Summer 2005 - Estimated Use of the Indicated Operating Procedures
Severe Case Assumptions, Extreme Load Level
(May - September)
5
4
Reduce 30-min Reserve
Voltage Reduction
3
Reduce 10-min Reserve
Estimated
Appeals
Number of
2
Disconnect Load
Occurrences
(days/period)
1
New York issues
appeals prior to
0
reducing 10-min
Reserve
NE NY ON MT Q
As shown in Figure 5, use of the indicated operating procedures designed to mitigate
resource shortages (specifically, reducing 30-minute reserve, voltage reduction, reducing
10-minute reserve, and public appeals) is not expected (risk significantly less than one
occurrence) for the NPCC Areas during the 2005 summer period under the Base Case
conditions. Recent capacity added in the NPCC Areas, in addition to the Demand
Response Programs planned to be available this year are contributing factors that tend to
reduce the need for the use of these operating procedures in 2005.
As shown in Figure 6, if reductions in anticipated resources and/or additional
transmission limitations into NPCC materialize coincident with higher than expected
loads, New England and New York may experience conditions during the summer of
2005 that require the use of their operating procedures designed to mitigate resource
shortages. The potential use of these operating procedures is more likely to be required
in southwestern Connecticut, New York City and Long Island, New York, under the
Severe Case conditions.
Page 24 of 82
Docket No. ER11-1844
Exhibit No. NYI-19
Page 25 of 82
6.
Transmission Adequacy
Many Inter-Regional and Intra-Area transmission studies are in the preliminary stages of
assessment. Therefore, the transmission adequacy assessment for this report was made
utilizing assumptions based on consultation with the staff in the appropriate area of
expertise for Inter-Regional transfer capability, supplemented by Intra-Area Transmission
assessment of each Control Area and a review of the actual operating experience during
the summer of 2004. The following is a transmission adequacy assessment from the
perspective of the ability to support energy transfers for the differing levels, Inter-Region,
Inter-Area and Intra-Area.
Inter-Regional Transmission Adequacy
The third phase angle regulator on the Michigan - Ontario Interface (Lambton PS4)
associated with 345 kV circuit L4D (Lambton - St Clair) was placed in service in
February 2005. All counter parties to the project are working to complete a joint
instruction that adheres to the principle of schedule equals flow. Pending completion of
the joint instruction, the phase angle regulators will only be operated off neutral as a last
resort to prevent load shedding.
A tower on the 230 kV circuit B3N (Bunce Creek - Scott) between Ontario and
Michigan was damaged in April of 2003, with the associated phase angle regulator failing
a month earlier. This circuit will remain out of service through this summer operating
period.
Therefore until the joint instruction is completed, the ability to transfer energy into / out
of Ontario on the Ontario-Michigan Interface is assumed to be the same as experienced
last summer, until the phase shifter agreement can be completed. It is expected that the
transmission system is adequate to support the anticipated Inter-Regional transfers.
Inter-Regional Transfers Inter Area Transmission Adequacy
The transfer capability between the NPCC sub-Area containing the Quebec Control Area
and the Maritimes Area with the remainder of NPCC is less than the surplus capacity in
this sub-Area. The estimated transfer capabilities used in the CP-8 probabilistic
assessment were used to calculate the remaining transfer capability after known
transactions are taken into account.
Above this restrictive condition, high transfer conditions from New Brunswick to New
England can bottle up to an additional 400 MW of operable spare capacity north of the
Maine - New Hampshire border. This accounts for the adjustment to the Net NPCC
Margins in the Resource Adequacy assessment (Section 4).
The following diagram indicates the assumed transfer capability used in the CP-8
Summer 2005 Probabilistic Assessment. These same transfer capabilities were used in
this report for the determination of Inter-Area / Inter-Region transmission adequacy and
the calculation of bottled resources within NPCC.
Page 25 of 82
Docket No. ER11-1844
Exhibit No. NYI-19
Page 26 of 82
Figure 7
Assumed Transfer Limits Between Areas at Time of Peak
NPCC Transfe r Limits
- CP-8 2005 Summer Assessment
- Base Case
(Assume d Ratings)
375
325
262
S
MANIT
65 S
274
W
330 S
84 W
342 W
NE
95 S
110 W
NS
NW
PEI
140
698
147
200
0
90
Ottawa
222
HQ
NBM
300
1,500
NM
MINNE
ON
0
440 S
200
124
350
West
2,690
535 W
47
0
800
B EAU
1,000
100
1,
250
East
90
LG 2A
1,000 S
NB
Niagara
690
MT
1,100 W
1,475
74
0 S
Total Ontario
76
0 W
0
1,300
QB
4,000 In
400
5,550 Out -S
225
5,900 Out -W
700
1,500
1,500
BHE
1,450 S
1,369 W
D
0
150
VT
CMA
A
500
F
C
500
NY
G
800
W-
MA
NE
1,550
1,100
800
330 (CSC)
K
CT
550
J
28
6
ECAR
800
6,500
300
1,000
NOR
Total NY
-NE
2,000
0
1,225 / 92
5 S
1,475 W
(Excludes CSC)
3,000
West
Cent.
East
4,700
6,500
MC
Transmission Adequacy Assessment by Area
Maritimes
There have been no major additions to the Maritimes bulk transmission system.
Interconnection capability remains unchanged and is capable of delivering up to 700 MW
to New England and is capable of delivering up to 750 MW to Quebec.
New England
The 2004 Regional Transmission Expansion Plan6 (RTEP04) outlines a number of the
ongoing transmission planning studies and projects that are taking place. The report
continues to describe the various areas of the region where transmission projects are
needed for reliability.
6 The RTEP04 summary report can be found on the ISO-NE website at:
Page 26 of 82
Docket No. ER11-1844
Exhibit No. NYI-19
Page 27 of 82
For the summer 2005, ISO-NE anticipates the addition of the 345 kV regulating shunt
reactor at North Cambridge. This is planned to help the operation of the Boston area
system during light load conditions. A number of smaller projects are proposed for the
summer 2005 that includes bus-work, re-rating of various lines and the addition of 115
kV lines and breakers. ISO-NE does not anticipate any of the new transmission projects
will have an adverse affect on operation of the electric system.
New York
There are no major transmission facility additions to the New York bulk power system
expected for the 2005 Summer Operating Period.
Ontario
Several transmission upgrades were required to mitigate the impact of the removal of
Lakeview generation station from service. These upgrades included the installation of
over 1,350 Mvar in the Toronto and surrounding areas. Also required, was the addition of
500 kV to 230 kV transformation facilities. The first stage of increasing the
transformation capability, includes the installation of a 500 / 230 kV transformer at the
new Parkway TS. The transformer will be connected via 2 230 kV lines to the existing
Claireville transformer station. All transmission upgrades that were identified to be in
place for the Summer Operating Period to facilitate the removal of Lakeview generation
were completed by the end of March 2005.
While the concerns may be eased by the installation of these transmission upgrades,
maintaining acceptable voltage profiles in the Greater Toronto Area will still require
diligent assessment of outage plans, and dispatch/deployment of reactive resources under
certain extreme demand scenarios.
Quebec
The 100 MW Variable Frequency Transformer (VFT) at the Langlois substation near the
Les Cedres generating plant was commissioned in January 2005. An official request has
been filed by TransÉnergie to NYISO to change the status of the interconnection between
Quebec and the Niagara Mohawk Company in New York so that it would become an
open path and every marketer could have access to the market. Once the new market
rules are in place, it will also be possible to import up to 100 MW from New York to
Quebec. Currently, imports via this interconnection are prohibited except during
emergencies.
The transmission capacity from Quebec to New Brunswick will be reduced during much
of the month of August to about 700 to 800 MW, instead of 1,050 MW normally, due to
busbars displacements on the 735 kV part of the Lévis substation. Capability from New
Brunswick to Quebec will not be impacted by these outages.
During the Summer Operating Period, no other major maintenance outages are scheduled
on the interconnections with neighboring Areas. Transfer capabilities will be at their
Page 27 of 82
Docket No. ER11-1844
Exhibit No. NYI-19
Page 28 of 82
maximum throughout the summer. Internal transmission outage plans are assessed to
meet load, firm sales, expected additional sales plus additional uncertainty margins.
Page 28 of 82
Docket No. ER11-1844
Exhibit No. NYI-19
Page 29 of 82
7.
Operational Readiness for 2005
The Resource and Transmission adequacy assessments are key elements in determining
NPCC’s ability to meet the demands of the summer, but they are mere “snapshots in
time” or simulations of conditions based on predictions of specific configurations. To
mitigate the uncertainty surrounding load forecasts, forced outages, and other conditions
that cannot be controlled or predicted, the Control Areas of NPCC need to be prepared to
deal with contingencies in real time.
The following is a synopsis of some of the most prevalent uncertainties affecting the
ability to handle the projected demand and the mitigating actions NPCC Control Areas
can take to diminish their impact during the 2005 Summer Operating Period.
Reactive Capability of Generating Units
Heavy demand during the summer period requires that the transmission system voltages
and the end-use reactive loads be supported by substantial reactive resources in relation
to the real power requirements. While static VAR devices and shunt capacitors provide a
known quantity of support based on design rating, the actual reactive capabilities of
generators can vary significantly from the design capability.
The following is a discussion of each Areas methodology to monitor reactive capability.
Maritimes
The Maritimes Area, in addition to the reactive capability of the generating units,
employs a number of capacitors and reactors in order to provide local area voltage
control. The Area employs Static VAR Compensators and several synchronous
condensers in key load centers to provide high-speed reactive power control. Further, the
Maritimes Area is a winter peaking system and the loading of the transmission lines in
summer is, in general, lower resulting in lower VAR consumption.
New England
ISO-NE and its satellite control centers continually monitor voltage and VAR conditions
throughout the system to ensure reliability of the bulk power grid in New England.
Major generating stations throughout New England have specified voltage scheduled,
which are maintained as closely as possible in system operations. In addition to voltage
schedules, minimum and maximum voltage limits at several key generating or
transmission stations have been established to promote system reliability during adverse
voltage/reactive conditions. Also, a Tariff has been in place since August of 2001 that
compensate New England generators for VAR support.
Page 29 of 82
Docket No. ER11-1844
Exhibit No. NYI-19
Page 30 of 82
New York
Each generator providing voltage support service under the NYISO Tariff to the New
York market is required to perform annual testing of reactive capability within 90% of its
claimed operating capability. The NYISO staff reviews the test data and, if necessary,
will perform appropriate voltage analysis to determine operating limits based on the
reactive capability testing. In preparation for the summer peak period, the NYISO staff
has been reviewing the test data to ensure that all voltage support service providers are in
compliance with the testing and reporting requirements for this ancillary service. The
NYISO staff has also requested Transmission Owners and Generation Owners to identify
local (in plant or station) issues that might limit a particular generator’s voltage support
capability.
Ontario
The IESO has the authority to test the declared reactive capabilities of generating units.
Testing of generating units, critical to the support of key portions of the IESO-controlled
grid will be completed before the end of April 2005. The results of the tests will be
compared to the capability assumptions used in studies for the summer.
Quebec
Being a winter peaking area, TransÉnergie does not expect to encounter voltage collapse
problems during the summer. On the contrary, controlling overvoltages on the 735kV
network during off-peak hours is the concern. This is accomplished mainly with ample
provision of shunt reactors. Most shunt capacitors, at any voltage level, are disconnected
during the summer.
Environmental Impacts
The major Federal rules that apply to electric generating sources in the northeastern
United States are the Acid Rain regulations, New Source Performance Standards (NSPS)
and State Implementation Plans (SIPs). The Acid Rain regulations require power plants
to reduce both SO2 and NOx emissions on a year round basis. The NSPS regulations set
regulations for new power plants and States develop SIPs to meet National Ambient Air
Quality Standards (NAAQS). In the northeast U. S., the NAAQS of most concern is the
ozone NAAQS. In order to meet the NAAQS, states in the northeast have developed a
summer time NOx Budget Trading Program that has been in effect for the last three
summers.
Short-term impacts on individual unit operation during 2005 summer are more influenced
by the summer time regulations as opposed to annual regulations because these
regulations are more stringent. For the NOx Budget Program, sources may either install
NOx control technologies or buy allowances from sources that have been overcontrolled.
It is possible that fuel switching between oil and gas can be a problem. Quick start-up of
mothballed units is also allowed under the rules.
Page 30 of 82
Docket No. ER11-1844
Exhibit No. NYI-19
Page 31 of 82
Overall, it is not expected that EPA rules will have a major impact on electric system
reliability through its environmental programs during 2005 summer. State, provincial
and local environmental rules are expected to have more of an impact on electric system
reliability that is described in more detail by Control Area.
The following are the Area assessments discussing environmental related issues.
Maritimes
The Maritimes Area closely monitors air emissions and other environmental discharges
to ensure compliance with standards and limits set forth by Canadian Federal and
Provincial environmental regulations. For the Summer 2005 period, there may be
occasions when some units are required to be de-rated in order to meet these regulations.
However, these occasions are expected to be infrequent and of short duration.
New England
ISO-NE is mindful of environmental restrictions and constraints on New England’s
generating capacity, however it is the responsibility of the resource owners to monitor
their compliance with state or federal standards. In order to mitigate the impact that these
restrictions may have on the availability of generating units within New England,
generator owners are encouraged to pursue temporary waivers to their environmental
permits especially during periods of extreme capacity deficiencies.
New York
There is a limited possibility that there may be a shortage of available capacity in the
New York City metropolitan area due to environmental constraints. An extended period
of high temperatures and high humidity leading to an unacceptable level of ozone in the
region may limit the allowable dispatch of generation to meet load. In 2001 the NYISO
obtained a waiver from the New York State Department of Environmental Conservation
(DEC) to address such an air quality emergency and is continuing to work with the DEC
staff on this concern. Should such a situation arise, it is incumbent on the NYISO to
maximize the availability of generation outside the effected area and insure that all other
steps are taken in accordance with the capacity emergency procedures (NYISO
Emergency Operations Manual). After this the DEC would allow operation outside of
emission limits to avoid curtailment of firm load in New York.
Ontario
There are many environmental issues that specifically affect the operation of facilities in
Ontario during the Summer Operating Period. Compliance with these standards is strictly
monitored by the facility owner.
Some facilities have annual energy limitations to observe permissible emission limits.
These annual limits are not expected to impact the overall energy and capacity
projections for the Summer Operating Period.
Page 31 of 82
Docket No. ER11-1844
Exhibit No. NYI-19
Page 32 of 82
It is also recognized that there is a potential to restrict generation to respect
environmental regulations due to cooling water temperatures etc. The timing and the
overall impact of any restrictions are unpredictable.
Currently it is the facility owner that would request the appropriate authority to permit a
variance from these obligations to assist in a capacity deficiency. Experience gained in
2002 was utilized to revise procedures where the IESO requests the facility owner to
obtain variances to environmental obligations under emergency procedures.
Quebec
The bulk of generation in Quebec is hydroelectric based therefore the environmental
concerns, with respect to air emissions, is not of concern.
Geomagnetically Induced Currents (GICs)
Past experiences have shown the serious effect that geomagnetic disturbances can have
on the NPCC bulk power system. Quasi-DC currents induced in power lines flow to
ground through transformer neutral connections. This can result in saturation of the
transformer core leading to a variety of problems, including increased heating that has
resulted in transformer failures. In addition, the harmonics generated in the transformer,
as a result of the saturation, may produce unanticipated relay operations, such as sudden
tripping of transmission lines or shunt capacitors.
GICs are produced by the magnetic field variations that occur when a mass of electrically
charged particles from a solar coronal mass ejection impacts the earth’s magnetic field.
Because of the low frequency compared to the AC frequency, the geomagnetically
induced currents appear to a transformer as a slowly varying DC current.
GIC flowing through the transformer winding produces extra magnetization, during the
half-cycles when the AC magnetization is in the same direction this effect can saturate
the core of the transformer. This also results in severe distortion of the AC waveform
with increased harmonic levels that can cause incorrect operation of relays and other
equipment on the system and may lead to problems ranging from trip-outs of individual
lines, transformers or shunt capacitors to collapse of the whole system.
GIC activity correlates to 11-year sunspot cycles. We are presently in Cycle 24, which
began in 1996 and is predicted to end about January 2007. During the portion of the solar
cycle that has greater sunspot activity, there is a higher probability of GICs occurring,
which could impact the NPCC system. Observations of sunspot activity only provide
insights as to the timing of the release of energy; it is the solar winds that ultimately
determine the intensity and duration of a geomagnetic storm and those areas of the earth
that will be ultimately affected. A satellite positioned between the earth and the sun is
capable of determining the intensity of the storm. The timing between when this satellite
senses the magnitude of the storm and when the effects are noted on the earth is less than
1 hour.
Page 32 of 82
Docket No. ER11-1844
Exhibit No. NYI-19
Page 33 of 82
The CO-8 Operations Managers Working Group explored ways to obtain accurate and
timely forecasts of solar magnetic disturbances and the resulting GICs for the NPCC
Control Areas. As a result, NPCC contracted for GIC forecasting services from Solar
Terrestrial Dispatch (STD) for a three-year period that began mid-2003. Forecast
information is provided directly to the control centers in the NPCC Areas.
The following chart indicates the solar activity through February 28, 2005.
Monthly updates to this chart and further information can be found at
Sunspot numbers continue their inexorable decline toward an anticipated minimum in
late 2006 or early 2007. The peak in the geomagnetic activity maximum occurred in July
and August 2003. We continue to feel the effects of coronal hole based disturbance
activity which has been quite stable and predictable in producing dominantly minor to
major geomagnetic storm activity once a month, with brief severe-storm level excursions
(K-indices of 7) at isolated locations.
In early 2005, weak to brief moderate GIC activity during these coronal hole disturbances
have been reported from the NPCC. This coronal hole disturbance could persist into the
summer months and bring continued recurrent geomagnetic storm conditions. Assuming
the size and boundaries of the coronal hole do not change appreciably during the next 6
Page 33 of 82
Docket No. ER11-1844
Exhibit No. NYI-19
Page 34 of 82
months or so, the impact dates for the disturbed activity are currently projected for very
early April, very late April, late May, mid-to-late June, mid July, mid-August, early-to-
mid September and early October.
STD’s regular daily forecasts will always provide NPCC staff with at least 72 hours of
advanced notice concerning the arrival of those disturbed periods. K-indices during the
coronal hole disturbances should be expected to reach a minimum of 4 to 5 in the NPCC
region, with slightly higher K-indices of 5 to 6 being common over the more northern
reaches of the NPCC region during the local evening and night hours. Brief severe-storm
level excursions (K-indices as high as 7) have been observed with previous apparitions of
activity. Thus, NPCC operators should be aware of the potential for brief (6 to 12 hour)
K=7 alerts (and perhaps 24 hour-duration K=6 alerts as well) during the height of the
disturbed activity, perhaps once a month. Coronal-hole based disturbances will continue
to be a rather common feature of space weather activity during the next year.
Coronal mass ejections (associated with solar flare activity) will continue to slowly
subside in frequency over the next year. However, the occurrence of unusually strong
coronal mass ejections capable of producing strong geomagnetic activity at the Earth (and
potentially strong GIC activity) will remain possible through the next year. Virtually
every solar cycle on record since geomagnetic activity has been closely monitored has
shown such rogue events to be a problem sometime during the months immediately
preceding the minimum phase of the solar cycle. For example, very strong (K-indices of7
to 9) geomagnetic storms occurred in August 1943 (3 months prior to the solar
minimum), September 1953 (6 months prior to the minimum), September 1963 (13
months prior to the minimum), March 1976 (the same month that solar minimum
occurred), February 1986 (7 months before the minimum) and April 1995 (13 months
prior to the minimum). These were all strong disturbances with A-indices of between
about 80 and 200. We expect to see several strong events during the next 2 years and at
least one very large event prior to the next solar minimum that will probably be unrelated
to the coronal holes. It is, of course, impossible to predict when that next very large event
will take place, but it could occur anytime commencing from this coming summer and
fall through to the winter of 2006.
Overall, most of the days associated with this summer and fall will be fairly quiet with
respect to geomagnetic activity and therefore should be associated with very minimal risk
for GIC activity. During the periods of concern noted above, weak GIC activity will
become possible, with an outside chance for brief periods of moderate GIC activity.
Should a rogue event occur, strong GIC activity would be possible.
The following is a summary of each Area’s experiences of GIC activity and
actions/procedures in place to reduce the impact on the transmission system. The
resultant impact observed in the NPCC Control Areas indicates that the control actions
that are in place appear to reasonably reduce the impact of GIC.
Page 34 of 82
Docket No. ER11-1844
Exhibit No. NYI-19
Page 35 of 82
Maritimes
The Maritimes Area did not experience any significant disturbances in 2004 and no major
problems are anticipated for 2005. The Maritimes Area did perform some limited control
actions reducing exports on interconnections with New England and Hydro Quebec, as
well as, internally on the interconnection between New Brunswick and Nova Scotia. The
Maritimes Area Operating Procedures are consistent with NPCC Operating Procedures
for GIC activity.
New England
In 2004, New England experienced some solar activity that affected the transmission
system operations. Specifically, loadings with inter-area ties were brought to 40% - 90%
of normal ratings. No major problems occurred as a result of these storms. Other minor
storms were experienced in January 2005 but no special actions were taken and no
operating problems occurred.
New York
In 2004, the NYISO experienced one interval of GIC activity high enough that it required
actions to be taken. During the days of November 7 through November 10, 2004 two
periods of elevated solar activity occurred, causing the NYISO to declare the Alert state
twice during the four days. In anticipation of potential impacts from the storms on the
power system, transfer limits were reduced to 95 %. There were no incidents on the bulk
power system in the NYCA attributed to the GIC activity.
Ontario
The procedures that were in place throughout the period of high activity, from 2001 into
2003 and subsequent periods, proved to be adequate to mitigate the impact of GIC.
Recent severe solar storms in November 2004 and January 2005 have reinforced that
these procedures remain valid. During these events, the IESO reduced certain transfer
limit by 10% and maintained low reactive outputs on certain generating units with no
specific power system operations being directly attributed to the solar storm.
Quebec
In 2004, there were only two occurrences of GICs severe enough so that special operating
procedures had to be applied. The first one happened on August 30 which caused voltage
asymmetries as high as 2.6 % on the TransÉnergie network. Maximum transfer limits
were lowered on internal paths and DC links were operated between 40% and 90% of
their capacity for four hours, as recommended by the NPCC C-15 Operating Procedure.
There was no impact on equipment, customers or commercial activities.
The second occurrence happened on November 7 and was of equivalent severity to the
August occurrence but lasted only one hour. During this time, transactions to NEPOOL
via the Phase-2 tie had to be curtailed from 500 MW to 0 MW because this was below
Page 35 of 82
Docket No. ER11-1844
Exhibit No. NYI-19
Page 36 of 82
40% of the capacity of this DC link which is 2,000 MW. Everything else remained
normal.
Operating Procedures
Detailed NPCC Operating Criteria, Procedures, Guides and Reference Documents
provide the Areas with the necessary material to develop and maintain a concise set of
operating procedures that are relevant to maintaining the security of the Control Area by
observing local operating parameters. Listings and descriptions of the documents related
to operational readiness for the Summer Operating Period are summarized in Appendix
III.
The TFCO is systematically replacing the existing operations-related “B” and “C”
documents by adding the requirement language from these documents to “A” documents
and maintaining the non-requirements language in existing or new “C” documents. It is
anticipated that by the end of year 2005 all Reference Documents will be re-designated as
new “C” documents. Thus far, the RD-01 “NPCC Emergency Preparedness Conference
Call Procedure”, RD-03 “Procedures for Communication During Emergencies”, RD-04
“Operating Procedures for ACE Diversity Interchange”, RD-05 “Monitoring Procedures
for Operating Reserve Assistance” and RD-09 “Procedures for Solar Magnetic
Disturbances Which Affect Electric Power Systems” Reference Documents have been
converted to “C” documents C-01, C-36, C-37, C-38 and C-15, respectively. The RD-02
“NPCC inter-Control Area Power System Restoration Reference Document” is scheduled
for conversion by the CO-11 inter-Control Area Restoration Working Group later during
2005. Since the Reliability Assessment for Summer 2004, the following revisions to
NPCC documentation have occurred:
At the time when the 2004 Summer Assessment was being completed NPCC membership
approval was being sought for the A-2 Document, “Basic Criteria for Design and
Operation of Interconnected Power Systems” document. This document received
approval of the full NPCC membership and was fully adopted during Spring 2004.
Changes recommended by the SS-38 Working Group on Inter-Area Dynamic Analysis to
the A-3 “Emergency Operation Criteria” had been implemented in the document to
increase the operating time requirement for under-frequency load shedding relays in
NPCC. Additional changes recommended by SS-38 to clarify the language on generator
under-frequency tripping restrictions and other changes on critical facility testing have
been adopted by the TFCO Reliability Coordinating Committee and NPCC membership
approval will be sought during the second and third quarters of 2005.
Within NPCC the CO-1 Working Group on Control Performance is working to
implement reserve sharing. This will require changes to some of the existing documents.
The C-19 “Procedures During shortages of Operating Reserve” and C-20 “Procedures
During Abnormal Operating Conditions” are being merged into a revised C-20 document.
The C-12 and C-38 documents may also need some revisions to accommodate reserve
sharing. These changes are expected during the second quarter of 2005.
Page 36 of 82
Docket No. ER11-1844
Exhibit No. NYI-19
Page 37 of 82
To be prepared to deal with the constantly changing conditions on the power system,
NPCC routinely conducts weekly operational planning calls between Reliability
Coordinators to coordinate short-term system operations. NPCC has also refined and
expanded its emergency conference call mechanism to enable operational security entities
in NPCC and neighboring regions to communicate current operating conditions and
facilitate the procurement of assistance under emergency conditions. These calls may be
initiated upon the request of any Reliability Coordinator and is coordinated by NPCC
Staff. Due to the commercially sensitive real-time nature of the material discussed, only
signatories to the NERC Confidentiality Agreement for Electric System Security Data
may be party to these calls. Because of moderate weather and no severe, extended
equipment outages only six of these emergency preparedness conference calls were
conducted during 2004.
Each Control Area has complemented the NPCC Procedures and Guidelines with
instructions as they apply to their local conditions. The following is a summary of
activity that Areas have taken to ensure that instructions remain current.
Maritimes
The Maritimes Area Operating Procedures are in compliance with the NPCC Operating
Procedures and are supplemented with local procedures.
New England
Since the implementation of the Standard Market Design (SMD) in March 2003, ISO-NE
has placed a considerable amount of effort reviewing, and revising as necessary, New
England’s Market Rules and Operating Procedures. New England’s Operating
Procedures are in compliance with the NPCC Operating Procedures and are
supplemented with local procedures. There are no special procedures in place for the
operation of the power system during shoulder months.
New York
The NYISO continues to review and refine operating and market processes based on
experience gained through the sustained peak load periods of previous summers. The
positive experience with the initial implementation of the Emergency Demand Response
Program during that period means that program will continue and expand. Staff will
continue the review of Normal and Emergency Operating Procedures to improve the
implementation and usefulness of that and other programs. There continue to be
refinements to the NYISO Market operation based on the experience gained during peak
load period operation, and new products and facilities are being added.
Page 37 of 82
Docket No. ER11-1844
Exhibit No. NYI-19
Page 38 of 82
Ontario
The IESO continuously reviews and revises all operating procedures to ensure that they
are consistent with both NERC and NPCC requirements as well as with the Market Rules
for Ontario.
Throughout the Summer Operating Period, additional NERC Certified System Operators
will be available to supplement Control Room Operations staff as conditions dictate.
Quebec
In the event of a capacity deficiency, TransÉnergie would first ask Hydro-Quebec
Marketing to find additional generation in or out of the Control Area. After this step,
Emergency Operating Procedures, compliant with NERC and NPCC are implemented.
Operating Procedures in Shoulder Months
The uncertainties associated with weather variability and maintenance overruns in the
spring months can quickly lead to resource shortfalls. Past history has indicated that
resource assessment procedures need special attention during this time frame. As a result
of these capacity shortfalls, many of the Areas have taken actions to prevent a
reoccurrence and are described below.
Maritimes
The Maritimes Area Operating Procedures for the shoulder and summer period are
essentially the same as for the summer of 2004 and no changes are anticipated for the
summer of 2005.
New England
ISO-NE’s Outage Coordination staff has reviewed the proposed maintenance schedules
for generators in the Control Area and, where appropriate, has worked with the owners to
adjust their outages in anticipation of load levels that may be experienced in the weeks
prior to or following the summer peak load exposure period. However, there is a
significant amount of capacity scheduled out-of-service in May. If there is a delay in the
return to service date of these MW, the forecasted reserve margin will be affected.
New York
NYISO Scheduling staff has reviewed the proposed maintenance outage schedules for
generators in the Control Area and, where appropriate, have worked with the generator
owners to adjust the outage schedules in anticipation of load levels that may be
experienced in the weeks prior to or following the peak load exposure period.
Page 38 of 82
Docket No. ER11-1844
Exhibit No. NYI-19
Page 39 of 82
Ontario
As stated above, the IESO performs extensive reviews of reliability procedures on a
regular basis. This includes the procedure for maintaining reserve margins and rectifying
negative margins. These procedures are enforced during the shoulder months to ensure
that the necessary control actions are taken in the appropriate time frame if needed to
ensure that planning obligations are met.
Quebec
The TransÉnergie Operating Procedures are updated on a continuous basis to reflect
changes in the regulations, market rules and local procedures. There is not, however, any
special Operating Procedures in the summer or shoulder months because TransÉnergie is
a winter peaking system.
Load Response Programs
Each Area utilizes various methods of demand management. In those Areas where
market based structures have been implemented or are evolving, there has been a shift in
contractual obligations of the interruptible loads. The move is an attempt to manage load
interruption, as a result of demand exceeding resources, by giving industrial and
commercial customers the ability to respond to price signals in the wholesale electricity
marketplace. Many of these programs are in varying degrees of development. The
following is a summary of each Control Area’s current load response programs available
or in development to be available for the Summer Operating Period.
Maritimes
The Maritimes Area is a winter peaking area and does not have any Load Response
Programs. Interruptible and Dispatchable loads are available for use when corrective
action is required within the Control Area.
New England
During times of capacity deficiencies, ISO New England declares ISO New England
Operating Procedure No. 4 - Actions During a Capacity Deficiency (OP-4) that includes;
public appeals for conservation, purchasing emergency energy from the neighboring
control areas, interrupting real time demand response providers, and implementing
voltage reductions.
Interrupting real-time demand response providers is accomplished through the New
England Load Response Program (LRP). Through the LRP, Market Participants or
Demand Response Providers enrolled directly with ISO New England can enter into
agreements with retail customers to encourage them to reduce their electricity
consumption during periods of high prices or peak demand.
Page 39 of 82
Docket No. ER11-1844
Exhibit No. NYI-19
Page 40 of 82
Within the LRP, an asset can reside in one of four distinct programs:
• Day-Ahead Demand Response Program
• Real-Time Demand Response Program
• Real-Time Price Response Program
• Real-Time Profiled Response Program
Participants in the Day-Ahead Demand Response Program will offer an amount of energy
into the Day-Ahead market and, if cleared, will be required to interrupt as offered. Those
participants that do not clear in the Day-Ahead Demand Response Program have the
option to participate in the Real-Time Price Response Program. Within this program,
participants will have the option to voluntarily reduce energy consumption in real time
when the zonal price is or is forecasted to be greater than or equal to $100/MWh.
Participants within the Real-Time Demand Response Program will be involved in one of
two sub-programs based on their response time. Each sub-program will require the
participant to interrupt during pre-specified actions of OP-4.
Participants in the Real-time Profiled Response Program will also be required to respond
during certain action of OP-4.
As of April 1, 2005, 233.5 MW was enrolled in the Day-Ahead Demand, Real-Time
Demand, and Real-Time Profiled Response Program. It should be noted that the amount
of MW available from the LRP, as represented in the Load and Capacity table for New
England (Appendix I), is an estimate of what will be available for the Summer Operating
Period and does not equal that currently enrolled.
New York
The NYISO introduced two load response programs for the New York Market in May
2001. The Emergency Demand Response Program (EDRP) is a program in which
Customers would be paid to reduce their consumption by either interrupting load or
switching to emergency standby generation when requested by the NYISO. During the
Summer 2004 period the NYISO did not experience peak conditions that required
activation of the EDRP.
The Emergency Demand Response Program is continuing for Summer 2005, and NYISO
estimates 269 MW of load relief during peak conditions that is considered “reliable.”
This load relief will be available to support the New York State power system during
capacity emergency periods. This program is in addition to the relief obtained through
the emergency procedures for Operating Reserve Peak Forecast Shortage (Section 4.4.1
NYISO Emergency Operations Manual) or in response to the major emergency state
(Section 3.2 NYISO Emergency Operations Manual). Additionally Special Case
Resources (SCR) are expected to provide 897 MW of load relief under peak conditions
Page 40 of 82
Docket No. ER11-1844
Exhibit No. NYI-19
Page 41 of 82
Ontario
Through out 2004, the IESO-Administered Market saw increases in the number of load
facilities that are willing to be treated as a resource that would be dispatched off the
system by the IESO once the price of energy in the real time market has exceeded the bid
(to Buy) price submitted by the load. The subject load must then reduce their demand
according to the dispatch instructions. Based on indications of additional facilities desire
to become dispatchable, the values have been increased from last years 300 MW to
projected values of between 400 and 430 MW for this assessment period.
In 2002, the IESO instituted an Emergency Demand Response Program to provide
additional demand relief under emergency conditions. The program involves 16 different
customer sites with approximately 400 MW of load contracted in this ancillary service.
When requested, the customers would reduce their demand on a voluntary basis. This
demand response program would be implemented just prior to the interruption of firm
load. The effectiveness of the program has been reviewed and approvals have been
received to extend the program to October 31, 2005.
Quebec
The Quebec Area is a winter peaking system and does not usually need to resort to the
load response programs during the summer, although, of the 1,593 MW of interruptible
power available in winter, 935 MW could be called on if needed during the summer.
Communications Systems with Operators and Customers
There is normally some time lag for control actions to take effect to rectify a resource
deficiency. In the evolving market places there are now many players in Control Areas
where at one time, there were only a few. As a result, simultaneous communications need
to be timely and efficient for multiple resources to respond to directions by the Reliability
Coordinator and quickly mitigate the need for emergency control actions, including the
shedding of load.
Below is a summary of the communication medium that each Control Area utilizes to
communicate emergency situations with generators, transmitters and customers.
Maritimes
The individual Control Centers within the Maritimes Area provide timely and accurate
information regarding the status of the power system to customers via websites, news
releases, high volume Interactive Voice Response System and telephone contact through
Public Affairs and Customer Services departments or Call Centers.
New England
In the event of a capacity deficiency, ISO-NE’s website provides real-time information to
stakeholders and the general public regarding the status of the power system and the
amount of Emergency Energy Transactions requested during peak periods. In addition,
Page 41 of 82
Docket No. ER11-1844
Exhibit No. NYI-19
Page 42 of 82
Control Room operations will convey the necessary information to ISO-NE’s Customer
Service and Corporate Communications Departments so that they can make the necessary
communications to federal and state regulatory agencies and the media. Operations
personnel convey the details of any capacity deficiency to the Satellite Control Centers
and neighboring Control Areas as appropriate.
In addition, ISO-NE creates a seven-day forecast that is posted to the ISO-NE web site.
This posting includes a capacity analysis for the peak hour of each day, detailing the
forecasted amount of surplus/deficient capacity for each future day to illustrate
anticipated system conditions.
New York
The NYISO is continuing implementation of its Inter-Control Center Communications
Protocol communications system (ICCP) allowing bi-directional data communication
directly from the NYISO control center systems to the generating plants. In normal
operation this facilitates the transmitting of schedules and base-points from the NYISO
dispatch system to the generators, and improves the accuracy and timeliness of generator
real and reactive power metering.
The NYISO website now displays information including actual Control Area load in
addition to the real-time zonal pricing information and transmission outage schedules.
Market Participants may also access a “dispatcher notes” page that provides information
on current NYISO system operating conditions.
Ontario
On a daily and weekly basis the IESO issues Security and Adequacy Assessments (SAA).
These supply the Market Participants with detailed adequacy projections on an hourly
resolution for a period of 14 days into the future and on a weekly resolution for the
following two weeks.
The IESO also publishes to Market Participants a System Status Report (SSR) three times
daily by Market Forecasts and Integration during the pre-dispatch period outlining
deviations from the SAA published for days one and two.
The SSR has capability to identify to Market Participants the following Advisories:
• Major Change Advisory, System Advisory and,
• System Emergency Advisory.
To address global adequacy concerns when there is insufficient energy or capacity
available to the IESO-controlled grid or when there are insufficient offers in the real-time
dispatch of the IESO-administered markets, the IESO shift staff can also issue a SSR.
The SSR can be prepared on very short notice. A notice is sent to Market Participants via
their dispatch workstations notifying them that a new SSR has been issued with the
details of the SSR being published to the IESO Public Web site.
Page 42 of 82
Docket No. ER11-1844
Exhibit No. NYI-19
Page 43 of 82
To address local area adequacy concerns, the IESO will direct Market Participants to
submit offers, either via the Market Participant's dispatch workstation or telephone.
While the phone systems and associated infrastructure worked adequately during the
blackout of 2003, the IESO recognized a number of areas of improvement. At the time of
the blackout a Request for Proposal (RFP) was in place to replace the IESO phone
system. This RFP was subsequently revised to include additional requirements, and the
upgraded phone system was place in service prior to the summer 2004 operating period.
The IESO also recognizes the need to communicate with the general public at times when
there might be supply shortfalls. To achieve this, the IESO created a public
communications process to ensure that consumers and industries in the general public
were given all the information they need to make informed choices. This process for
communicating to the general public on resource issues proved to be an effective tool in
2003 for managing the resource shortfalls during the post blackout period.
Quebec
To satisfy demands in Quebec, TransÉnergie solicits additional capacity requirements it
may need through Hydro Quebec Marketing (HQM). If HQM cannot secure the
additional capacity required or there is not sufficient time to fulfill the need identified,
TransÉnergie would take actions including the securing of emergency energy from
neighboring systems, cutting of available interruptible loads, and instituting voltage
reductions. If these measures are deemed to be insufficient and there is adequate time, a
public appeal would be instituted through commercial media. The probability of resorting
to these measures during the summer is very low.
Acquisition of Emergency Energy between Areas
While all Control Areas are resolved to let the marketplace solve operational deficiencies,
there may be occasions where market forces cannot respond in the appropriate manner or
time frame. The following is a summary of ability to transact emergency energy between
adjacent Areas.
Maritimes
The Maritimes Area, through existing agreements with neighboring Control Areas,
namely, ISO-NE and TransÉnergie, has established procedures for the acquisition of
emergency energy.
New England
When the New England control area experiences or is forecasted to experience a shortage
of operating capacity, ISO-NE will request Market Participants to submit Emergency
Energy Transactions (EETs) through the Market System. Through this bid based energy
market, procedures are in place to determine the availability of the emergency assistance
from its neighboring control areas when necessary.
Page 43 of 82
Docket No. ER11-1844
Exhibit No. NYI-19
Page 44 of 82
New York
During 2002, the NYISO completed the process to review and update the emergency
energy provisions in the interconnection agreements with the Control Areas neighboring
New York.
Ontario
The IESO negotiated new operating agreements with the adjacent Reliability Authorities
in 2002 as part of the steps to the new Market in Ontario. These operating agreements
contain provisions for the transaction of emergency energy into and out of Ontario and
are only implemented in the event that market based solutions are not available.
With the opening of the Midwest ISO (MISO) market on April 1, 2005, new
arrangements are required for scheduling and dispatching emergency energy between
Ontario and neighboring entities in Michigan, Minnesota and Manitoba. While the joint
procedure between IESO and MISO has not been approved and implemented, a draft
version was placed in the IESO and MISO control rooms to assist in facilitating the
transaction of emergency energy between entities. IESO and MISO will discuss the
agreement with all involved parties to ensure a common understanding of responsibilities.
Approval and implementation of the final procedure is anticipated prior to the Summer
Operating Period.
Quebec
TransÉnergie has agreements with all the Control Areas neighboring Quebec that detail
the conditions and procedures for acquiring emergency energy.
Training Programs
The Control Area operators routinely receive training as a regular part of their regime.
NPCC will be conducting a dispatcher and schedulers seminar in Saratoga Springs, NY
on May 4 and 5, 2005, for dispatchers and schedulers from each of the Control Areas in
NPCC to share views and experiences. It is also a presentation vehicle for issues of
concern to all NPCC Area operations staff. The seminar will include the summer outlook
for each Area, significant recent developments in NPCC and NERC, an update on NPCC
criteria and procedures, and a review of recent events in the industry. The schedulers in
attendance will review the intricacies of their system and the impact of other areas on
their system.
Maritimes
The Member companies that comprise the Maritimes Area routinely conduct their own
operator training sessions and participate in NPCC Operators training seminars. The
operators in the New Brunswick Control Center are NERC certified. The Maritimes Area
participates in the CO-2 Dispatcher Training Working Group.
Page 44 of 82
Docket No. ER11-1844
Exhibit No. NYI-19
Page 45 of 82
New England
Throughout the year, ISO-NE Operators and satellite control center personnel participate
in training session in preparation for both the summer and winter peak load period.
During the training sessions, applicable NPCC procedures and ISO New England
emergency operating procedures are reviewed in detail. The summer capacity assessment
is also reviewed as well as area-specific voltage control issues and intra-area
communication procedures. The NERC certification program at ISO-NE is a NERC
accredited training program.
New York
NYISO Dispatcher Training staff will be conducting two weeks of in-house training for
each crew of NYISO dispatchers prior to the summer of 2005. These sessions will
address operations issues, updates on NERC activities (Policy 9, Infrastructure Protection
Initiative, E-tag, etc.), NPCC policy changes, updates on NYISO market operations and
market design, updates to NYISO applications and procedures.
NYISO Dispatcher Training staff will also present one week System Operator Training
Seminars for a combined audience of the NYISO and New York Transmission Owner
(TO) dispatcher crews. This program will review selected NYISO operating policies,
recent system events, the system outlook for the Summer 2005, and address issues of
mutual concern to both TO and NYISO dispatchers. NYISO emergency operation
procedures (Back-up Dispatch System, Alternate Control Center operation, and
Restoration) will be reviewed in preparation for the spring drills.
Ontario
The IESO continuously operates a training program to ensure that the control room staff
maintains awareness of current and new NERC, NPCC and local operating procedures.
In preparation for the summer operating period, the IESO has set aside time in the
training program for Shift Operations staff to review results of the IESO summer
capability assessments, review reactive dispatching techniques as well as, a review of the
changes to emergency procedures.
Additionally, the IESO plans and participates in drills and exercises on a regular basis to
hone emergency preparedness skills and test procedures by simulating real events.
In 2004 the IESO led six reliability Training sessions followed by extensive table top
restoration drills at locations across the province. The objective was to enhance
participants understanding of reliability requirements and improve the response
capabilities of the IESO and Market Participants during restoration situations. The
training and drills successfully met all objectives. Two similar drills are planned for late
May and early June in preparation for a full-scale restoration drill in the fall of 2005.
Lastly, each shift at the IESO will perform a Rotational Load Shedding simulation
exercise prior to the summer operating market commencement. This exercise will test
Page 45 of 82
Docket No. ER11-1844
Exhibit No. NYI-19
Page 46 of 82
procedures and training as well as verify communication methodologies and validate
revised load shedding schedules.
Quebec
Aside from the continual training of the operations personnel of TransÉnergie, there are
monthly and seasonal meetings where anticipated conditions are discussed and new
procedures are explained.
Page 46 of 82
Docket No. ER11-1844
Exhibit No. NYI-19
Page 47 of 82
8.
2004 Post-Seasonal Assessment and Historical Review
Summer 2004 Post-Seasonal Assessment
The following summarizes some highlights of the review. Please refer to the NPCC
Reliability Assessment for Summer 2004 for details on projections.
NPCC
The actual NPCC coincident peak demand during the 2004 Summer Operating Period
was 97,296 MW at hour 16:00 on July 22. This was 5,144 MW (5%) lower than the
102,440 MW 2003 summer NPCC coincident peak and was relatively low because of the
moderate weather experienced during the 2004 summer.
Maritimes
The peak load experienced by the Maritimes Area during the 2004 Summer Operating
Period was 3,635 MW on May 25, which was approximately 287 MW (-7.3%) lower
than last year’s forecast of 3,922 MW. This is due to the peak occurring in May, a
shoulder month, and the Area was experiencing above normal temperatures resulting in
less heating load than was forecasted. The forecast of 4,000 MW for 2005 is expected to
occur the first week of May, a month where heating load is forecasted.
The Maritimes Area did not anticipate, nor did it experience, any capacity shortages
during the summer of 2004. In fact, it was able to supply up to 700 MW (interconnection
limit) to New England. However, transmission constraints due to excess generation in
Northern New England sometimes reduced the power that could be transmitted.
New England
The peak demand for the summer of 2004 was 24,116 MW and occurred hour ending
1600 on August 30. This was 1,232 MW less than the all time summer peak demand of
25,358 MW that was experienced during the summer of 2002.
Overall, the weather during the 2004 Summer Operating Period was near normal with
average New England temperatures exceeding 90 degrees F (32 degrees Celsius) on one
day. ISO New England Operating Procedure No. 4 - Actions During a Capacity
Deficiency (OP-4) was only called at one time during 2004. This occurred on August 20,
2004 and was confined to the Boston area. OP-4 was called on during that day due to a
severe lightning storm that caused multiple trips in that area. No other significant events
occurred over the 2004 Summer Operating Period.
Page 47 of 82
Docket No. ER11-1844
Exhibit No. NYI-19
Page 48 of 82
New York
The New York Control Area did not experience the above-average temperatures
associated with design conditions during the summer of 2004, and therefore did not
realize the forecast peak of 31,800 MW. The summer 2004 NYISO peak load of 28,433
MW occurred on June 9. The NYCA summer peak loads that achieve or surpass the
forecast peak loads typically occur during July and August during extended periods (3 to
4 days) of above-average temperatures and humidity levels. During the summer 2004
temperatures rarely exceeded historic average levels, and these moderate temperatures
account for the 3,367 MW difference between the peak load and the forecast. The
NYISO ICAP requirement of 37,524 MW for the summer period was sufficient to meet
load and reserve requirements.
Ontario
The peak demand for the summer of 2004 was 23,976 MW and occurred on July 22,
2004. The weekly demands experienced during the summer of 2004 are reflective of the
near normal or cooler than normal weather Ontario saw through most of the summer. As
a result of the mild temperatures, no significant reliability issues were observed, and the
demands were easily met.
Comparing the average weekly temperature in Toronto for the summer of 2004 with the
historical average weekly temperature and the demands experienced, illustrates the
correlation between the weather and demands.
Weekly Average Temperature - Toronto
22.0
20.0
18.0
16.0
14.0
12.0
Weekly Ave. Temp.
Weekly Ave. Hist.
10.0
8.0
Week beginning
The following chart is reflective of the number of days the maximum daily temperature
exceeded the historical average maximum. This also notes that while May and June were
Page 48 of 82
Docket No. ER11-1844
Exhibit No. NYI-19
Page 49 of 82
near normal, July and August were cooler than normal with September generally being
warmer than normal but not an extreme.
May
June
July
August
September
Days Max
Historical
11.8
23.6
30.1
28.8
16.7
Temperature
above 20oc
2004
12
22
30
29
26
Days Max
Historical
0.43
2.3
5.7
3.2
0.8
Temperature
above 30oc
2004
0
2
1
0
0
The following chart shows the actual Ontario hourly peak demands for each week against
the demand curves forecasted in the NPCC Reliability Assessment for Summer Operating
Period of 2004. It can be noted that the lower than normal demands in June and July and
early August are consistent with the temperatures experienced for the weeks in question
while the higher than normal demands in September relate directly to the higher than
normal temperatures experienced at that time of the year.
Ontario Demand Summer 2004
26,000
25,000
24,000
23,000
22,000
21,000
20,000
Weather Normal Forecast Demand
19,000
Weather Normal + 1LFU Forecast Demand
Extreme Weather Forecast Demand
2004 Actual Hourly Peak
18,000
Week Beginning
Quebec
The 2004 Quebec summer peak load was 21,949 MW which occurred on May 4, 2004.
This was 432 MW above the expected peak load. On this day, the temperatures were
below normal all over the province.
The summer of 2004 in Quebec was mild compared to recent years with no major heat
waves. The hottest day of the summer was on August 26 when the heat and humidity
index only reached 33 degrees Celsius (92 degrees Fahrenheit) and the peak load on this
day was 19,948 MW. In previous years, the heat and humidity index reached as much as
42 degrees Celsius (108 degrees Fahrenheit) on a few days every summer.
Page 49 of 82
Docket No. ER11-1844
Exhibit No. NYI-19
Page 50 of 82
Winter 2004/2005 Post-Seasonal Assessment
The following summarizes some highlights of the review. Please refer to the NPCC
Reliability Assessment for Winter 2004/2005 for details on projections.
Maritimes
The coincident peak load experienced by the Maritimes Area during the December 2004
- January 31, 2005 period was 5,418 MW, which was approximately 5 MW (-0.1%)
lower than the forecast of 5,423 MW. For the period between November 28, 2004 and
January 31, 2005, the difference between forecasted load verses the actual load ranged
from 0.4% to -10.2%. This was due to above normal temperatures which resulted in a
lower electric heating load than would normally be the case.
The Maritimes Area did not anticipate, nor did it experience, any capacity shortages
during the 2004/2005 Winter Operating Period.
137 MW of new capacity was added during the Winter.
New England
As of February 1, 2005, the peak demand for the 2004-2005 Winter Operating Period was
22,524 MW (preliminary peak demand) and occurred hour ending 1800 on December 20,
2004. This was 154 MW higher than the forecast for this period of 22,370 MW and 294
MW less than the all time winter peak demand of 22,818 MW that was experienced
during the 2003-2004 winter.
The first cold weather of the 2004-2005 winter was experienced on December 6, 2004
where temperatures were in the 20’s (Fahrenheit) during the time of the evening peak
load. Due to the cold weather and forecast deviations in load, external transactions, and
outages and reductions, ISO-NE implemented OP-4 beginning 1706. ISO-NE received
the appropriate response from the procedure and cancelled OP-4 at 1910 that evening.
No other major operating events have occurred thus far during the 2004-2005 Winter
Operating Period.
New York
The New York Control Area experienced its all-time winter peak load of 25,541 MW on
December 20, 2004. The combination of below average temperatures and the high point
of the holiday lighting period contributed to reaching the peak load. The Winter 2004-05
forecast peak load was 25,620 MW, or 79 MW higher than the actual peak load. Since
the NYCA is summer peaking the ICAP requirement of 37,524 MW for this capability
period was more than sufficient to meet load and reserve requirements during the peak.
Page 50 of 82
Docket No. ER11-1844
Exhibit No. NYI-19
Page 51 of 82
Ontario
The peak demand for the Winter operating period 2004 / 2005 was 24,979 MW and
occurred on December 20, 2004. The weekly demands experienced during the Winter
Operating Period of 2004 / 2005 are reflective of the temperatures observed.
Comparing the average weekly temperature in Toronto for the Winter Operating period
with the historical average weekly temperature and the demands experienced, illustrates
the correlation between the weather and demands.
Weekly Average Temperature - Toronto
2.0
Week Beginning
0.0
-2.0
-4.0
-6.0
-8.0
-10.0
Actual Average Weekly Temp
Historical Average Temp
-12.0
-14.0
The following chart shows the actual Ontario hourly peak demands for each week against
the demand curves forecasted in the NPCC Reliability Assessment for Winter 2004 /
2005. The demands observed are consistent with the temperatures experienced for the
weeks in question. For example, the higher demands observed in 1 week in December
and 2 weeks in January are consistent with the lower than normal temperatures.
Page 51 of 82
Docket No. ER11-1844
Exhibit No. NYI-19
Page 52 of 82
IESO Demands Winter 2004 / 2005
25,500
Normal Forecast (MW)
Normal + 1 LFU (MW)
Extreme Forecast (MW)
Weekly Actual Peak
24,500
23,500
22,500
21,500
20,500
Week Beginning
During each of these three "cold" weeks, the temperature was forecasted to drop below -
20 degrees Celsius (-4 degrees Fahrenheit) in Southern Ontario. In each case, the IESO
implemented procedures designed to safeguard the reliability of the bulk electrical system
during periods of extreme cold weather. During the "cold" period in January, low-density
alarms on certain SF6 insulated equipment was received, as well some as reductions in
generation capacity were experienced. The reductions in generation capacity were mainly
due to coal handling problems and ice blockages at hydroelectric facilities. None of these
generation or transmission problems required the implementation of extraordinary
actions.
A Geomagnetic storm of K8 intensity was forecasted for January 21, 2005. The IESO, as
part of their procedures for GICs, reduced certain transmission limits by 10%. No
problems, other than elevated GIC currents, were experienced.
Quebec
For the Winter 2004/2005, the peak demand occurred at 6:00 p.m. on monday December
20, 2004 and reached 34,956 MW. This is 1,312 MW (3.6 %) lower than the all-time
historical peak of 36,268 MW which happened on January 15, 2004.
The 2004/2005 winter peak occurred when an unexpected cold snap hit the province. The
temperature in Montreal dropped to -25 degrees Celsius with winds of 26 km/hr (-13
degrees Fahrenheit with winds of 16 mph) which could be felt as a wind chill factor of
-38 degrees Celsius (-36 degrees Fahrenheit). The cold snap had begun the day before, a
Sunday, and had been going on for more than 24 hours when the peak load was reached.
This fact, combined with daylight being at its minimum during this time of year and the
added effect of Christmas lights, contributed to the increase in total load that made it
higher than it would have been in January for the same temperature and wind conditions.
Page 52 of 82
Docket No. ER11-1844
Exhibit No. NYI-19
Page 53 of 82
During the hours surrounding the peak demand, Hydro-Québec used up to 3,316 MW of
load balance management procedures (675 MW of purchases from independent
Producers, 969 MW of load response programs, 327 MW of imports, 745 MW of gas-
turbine units and 600 MW of export recalls) and managed to sustain the total of its
operating reserves without resorting to any Energy Emergency Alert level.
In the middle of January 2005, another cold snap occurred and lasted for almost a week.
During this period, the demand reached 34,850 MW on January 18, just 106 MW below
the peak reached in December.
Historical Review (Pre-2004)
The historical non-coincident peaks for each NPCC Area, the forecasted 2005 summer
peak for each NPCC Area, and the forecasted NPCC Coincident peak for 2005 are
summarized in the table below.
Table 1
Historical Peak Demands by Area Occurring May to September (MW)
Total NPCC
New
New
Year
Ontario7
Maritimes
Quebec
Non-Coincident
England
York
Demand
1993
20,883
2,773
19,570
25,998
17,500
86,724
1994
20,918
2,797
20,519
27,062
17,562
88,858
1995
21,674
2,958
20,499
27,206
17,960
90,297
1996
21,378
2,937
19,507
25,587
18,193
87,602
1997
21,613
3,252
20,569
28,700
17,983
92,117
1998
22,443
3,314
21,406
28,166
18,463
93,792
1999
23,435
3,249
22,544
30,311
18,965
98,504
2000
23,222
3,630
22,049
28,138
20,600
97,639
2001
25,269
3,640
24,967
30,982
20,052
104,910
2002
25,414
3,731
25,348
30,664
20,525
105,682
2003
24,753
3,901
24,685
30,333
20,551
104,223
2004 Forecast
23,668
3,922
25,735
31,800
21,517
106,642
2004 Actual
23,976
3,635
24,116
28,433
21,949
102,109
2005 Forecast
23,8978
4,000
26,355
31,962
22,083
108,2979
7 20 minute Peak Demand 1993 to 2001, peak hourly demand thereafter
8 This value is the weather normal demand used for the base case analysis. A graph in Section 4 represents
the ranges of potential demands that the IESO could experience as a result of weather variables.
9 The forecast coincident peak demand for NPCC is 106,618 MW which is expected to occur during the
week beginning July 10, 2005
Page 53 of 82
Docket No. ER11-1844
Exhibit No. NYI-19
Page 54 of 82
9.
2005 Reliability Assessments of Neighboring Regions
East Central Area Reliability Coordination Agreement (ECAR)
Demand and Energy
ECAR’s total internal demand forecast for the summer of 2005 is 103,679 MW. This is
1,125 MW higher than the peak demand projected for summer 2004. This demand
forecast is derived from the aggregate demand forecasts of the ECAR member
companies, based on expected summer weather. Demand side management programs
and interruptible demand contracts that could be curtailed, if necessary, are expected to
total 2,508 MW at the time of the summer peak. At the present time, members have
arranged for 1,600 MW of power sales to entities outside the ECAR region. There is also
62 MW of capacity owned by a company outside of the region, resulting in a total export
of 1,662 MW.
Resource Assessment
Net capacity resources to serve demand within ECAR are projected to be 127,684 MW
(net seasonal capability), which is 673 MW higher than in last summer’s assessment.
ECAR’s capacity margin is projected to be 20.8%, compared to 21.3% expected last
summer.
At this time, members have made arrangements to purchase 1,974 MW. An additional
1,445 MW of member owned capacity is located outside of the region, for a total
expected import of 3,419 MW.
Of the 571 MW of new capacity expected to meet the 2005 summer peak, 567 MW is
expected to be placed in service prior to the start of the summer. Only 4 MW is expected
to go in service during the summer.
The ECAR region does not anticipate any fuel delivery problems this summer. The most
likely impact of extreme summer weather on fuel supplies would be restricted barge
travel on some rivers due to low water levels from a prolonged drought. The fuel
stockpiles at effected coal plants would mitigate the effects of any reduced deliveries by
water.
Based on the projections of connected demand, generation, and interchange power
contracts, ECAR calculates a probability of exceeding the margin available for
contingencies (capacity resources minus the sum of peak demand, expected maintenance,
and operating reserve requirements). For this summer, ECAR projects a 22% likelihood
that it will exceed the margin for contingencies and need to rely on supplemental capacity
resources at the time of the summer peak demand. Supplemental capacity resources may
include additional purchases of power, curtailment of contractually interruptible loads,
and curtailment of demand-side management (DSM) loads. ECAR does not anticipate
any reliance on supplemental resources for average daily conditions this summer.
Page 54 of 82
Docket No. ER11-1844
Exhibit No. NYI-19
Page 55 of 82
ECAR members recognize that there are combinations of adverse conditions that could
make it necessary to curtail demand beyond contractually interruptible loads and
demand-side management. Such extreme conditions include, but are not limited to:
abnormally hot, humid weather; unexpected low generator availability; an inability to
purchase additional power; and transmission constraints that limit the deliverability of
capacity resources. A combination of adverse conditions that would make it necessary to
curtail firm load is not expected.
Reliance on Outside Resources
No analysis was conducted to determine an expected amount of external resources that
would be needed this summer, since the ECAR region does not have an established
regional reserve requirement. The 1,757 MW of net import listed above could be
increased by an additional 2,743 MW of import based on regional studies of simultaneous
import from three out of five adjacent export areas. This total import of 4,500 MW is the
minimum expected to be deliverable if and when it is necessary to import power.
Fuel Supply Interruptions
The impact of potential fuel supply interruptions are not explicitly calculated or included
in the ECAR 2005 Summer Assessment of Load and Capacity. Nuclear and coal fueled
generation accounts for 70% of ECAR capacity. Approximately 26% of the ECAR
capacity is fueled with oil or gas. The fuel inventories maintained at coal plants would
mitigate any short-term coal supply interruptions. The gas-fired units are predominately
peaking units. Due to the reduced heating demand in the summer, overall use of natural
gas during the summer is much lower. Because of the reduced demand for gas and the
peaking duty cycle of most regional gas generation, ECAR expects minimal impact from
any gas supply interruption during the summer.
Deliverability of Generation
An analysis of simultaneous import into ECAR from three of the five adjacent external
areas (three regions and two sub-regions) has resulted in the minimum expected
deliverable import of 4,500 MW used in ECAR’s 2005 Summer Assessment of Load and
Capacity. A load flow analysis of the ability to move power within ECAR from one area
to another has identified numerous potential limitations based on first contingency
transfer capability. By factoring the availability of generating units into the load flow
analysis, the amount of capacity that would not be available due to deliverability
limitations is expected to be 2,050 MW.
Transmission Assessment
Transmission operators and Reliability Coordinators must remain diligent to monitor,
communicate, and coordinate their actions to preserve the reliability of the ECAR
transmission system for the summer 2005 period.
Historically, ECAR has experienced widely varying power flows due to transactions and
prevailing weather conditions across the Midwest. As a result, the ECAR transmission
Page 55 of 82
Docket No. ER11-1844
Exhibit No. NYI-19
Page 56 of 82
system could become constrained during peak periods as a result of unit unavailability
and unplanned transmission outages concurrent to large power transactions. For the first
time this summer, a large portion of the ECAR area will be operating in a real time
energy market. Consequently, market redispatch has the potential to mitigate some of
these potential constraints. Notwithstanding the benefit of market redispatch, should
these conditions occur, local operating procedures, as well as the NERC TLR procedure,
will be required to maintain adequate transmission system reliability. As long as the
Reliability Coordinators and transmission operators recognize transmission limitations in
“real time” operations so that operating procedures may be implemented in a timely
manner, no cascading events are anticipated.
No significant transmission facility additions have been placed in service prior to the
summer peak load period since last summer. However, two new protective schemes are
planned to be in-service before this summer. FirstEnergy plans to install an under
voltage load shed (UVLS) scheme in the northern Ohio and western Pennsylvania area.
This scheme will have the capability to shed a total of about 1,300 MW and is to provide
an effective method to prevent uncontrolled loss-of-load following extreme outages.
Also, Allegheny Power plans to install a Special Protection System (SPS) to alleviate an
excessive amount of TLRs from being called in the West Virginia panhandle area.
Certain critical flowgates that have experienced TLRs in previous summers continue to
be identified as heavily loaded in various reliability assessments and might require
operator intervention to ensure adequate reliability levels are maintained.
To prepare for this summer, ECAR has analyzed more than 360 study scenarios and over
two-dozen voltage scenarios in its transmission seasonal assessment process. These
voltage analyses include the most critical contingencies from each ECAR transmission
owner. In addition, the assessment includes a ranking of circuits that frequently appear as
a constraint, a tabulation of reactive resources within the ECAR Region, and additional
results of voltage performance for identified contingencies.
To ensure that ECAR’s transmission owners have conducted sufficient analyses and to
complement the Regional efforts, ECAR has conducted peer reviews of member
transmission assessments for both this summer and long-term time frames. The seasonal
assessments include both thermal and voltage analyses for a base case and stressed case
conditions with single, double, and if warranted, extreme contingencies. The results of
these assessments are communicated to ECAR’s Reliability Coordinators and
transmission operators.
ECAR actively participates in the MAAC-ECAR-NPCC (MEN), MAIN-ECAR-TVA
(MET), and VACAR-ECAR-MAAC (VEM) interregional seasonal transmission
assessment efforts. Transfer capability results for ECAR are shown in the map included
in this report and are also included in each of the interregional seasonal reports.
Operational Issues
Page 56 of 82
Docket No. ER11-1844
Exhibit No. NYI-19
Page 57 of 82
As a result of the August 14, 2003 blackout, ECAR has addressed all of the operational
concerns stated in both the NERC and ECAR recommendations that were due by the
summer of 2005. In conjunction with NERC, ECAR has performed operation readiness
audits on nine of the twelve ECAR Control Areas and two of the three Reliability
Coordinators that are responsible for ECAR Control Areas. The remaining Control Area
readiness audits will be completed by year-end 2005. The remaining Reliability
Coordinator readiness audit will be completed in 2006.
MISO started their market operations on April 1, 2005. This may result in different
generation being used to satisfy load within the ECAR region during the summer of 2005
from what was used during the summer of 2004.
In addition to the NERC TLR procedure, other operating procedures are available to
maintain reliable system operations. These include:
A multiregional agreement involving Control Areas around Lake Erie to use generation
redispatch to mitigate emergency TLR procedures and curtailments in situations where
the affected system(s) is about to curtail firm demand.
Operating procedures will be used to reduce the risks of potential widespread
interruptions that may result from EHV outages overloading the stability-limited
Kanawha-Matt Funk 345 kV circuit until AEP’s Wyoming-Jacksons Ferry 765 kV line is
completed, which is scheduled for June of 2006.
The Voltage Coordination Plan may be used in Eastern ECAR, MAAC and the VACAR
subregion of SERC to curtail or limit west-to-east transfers to ensure adequate reliability
in that part of the system.
Additional details on the demand and capacity assessment, ECAR report 05-GRP-33, is
available on the ECAR website (
www.ecar.org). Detailed information on the
transmission assessment, report 05-TSPP-3, is available by contacting the ECAR office.
Page 57 of 82
Docket No. ER11-1844
Exhibit No. NYI-19
Page 58 of 82
Mid-Atlantic Area Council (MAAC)
Demand and Energy
The Mid-Atlantic Area Council (MAAC) 2005 summer forecast net peak demand is
56,817 MW. This forecast includes the effects of interruptible demand and load
management capabilities, which are estimated to be 813 MW. The forecast peak assumes
normal summer weather conditions. This forecast is 1,248 MW higher than the actual
MAAC all-time summer peak of 55,569 MW that occurred on August 14, 2002.
Resource Assessment
Between June 1, 2004, and mid-July 2005, MAAC’s summer generating capacity is
expected to increase by a net of 3,001 MW to 68,188 MW. 2,009 MW of the expected
increase is already in service. All nuclear units should be in service and at full capacity
(13,472 MW) at the time of the peak. MAAC also has 59 MW of external capacity
purchases under contract through the summer peak period. With the planned new
generation, existing internal generation, and external capacity purchases included, the
MAAC capacity margin is forecasted to be 16.7% at the time of the forecasted peak. The
MAAC reserve margin is expected to be 20.1% at the time of the forecasted peak.
Transmission Assessment
In addition to the required level of capacity reserves, MAAC requires that the capacity
resources be able to be delivered to the load. There have been additional generation
retirements since last summer. Even with the installation of the third 500/230 kV
transformer bank at Branchburg and additional facilities as defined in the PJM Regional
Transmission Expansion Planning process, reliability must-run contracts have been
negotiated to the overall MAAC generation and transmission combined Loss of Load
Event probability remains above the MAAC adequacy requirement of one occurrence in
ten years.
Operational Issues
MAAC expects to have sufficient generating capacity to serve the 2005 forecast summer
peak demand. When MAAC served its all-time summer peak on August 14, 2002, no
emergency procedures were implemented.
The bulk transmission system is expected to perform adequately over a wide range of
system conditions. PJM, the Regional Transmission Organization (RTO) for the MAAC
Region, is well prepared for operating emergencies. Practice drills are being regularly
conducted in preparation should there be an extremely hot summer.
Reliance on Outside Assistance
With a net reliance on outside capacity of only 59 MW, MAAC has no great reliance on
outside capacity. External units that are considered capacity in MAAC must sign an
agreement that if a PJM capacity emergency is called, that unit’s capacity must flow to
Page 58 of 82
Docket No. ER11-1844
Exhibit No. NYI-19
Page 59 of 82
PJM. Transmission availability is secured before an external unit can be called MAAC
capacity.
MAAC has a net of 826 MW of long-term firm transmission service in place for energy
sales out of MAAC through the summer peak period. Presently, these transactions are not
capacity backed and therefore can be curtailed in the event of a PJM capacity emergency.
Historically, approximately 1,100 MW of internal capacity has been transferred out of
MAAC on peak summer days.
Fuel Supply Interruptions
Fuel supply interruptions were not considered in our summer assessment because
historically fuel interruptions have not been a problem in the summer. MAAC has a
diverse fuel mix with no great reliance on any one fuel. MAAC’s highest primary fuel
percentage is coal at 31%. Our hydro component, which is typically the type of generator
that is interrupted in the summer, is only 5%.
Regional Deliverability Procedures
The delivery of energy from the aggregate of available capacity resources in one PJM
electrical area and adjacent non-PJM areas to another PJM electrical area experiencing a
capacity deficiency is the Load Deliverability test that has been utilized within PJM for
some time. It is often discussed in the context of demonstrating the "deliverability to the
load" as opposed to the "deliverability of individual generation resources". This ensures
that, within accepted probabilities, energy will be able to be delivered to applicable PJM
area load, regardless of cost, from the aggregate of capacity resources available to PJM.
PJM determines the Regional Capacity Requirement to achieve this reliability objective
assuming sufficient network transfer capability will exist. The energy from generating
facilities that are ultimately committed to meet this capacity requirement must be
deliverable to wherever they are needed in a capacity emergency. Therefore, there must
be sufficient transmission network transfer capability within PJM. PJM determines
sufficiency of network transfer capability through a series of Deliverability tests.
It is important to point out that deliverability ensures, only, that the aggregate of capacity
resources can be utilized to deliver energy to the aggregate of load. Deliverability
guarantees a generator the status of a "certified" capacity resource with respect to the
installed capacity obligations imposed under the Reliability Assurance Agreement. It
does not guarantee any rights to specific generators to deliver energy to specific loads
within PJM. Nor does it guarantee any rights to generators to produce energy during any
particular set of operational circumstances. Deliverability ensures that PJM can be
operated within applicable Reliability Criteria and, guarantees within those criteria that
regional load will receive energy, with no guarantee as to price, from the aggregate of
capacity resources available to PJM.
The specific procedures utilized to test deliverability involve the calculation of Capacity
Emergency Transfer Objectives (CETO) and Capacity Emergency Transfer Limits
(CETL) for various electrical sub-areas of PJM. A CETO represents the amount of
Page 59 of 82
Docket No. ER11-1844
Exhibit No. NYI-19
Page 60 of 82
energy that a given sub-area must be able to import in order to remain within an LOLE of
1/25 when that sub-area is experiencing a localized capacity emergency. A CETL
represents the ability of the transmission system to support deliveries of energy to an
electrical sub-area experiencing such a capacity emergency. Providing that the CETL for
a given area exceeds the CETO for that area, the test is passed and, on a probabilistic
level, the area will be able to import sufficient energy during emergencies. The
transmission system is tested at a LOLE of 1/25 so that the transmission risk is
significantly less than the loss of load due to the inadequacy of generation resources. The
transmission risk was accepted as 1/25 so as not to unacceptably degrade the overall PJM
loss of load probability.
Page 60 of 82
Docket No. ER11-1844
Exhibit No. NYI-19
Page 61 of 82
Appendix I - 2004 Expected Load and Capacity Forecasts
Table 1 - NPCC Summary
Week
Installed
Total
Load
Interruptible
Known
Req. Operating
Unplanned
Net
Bottled
Revised
Beginning
Capacity
Purchases
Sales
Capacity
Forecast
Load
Maint./Derat.
Reserve
Outages
Margin
Resources
Net Margin
Sundays
MW
MW
MW
MW
MW
MW
MW
MW
MW
MW
MW
MW
1-May-05
146,309
1,300
176
147,433
87,159
2,271
29,101
6,927
9,817
16,699
0
16,699
8-May-05
146,209
1,300
176
147,333
89,178
2,274
24,451
6,927
9,816
19,234
31
19,203
15-May-05
146,309
1,300
176
147,433
91,218
2,275
21,696
7,256
9,816
19,722
959
18,762
22-May-05
146,309
1,300
176
147,433
92,588
2,275
18,095
7,256
9,817
21,951
1,875
20,076
29-May-05
143,418
1,300
176
144,542
94,419
2,257
17,274
7,106
9,217
18,782
1,577
17,206
5-Jun-05
143,443
1,300
176
144,567
98,695
2,255
15,211
7,106
9,220
16,591
1,578
15,013
12-Jun-05
143,443
1,300
176
144,567
101,282
2,267
13,445
7,106
9,220
15,780
2,708
13,072
19-Jun-05
143,443
1,300
176
144,567
103,101
2,266
13,840
7,106
9,220
13,566
2,451
11,115
26-Jun-05
143,452
1,300
176
144,576
104,952
2,269
13,079
7,106
9,220
12,488
3,387
9,100
3-Jul-05
143,831
1,300
176
144,955
106,498
2,274
13,496
7,156
8,512
11,568
2,412
9,156
10-Jul-05
143,831
1,300
176
144,955
106,618
2,271
11,934
7,156
8,512
13,006
3,375
9,631
17-Jul-05
143,831
1,300
176
144,955
106,065
2,257
11,619
7,156
8,512
13,860
3,882
9,978
24-Jul-05
143,831
1,300
176
144,955
105,794
2,267
10,309
7,156
8,512
15,451
4,645
10,806
31-Jul-05
143,822
1,300
176
144,946
105,954
2,259
9,528
7,156
8,512
16,055
5,109
10,946
7-Aug-05
143,822
1,300
176
144,946
106,153
2,269
10,186
7,156
8,512
15,208
4,831
10,377
14-Aug-05
143,822
1,300
176
144,946
105,883
2,271
13,624
7,156
8,512
12,042
1,385
10,657
21-Aug-05
143,822
1,300
176
144,946
105,344
2,275
11,907
7,156
8,512
14,302
3,321
10,982
28-Aug-05
143,828
1,300
176
144,952
105,749
2,272
14,008
7,156
8,512
11,799
2,456
9,343
4-Sep-05
143,828
1,300
176
144,952
97,738
2,257
14,084
7,156
8,512
19,719
3,173
16,546
11-Sep-05
143,828
1,300
176
144,952
95,367
2,278
17,667
7,156
8,512
18,527
912
17,615
18-Sep-05
143,828
1,300
176
144,952
94,009
2,277
17,859
7,156
8,512
19,692
1,754
17,938
25-Sep-05
143,828
1,300
176
144,952
92,268
2,274
19,753
7,156
8,512
19,537
1,171
18,366
Page 61 of 82
Docket No. ER11-1844
Exhibit No. NYI-19
Page 62 of 82
Table 2 - Maritimes
Week
Installed
Firm
Firm
Total
Load
Interruptible
Known
Req. Operating
Unplanned
Net
Beginning
Capacity1
Purchases
Sales2
Capacity
Forecast
Load
Maint./Derat.
Reserve
Outages
Margin
Sundays
MW
MW
MW
MW
MW
MW
MW
MW
MW
MW
1-May-05
6,320
0
400
5,920
4,000
610
952
525
265
788
8-May-05
6,320
0
400
5,920
3,941
613
971
525
263
832
15-May-05
6,420
0
400
6,020
3,875
614
455
854
263
1,186
22-May-05
6,420
0
400
6,020
3,812
614
646
854
265
1,057
29-May-05
6,420
0
450
5,970
3,705
596
855
704
265
1,037
5-Jun-05
6,420
0
450
5,970
3,667
594
745
704
267
1,181
12-Jun-05
6,420
0
450
5,970
3,627
597
671
704
267
1,297
19-Jun-05
6,420
0
450
5,970
3,605
596
671
704
267
1,318
26-Jun-05
6,420
0
450
5,970
3,561
599
808
704
267
1,227
3-Jul-05
6,420
0
450
5,970
3,553
604
759
754
267
1,241
10-Jul-05
6,420
0
450
5,970
3,561
601
792
754
267
1,196
17-Jul-05
6,420
0
450
5,970
3,599
587
792
754
267
1,144
24-Jul-05
6,420
0
450
5,970
3,575
597
792
754
267
1,179
31-Jul-05
6,420
0
450
5,970
3,570
589
856
754
267
1,111
7-Aug-05
6,420
0
450
5,970
3,521
599
804
754
267
1,223
14-Aug-05
6,420
0
450
5,970
3,529
601
1,023
754
267
998
21-Aug-05
6,420
0
450
5,970
3,423
605
693
754
267
1,438
28-Aug-05
6,427
0
450
5,977
3,374
602
1,044
754
267
1,140
4-Sep-05
6,427
0
400
6,027
3,356
587
892
754
267
1,345
11-Sep-05
6,427
0
400
6,027
3,427
594
857
754
267
1,314
18-Sep-05
6,427
0
400
6,027
3,535
593
826
754
267
1,237
25-Sep-05
6,427
0
400
6,027
3,711
590
807
754
267
1,077
Page 62 of 82
Docket No. ER11-1844
Exhibit No. NYI-19
Page 63 of 82
Table 3 - New England
Week
Installed
Firm
Firm
Total
Load
Interruptible
Known
Req. Operating
Unplanned
Net
Beginning
Capacity
Purchases
Sales
Capacity
Forecast
Load
Maint./Derat.
Reserve
Outages
Margin
Sundays
MW
MW
MW
MW
MW
MW
MW
MW
MW
MW
1-May-05
33,371
537
508
33,400
17,644
317
6,403
1,700
3,400
4,570
8-May-05
33,371
537
508
33,400
19,911
317
5,657
1,700
3,400
3,049
15-May-05
33,371
537
508
33,400
20,836
317
4,090
1,700
3,400
3,691
22-May-05
33,371
537
508
33,400
21,695
317
1,733
1,700
3,400
5,189
29-May-05
30,880
537
508
30,909
22,639
317
1,148
1,700
2,800
2,940
5-Jun-05
30,880
587
508
30,959
26,355
317
221
1,700
2,800
201
12-Jun-05
30,880
587
508
30,959
26,355
317
251
1,700
2,800
170
19-Jun-05
30,880
587
508
30,959
26,355
317
452
1,700
2,800
-31
26-Jun-05
30,889
587
508
30,968
26,355
317
191
1,700
2,800
240
3-Jul-05
30,889
537
0
31,426
26,355
317
166
1,700
2,100
1,422
10-Jul-05
30,889
537
0
31,426
26,355
317
229
1,700
2,100
1,359
17-Jul-05
30,889
537
0
31,426
26,355
317
289
1,700
2,100
1,300
24-Jul-05
30,889
537
0
31,426
26,355
317
207
1,700
2,100
1,382
31-Jul-05
30,880
537
0
31,417
26,355
317
197
1,700
2,100
1,382
7-Aug-05
30,880
537
0
31,417
26,355
317
215
1,700
2,100
1,364
14-Aug-05
30,880
537
0
31,417
26,355
317
181
1,700
2,100
1,398
21-Aug-05
30,880
537
0
31,417
26,355
317
202
1,700
2,100
1,377
28-Aug-05
30,879
537
0
31,416
26,355
317
317
1,700
2,100
1,262
4-Sep-05
30,879
537
0
31,416
24,236
317
117
1,700
2,100
3,580
11-Sep-05
30,879
537
0
31,416
22,926
317
1,103
1,700
2,100
3,904
18-Sep-05
30,879
537
0
31,416
22,578
317
1,774
1,700
2,100
3,581
25-Sep-05
30,879
537
0
31,416
22,491
317
2,381
1,700
2,100
3,061
Page 63 of 82
Docket No. ER11-1844
Exhibit No. NYI-19
Page 64 of 82
Table 4 - New York
Week
Installed
Firm
Firm
Total
Load
Interruptible
Known
Req. Operating
Unplanned
Net
Beginning
Capacity
Purchases
Sales
Capacity
Forecast
Load
Maint./Derat.
Reserve
Outages
Margin
Sundays
MW
MW
MW
MW
MW
MW
MW
MW
MW
MW
1-May-05
39,109
2,700
303
41,506
24,784
0
4,895
1,800
3,603
6,424
8-May-05
39,109
2,700
303
41,506
25,451
0
2,621
1,800
3,603
8,031
15-May-05
39,109
2,700
303
41,506
26,117
0
1,413
1,800
3,603
8,573
22-May-05
39,109
2,700
303
41,506
26,784
0
1,655
1,800
3,603
7,664
29-May-05
39,109
2,700
303
41,506
27,452
0
289
1,800
3,603
8,363
5-Jun-05
39,109
2,700
303
41,506
28,118
0
173
1,800
3,603
7,812
12-Jun-05
39,109
2,700
303
41,506
28,785
0
112
1,800
3,603
7,207
19-Jun-05
39,109
2,700
303
41,506
29,452
0
0
1,800
3,603
6,651
26-Jun-05
39,109
2,700
303
41,506
31,962
0
0
1,800
3,603
4,141
3-Jul-05
39,237
2,480
303
41,414
31,962
0
0
1,800
3,595
4,057
10-Jul-05
39,237
2,480
303
41,414
31,962
0
0
1,800
3,595
4,057
17-Jul-05
39,237
2,480
303
41,414
31,962
0
0
1,800
3,595
4,057
24-Jul-05
39,237
2,480
303
41,414
31,962
0
0
1,800
3,595
4,057
31-Jul-05
39,237
2,480
303
41,414
31,962
0
0
1,800
3,595
4,057
7-Aug-05
39,237
2,480
303
41,414
31,962
0
0
1,800
3,595
4,057
14-Aug-05
39,237
2,480
303
41,414
31,962
0
0
1,800
3,595
4,057
21-Aug-05
39,237
2,480
303
41,414
31,962
0
0
1,800
3,595
4,057
28-Aug-05
39,237
2,480
303
41,414
31,962
0
0
1,800
3,595
4,057
4-Sep-05
39,237
2,480
303
41,414
27,655
0
108
1,800
3,595
8,256
11-Sep-05
39,237
2,480
303
41,414
26,655
0
484
1,800
3,595
8,880
18-Sep-05
39,237
2,480
303
41,414
25,656
0
613
1,800
3,595
9,751
25-Sep-05
39,237
2,480
303
41,414
24,655
0
633
1,800
3,595
10,731
Page 64 of 82
Docket No. ER11-1844
Exhibit No. NYI-19
Page 65 of 82
Table 5 - Ontario
Week
Installed
Firm
Firm
Total
Load
Interruptible
Known
Req. Operating
Unplanned
Net
Beginning
Capacity
Purchases
Sales
Capacity
Forecast
Load
Maint./Derat.
Reserve
Outages
Margin
Sundays
MW
MW
MW
MW
MW
MW
MW
MW
MW
MW
1-May-05
30,016
0
0
30,016
18,648
409
6,288
1,402
1,350
2,737
8-May-05
30,016
0
0
30,016
18,400
409
4,913
1,402
1,350
4,360
15-May-05
30,016
0
0
30,016
19,449
409
5,489
1,402
1,350
2,735
22-May-05
30,016
0
0
30,016
19,686
409
4,527
1,402
1,350
3,460
29-May-05
30,016
0
0
30,016
20,306
409
5,277
1,402
1,350
2,090
5-Jun-05
30,041
0
0
30,041
20,490
409
3,971
1,402
1,350
3,237
12-Jun-05
30,041
0
0
30,041
22,344
418
3,431
1,402
1,350
1,932
19-Jun-05
30,041
0
0
30,041
23,403
418
3,573
1,402
1,350
731
26-Jun-05
30,041
0
0
30,041
22,709
418
4,042
1,402
1,350
956
3-Jul-05
30,041
0
0
30,041
23,871
418
3,635
1,402
1,350
201
10-Jul-05
30,041
0
0
30,041
23,897
418
3,071
1,402
1,350
739
17-Jul-05
30,041
0
0
30,041
23,708
418
2,853
1,402
1,350
1,146
24-Jul-05
30,041
0
0
30,041
23,657
418
2,158
1,402
1,350
1,892
31-Jul-05
30,041
0
0
30,041
23,364
418
2,312
1,402
1,350
2,031
7-Aug-05
30,041
0
0
30,041
23,532
418
2,694
1,402
1,350
1,481
14-Aug-05
30,041
0
0
30,041
23,277
418
2,703
1,402
1,350
1,727
21-Aug-05
30,041
0
0
30,041
22,964
418
2,671
1,402
1,350
2,072
28-Aug-05
30,041
0
0
30,041
23,434
418
3,724
1,402
1,350
549
4-Sep-05
30,041
0
0
30,041
22,067
418
4,405
1,402
1,350
1,235
11-Sep-05
30,041
0
0
30,041
21,741
432
4,624
1,402
1,350
1,356
18-Sep-05
30,041
0
0
30,041
21,440
432
5,150
1,402
1,350
1,131
25-Sep-05
30,041
0
0
30,041
20,133
432
6,490
1,402
1,350
1,098
Page 65 of 82
Docket No. ER11-1844
Exhibit No. NYI-19
Page 66 of 82
Table 6 - Quebec
Week
Installed
Firm
Firm
Total
Load
Interruptible
Known
Req. Operating
Unplanned
Net
Beginning
Capacity1
Purchases
Sales2
Capacity
Forecast3
Load
Maint./Derat.
Reserve
Outages4
Margin
Sundays
MW
MW
MW
MW
MW
MW
MW
MW
MW
MW
1-May-05
37,493
300
1,490
36,303
22,083
935
10,563
1,500
1,200
1,892
8-May-05
37,393
300
1,490
36,203
21,475
935
10,289
1,500
1,200
2,674
15-May-05
37,393
300
1,490
36,203
20,941
935
10,249
1,500
1,200
3,248
22-May-05
37,393
300
1,490
36,203
20,611
935
9,534
1,500
1,200
4,293
29-May-05
36,993
300
1,490
35,803
20,318
935
9,705
1,500
1,200
4,015
5-Jun-05
36,993
300
1,490
35,803
20,065
935
10,101
1,500
1,200
3,872
12-Jun-05
36,993
300
1,490
35,803
20,172
935
8,980
1,500
1,200
4,886
19-Jun-05
36,993
300
1,490
35,803
20,286
935
9,144
1,500
1,200
4,608
26-Jun-05
36,993
300
1,490
35,803
20,365
935
8,038
1,500
1,200
5,635
3-Jul-05
37,244
350
1,490
36,104
20,757
935
8,936
1,500
1,200
4,646
10-Jul-05
37,244
350
1,490
36,104
20,843
935
7,842
1,500
1,200
5,654
17-Jul-05
37,244
350
1,490
36,104
20,441
935
7,685
1,500
1,200
6,213
24-Jul-05
37,244
350
1,490
36,104
20,245
935
7,153
1,500
1,200
6,941
31-Jul-05
37,244
350
1,490
36,104
20,703
935
6,163
1,500
1,200
7,473
7-Aug-05
37,244
350
1,490
36,104
20,783
935
6,473
1,500
1,200
7,083
14-Aug-05
37,244
350
1,490
36,104
20,760
935
9,717
1,500
1,200
3,862
21-Aug-05
37,244
350
1,490
36,104
20,640
935
8,341
1,500
1,200
5,358
28-Aug-05
37,244
350
1,490
36,104
20,624
935
8,924
1,500
1,200
4,791
4-Sep-05
37,244
300
1,490
36,054
20,424
935
8,562
1,500
1,200
5,303
11-Sep-05
37,244
300
1,490
36,054
20,617
935
10,599
1,500
1,200
3,073
18-Sep-05
37,244
300
1,490
36,054
20,801
935
9,496
1,500
1,200
3,992
25-Sep-05
37,244
300
1,490
36,054
21,278
935
9,442
1,500
1,200
3,569
Notes
1) Includes IPP and other known generation (Churchill Falls & Labrador Co.).
2) Includes transmission losses of 6%. Does not include firm sale of 45 MW to Cornwall Ontario - Load is supplied radially from Quebec Control Area
3) Load forecast is expected weekly peak (Hourly) and includes the firm sale of 45 MW to Cornwall, Ontario.
4) This value also includes a load forecast uncertainty (LFU) of 3%.
Please note that the information in this spreadsheet is commercially sensitive, therefore highly confidential.
Page 66 of 82
Docket No. ER11-1844
Exhibit No. NYI-19
Page 67 of 82
Table 7 - NPCC Bottled Capacity Calculations
CP-8 Assumed Transfer Capability at Peak
Existing Transactions
Path
MW
Path
MW
Que. to Ont.
1,540
Que. to Ont.
0
Que. to NY
1,500
Que. to NY
1,180
Que. to NE
1,725
Que. to NE
310
NB to NE
700
NB to NE
100
Total Transfer MW
5,465
Total
1,590
1,590
Transactions between TE/Maritimes and Remainder of NPCC
3,875
Total Transfer with Remaining NPCC after accounting for transactions
Week
Available
Beginning
Quebec
Maritimes
Total Net
Transfer
Bottled NE
Total Bottled
Sundays
Margin
Margin
Margin
Capability
Resources
Resources
1-May-05
1,892
788
2,680
3,875
400
0
8-May-05
2,674
832
3,506
3,875
400
31
15-May-05
3,248
1,186
4,434
3,875
400
959
22-May-05
4,293
1,057
5,350
3,875
400
1,875
29-May-05
4,015
1,037
5,052
3,875
400
1,577
5-Jun-05
3,872
1,181
5,053
3,875
400
1,578
12-Jun-05
4,886
1,297
6,183
3,875
400
2,708
19-Jun-05
4,608
1,318
5,926
3,875
400
2,451
26-Jun-05
5,635
1,227
6,862
3,875
400
3,387
3-Jul-05
4,646
1,241
5,887
3,875
400
2,412
10-Jul-05
5,654
1,196
6,850
3,875
400
3,375
17-Jul-05
6,213
1,144
7,357
3,875
400
3,882
24-Jul-05
6,941
1,179
8,120
3,875
400
4,645
31-Jul-05
7,473
1,111
8,584
3,875
400
5,109
7-Aug-05
7,083
1,223
8,306
3,875
400
4,831
14-Aug-05
3,862
998
4,860
3,875
400
1,385
21-Aug-05
5,358
1,438
6,796
3,875
400
3,321
28-Aug-05
4,791
1,140
5,931
3,875
400
2,456
4-Sep-05
5,303
1,345
6,648
3,875
400
3,173
11-Sep-05
3,073
1,314
4,387
3,875
400
912
18-Sep-05
3,992
1,237
5,229
3,875
400
1,754
25-Sep-05
3,569
1,077
4,646
3,875
400
1,171
Page 67 of 82
Docket No. ER11-1844
Exhibit No. NYI-19
Page 68 of 82
Appendix II - Summary of Normal and Expected Feasible Transfer Capability Under Peak Conditions
The following table is intended to show how transfer limits between Areas may range depending on system conditions. The values
represent an expected value under the different scenarios and it should be noted that real-time transfer limits may change depending on
the operation of the system at any moment. For more information on the Available Transfer Capability (ATC) and Total Transfer
Transfers from Maritimes to
Interconnection
Normal
Feasible Transfer
Rationale for Constraint
Point
Transfer
Capability under
Capability at
Peak Conditions
Interconnection
(MW)
Points (MW)
Quebec
NBM / HQ
200
200
NB / HQ
550
440
Madawaska HVDC de-rated to 350 MW due to temperature (50 MW
reduction ) and the total import at Eel River being 290 MW (summer rating
of line 2101) in the event that line 2102 trips (60 MW reduction )
Total
750
640
New England
NB / BHE
700
700
Total
700
700
Page 68 of 82
Docket No. ER11-1844
Exhibit No. NYI-19
Page 69 of 82
Transfers from New England to
Interconnection
Normal
Feasible Transfer
Rationale for Constraint
Point
Transfer
Capability under
Capability at
Peak Conditions
Interconnectio
(MW)
n Points (MW)
Maritimes
BHE / NB
300
0
Transfers into the Maritimes Area are dependant on operating conditions in
Northern Maine.
Total
300
0
New York
VT / D
0
WMA / F
800
CT / G
800
NOR / K
286
Sub Total
1,600
925
Feasible simultaneous transfer to New York excluding Cross Sound Cable
(simultaneous
limit)
CT (CSC) / K
330
330
The Cross Sound Cable is a DC tie and is not included in the feasible
simultaneous transfer capability with New York
Total
2,116
1,255
Page 69 of 82
Docket No. ER11-1844
Exhibit No. NYI-19
Page 70 of 82
Quebec
LGA2A/ CMA
690
690
HQ / VT
225
225
Total
915
915
Transfers from New York to
Interconnection
Normal
Feasible Transfer
Rationale for Constraint
Point
Transfer
Capability under
Capability at
Peak Conditions
Interconnection
(MW)
Points (MW)
New England
K / VT
150
F / WMA
800
G / CT
800
K / NOR
286
Sub Total
1,600
1,225
Feasible simultaneous transfer to New England excluding Cross Sound
(simultaneous
Cable
limit)
K / CT (CSC)
330
330
The Cross Sound Cable is a DC tie and is not included in the feasible
simultaneous transfer capability with New York
Page 70 of 82
Docket No. ER11-1844
Exhibit No. NYI-19
Page 71 of 82
Total
1,930
1,555
Ontario
D / East
400
400
A / Niagara
1,800
1,300
Simultaneous transfers between NY and Ontario may be impacted by loop
flows assuming instructions to use the phase shifter capability of the
Michigan - Ontario interface is not available. Additionally, thermal limits on
the QFW interface may restrict imports to lesser values when the generation
in the Niagara area is taken into account.
Total
2,200
1,700
PJM
A / West
550
550
C / West
800
800
C / Cent.
300
300
G / East
2,000
2,000
J / East
0
0
Total
2,500
2,500
(simultaneous
limit)
Page 71 of 82
Docket No. ER11-1844
Exhibit No. NYI-19
Page 72 of 82
Quebec
D / HQ
1,000
1,000
Total
1,000
1,000
Emergency use of VFT is possible. VFT has the potential of increasing
transfer to Quebec by 100 MW in addition to the Cornwall load.
Transfers from Ontario to
Interconnection
Normal
Feasible Transfer
Rationale for Constraint
Point
Transfer
Capability under
Capability at
Peak Conditions
Interconnection
(MW)
Points (MW)
New York
East / D
400
400
Niagara / A
1,800
1,450
Simultaneous transfers between NY and Ontario may be impacted by loop
flows assuming instructions to use the phase shifter capability of the
Michigan - Ontario interface is not available.
Total
2,200
1,850
ECAR
1,550
1,550
Simultaneous transfers between Michigan and Ontario may be impacted by
loop flows assuming instructions to use the phase shifter capability of the
Michigan - Ontario interface is not available.
Total
1,550
1,550
Page 72 of 82
Docket No. ER11-1844
Exhibit No. NYI-19
Page 73 of 82
Quebec
NE / HQ
95
95
The tie line facilities are thermally restricted in the summer.
Ottawa / HQ
320
147
Circuit Q4C is capable of 120 MW less 1/2 the Chats Falls that are
considered in the in the Quebec Installed capacity (120-88=32). In addition,
stability limits allow 200 MW to be transferred over the Ottawa-Brascan tie,
but connectivity will only allow 115 MW load to be connected on the
Quebec end
East / Beau
470
470
Total
885
712
MAPP
NW / MAN
262
NW / MIN
140
Total
402
375
Feasible Simultaneous transfer to MAPP
Transfers from Quebec to
Interconnection
Normal
Feasible Transfer
Rationale for Constraint
Point
Transfer
Capability under
Capability at
Peak Conditions
Interconnection
(MW)
Points (MW)
Page 73 of 82
Docket No. ER11-1844
Exhibit No. NYI-19
Page 74 of 82
Maritimes
HQ / NBM
0
HQ / NB
1,050
1,000
Except during August where capability will be between 700 and 800 MW
due to busbars displacements on the 735 kV part of the Levis substation..
Total
1,050
1,000
New England
LG2A / CMA
2,000
1,500
NE is limited to 1,500 MW.
HQ / VT
295
225
Total
2,000
1,725
New York
HQ / D
1,500
1,500
NY is limited to 1500 MW. The maximum delivery from Quebec to the
NYCA is 1,200 MW, however the FCTTC over the Chateauguay-Massena
765 kV interconnection #7040 is 1,500 MW (with 300 MW delivered as a
wheel-though to another Control Area)
CRT / D
325
180
Transfer limit is 325 MW less projected peak Cornwall load of 145 MW.
Total
1,825
1,680
Page 74 of 82
Docket No. ER11-1844
Exhibit No. NYI-19
Page 75 of 82
Ontario
HQ / NE
65
65
Some limitation may occur depending on hydro conditions.
HQ / Ottawa
698
618
Transfers to Ontario on D5A are limited to 200 MW, 88 MW at Chats Falls,
65 MW on X2Y. Thermal limitations may reduce deliveries on P33C from
345 MW to 265 MW. Some limitation may occur depending on hydro
conditions.
Beau / East
800
800
Some limitation may occur depending on hydro conditions.
Total
1,563
1,483
Transfers from Regions External to NPCC
Interconnection
Normal
Feasible Transfer
Rationale for Constraint
Point
Transfer
Capability under
Capability at
Peak Conditions
Interconnection
(MW)
Points (MW)
ECAR / West
1,250
1,250
Simultaneous transfers between Michigan and Ontario may be impacted by
loop flows assuming instructions to use the phase shifter capability of the
Michigan - Ontario interface is not available
Total
1,250
1,250
MAPP / ONT
MANIT /
330
MINNE / NW
90
Page 75 of 82
Docket No. ER11-1844
Exhibit No. NYI-19
Page 76 of 82
Total
420
325
Feasible Simultaneous transfer from MAPP
PJM / New
York
West / A
550
550
West / C
800
800
Cent / C
300
300
East / G
1,100
1,100
East / J
1,000
1,000
Total
2,500
2,500
(simultaneous
limit)
Page 76 of 82
Docket No. ER11-1844
Exhibit No. NYI-19
Page 77 of 82
Appendix III - NPCC Operational Criteria and Procedures
A-2 Basic Criteria for Design and Operation of Interconnected Power Systems
Description: This Criteria establishes the basic principles and requirements for the
design and the operation of the NPCC bulk power system.
A-3 Emergency Operation Criteria
Description: Objectives, principles and requirements are presented to assist the NPCC
Areas in formulating plans and procedures to be followed in an emergency or during
conditions which could lead to an emergency.
A-6 Operating Reserve Criteria
Description: This Criteria establishes standard terminology and minimum requirements
governing the amount, availability and distribution of operating reserve. Procedures are
included for corrective action and mutual assistance in case of operating reserve
shortages. The objective is to ensure a high level of reliability in the NPCC Region that
is, as a minimum, consistent with the standards specified by the North American Electric
Reliability Council (NERC).
B-3 Guidelines for Inter-Area Voltage Control
Description: This document establishes procedures and principles to be considered for
occasions where a deficiency or an excess of reactive power can affect bulk power
system voltage levels in a large portion of an Area or in two adjacent Areas.
B-12 Guidelines for On-Line Computer System Performance During Disturbances
Description: Establishes guidelines for the performance of NPCC Area on-line computer
systems during a power system disturbance.
B-20 Guidelines for Identifying Key Facilities and Their Critical Components for
System Restoration”
Description: Establishes requirements and guidelines for the identification of Key
Facilities and their Critical Components that are required for restoration of the power
system following a partial or total system blackout.
C-01 NPCC Emergency Preparedness Conference Call Procedures-NPCC Security
Conference Call Procedures
C-4 Monitoring Procedures for Guidelines for Inter-Area Voltage Control
Description: This procedural document establishes TFCO's monitoring and reporting
requirements for conformance with NPCC's Guidelines for Inter-AREA Voltage Control
(Document B-3).
Page 77 of 82
Docket No. ER11-1844
Exhibit No. NYI-19
Page 78 of 82
C-5 Monitoring Procedures for Emergency Operation Criteria
Description: This procedural document establishes TFCO's monitoring and reporting
requirements for conformance with NPCC's Emergency Operation Criteria (Document A-
3).
C-7 Monitoring Procedures for Guide for Rating Generating Capability
Description: This procedural document establishes the TFCO's monitoring and
reporting requirements for conformance with the NPCC, Guide for Rating Generating
Capability (Document B-9).
C-8 Monitoring Procedures for Control Performance Guide During Normal
Conditions
Description: This procedural document establishes a performance measure for NPCC
Areas and systems and outlines the reporting function for NPCC Control Performance
Guide During Normal Conditions (Document B-2)
C-9 Monitoring Procedures for Operating Reserve Criteria
Description: This procedural document establishes the TFCO's monitoring and
reporting requirements for conformance with the NPCC Operating Reserve Criteria
(Document A-6)
C-11 Monitoring Procedures for Interconnected System Frequency Response (This
Document has recently been revised and will have a new designation as Reference
Document RD-10)
Description: This procedural document defines procedures for monitoring frequency
responses to large generation losses.
C-12 Procedures for Shared Activation of Ten Minute Reserve
Description: This procedural document outlines procedures to share the activation of
ten-minute reserve on an Area basis. The methods prescribed by the procedure are
intended to ensure that lost generation or energy purchases are quickly replaced by
several areas simultaneously loading generation in the few minutes immediately
following a loss.
Page 78 of 82
Docket No. ER11-1844
Exhibit No. NYI-19
Page 79 of 82
C-13 Operational Planning Coordination
Appendix D - NPCC Critical Facilities List
Description: This document coordinates the notification of planned facility outages
among the Areas. It also establishes formal procedures for Area communications in
advance of a period of likely capacity shortages as well as for weekly and emergency
NPCC conference call among the Areas.
C-15 Procedures for Solar Magnetic Disturbances on Electrical Power Systems
Description: This procedural document clarifies the reporting channels and information
available to the operator during solar alerts and suggests measures that may be taken to
mitigate the impact of a solar magnetic disturbance.
C-19 Procedures During Shortages of Operating Reserve
Description: This procedure is intended to provide specific instructions for the
redistribution of Operating Reserve among the Areas when one or more Area(s) are
experiencing an Operating Reserve deficiency.
C-20 Procedures During Abnormal Operating Conditions
Description: This procedure is intended to complement the Emergency Operation
Criteria
(Document A-3) by providing specific instructions to the System Operator
during such conditions in an NPCC Area or Areas.
C-36 Procedures for Communications During Emergencies
Description: This procedure outlines how communications be conducted for various
situations.
C-37 Operating Procedures for ACE diversity Interchange
Description: This procedure is intended to spell out how to utilize Area Control Error
Diversity Interchange among NPCC entities and PJM.
C-38 Procedure for Operating Reserve Assistance
Description: This procedure is intended to provide the structure for NPCC Areas to
assist each other in meeting 10 minute reserve.
RD-02 NPCC Inter-Control Area Power System Restoration Refernce Document
Page 79 of 82
Docket No. ER11-1844
Exhibit No. NYI-19
Page 80 of 82
Appendix IV - Web Sites
ECAR
Independent Electricity System Operator
ISO- New England
LEER Members
MAAC
MAPP
Maritimes
Maritimes Electric Company Ltd.
New Brunswick System Operator
Nova Scotia Power
Northern Maine Independent System Administrator
New York ISO
North East Power Coordinating Council
Page 80 of 82
Docket No. ER11-1844
Exhibit No. NYI-19
Page 81 of 82
TransEnergie
Drought Predictors
Canadian
United States
Page 81 of 82
Docket No. ER11-1844
Exhibit No. NYI-19
Page 82 of 82
Appendix V - References
NPCC Summer 2005 Multi-Area Probabilistic Reliability Assessment - April 2005
NPCC Reliability Assessment for Summer 2004 - May 1, 2004
Draft 2005 Summer MEN Interregional Transmission System Reliability Assessment
Page 82 of 82
DOCKET NO. ER11-1844
EXHIBIT NO. NYI-20
Docket No. ER11-1844
Exhibit No. NYI-20
Page 1 of 2
Docket No. ER11-1844-000
IESO Data Request Responses to
NYISO First Set of Data Requests
Page 5 of 6
Question NYISO/IESO 1-5:
Related To the Hydro One PAR on the L4D line that went out of service on December
17, 2011:
a. Please explain why that Hydro One PAR failed.
IESO Response:
The IESO understands that the PAR on the L4D line was removed from service by
Hydro One (the asset owner) as a result of a bad oil sample. The exact cause of the
bad sample remains unknown at this time.
b. Please explain how long it will take to return that Hydro One PAR to service.
IESO Response:
The expected return to service of the PAR on the L4D is not know at this time.
c. Please provide a schedule of the outages that have occurred over the past 3
years for any of the Hydro One PARs, including the duration of each outage and
whether the outage was scheduled (maintenance) or unscheduled (forced).
IESO Response:
The following is the schedule of outages for the Hydro One PARS for the period of
January 2009 - December 2011inclusive:
Duration
PAR
Line
Start Date
End Date
Outage Type
(Hours)
PSR5
J5D
2009-03-09
2009-03-09
14
Maintenance
PSR5
J5D
2009-09-21
2009-10-21
732
Maintenance
PSR5
J5D
2011-04-10
2010-01-10
4
Forced
PS51
L51D
2010-08-23
2010-09-06
348
Maintenance
PS51
L51D
2011-09-19
2011-09-23
106
Maintenance
PS51
L51D
2011-12-04
2011-12-04
8
Maintenance
PS4
L4D
2009-12-07
2009-12-07
7
Maintenance
Docket No. ER11-1844
Exhibit No. NYI-20
Page 2 of 2
Docket No. ER11-1844-000
IESO Data Request Responses to
NYISO First Set of Data Requests
Page 6 of 6
Duration
PAR
Line
Start Date
End Date
Outage Type
(Hours)
PS4
L4D
2010-05-11
2010-05-14
80
Maintenance
PS4
L4D
2011-05-24
2011-06-03
251
Maintenance
PS4
L4D
2011-10-11
2011-10-14
85
Maintenance
PS4
L4D
2011-12-17
Forced
Response Provided by: Nicholas Ingman, Manager, Operational Excellence
DOCKET NO. ER11-1844
EXHIBIT NO. NYI-21
Docket No. ER11-1844
Exhibit No. NYI-21
Page 1 of 1
Michigan-Ontario Interface Phase Angle Regulators
In March 2003, the ITCTransmission (“ITC”) Bunce Creek (“B3N”) Phase Angle
Regulator (“PAR”) was retired and has been out of service. The B3N PAR was one of
four PAR’s on the Michigan-Ontario interface which, when operated together, was
designed to help mitigate loop flow in the Lake Erie region by controlling electrical flow
across the Michigan-Ontario interface. The other three PARs, owned and operated by
Hydro One, are located at Lambton (L4D and L51D) and Keith (J5D).
The retired B3N transformer has been replaced by two PARs (connected in series).
Installation of the transformers was complete in December 2009 and protective system
work, in coordination with Hydro One, was completed in July 2010.
As an international facility, regulatory authorization (Presidential Permit) from the U.S.
Department of Energy (“DOE”) is required prior to commissioning and operating the
B3N PAR. All contractual and operational agreements between ITC and Hydro One
were filed with the DOE and ITC took receipt of the amended Presidential Permit on
February 24, 2012. With operational agreements between MISO and the IESO also in
place, all requirements necessary to commission and operate the ITC B3N PAR have
been fulfilled. ITC has started the process of energizing and testing the B3N PAR, which
is scheduled to be completed by EOD, April 4, 2012.
In late 2011, Hydro One removed the L4D from service due to early indications of an
electrical issue with the PAR. Testing on the L4D PAR will continue through mid-May,
and the L4D PAR is not expected to be available for use prior to the commissioning of
the B3N PAR.
MISO, IESO, ITC and Hydro One have formally set 1000 hours EDT Thursday April 5,
2012 as the target for starting coordinated operation of PARs on the Michigan-Ontario
interface. The objective of coordinated operations is to help mitigate loop flows in the
Lake Erie region by conforming actual electrical flows across the interface to scheduled
electrical flows, to the maximum extent practical.
Coordinated interface operations without the L4D PAR in service will reduce the overall
capability to control loop flow by an estimated 40-50%, which significantly reduces the
time that the interface will be fully regulated (loop flow exceeds collective ability of
remaining PARs to control flow). As a result, MISO does not intend to change the
methodology for pricing transactions scheduled across the Michigan-Ontario interface in
conjunction with the start of coordinated operations (April 5th) as originally planned. The
existing pricing methodology will remain in place until further notice.
DOCKET NO. ER11-1844
EXHIBIT NO. NYI-22
Docket No. ER11-1844
Exhibit No. NYI-22
Page 1 of 1
Docket No. ER11-1844-000
IESO Data Request Responses to
NYISO Fourth Set of Data Requests
Page 1 of 3
Question NYISO/IESO 4-1:
When does IESO expect the L4D PAR to be placed back in service?
IESO Response:
The current scheduled return date for the L4D PAR is May 18, 2012.
Response Provided by: Nicholas Ingman, Manager, Operational Excellence
DOCKET NO. ER11-1844
EXHIBIT NO. NYI-23
Docket No. ER11-1844
Exhibit No. NYI-23
Page 1 of 47
Summary of Scheduled Return Date Announcements
for the L4D PAR
Posted in System Advisory/Summary Reports on IESO’s Website1
Date IESO Posted for End
Link to System Advisory/Summary Report
of L4D PAR Bypass
February 15, 2012
March 2, 2012
March 31, 2012
April 5, 2012
May 1, 2012
1 IESO’s website for System Advisory/Summary Reports, http://www.ieso.ca/imoweb/marketdata/ssrsaa.asp.
Docket No. ER11-1844
Exhibit No. NYI-23
Page 2 of 47
Urgent SSR Report for 2012/02/08 generated on 2012/02/08 07:15
System Advisory/Summary
System Advisory/Summary Hourly Details H1-12 Hourly Details H13-24 Transmission Interfaces SAA
Notes
Forecast Supply
Forecast Demand
Forecast Excess(Shortfall)
Energy Shortfall
Energy(MWhr)
Energy(MWhr)
Energy(MWhr)
Hours(Yes/No)
575218
428629
149181
No
System Advisory Notices-
Date/Time
Start
End
Comment
Title
Issued
Date/Time
Date/Time
A generating unit of 250 MW
Major Change Advisory -
2012/02/08
2012/02/08
2012/02/08
or greater has been forced
generation
07:14
07:00
10:00
from service.
Hourly Details H1-12
System Advisory/Summary Hourly Details H1-12 Hourly Details H13-24 Transmission Interfaces SAA
Notes
Forecast Supply
H1
H2
H3
H4
H5
H6
H7
H8
H9
H10
H11
H12
Energy(MWhr)
23150
22662
22463
22483
22909
23202
24096
24166
24338
24200
24134
23979
Capacity(MW)
32537
32537
32537
32537
32537
32537
32537
32537
32537
32537
32537
32537
Intermittent
71
71
71
71
71
71
71
71
71
71
71
71
(MWhr/hr)
Self-Sched
835
834
835
835
836
839
848
874
878
878
872
877
(MWhr/hr)
Energy Limit'd
3149
2649
2449
2469
2869
3189
4074
4865
5188
5050
4990
4790
(MWhr)
Energy Limit'd Cap
6672
6672
6672
6672
6672
6672
6672
6672
6650
6650
6650
6650
(MW)
Imports - Est'd
700
700
700
700
700
700
700
0
0
0
0
0
(MW)
Intermittent Capacity
212
212
212
212
212
212
212
212
212
212
212
212
(MW)
Self-Sched Capacity
1084
1084
1084
1084
1084
1084
1084
1084
1084
1084
1084
1084
(MW)
Outages East(MW)
6218
6178
6177
6177
6151
6178
6169
6190
6363
6363
6369
6324
Outages West(MW)
346
374
374
374
374
374
374
374
374
374
374
374
Total Outages
6564
6552
6551
6551
6525
6552
6543
6564
6737
6737
6743
6698
Forecast Demand
15352
14706
14263
14282
14560
15216
17556
18319
18509
18413
18337
18237
Primary Demand
Docket No. ER11-1844
Exhibit No. NYI-23
Page 3 of 47
East(MW)
Primary Demand
537
560
561
555
552
553
553
508
518
517
511
499
West(MW)
Primary Demand
15889
15266
14824
14837
15112
15769
18109
18827
19027
18930
18848
18736
Total(MW)
Dispatchable Load
108
108
108
108
108
108
108
108
108
108
108
108
(MW)
Total
GRH
Operating
1418
1418
1418
1418
1418
1418
1418
1418
1418
1418
1418
1418
(MW)
Reserve
(MW)
Min. 10-Minute OR
945
945
945
945
945
945
945
945
945
945
945
945
Min. 10-Minute Spin
236
236
236
236
236
236
236
236
236
236
236
236
OR
Load Forecast
0
0
0
0
0
0
0
0
0
0
0
0
Uncertainty
Add. Cont.
0
0
0
0
0
0
0
0
0
0
0
0
Allowance
Intrahour Margin
0
0
0
0
0
0
0
0
0
0
0
0
(MW)
Excess(Shortfall)
Energy(MWhr)
7369
7504
7747
7754
7905
7541
6095
5447
5419
5378
5394
5351
Capacity(MW)
9474
10109
10552
10539
10290
9606
7275
5836
5463
5560
5636
5793
Ancillary Services
AGC Range
100
100
100
100
100
100
100
100
100
100
100
100
Required (MW)
AGC Rate Required
50
50
50
50
50
50
50
50
50
50
50
50
(MW/Min)
AGC Range
200
200
200
200
200
200
200
200
200
200
200
200
Available (MW)
Reliability Must Run
0
0
0
0
0
0
0
0
0
0
0
0
Required (MW)
Black Start Adequate
Y Y Y Y Y Y Y Y Y Y Y Y
(Y/N)
Minimum Operating Reserve Requirements
East(MW)
0
0
0
0
0
0
0
0
0
0
0
0
West(MW)
0
0
0
0
0
0
0
0
0
0
0
0
Docket No. ER11-1844
Exhibit No. NYI-23
Page 4 of 47
Hourly Details H13-24
System Advisory/Summary Hourly Details H1-12 Hourly Details H13-24 Transmission Interfaces SAA
Notes
Forecast Supply
H13
H14
H15
H16
H17
H18
H19
H20
H21
H22
H23
H24
Energy(MWhr)
24207
23878
23694
23880
24912
25354
25642
25434
25146
24189
23766
23334
Capacity(MW)
32537
32537
32537
32537
32537
32537
32537
32537
32537
32537
32537
32537
Intermittent
71
71
71
71
71
71
71
71
71
71
71
71
(MWhr/hr)
Self-Sched
880
879
880
878
882
885
886
886
887
886
885
851
(MWhr/hr)
Energy Limit'd
4490
4167
4107
4190
5218
5658
5758
5650
5361
4405
3834
3272
(MWhr)
Energy Limit'd Cap
6650
6650
6650
6650
6650
6672
6672
6745
6745
6745
6745
6745
(MW)
Imports - Est'd
0
0
0
0
0
0
100
0
0
0
24
188
(MW)
Intermittent Capacity
212
212
212
212
212
212
212
212
212
212
212
212
(MW)
Self-Sched Capacity
1084
1084
1084
1084
1084
1084
1084
1084
1084
1084
1084
1084
(MW)
Outages East(MW)
5796
5802
5926
5823
5819
5795
5707
5634
5633
5634
5510
5544
Outages West(MW)
374
374
374
374
374
374
374
374
374
374
374
374
Total Outages
6170
6176
6300
6197
6193
6169
6081
6008
6007
6008
5884
5918
Forecast Demand
Primary Demand
18069
17893
17692
17730
18000
18890
19844
19698
19052
18181
17086
15889
East(MW)
Primary Demand
492
486
484
484
484
489
510
595
596
632
611
568
West(MW)
Primary Demand
18561
18379
18176
18214
18484
19379
20354
20293
19648
18813
17697
16457
Total(MW)
Dispatchable Load
108
108
108
108
108
108
108
108
108
108
108
108
(MW)
Total
GRH
Operating
1418
1418
1418
1418
1418
1418
1418
1418
1418
1418
1418
1418
(MW)
Reserve
(MW)
Min. 10-Minute OR
945
945
945
945
945
945
945
945
945
945
945
945
Min. 10-Minute Spin
236
236
236
236
236
236
236
236
236
236
236
236
OR
Load Forecast
0
0
0
0
0
0
0
0
0
0
0
0
Uncertainty
0
0
0
0
0
0
0
0
0
0
0
0
Add. Cont.
Docket No. ER11-1844
Exhibit No. NYI-23
Page 5 of 47
Allowance
Intrahour Margin
0
0
0
0
0
0
0
0
0
0
0
0
(MW)
Excess(Shortfall)
Energy(MWhr)
5754
5607
5626
5774
6536
6083
5396
5249
5606
5484
6177
6985
Capacity(MW)
6496
6672
6751
6816
6550
5679
4892
4926
5572
6406
7670
9040
Ancillary Services
AGC Range
100
100
100
100
100
100
100
100
100
100
100
100
Required (MW)
AGC Rate Required
50
50
50
50
50
50
50
50
50
50
50
50
(MW/Min)
AGC Range
200
200
200
200
200
200
200
200
200
200
200
200
Available (MW)
Reliability Must Run
0
0
0
0
0
0
0
0
0
0
0
0
Required (MW)
Black Start Adequate
Y Y Y Y Y Y Y Y Y Y Y Y
(Y/N)
Minimum Operating Reserve Requirements
East(MW)
0
0
0
0
0
0
0
0
0
0
0
0
West(MW)
0
0
0
0
0
0
0
0
0
0
0
0
Docket No. ER11-1844
Exhibit No. NYI-23
Page 6 of 47
SAA Notes
System Advisory/Summary Hourly Details H1-12 Hourly Details H13-24 Transmission Interfaces SAA
Notes
Security and Adequacy
Date/Time
Start
End
Comment
Assesment Notes-Title
Issued
Date/Time
Date/Time
Generation Biasing may be
2012/02/02
2012/02/05
2012/02/09
System note
required to support switching
10:35
15:00
16:00
activities.
Docket No. ER11-1844
Exhibit No. NYI-23
Page 7 of 47
Transmission Interfaces
System Advisory/Summary Hourly Details H1-12 Hourly Details H13-24 Transmission Interfaces SAA
Notes
Internal Transmission Interface Limitations
Penalty
Date/Time
Start
End
Facility
Comments
Applied
Issued
Date/Time
Date/Time
Negative BLIP -
2012/01/16
2012/01/16
2012/02/20
Negative Buchanan
500
Based on unit configuration.
16:48
16:45
23:59
Longwood Input
TEK - Transfer East of
2012/01/17
2012/01/30
2012/03/16
50
F25A O/S
Kenora
15:02
08:00
18:00
TEM - Transfer East
2012/01/17
2012/01/30
2012/03/16
225
F25A O/S
of Mackenzie
15:03
08:00
18:00
TWM - Transfer West
2012/01/17
2012/01/30
2012/03/16
200
F25A O/S
of Mackenzie
15:03
08:00
18:00
EWTE - East-West
2012/01/17
2012/01/30
2012/03/16
75
F25A O/S
Transfer East
15:03
08:00
18:00
EWTW - East-West
2012/01/17
2012/01/30
2012/03/16
50
F25A O/S
Transfer West
15:03
08:00
18:00
FID - Flow Into
2012/01/30
2012/02/05
2012/02/09
20
B1S O/S
Dobbin
17:21
15:00
16:00
Madawaska
Generation -
2012/01/30
2012/02/05
2012/02/09
40
B1S O/S
Madawaska 115 kV
17:22
15:00
16:00
generation
Miss(Ecct)W -
2012/02/05
2012/02/07
2012/02/10
X27A O/S Miss(Ecct)W limit =
Mississagi East
0
08:43
08:00
17:00
400MW
Circuits Flow West
2012/02/07
2012/02/07
2012/02/10
X27A O/S SFE Global limit = 350
Other
0
02:55
08:00
17:00
MW
SFW Global - Sudbury
2012/02/05
2012/02/07
2012/02/10
X27A O/S SFW Global limit =
0
Flow West Global
08:43
08:00
17:00
590MW
WMFE - Wawa-
2012/02/03
2012/02/08
2012/02/08
WAWAFE < 350 MW, W23K
Mackay Flow East
10:06
07:30
18:00
O\S
Intertie Transmission Interface Limitations
Penalty
Date/Time
Start
End
Facility
Comments
Applied
Issued
Date/Time
Date/Time
The base ON to MI export limit is
Ontario - Michigan
2012/01/27
2011/11/01
2012/05/01
0
1775MW. LxD phase shifters on
Export Winter
10:46
00:00
00:00
neutral tap.
The base MI to ON import limit is
Ontario - Michigan
2012/01/27
2011/11/01
2012/05/01
0
1400MW. LxD phase shifters on
Import Winter
10:47
00:00
00:00
neutral tap.
Docket No. ER11-1844
Exhibit No. NYI-23
Page 8 of 47
Ontario Niagara - New
2012/01/19
2012/01/19
2012/12/31
The base ON to NY export limit is
0
York Export Winter
14:55
14:44
14:44
1650MW. BP76 os.
Ontario Niagara - New
2012/01/19
2012/01/19
2012/12/31
The base NY to ON import limit
0
York Import Winter
14:55
14:45
14:45
is 1050MW. BP76 os.
Ontario - Michigan
2012/01/24
2012/01/25
2012/02/15
The ON to IM export limit is
0
Export Winter
10:36
17:30
16:00
1880MW. L4D Par Byp.
Ontario - Michigan
2012/01/24
2012/01/25
2012/02/15
The IM to ON import limit is
0
Import Winter
13:58
17:30
16:00
1450MW. L4D Par Byp.
The ON to IM export limit is
Ontario - Michigan
2012/01/27
2012/01/30
2012/02/10
0
1730MW. L4D Par Byp + Keith
Export Winter
15:08
06:00
18:00
T11os.
The IM to ON import limit is
Ontario - Michigan
2012/01/27
2012/01/30
2012/02/10
0
1300MW. L4D Par Byp + Keith
Import Winter
15:08
06:00
18:00
T11os.
OMTW - Ontario-
2012/01/17
2012/01/30
2012/03/16
Manitoba Transfer
250
F25A O/S
15:01
08:00
19:00
West
OMTE - Ontario-
2012/01/17
2012/01/30
2012/03/16
Manitoba Transfer
70
F25A O/S
15:01
08:00
19:00
East
MPFN - Ontario-
2012/02/01
2012/01/30
2012/03/16
F25A with other equipment O/S
Minnesota Transfer
50
18:54
08:00
19:00
***extended***
North
MPFN - Ontario-
2012/01/17
2012/01/30
2012/03/16
Minnesota Transfer
25
F25A O/S
16:37
08:00
19:00
North
MPFS - Ontario-
2012/02/01
2012/01/30
2012/03/16
F25A with other equipment O/S
Minnesota Transfer
140
18:54
08:00
19:00
***extended***
South
MPFS - Ontario-
2012/01/17
2012/01/30
2012/03/16
Minnesota Transfer
90
F25A O/S
16:37
08:00
19:00
South
Docket No. ER11-1844
Exhibit No. NYI-23
Page 9 of 47
Urgent SSR Report for 2012/02/16 generated on 2012/02/16 11:44
System Advisory/Summary
System Advisory/Summary Hourly Details H1-12 Hourly Details H13-24 Transmission Interfaces SAA
Notes
Forecast Supply
Forecast Demand
Forecast Excess(Shortfall)
Energy Shortfall
Energy(MWhr)
Energy(MWhr)
Energy(MWhr)
Hours(Yes/No)
545557
405109
143040
No
System Advisory Notices-
Date/Time
Start
End
Comment
Title
Issued
Date/Time
Date/Time
IESO "Market Tool" Outage
results in the "Automated
Message Exchange Dispatch
2012/02/16
2012/02/16
2012/02/16
Major Change Advisory
Instruction" being
11:44
13:25
13:45
unavailable. The IESO will
manually dispatch via
telephone if necessary.
Hourly peak demand
forecasting is being used for
HE06 to HE07 for reliability
2012/02/16
2012/02/16
Major Change Advisory - load 2012/02/16
concerns. Primary demand
02:42
02:41
02:41
forecast has been decreased
by greater than 1.5% in HE03
- HE06.
Hourly Details H1-12
System Advisory/Summary Hourly Details H1-12 Hourly Details H13-24 Transmission Interfaces SAA
Notes
Forecast Supply
H1
H2
H3
H4
H5
H6
H7
H8
H9
H10
H11
H12
Energy(MWhr)
21991
21629
21496
21496
21619
21614
22567
23240
23271
23324
23035
22859
Capacity(MW)
32537
32537
32537
32537
32537
32537
32537
32537
32537
32537
32537
32537
Intermittent
98
98
98
98
98
98
98
98
98
98
98
98
(MWhr/hr)
Self-Sched
832
810
817
817
820
815
827
857
856
864
855
843
(MWhr/hr)
Energy Limit'd
3648
3308
3168
3168
3288
3288
4229
4872
4904
4904
4624
4504
(MWhr)
Energy Limit'd Cap
6781
6781
6781
6781
6781
6781
6781
6781
6781
6736
6736
6734
(MW)
Imports - Est'd
0
0
0
0
0
0
0
0
0
0
0
0
(MW)
Docket No. ER11-1844
Exhibit No. NYI-23
Page 10 of 47
Intermittent Capacity
212
212
212
212
212
212
212
212
212
212
212
212
(MW)
Self-Sched Capacity
1084
1084
1084
1084
1084
1084
1084
1084
1084
1084
1084
1084
(MW)
Outages East(MW)
7027
7049
7042
7042
7039
7044
7032
7002
7003
6995
7004
7062
Outages West(MW)
386
386
386
386
386
386
386
386
386
386
386
386
Total Outages
7413
7435
7428
7428
7425
7430
7418
7388
7389
7381
7390
7448
Forecast Demand
Primary Demand
14315
13803
13414
13386
13584
14256
15801
17303
17593
17533
17520
17477
East(MW)
Primary Demand
467
483
506
506
491
489
486
449
464
458
455
447
West(MW)
Primary Demand
14782
14286
13920
13892
14075
14745
16287
17752
18057
17991
17975
17924
Total(MW)
Dispatchable Load
108
108
108
108
108
108
108
108
108
108
108
108
(MW)
Total
GRH
Operating
1418
1418
1418
1418
1418
1418
1418
1418
1418
1418
1418
1418
(MW)
Reserve
(MW)
Min. 10-Minute OR
945
945
945
945
945
945
945
945
945
945
945
945
Min. 10-Minute Spin
236
236
236
236
236
236
236
236
236
236
236
236
OR
Load Forecast
0
0
0
0
0
0
0
0
0
0
0
0
Uncertainty
Add. Cont.
0
0
0
0
0
0
0
0
0
0
0
0
Allowance
Intrahour Margin
0
0
0
0
0
0
0
0
0
0
0
0
(MW)
Excess(Shortfall)
Energy(MWhr)
7317
7451
7684
7712
7652
6977
6388
5596
5322
5441
5168
5043
Capacity(MW)
9032
9506
9879
9907
9727
9052
7522
6087
5781
5855
5862
5855
Ancillary Services
AGC Range
100
100
100
100
100
100
100
100
100
100
100
100
Required (MW)
AGC Rate Required
50
50
50
50
50
50
50
50
50
50
50
50
(MW/Min)
AGC Range
200
200
200
200
200
200
200
200
200
200
200
200
Available (MW)
Reliability Must Run
0
0
0
0
0
0
0
0
0
0
0
0
Required (MW)
Black Start Adequate
Y Y Y Y Y Y Y Y Y Y Y Y
(Y/N)
Minimum Operating Reserve Requirements
East(MW)
0
0
0
0
0
0
0
0
0
0
0
0
Docket No. ER11-1844
Exhibit No. NYI-23
Page 11 of 47
West(MW)
0
0
0
0
0
0
0
0
0
0
0
0
Docket No. ER11-1844
Exhibit No. NYI-23
Page 12 of 47
Hourly Details H13-24
System Advisory/Summary Hourly Details H1-12 Hourly Details H13-24 Transmission Interfaces SAA
Notes
Forecast Supply
H13
H14
H15
H16
H17
H18
H19
H20
H21
H22
H23
H24
Energy(MWhr)
22906
22874
22952
23148
23586
23956
24038
23791
23573
22695
22097
21800
Capacity(MW)
32537
32537
32537
32537
32537
32537
32537
32537
32537
32537
32537
32537
Intermittent
98
98
98
98
98
98
98
98
98
98
98
98
(MWhr/hr)
Self-Sched
850
867
866
871
871
871
873
874
876
877
874
839
(MWhr/hr)
Energy Limit'd
4544
4495
4584
4767
5155
5515
5595
5347
5127
4248
3653
3391
(MWhr)
Energy Limit'd Cap
6734
6734
6734
6736
6736
6791
6791
6791
6791
6791
6791
6836
(MW)
Imports - Est'd
0
0
0
0
0
0
0
0
0
0
0
0
(MW)
Intermittent Capacity
212
212
212
212
212
212
212
212
212
212
212
212
(MW)
Self-Sched Capacity
1084
1084
1084
1084
1084
1084
1084
1084
1084
1084
1084
1084
(MW)
Outages East(MW)
7055
7038
7049
7034
6984
6919
6917
6916
6914
6913
6916
6906
Outages West(MW)
386
386
386
386
386
386
386
386
386
386
386
386
Total Outages
7441
7424
7435
7420
7370
7305
7303
7302
7300
7299
7302
7292
Forecast Demand
Primary Demand
17361
17243
17134
17202
17497
18050
18674
18645
17951
17114
16006
14781
East(MW)
Primary Demand
443
435
439
440
440
458
479
484
533
547
543
524
West(MW)
Primary Demand
17804
17678
17573
17642
17937
18508
19153
19129
18484
17661
16549
15305
Total(MW)
Dispatchable Load
108
108
108
108
108
108
108
108
108
108
108
108
(MW)
Total
GRH
Operating
1418
1418
1418
1418
1418
1418
1418
1418
1418
1418
1418
1418
(MW)
Reserve
(MW)
Min. 10-Minute OR
945
945
945
945
945
945
945
945
945
945
945
945
Min. 10-Minute Spin
236
236
236
236
236
236
236
236
236
236
236
236
OR
Load Forecast
0
0
0
0
0
0
0
0
0
0
0
0
Uncertainty
0
0
0
0
0
0
0
0
0
0
0
0
Add. Cont.
Docket No. ER11-1844
Exhibit No. NYI-23
Page 13 of 47
Allowance
Intrahour Margin
0
0
0
0
0
0
0
0
0
0
0
0
(MW)
Excess(Shortfall)
Energy(MWhr)
5210
5304
5487
5614
5757
5556
4993
4770
5197
5142
5656
6603
Capacity(MW)
5982
6125
6219
6165
5920
5414
4771
4796
5443
6267
7376
8630
Ancillary Services
AGC Range
100
100
100
100
100
100
100
100
100
100
100
100
Required (MW)
AGC Rate Required
50
50
50
50
50
50
50
50
50
50
50
50
(MW/Min)
AGC Range
200
200
200
200
200
200
200
200
200
200
200
200
Available (MW)
Reliability Must Run
0
0
0
0
0
0
0
0
0
0
0
0
Required (MW)
Black Start Adequate
Y Y Y Y Y Y Y Y Y Y Y Y
(Y/N)
Minimum Operating Reserve Requirements
East(MW)
0
0
0
0
0
0
0
0
0
0
0
0
West(MW)
0
0
0
0
0
0
0
0
0
0
0
0
Docket No. ER11-1844
Exhibit No. NYI-23
Page 14 of 47
SAA Notes
System Advisory/Summary Hourly Details H1-12 Hourly Details H13-24 Transmission Interfaces SAA
Notes
Security and Adequacy
Date/Time
Start
End
Comment
Assesment Notes-Title
Issued
Date/Time
Date/Time
Docket No. ER11-1844
Exhibit No. NYI-23
Page 15 of 47
Transmission Interfaces
System Advisory/Summary Hourly Details H1-12 Hourly Details H13-24 Transmission Interfaces SAA
Notes
Internal Transmission Interface Limitations
Penalty
Date/Time
Start
End
Facility
Comments
Applied
Issued
Date/Time
Date/Time
Negative BLIP -
2012/01/16
2012/01/16
2012/02/20
Negative Buchanan
500
Based on unit configuration.
16:48
16:45
23:59
Longwood Input
TEK - Transfer East of
2012/01/17
2012/01/30
2012/03/16
50
F25A O/S
Kenora
15:02
08:00
18:00
TEM - Transfer East
2012/01/17
2012/01/30
2012/03/16
225
F25A O/S
of Mackenzie
15:03
08:00
18:00
TWM - Transfer West
2012/01/17
2012/01/30
2012/03/16
200
F25A O/S
of Mackenzie
15:03
08:00
18:00
EWTE - East-West
2012/01/17
2012/01/30
2012/03/16
75
F25A O/S
Transfer East
15:03
08:00
18:00
EWTW - East-West
2012/01/17
2012/01/30
2012/03/16
50
F25A O/S
Transfer West
15:03
08:00
18:00
FIO - Flow Into
2012/02/14
2012/02/14
2012/04/13
Hawthorne T3 O/S, HTP1 + HT4
450
Ottawa
14:32
15:00
17:00
Bus open as C/A
Intertie Transmission Interface Limitations
Penalty
Date/Time
Start
End
Facility
Comments
Applied
Issued
Date/Time
Date/Time
The base ON to MI export limit is
Ontario - Michigan
2012/01/27
2011/11/01
2012/05/01
0
1775MW. LxD phase shifters on
Export Winter
10:46
00:00
00:00
neutral tap.
The base MI to ON import limit is
Ontario - Michigan
2012/01/27
2011/11/01
2012/05/01
0
1400MW. LxD phase shifters on
Import Winter
10:47
00:00
00:00
neutral tap.
Ontario Niagara - New
2012/01/19
2012/01/19
2012/12/31
The base ON to NY export limit is
0
York Export Winter
14:55
14:44
14:44
1650MW. BP76 os.
Ontario Niagara - New
2012/01/19
2012/01/19
2012/12/31
The base NY to ON import limit
0
York Import Winter
14:55
14:45
14:45
is 1050MW. BP76 os.
OMTW - Ontario-
2012/01/17
2012/01/30
2012/03/16
Manitoba Transfer
250
F25A O/S
15:01
08:00
19:00
West
OMTE - Ontario-
2012/01/17
2012/01/30
2012/03/16
Manitoba Transfer
70
F25A O/S
15:01
08:00
19:00
East
MPFN - Ontario-
2012/02/01
2012/01/30
2012/03/16
F25A with other equipment O/S
Minnesota Transfer
50
18:54
08:00
19:00
***extended***
North
Docket No. ER11-1844
Exhibit No. NYI-23
Page 16 of 47
MPFN - Ontario-
2012/01/17
2012/01/30
2012/03/16
Minnesota Transfer
25
F25A O/S
16:37
08:00
19:00
North
MPFS - Ontario-
2012/02/01
2012/01/30
2012/03/16
F25A with other equipment O/S
Minnesota Transfer
140
18:54
08:00
19:00
***extended***
South
MPFS - Ontario-
2012/01/17
2012/01/30
2012/03/16
Minnesota Transfer
90
F25A O/S
16:37
08:00
19:00
South
The ON to IM export limit is
Ontario - Michigan
2012/02/09
2012/02/13
2012/03/02
0
1700MW. L4D PAR byp + Keith
Export Winter
11:47
04:30
17:00
T22os.
The IM to ON import limit is
Ontario - Michigan
2012/02/09
2012/02/13
2012/03/02
0
1350MW. L4D PAR byp + Keith
Import Winter
11:47
04:30
17:00
T22os.
Docket No. ER11-1844
Exhibit No. NYI-23
Page 17 of 47
Urgent SSR Report for 2012/03/13 generated on 2012/03/13 09:58
System Advisory/Summary
System Advisory/Summary Hourly Details H1-12 Hourly Details H13-24 Transmission Interfaces SAA
Notes
Forecast Supply
Forecast Demand
Forecast Excess(Shortfall)
Energy Shortfall
Energy(MWhr)
Energy(MWhr)
Energy(MWhr)
Hours(Yes/No)
533061
369770
165883
No
System Advisory Notices-
Date/Time
Start
End
Comment
Title
Issued
Date/Time
Date/Time
Generating capacity of 250
Major Change Advisory -
2012/03/13
2012/03/13
2012/03/13
MW or greater has been
generation
09:58
12:00
16:00
forced from service.
Hourly Details H1-12
System Advisory/Summary Hourly Details H1-12 Hourly Details H13-24 Transmission Interfaces SAA
Notes
Forecast Supply
H1
H2
H3
H4
H5
H6
H7
H8
H9
H10
H11
H12
Energy(MWhr)
21002
20761
20704
20761
20919
22101
23048
22303
22212
22150
22369
22107
Capacity(MW)
32537
32537
32537
32537
32537
32537
32537
32537
32537
32537
32537
32537
Intermittent
575
575
575
575
575
575
575
575
575
575
575
575
(MWhr/hr)
Self-Sched
798
797
800
797
795
797
801
837
842
840
839
837
(MWhr/hr)
Energy Limit'd
3126
2886
2826
2886
3046
4226
5169
4612
4564
4424
4324
4064
(MWhr)
Energy Limit'd Cap
6916
6916
6916
6916
6916
6916
6916
6793
6793
6793
6793
6793
(MW)
Imports - Est'd
0
0
0
0
0
0
0
0
0
0
320
320
(MW)
Intermittent Capacity
696
696
696
696
696
696
696
696
696
696
696
696
(MW)
Self-Sched Capacity
1084
1084
1084
1084
1084
1084
1084
1084
1084
1084
1084
1084
(MW)
Outages East(MW)
7200
7201
7198
7201
7203
7201
7197
7508
7551
7473
7474
7476
Outages West(MW)
545
545
545
545
545
545
545
545
545
545
545
545
Total Outages
7745
7746
7743
7746
7748
7746
7742
8053
8096
8018
8019
8021
Forecast Demand
12470
12175
12021
12334
12867
14932
15665
15777
15935
15841
15791
15721
Primary Demand
Docket No. ER11-1844
Exhibit No. NYI-23
Page 18 of 47
East(MW)
Primary Demand
545
533
505
496
494
502
485
500
512
511
509
501
West(MW)
Primary Demand
13015
12708
12526
12830
13361
15434
16150
16277
16447
16352
16300
16222
Total(MW)
Dispatchable Load
108
108
108
108
108
108
108
108
108
108
108
108
(MW)
Total
GRH
Operating
1418
1418
1418
1418
1418
1418
1418
1418
1418
1418
1418
1418
(MW)
Reserve
(MW)
Min. 10-Minute OR
945
945
945
945
945
945
945
945
945
945
945
945
Min. 10-Minute Spin
236
236
236
236
236
236
236
236
236
236
236
236
OR
Load Forecast
0
0
0
0
0
0
0
0
0
0
0
0
Uncertainty
Add. Cont.
0
0
0
0
0
0
0
0
0
0
0
0
Allowance
Intrahour Margin
0
0
0
0
0
0
0
0
0
0
0
0
(MW)
Excess(Shortfall)
Energy(MWhr)
8095
8161
8286
8039
7666
6775
7006
6134
5873
5906
6177
5993
Capacity(MW)
10467
10773
10958
10651
10118
8047
7335
6897
6684
6857
7228
7304
Ancillary Services
AGC Range
100
100
100
100
100
100
100
100
100
100
100
100
Required (MW)
AGC Rate Required
50
50
50
50
50
50
50
50
50
50
50
50
(MW/Min)
AGC Range
200
200
200
200
200
200
200
200
200
200
200
200
Available (MW)
Reliability Must Run
0
0
0
0
0
0
0
0
0
0
0
0
Required (MW)
Black Start Adequate
Y Y Y Y Y Y Y Y Y Y Y Y
(Y/N)
Minimum Operating Reserve Requirements
East(MW)
0
0
0
0
0
0
0
0
0
0
0
0
West(MW)
0
0
0
0
0
0
0
0
0
0
0
0
Docket No. ER11-1844
Exhibit No. NYI-23
Page 19 of 47
Hourly Details H13-24
System Advisory/Summary Hourly Details H1-12 Hourly Details H13-24 Transmission Interfaces SAA
Notes
Forecast Supply
H13
H14
H15
H16
H17
H18
H19
H20
H21
H22
H23
H24
Energy(MWhr)
22589
22749
22849
22993
23307
23788
23985
23952
23291
19151
22291
21679
Capacity(MW)
32537
32537
32537
32537
32537
32537
32537
32537
32537
32537
32537
32537
Intermittent
575
575
575
575
575
575
575
575
575
575
575
575
(MWhr/hr)
Self-Sched
839
839
839
840
839
839
842
847
846
846
844
802
(MWhr/hr)
Energy Limit'd
4544
4704
4804
4967
5235
5055
5055
4767
4307
317
3709
3089
(MWhr)
Energy Limit'd Cap
6793
6793
6793
6793
6793
6840
6846
6846
6846
6846
6846
6846
(MW)
Imports - Est'd
320
320
320
300
300
300
400
650
450
300
50
100
(MW)
Intermittent Capacity
696
696
696
696
696
696
696
696
696
696
696
696
(MW)
Self-Sched Capacity
1084
1084
1084
1084
1084
1084
1084
1084
1084
1084
1084
1084
(MW)
Outages East(MW)
7474
7474
7474
7473
7427
6719
6616
6611
6612
6612
6614
6656
Outages West(MW)
545
545
545
545
545
545
545
545
545
545
545
545
Total Outages
8019
8019
8019
8018
7972
7264
7161
7156
7157
7157
7159
7201
Forecast Demand
Primary Demand
15638
15526
15371
15569
15864
15941
16460
16679
16175
15365
14302
13408
East(MW)
Primary Demand
491
485
474
462
461
467
488
502
497
516
517
490
West(MW)
Primary Demand
16129
16011
15845
16031
16325
16408
16948
17181
16672
15881
14819
13898
Total(MW)
Dispatchable Load
108
108
108
108
108
108
108
108
108
108
108
108
(MW)
Total
GRH
Operating
1418
1418
1418
1418
1418
1418
1418
1418
1418
1418
1418
1418
(MW)
Reserve
(MW)
Min. 10-Minute OR
945
945
945
945
945
945
945
945
945
945
945
945
Min. 10-Minute Spin
236
236
236
236
236
236
236
236
236
236
236
236
OR
Load Forecast
0
0
0
0
0
0
0
0
0
0
0
0
Uncertainty
0
0
0
0
0
0
0
0
0
0
0
0
Add. Cont.
Docket No. ER11-1844
Exhibit No. NYI-23
Page 20 of 47
Allowance
Intrahour Margin
0
0
0
0
0
0
0
0
0
0
0
0
(MW)
Excess(Shortfall)
Energy(MWhr)
6568
6846
7112
7070
7090
7488
7145
6879
6727
3378
7580
7889
Capacity(MW)
7399
7517
7683
7478
7230
7855
7518
7540
7848
8489
9299
10228
Ancillary Services
AGC Range
100
100
100
100
100
100
100
100
100
100
100
100
Required (MW)
AGC Rate Required
50
50
50
50
50
50
50
50
50
50
50
50
(MW/Min)
AGC Range
200
200
200
200
200
200
200
200
200
200
200
200
Available (MW)
Reliability Must Run
0
0
0
0
0
0
0
0
0
0
0
0
Required (MW)
Black Start Adequate
Y Y Y Y Y Y Y Y Y Y Y Y
(Y/N)
Minimum Operating Reserve Requirements
East(MW)
0
0
0
0
0
0
0
0
0
0
0
0
West(MW)
0
0
0
0
0
0
0
0
0
0
0
0
Docket No. ER11-1844
Exhibit No. NYI-23
Page 21 of 47
SAA Notes
System Advisory/Summary Hourly Details H1-12 Hourly Details H13-24 Transmission Interfaces SAA
Notes
Security and Adequacy
Date/Time
Start
End
Comment
Assessment Notes-Title
Issued
Date/Time
Date/Time
Docket No. ER11-1844
Exhibit No. NYI-23
Page 22 of 47
Transmission Interfaces
System Advisory/Summary Hourly Details H1-12 Hourly Details H13-24 Transmission Interfaces SAA
Notes
Internal Transmission Interface Limitations
Operating
Date/Time
Start
End
Facility
Comments
Limit
Issued
Date/Time
Date/Time
TEK - Transfer East
2012/03/07
2012/01/30
2012/03/16
300
F25A o/s.
of Kenora
10:52
08:00
18:00
TEM - Transfer East
2012/03/07
2012/01/30
2012/03/16
250
F25A o/s.
of Mackenzie
10:52
08:00
18:00
EWTE - East-West
2012/03/07
2012/01/30
2012/03/16
250
F25A o/s.
Transfer East
10:52
08:00
18:00
EWTW - East-West
2012/03/07
2012/01/30
2012/03/16
300
F25A o/s.
Transfer West
10:53
08:00
18:00
TWM - Transfer
2012/03/07
2012/01/30
2012/03/16
150
F25A o/s.
West of Mackenzie
10:52
08:00
18:00
FIO - Flow Into
2012/03/07
2012/02/14
2012/04/13
Hawthorne T3 o/s, HT1P1 +
2400
Ottawa
10:53
15:00
17:00
HT4 Bus open as C/A.
FIO - Flow Into
2012/03/07
2012/03/05
2012/03/15
Hawthorne T3 and M29C o/s
1600
Ottawa
10:53
04:00
16:00
(Hawth HT1P1 cosed - NO C/A).
Hawthorne T3 and M29C o/s
FIO - Flow Into
2012/03/12
2012/03/05
2012/03/15
2300
(Hawth HT1P1 and HT4 Bus o/s
Ottawa
14:59
04:00
16:00
- C/A).
Madawaska
Generation -
2012/03/07
2012/03/07
2012/12/31
All i/s. Assumed 25 MW G/R
400
Madawaska 115 kV
14:33
10:16
23:59
armed.
generation
Flow North - flow
north on circuits
2012/03/07
2012/03/07
2012/12/31
1900
All i/s.
X503E, X504E and
11:12
11:10
23:00
D5H
Flow South - flow
south on circuits
2012/03/07
2012/03/07
2012/12/31
1550
All i/s.
X503E, X504E and
11:13
11:12
23:00
D5H
WMFE - Wawa-
2012/03/07
2012/03/07
2012/12/31
WMFE-230-115 < 590 MW. All
590
Mackay Flow East
11:14
11:13
23:00
i/s.
TEK - Transfer East
2012/03/07
2012/03/07
2012/12/31
350
All i/s.
of Kenora
10:42
14:00
23:59
SFW Global -
2012/03/07
2012/03/07
2012/12/31
Sudbury Flow West
9999
All i/s.
10:43
14:00
23:59
Global
FID - Flow Into
2012/03/07
2012/03/07
2012/12/31
390
All i/s.
Dobbin
10:43
14:00
23:59
Docket No. ER11-1844
Exhibit No. NYI-23
Page 23 of 47
FIO - Flow Into
2012/03/07
2012/03/07
2012/12/31
2900
All i/s.
Ottawa
10:43
14:00
23:59
Miss(Ecct)E -
2012/03/07
2012/03/07
2012/12/31
Mississagi East
550
All i/s.
10:43
14:00
23:59
Circuits Flow East
Miss(Ecct)W -
2012/03/07
2012/03/07
2012/12/31
Mississagi East
9999
All i/s.
10:43
14:00
23:59
Circuits Flow West
EWTW - East-West
2012/03/07
2012/03/07
2012/12/31
350
All i/s.
Transfer West
10:43
14:00
23:59
EWTE - East-West
2012/03/07
2012/03/07
2012/12/31
325
All i/s.
Transfer East
10:43
14:00
23:59
TEM - Transfer East
2012/03/07
2012/03/07
2012/12/31
475
All i/s.
of Mackenzie
10:43
14:00
23:59
TWM - Transfer
2012/03/07
2012/03/07
2012/12/31
350
All i/s.
West of Mackenzie
10:43
14:00
23:59
Lakehead(Ecct)E -
2012/03/07
2012/03/07
2012/12/31
Lakehead East
9999
All i/s.
10:43
14:00
23:59
Circuit Flow East
Chats Falls Area
Generation - Chats
2012/03/07
2012/03/07
2012/12/31
650
All i/s.
Falls GS 230 kV
14:29
14:26
23:59
Area Generation
P33C Inflow - P33C
2012/03/07
2012/03/07
2012/12/31
335
All i/s.
Chats Falls Inflow
15:16
14:28
23:59
2012/03/07
2012/03/07
2012/12/31
All i/s. Assumed maximum G/R
Beauharnois Delivery
790
15:16
14:32
23:59
armed.
D5A Import - D5A
2012/03/07
2012/03/07
2012/12/31
Import From
240
All i/s.
14:55
14:34
23:59
Maclaren
D5A Export - D5A
2012/03/07
2012/03/07
2012/12/31
Export From
190
All i/s.
14:55
14:35
23:59
Maclaren
FABCW - Flow
Away From Bruce
2012/03/08
2012/03/08
2012/12/31
Complex plus wind
5800
All i/s.
10:51
10:51
23:59
generation in the
Bruce Area
Positive BLIP -
2012/03/08
2012/03/08
2012/12/31
Positive Buchanan
3000
All i/s.
10:52
10:51
23:59
Longwood Input
Negative BLIP -
2012/03/08
2012/03/08
2012/12/31
Negative Buchanan
1500
All i/s.
10:53
10:52
23:59
Longwood Input
FETT - Flow East To
2012/03/08
2012/03/08
2012/12/31
5000
All i/s.
Toronto
10:54
10:54
23:59
CLAN - Claireville
2012/03/08
2012/03/08
2012/12/31
Docket No. ER11-1844
Exhibit No. NYI-23
Page 24 of 47
North
2000
10:55
10:54
23:59
All i/s,
CLAS - Claireville
2012/03/08
2012/03/08
2012/12/31
1000
All i/s.
South
10:55
10:55
23:59
WMFE - Wawa-
2012/03/09
2012/03/12
2012/03/15
WMFE-230 < 515 MW, Sault#3
515
Mackay Flow East
09:06
07:00
17:00
o/s
WMFE - Wawa-
2012/03/09
2012/03/13
2012/03/14
WAWAFE < 350 MW, W23K
350
Mackay Flow East
09:09
06:30
16:30
o/s.
Hawthorne T3, M29C and
FIO - Flow Into
2012/03/07
2012/03/13
2012/03/14
2250
Merivale SC11 o/s,(Hawth
Ottawa
14:22
07:45
16:00
HT1P1 and HT4 Bus o/s - C/A).
Intertie Transmission Interface Limitations
Operating
Date/Time
Start
End
Facility
Comments
Limit
Issued
Date/Time
Date/Time
Ontario - Michigan
2012/03/07
2011/11/01
2012/05/01
LxD phase shifters on neutral
1775
Export Winter
10:44
00:00
00:00
tap.
Ontario - Michigan
2012/03/07
2011/11/01
2012/05/01
LxD phase shifters on neutral
1400
Import Winter
10:45
00:00
00:00
tap.
Ontario Niagara -
2012/03/07
2012/01/19
2012/12/31
New York Export
1650
BP76 o/s.
10:55
14:44
14:44
Winter
Ontario Niagara -
2012/03/07
2012/01/19
2012/12/31
New York Import
1050
BP76 o/s.
10:55
14:45
14:45
Winter
OMTW - Ontario-
2012/03/07
2012/01/30
2012/03/16
Manitoba Transfer
50
F25A o/s.
10:55
08:00
19:00
West
OMTE - Ontario-
2012/03/07
2012/01/30
2012/03/16
Manitoba Transfer
230
F25A o/s.
10:55
08:00
19:00
East
Ontario - Michigan
2012/03/07
2012/02/13
2012/03/31
L4D PAR byp + PS5 SS on
1700
Export Winter
15:06
04:30
18:00
single supply.
Ontario - Michigan
2012/03/07
2012/02/13
2012/03/31
L4D PAR byp + PS5 SS on
1350
Import Winter
15:06
04:30
18:00
single supply.
Ontario - Michigan
2012/03/07
2012/02/22
2012/03/31
1880
L4D Par Byp.
Export Winter
10:46
00:00
00:00
Ontario - Michigan
2012/03/07
2012/02/22
2012/03/31
1500
L4D Par Byp.
Import Winter
10:46
00:00
00:00
MPFN - Ontario-
2012/03/08
2012/03/06
2012/03/16
Minnesota Transfer
50
F25A o/s + other equipment o/s
11:16
08:00
19:00
North
MPFS - Ontario-
2012/03/08
2012/03/06
2012/03/16
Minnesota Transfer
10
F25A o/s + other equipment o/s
11:16
08:00
19:00
South
Ontario - Quebec
75
All i/s.
Rapide 115 kV
2012/03/07
2012/03/07
2012/04/30
Docket No. ER11-1844
Exhibit No. NYI-23
Page 25 of 47
Import Winter or
11:17
11:15
23:00
Summer
Ontario - Quebec
Kipawa 115 kV
2012/03/07
2012/03/07
2012/04/30
100
All i/s.
Export Winter or
11:18
11:17
23:00
Summer
OMTW - Ontario-
2012/03/07
2012/03/07
2012/12/31
Manitoba Transfer
300
All i/s.
10:46
14:00
23:59
West
MPFS - Ontario-
2012/03/07
2012/03/07
2012/12/31
Minnesota Transfer
150
All i/s.
10:47
14:00
23:59
South
MPFN - Ontario-
2012/03/07
2012/03/07
2012/12/31
Minnesota Transfer
100
All i/s.
10:46
14:00
23:59
North
OMTE - Ontario-
2012/03/07
2012/03/07
2012/12/31
Manitoba Transfer
300
All i/s.
10:46
14:00
23:59
East
Ontario - Quebec
Beauharnois 230 kV
2012/03/07
2012/03/07
2012/12/31
460
All i/s.
Export Winter or
15:19
14:58
23:59
Summer
Ontario - Quebec
Beauharnois 230 kV
2012/03/07
2012/03/07
2012/12/31
790
All i/s.
Import Winter or
15:19
14:59
23:59
Summer
Ontario - Quebec
Maclaren 230 kV
2012/03/07
2012/03/07
2012/12/31
190
All i/s.
Export Winter or
15:21
15:20
23:59
Summer
Ontario - Quebec
Maclaren 230 kV
2012/03/07
2012/03/07
2012/12/31
240
All i/s.
Import Winter or
15:22
15:21
23:59
Summer
Ontario - Quebec
Masson 115 kV
2012/03/07
2012/03/07
2012/12/31
50
All i/s.
Export Winter or
15:23
15:22
23:59
Summer
Ontario - Quebec
Masson 115 kV
2012/03/07
2012/03/07
2012/12/31
166
All i/s.
Import Winter or
15:25
15:24
23:59
Summer
Ontario - Quebec
Paugan 230 kV
2012/03/07
2012/03/07
2012/12/31
0
All i/s.
Export Winter or
15:28
15:26
23:09
Summer
Ontario - Quebec
Paugan 230 kV
2012/03/07
2012/03/07
2012/12/31
Docket No. ER11-1844
Exhibit No. NYI-23
Page 26 of 47
Import Winter or
15:30
15:28
23:59
335
All i/s.
Summer
Ontario - Quebec
2012/03/07
2012/03/07
2012/12/31
Quyon 230 kV
140
All i/s.
15:34
15:30
23:59
Export Winter
Ontario - Quebec
2012/03/07
2012/03/07
2012/12/31
Quyon 230 kV
0
All i/s.
15:33
15:32
23:59
Import Winter
Ontario - Quebec
2012/03/07
2012/03/07
2012/12/31
Quyon 203 kV
120
All i/s.
15:33
15:33
23:59
Export Summer
Ontario - Quebec
2012/03/07
2012/03/07
2012/12/31
Quyon 203 kV
0
All i/s.
15:36
15:35
23:59
Import Summer
Ontario - Quebec
Bryson 115 kV
2012/03/07
2012/03/07
2012/12/31
0
All i/s.
Export Winter or
15:38
15:37
23:59
Summer
Ontario - Quebec
Bryson 115 kV
2012/03/07
2012/03/07
2012/12/31
65
All i/s.
Import Winter or
15:39
15:38
23:59
Summer
Ontario - Quebec
Outaouais 230 kV
2012/03/07
2012/03/07
2012/12/31
1230
All i/s.
Export Winter or
15:41
15:40
23:59
Summer
Ontario - Quebec
Outaouais 230 kV
2012/03/07
2012/03/07
2012/12/31
1230
All i/s.
Import Winter or
15:41
15:41
23:59
Summer
Ontario - Quebec
Outaouais 230 kV
2012/03/12
2012/03/10
2012/03/17
GC1 and GC2 O/S. *** Updated
0
Export Winter or
08:58
19:33
18:00
Summer
Ontario - Quebec
Outaouais 230 kV
2012/03/12
2012/03/10
2012/03/17
GC1 and GC2 O/S. *** Updated
0
Import Winter or
08:58
19:33
18:00
Summer
Ontario Niagara -
2012/03/09
2012/03/12
2012/03/16
New York Export
800
PA30x o/s + BP76 i/s.
15:32
05:30
17:00
Winter
Ontario Niagara -
2012/03/09
2012/03/12
2012/03/16
New York Import
1040
PA30x o/s + BP76 i/s.
10:23
05:30
17:00
Winter
Ontario - Michigan
2012/03/09
2012/03/12
2012/03/23
L4D PAR byp + Keith T22/23
1700
Export Winter
15:31
06:00
18:00
o/s.
1350
Ontario - Michigan
2012/03/07
2012/03/12
2012/03/23
L4D PAR byp + Keith T22/23
Docket No. ER11-1844
Exhibit No. NYI-23
Page 27 of 47
Import Winter
10:56
06:00
18:00
o/s.
MPFN - Ontario-
2012/03/08
2012/03/13
2012/03/15
F25A + FF T2/A-Bus o/s + other
Minnesota Transfer
50
11:16
08:00
19:00
equipment o/s
North
MPFS - Ontario-
2012/03/08
2012/03/13
2012/03/15
F25A + FF T2/A-Bus o/s + other
Minnesota Transfer
10
11:16
08:00
19:00
equipment o/s
South
Docket No. ER11-1844
Exhibit No. NYI-23
Page 28 of 47
Urgent SSR Report for 2012/04/01 generated on 2012/04/01 12:17
System Advisory/Summary
System Advisory/Summary Hourly Details H1-12 Hourly Details H13-24 Transmission Interfaces SAA
Notes
Forecast Supply
Forecast Demand
Forecast Excess(Shortfall)
Energy Shortfall
Energy(MWhr)
Energy(MWhr)
Energy(MWhr)
Hours(Yes/No)
538332
348998
191926
No
System Advisory Notices-
Date/Time
Start
End
Comment
Title
Issued
Date/Time
Date/Time
Primary demand forecast has
2012/04/01
2012/04/01
2012/04/01
Major Change Advisory - load
been increased by greater than
12:16
14:00
18:00
1.5% in HE15- HE18.
Hourly Details H1-12
System Advisory/Summary Hourly Details H1-12 Hourly Details H13-24 Transmission Interfaces SAA
Notes
Forecast Supply
H1
H2
H3
H4
H5
H6
H7
H8
H9
H10
H11
H12
Energy(MWhr)
22343
21295
21280
21549
21629
21720
21411
21809
22522
22934
22916
22555
Capacity(MW)
32537
32537
32537
32537
32537
32537
32537
32537
32537
32537
32537
32537
Intermittent
430
430
430
430
430
430
430
430
430
430
430
430
(MWhr/hr)
Self-Sched
787
785
785
786
786
785
777
750
747
743
735
731
(MWhr/hr)
Energy Limit'd
4321
4201
4201
4201
4281
4641
4663
4963
5445
5556
5596
5636
(MWhr)
Energy Limit'd Cap
6411
6411
6762
6494
6494
6762
6572
6522
6705
6705
6755
6762
(MW)
Imports - Est'd
0
0
0
0
0
0
108
108
0
0
0
0
(MW)
Intermittent Capacity
540
540
540
540
540
540
540
540
540
540
540
540
(MW)
Self-Sched Capacity
1084
1084
1084
1084
1084
1084
1084
1084
1084
1084
1084
1084
(MW)
Outages East(MW)
7481
8409
8073
8072
8072
8073
8702
8654
8132
7831
7839
8233
Outages West(MW)
623
623
623
623
623
623
623
623
623
623
623
623
Total Outages
8104
9032
8696
8695
8695
8696
9325
9277
8755
8454
8462
8856
Forecast Demand
12403
12150
11950
11820
11891
12267
12709
13694
14236
14466
14726
14979
Primary Demand
Docket No. ER11-1844
Exhibit No. NYI-23
Page 29 of 47
East(MW)
Primary Demand
483
477
472
473
469
485
502
514
533
457
459
469
West(MW)
Primary Demand
12886
12627
12422
12293
12360
12752
13211
14208
14769
14923
15185
15448
Total(MW)
Dispatchable Load
108
108
108
108
108
108
108
108
108
108
108
108
(MW)
Total
GRH
Operating
1418
1418
1418
1418
1418
1418
1418
1418
1418
1418
1418
1418
(MW)
Reserve
(MW)
Min. 10-Minute OR
945
945
945
945
945
945
945
945
945
945
945
945
Min. 10-Minute Spin
236
236
236
236
236
236
236
236
236
236
236
236
OR
Load Forecast
0
0
0
0
0
0
0
0
0
0
0
0
Uncertainty
Add. Cont.
0
0
0
0
0
0
0
0
0
0
0
0
Allowance
Intrahour Margin
0
0
0
0
0
0
0
0
0
0
0
0
(MW)
Excess(Shortfall)
Energy(MWhr)
9565
8776
8966
9364
9377
9076
8308
7709
7861
8119
7839
7215
Capacity(MW)
10237
9568
10109
10239
10172
9779
8799
7850
7703
7850
7580
6923
Ancillary Services
AGC Range
100
100
100
100
100
100
100
100
100
100
100
100
Required (MW)
AGC Rate Required
50
50
50
50
50
50
50
50
50
50
50
50
(MW/Min)
AGC Range
200
200
200
200
200
200
200
200
200
200
200
200
Available (MW)
Reliability Must Run
0
0
0
0
0
0
0
0
0
0
0
0
Required (MW)
Black Start Adequate
Y Y Y Y Y Y Y Y Y Y Y Y
(Y/N)
Minimum Operating Reserve Requirements
East(MW)
0
0
0
0
0
0
0
0
0
0
0
0
West(MW)
0
0
0
0
0
0
0
0
0
0
0
0
Docket No. ER11-1844
Exhibit No. NYI-23
Page 30 of 47
Hourly Details H13-24
System Advisory/Summary Hourly Details H1-12 Hourly Details H13-24 Transmission Interfaces SAA
Notes
Forecast Supply
H13
H14
H15
H16
H17
H18
H19
H20
H21
H22
H23
H24
Energy(MWhr)
22473
22777
22752
22855
23188
23233
23459
23425
23043
22884
22489
21791
Capacity(MW)
32537
32537
32537
32537
32537
32537
32537
32537
32537
32537
32537
32537
Intermittent
430
430
430
430
430
430
430
430
430
430
430
430
(MWhr/hr)
Self-Sched
729
728
723
723
728
733
762
768
771
772
768
773
(MWhr/hr)
Energy Limit'd
5556
5456
5436
5539
5867
5907
5839
5699
5679
5519
5128
4425
(MWhr)
Energy Limit'd Cap
6762
6762
6762
6762
6762
6762
6844
6844
6844
6844
6844
6844
(MW)
Imports - Est'd
0
0
0
0
0
0
265
365
0
0
0
0
(MW)
Intermittent Capacity
540
540
540
540
540
540
540
540
540
540
540
540
(MW)
Self-Sched Capacity
1084
1084
1084
1084
1084
1084
1084
1084
1084
1084
1084
1084
(MW)
Outages East(MW)
8235
7831
7836
7836
7831
7826
7715
7709
7706
7705
7709
7704
Outages West(MW)
623
623
623
623
623
623
623
623
623
623
623
623
Total Outages
8858
8454
8459
8459
8454
8449
8338
8332
8329
8328
8332
8327
Forecast Demand
Primary Demand
15075
15054
15060
15343
15482
15461
15634
16117
15407
14500
13552
12835
East(MW)
Primary Demand
473
470
484
514
520
557
571
583
579
567
546
530
West(MW)
Primary Demand
15548
15524
15544
15857
16002
16018
16205
16700
15986
15067
14098
13365
Total(MW)
Dispatchable Load
108
108
108
108
108
108
108
108
108
108
108
108
(MW)
Total
GRH
Operating
1418
1418
1418
1418
1418
1418
1418
1418
1418
1418
1418
1418
(MW)
Reserve
(MW)
Min. 10-Minute OR
945
945
945
945
945
945
945
945
945
945
945
945
Min. 10-Minute Spin
236
236
236
236
236
236
236
236
236
236
236
236
OR
Load Forecast
0
0
0
0
0
0
0
0
0
0
0
0
Uncertainty
0
0
0
0
0
0
0
0
0
0
0
0
Add. Cont.
Docket No. ER11-1844
Exhibit No. NYI-23
Page 31 of 47
Allowance
Intrahour Margin
0
0
0
0
0
0
0
0
0
0
0
0
(MW)
Excess(Shortfall)
Energy(MWhr)
7033
7361
7316
7106
7294
7323
7362
6833
7165
7925
8499
8534
Capacity(MW)
6821
7249
7224
6911
6771
6760
6949
6560
6912
7832
8797
9535
Ancillary Services
AGC Range
100
100
100
100
100
100
100
100
100
100
100
100
Required (MW)
AGC Rate Required
50
50
50
50
50
50
50
50
50
50
50
50
(MW/Min)
AGC Range
200
200
200
200
200
200
200
200
200
200
200
200
Available (MW)
Reliability Must Run
0
0
0
0
0
0
0
0
0
0
0
0
Required (MW)
Black Start Adequate
Y Y Y Y Y Y Y Y Y Y Y Y
(Y/N)
Minimum Operating Reserve Requirements
East(MW)
0
0
0
0
0
0
0
0
0
0
0
0
West(MW)
0
0
0
0
0
0
0
0
0
0
0
0
Docket No. ER11-1844
Exhibit No. NYI-23
Page 32 of 47
SAA Notes
System Advisory/Summary Hourly Details H1-12 Hourly Details H13-24 Transmission Interfaces SAA
Notes
Security and Adequacy
Date/Time
Start
End
Comment
Assessment Notes-Title
Issued
Date/Time
Date/Time
Docket No. ER11-1844
Exhibit No. NYI-23
Page 33 of 47
Transmission Interfaces
System Advisory/Summary Hourly Details H1-12 Hourly Details H13-24 Transmission Interfaces SAA
Notes
Internal Transmission Interface Limitations
Operating
Date/Time
Start
End
Facility
Comments
Limit
Issued
Date/Time
Date/Time
FIO - Flow Into
2012/03/07
2012/02/14
2012/04/13
Hawthorne T3 o/s, HT1P1 +
2400
Ottawa
10:53
15:00
17:00
HT4 Bus open as C/A.
Madawaska
Generation -
2012/03/07
2012/03/07
2012/12/31
All i/s. Assumed 25 MW G/R
400
Madawaska 115 kV
14:33
10:16
23:59
armed.
generation
Flow North - flow
north on circuits
2012/03/07
2012/03/07
2012/12/31
1900
All i/s.
X503E, X504E and
11:12
11:10
23:00
D5H
Flow South - flow
south on circuits
2012/03/07
2012/03/07
2012/12/31
1550
All i/s.
X503E, X504E and
11:13
11:12
23:00
D5H
WMFE - Wawa-
2012/03/20
2012/03/07
2012/12/31
590
All i/s.
Mackay Flow East
11:41
11:13
23:00
TEK - Transfer East
2012/03/07
2012/03/07
2012/12/31
350
All i/s.
of Kenora
10:42
14:00
23:59
TEM - Transfer East
2012/03/07
2012/03/07
2012/12/31
475
All i/s.
of Mackenzie
10:43
14:00
23:59
Lakehead(Ecct)E -
2012/03/07
2012/03/07
2012/12/31
Lakehead East
9999
All i/s.
10:43
14:00
23:59
Circuit Flow East
EWTE - East-West
2012/03/07
2012/03/07
2012/12/31
325
All i/s.
Transfer East
10:43
14:00
23:59
TWM - Transfer
2012/03/07
2012/03/07
2012/12/31
350
All i/s.
West of Mackenzie
10:43
14:00
23:59
EWTW - East-West
2012/03/07
2012/03/07
2012/12/31
350
All i/s.
Transfer West
10:43
14:00
23:59
SFW Global -
2012/03/07
2012/03/07
2012/12/31
Sudbury Flow West
9999
All i/s.
10:43
14:00
23:59
Global
FID - Flow Into
2012/03/07
2012/03/07
2012/12/31
390
All i/s.
Dobbin
10:43
14:00
23:59
FIO - Flow Into
2012/03/07
2012/03/07
2012/12/31
2900
All i/s.
Ottawa
10:43
14:00
23:59
2012/03/07
2012/03/07
2012/12/31
Miss(Ecct)W -
9999
All i/s.
10:43
14:00
23:59
Mississagi East
Docket No. ER11-1844
Exhibit No. NYI-23
Page 34 of 47
Circuits Flow West
Miss(Ecct)E -
2012/03/07
2012/03/07
2012/12/31
Mississagi East
550
All i/s.
10:43
14:00
23:59
Circuits Flow East
Chats Falls Area
Generation - Chats
2012/03/07
2012/03/07
2012/12/31
650
All i/s.
Falls GS 230 kV
14:29
14:26
23:59
Area Generation
P33C Inflow - P33C
2012/03/07
2012/03/07
2012/12/31
335
All i/s.
Chats Falls Inflow
15:16
14:28
23:59
2012/03/07
2012/03/07
2012/12/31
All i/s. Assumed maximum G/R
Beauharnois Delivery
790
15:16
14:32
23:59
armed.
D5A Import - D5A
2012/03/07
2012/03/07
2012/12/31
Import From
240
All i/s.
14:55
14:34
23:59
Maclaren
D5A Export - D5A
2012/03/07
2012/03/07
2012/12/31
Export From
190
All i/s.
14:55
14:35
23:59
Maclaren
FABCW - Flow
Away From Bruce
2012/03/08
2012/03/08
2012/12/31
Complex plus wind
5800
All i/s.
10:51
10:51
23:59
generation in the
Bruce Area
Positive BLIP -
2012/03/08
2012/03/08
2012/12/31
Positive Buchanan
3000
All i/s.
10:52
10:51
23:59
Longwood Input
Negative BLIP -
2012/03/08
2012/03/08
2012/12/31
Negative Buchanan
1500
All i/s.
10:53
10:52
23:59
Longwood Input
FETT - Flow East To
2012/03/08
2012/03/08
2012/12/31
5000
All i/s.
Toronto
10:54
10:54
23:59
CLAN - Claireville
2012/03/08
2012/03/08
2012/12/31
2000
All i/s,
North
10:55
10:54
23:59
CLAS - Claireville
2012/03/08
2012/03/08
2012/12/31
1000
All i/s.
South
10:55
10:55
23:59
TEK - Transfer East
2012/03/15
2012/03/19
2012/05/10
175
K24F o/s.
of Kenora
12:11
11:30
16:30
TEM - Transfer East
2012/03/07
2012/03/19
2012/05/10
300
K24F o/s.
of Mackenzie
10:54
11:30
16:30
EWTE - East-West
2012/03/07
2012/03/19
2012/05/10
250
K24F o/s.
Transfer East
10:54
11:30
16:30
FABCW - Flow
B561M o/s. Note: This outage is
Away From Bruce
2012/03/30
2012/03/26
2012/04/05
Monday to Thursdays only.
Complex plus wind
4700
05:55
06:00
19:00
B561M will be in service
generation in the
Fridays, Saturdays and Sundays.
Bruce Area
B561M o/s. Note: This outage is
Docket No. ER11-1844
Exhibit No. NYI-23
Page 35 of 47
Negative BLIP -
Monday to Thursdays only.
2012/03/30
2012/03/26
2012/04/05
Negative Buchanan
350
B561M will be in service
05:55
06:00
19:00
Longwood Input
Fridays, Saturdays and Sundays.
B561M o/s. Note: This outage is
FETT - Flow East To
2012/03/30
2012/03/26
2012/04/05
Monday to Thursdays only.
4500
Toronto
05:55
06:00
19:00
B561M will be in service
Fridays, Saturdays and Sundays.
GLP Inflow Limit penalized by
2012/03/29
2012/03/29
2012/04/02
Other
295
70 MW due to Third Line 405
09:51
09:48
16:00
breaker O/S.
TEK - Transfer East
2012/03/30
2012/03/30
2012/04/02
K6F forced o/s with K24F on
100
of Kenora
14:27
08:37
23:59
planned outage.
Flow North - flow
north on circuits
2012/03/30
2012/03/30
2012/04/05
1450
Essa JL504 on outage.
X503E, X504E and
14:30
14:28
18:00
D5H
Intertie Transmission Interface Limitations
Operating
Date/Time
Start
End
Facility
Comments
Limit
Issued
Date/Time
Date/Time
Ontario - Michigan
2012/03/29
2011/11/01
2012/04/05
LxD phase shifters on neutral
1775
Export Winter
10:01
00:00
16:30
tap.
Ontario - Michigan
2012/03/29
2011/11/01
2012/04/05
LxD phase shifters on neutral
1400
Import Winter
10:01
00:00
16:30
tap.
Ontario Niagara -
2012/03/07
2012/01/19
2012/12/31
New York Export
1650
BP76 o/s.
10:55
14:44
14:44
Winter
Ontario Niagara -
2012/03/07
2012/01/19
2012/12/31
New York Import
1050
BP76 o/s.
10:55
14:45
14:45
Winter
Ontario - Michigan
2012/03/29
2012/02/13
2012/04/05
L4D PAR byp + PS5 SS on
1700
Export Winter
10:01
04:30
16:30
single supply.
Ontario - Michigan
2012/03/29
2012/02/13
2012/04/05
L4D PAR byp + PS5 SS on
1350
Import Winter
10:01
04:30
16:30
single supply.
Ontario - Michigan
2012/03/29
2012/02/22
2012/04/05
1880
L4D Par Byp.
Export Winter
10:02
00:00
16:30
Ontario - Michigan
2012/03/29
2012/02/22
2012/04/05
1500
L4D Par Byp.
Import Winter
10:02
00:00
16:30
Ontario - Quebec
Kipawa 115 kV
2012/03/07
2012/03/07
2012/04/30
100
All i/s.
Export Winter or
11:18
11:17
23:00
Summer
OMTW - Ontario-
2012/03/07
2012/03/07
2012/12/31
Manitoba Transfer
300
All i/s.
10:46
14:00
23:59
West
OMTE - Ontario-
300
All i/s.
Manitoba Transfer
2012/03/07
2012/03/07
2012/12/31
Docket No. ER11-1844
Exhibit No. NYI-23
Page 36 of 47
East
10:46
14:00
23:59
MPFN - Ontario-
2012/03/07
2012/03/07
2012/12/31
Minnesota Transfer
100
All i/s.
10:46
14:00
23:59
North
MPFS - Ontario-
2012/03/07
2012/03/07
2012/12/31
Minnesota Transfer
150
All i/s.
10:47
14:00
23:59
South
Ontario - Quebec
Beauharnois 230 kV
2012/03/07
2012/03/07
2012/12/31
460
All i/s.
Export Winter or
15:19
14:58
23:59
Summer
Ontario - Quebec
Beauharnois 230 kV
2012/03/07
2012/03/07
2012/12/31
790
All i/s.
Import Winter or
15:19
14:59
23:59
Summer
Ontario - Quebec
Maclaren 230 kV
2012/03/07
2012/03/07
2012/12/31
190
All i/s.
Export Winter or
15:21
15:20
23:59
Summer
Ontario - Quebec
Maclaren 230 kV
2012/03/07
2012/03/07
2012/12/31
240
All i/s.
Import Winter or
15:22
15:21
23:59
Summer
Ontario - Quebec
Masson 115 kV
2012/03/07
2012/03/07
2012/12/31
50
All i/s.
Export Winter or
15:23
15:22
23:59
Summer
Ontario - Quebec
Masson 115 kV
2012/03/07
2012/03/07
2012/12/31
166
All i/s.
Import Winter or
15:25
15:24
23:59
Summer
Ontario - Quebec
Paugan 230 kV
2012/03/07
2012/03/07
2012/12/31
0
All i/s.
Export Winter or
15:28
15:26
23:09
Summer
Ontario - Quebec
Paugan 230 kV
2012/03/07
2012/03/07
2012/12/31
335
All i/s.
Import Winter or
15:30
15:28
23:59
Summer
Ontario - Quebec
2012/03/07
2012/03/07
2012/12/31
Quyon 230 kV
140
All i/s.
15:34
15:30
23:59
Export Winter
Ontario - Quebec
2012/03/07
2012/03/07
2012/12/31
Quyon 230 kV
0
All i/s.
15:33
15:32
23:59
Import Winter
Ontario - Quebec
2012/03/07
2012/03/07
2012/12/31
Quyon 203 kV
120
All i/s.
15:33
15:33
23:59
Export Summer
Docket No. ER11-1844
Exhibit No. NYI-23
Page 37 of 47
Ontario - Quebec
2012/03/07
2012/03/07
2012/12/31
Quyon 203 kV
0
All i/s.
15:36
15:35
23:59
Import Summer
Ontario - Quebec
Bryson 115 kV
2012/03/07
2012/03/07
2012/12/31
0
All i/s.
Export Winter or
15:38
15:37
23:59
Summer
Ontario - Quebec
Bryson 115 kV
2012/03/07
2012/03/07
2012/12/31
65
All i/s.
Import Winter or
15:39
15:38
23:59
Summer
Ontario - Quebec
Outaouais 230 kV
2012/03/07
2012/03/07
2012/12/31
1230
All i/s.
Export Winter or
15:41
15:40
23:59
Summer
Ontario - Quebec
Outaouais 230 kV
2012/03/07
2012/03/07
2012/12/31
1230
All i/s.
Import Winter or
15:41
15:41
23:59
Summer
OMTW - Ontario-
2012/03/07
2012/03/19
2012/05/10
Manitoba Transfer
50
K24F o/s.
10:57
11:30
17:30
West
MPFS - Ontario-
2012/03/07
2012/03/19
2012/05/10
Minnesota Transfer
30
K24F o/s.
10:57
11:30
17:30
South
MPFN - Ontario-
2012/03/07
2012/03/19
2012/05/10
Minnesota Transfer
50
K24F o/s.
10:57
11:30
17:30
North
OMTE - Ontario-
2012/03/07
2012/03/19
2012/05/10
Manitoba Transfer
250
K24F o/s.
10:57
11:30
17:30
East
Ontario - Quebec
Rapide 115 kV
2012/03/30
2012/03/29
2012/04/06
0
D4Z o/s.
Import Winter or
14:30
10:15
16:00
Summer
OMTE - Ontario-
2012/03/30
2012/03/30
2012/04/02
K6F forced o/s with K24F on
Manitoba Transfer
100
14:30
08:38
23:59
planned outage.
East
Ontario - Michigan
2012/03/30
2012/03/30
2012/04/05
B3N nt + L4D PAR b/p + PS5
1730
Export Winter
18:04
17:54
17:00
SS.
Ontario - Michigan
2012/03/30
2012/03/30
2012/04/05
B3N nt + L4D PAR b/p + PS5
1600
Import Winter
18:04
17:54
17:00
SS.
Ontario - Quebec
Beauharnois 230 kV
2012/03/27
2012/04/01
2012/04/09
HQ Chateauguay T14, GC1 &
0
Export Winter or
13:33
17:00
04:00
GC2 o/s.
Summer
Docket No. ER11-1844
Exhibit No. NYI-23
Page 38 of 47
Urgent SSR Report for 2012/04/09 generated on 2012/04/09 20:08
System Advisory/Summary
System Advisory/Summary Hourly Details H1-12 Hourly Details H13-24 Transmission Interfaces SAA
Notes
Forecast Supply
Forecast Demand
Forecast Excess(Shortfall)
Energy Shortfall
Energy(MWhr)
Energy(MWhr)
Energy(MWhr)
Hours(Yes/No)
499740
354256
148076
No
System Advisory Notices-
Date/Time
Start
End
Comment
Title
Issued
Date/Time
Date/Time
A transmission outage will
result in the Flow North and
Flow South operating security
limit being decreased by
Major Change Advisory -
2012/04/09
2012/04/09
2012/04/09
>25%. (see transmission
transmission
20:04
20:02
20:02
interface for details) E510V
will be O/S from April 10/12
06:00 to 11:00 for emergency
repairs.
The IESO is no longer
2012/04/09
2012/04/09
2012/04/09
Major Change Advisory
curtailing NYISO exports pre-
09:44
07:00
10:00
emptively.
Hourly Details H1-12
System Advisory/Summary Hourly Details H1-12 Hourly Details H13-24 Transmission Interfaces SAA
Notes
Forecast Supply
H1
H2
H3
H4
H5
H6
H7
H8
H9
H10
H11
H12
Energy(MWhr)
20769
20111
19049
19741
19669
19953
20647
20588
21014
21145
21225
21306
Capacity(MW)
32537
32537
32537
32537
32537
32537
32537
32537
32537
32537
32537
32537
Intermittent
428
428
428
428
428
428
428
428
428
428
428
428
(MWhr/hr)
Self-Sched
505
505
506
488
490
694
725
735
735
735
735
735
(MWhr/hr)
Energy Limit'd
4246
3586
3526
3646
3686
3766
4429
4360
4786
4917
4997
5057
(MWhr)
Energy Limit'd Cap
6367
6365
6783
6783
6897
6897
6897
6897
6897
6897
6897
6876
(MW)
Imports - Est'd
0
0
0
0
0
0
0
0
0
0
0
0
(MW)
Intermittent Capacity
540
540
540
540
540
540
540
540
540
540
540
540
(MW)
Docket No. ER11-1844
Exhibit No. NYI-23
Page 39 of 47
Self-Sched Capacity
1084
1084
1084
1084
1084
1084
1084
1084
1084
1084
1084
1084
(MW)
Outages East(MW)
9021
9021
9605
9033
9031
8827
8796
8786
8786
8786
8786
8786
Outages West(MW)
626
626
626
626
626
626
626
626
626
626
626
626
Total Outages
9647
9647
10231
9659
9657
9453
9422
9412
9412
9412
9412
9412
Forecast Demand
Primary Demand
11476
11270
11372
11441
11992
12938
13918
14960
15412
15768
15935
15688
East(MW)
Primary Demand
419
470
470
467
469
463
421
431
452
451
454
453
West(MW)
Primary Demand
11895
11740
11842
11908
12461
13401
14339
15391
15864
16219
16389
16141
Total(MW)
Dispatchable Load
108
108
108
108
108
108
108
108
108
108
108
108
(MW)
Total
GRH
Operating
1418
1418
1418
1418
1418
1418
1418
1418
1418
1418
1418
1418
(MW)
Reserve
(MW)
Min. 10-Minute OR
945
945
945
945
945
945
945
945
945
945
945
945
Min. 10-Minute Spin
236
236
236
236
236
236
236
236
236
236
236
236
OR
Load Forecast
0
0
0
0
0
0
0
0
0
0
0
0
Uncertainty
Add. Cont.
0
0
0
0
0
0
0
0
0
0
0
0
Allowance
Intrahour Margin
0
0
0
0
0
0
0
0
0
0
0
0
(MW)
Excess(Shortfall)
Energy(MWhr)
8982
8479
7315
7941
7316
6660
6416
5305
5258
5034
4944
5273
Capacity(MW)
9685
9840
9154
9660
9109
8373
7466
6424
5951
5596
5426
5674
Ancillary Services
AGC Range
100
100
100
100
100
100
100
100
100
100
100
100
Required (MW)
AGC Rate Required
50
50
50
50
50
50
50
50
50
50
50
50
(MW/Min)
AGC Range
200
200
200
200
200
200
200
200
200
200
200
200
Available (MW)
Reliability Must Run
0
0
0
0
0
0
0
0
0
0
0
0
Required (MW)
Black Start Adequate
Y Y Y Y Y Y Y Y Y Y Y Y
(Y/N)
Minimum Operating Reserve Requirements
East(MW)
0
0
0
0
0
0
0
0
0
0
0
0
West(MW)
0
0
0
0
0
0
0
0
0
0
0
0
Docket No. ER11-1844
Exhibit No. NYI-23
Page 40 of 47
Hourly Details H13-24
System Advisory/Summary Hourly Details H1-12 Hourly Details H13-24 Transmission Interfaces SAA
Notes
Forecast Supply
H13
H14
H15
H16
H17
H18
H19
H20
H21
H22
H23
H24
Energy(MWhr)
21415
21254
21454
21385
21385
21380
21300
21472
21423
20720
20891
20444
Capacity(MW)
32537
32537
32537
32537
32537
32537
32537
32537
32537
32537
32537
32537
Intermittent
428
428
428
428
428
428
428
428
428
428
428
428
(MWhr/hr)
Self-Sched
735
735
735
723
724
735
735
735
745
743
719
712
(MWhr/hr)
Energy Limit'd
5097
4957
5157
5100
5168
5088
5008
5180
5140
4374
4569
4129
(MWhr)
Energy Limit'd Cap
6807
6828
6828
6828
6897
6897
6897
6897
6897
6702
6702
6702
(MW)
Imports - Est'd
0
0
0
0
0
0
0
0
0
0
0
0
(MW)
Intermittent Capacity
540
540
540
540
540
540
540
540
540
540
540
540
(MW)
Self-Sched Capacity
1084
1084
1084
1084
1084
1084
1084
1084
1084
1084
1084
1084
(MW)
Outages East(MW)
8786
8786
8786
8798
8797
8722
8722
8722
8731
8863
8887
8894
Outages West(MW)
626
626
626
626
626
626
626
626
626
626
626
626
Total Outages
9412
9412
9412
9424
9423
9348
9348
9348
9357
9489
9513
9520
Forecast Demand
Primary Demand
15606
15393
15266
15420
15538
15462
15539
16074
15702
14738
13553
12773
East(MW)
Primary Demand
448
442
441
427
415
421
469
504
522
519
507
487
West(MW)
Primary Demand
16054
15835
15707
15847
15953
15883
16008
16578
16224
15257
14060
13260
Total(MW)
Dispatchable Load
108
108
108
108
108
108
108
108
108
108
108
108
(MW)
Total
GRH
Operating
1418
1418
1418
1418
1418
1418
1418
1418
1418
1418
1418
1418
(MW)
Reserve
(MW)
Min. 10-Minute OR
945
945
945
945
945
945
945
945
945
945
945
945
Min. 10-Minute Spin
236
236
236
236
236
236
236
236
236
236
236
236
OR
Load Forecast
0
0
0
0
0
0
0
0
0
0
0
0
Uncertainty
0
0
0
0
0
0
0
0
0
0
0
0
Add. Cont.
Docket No. ER11-1844
Exhibit No. NYI-23
Page 41 of 47
Allowance
Intrahour Margin
0
0
0
0
0
0
0
0
0
0
0
0
(MW)
Excess(Shortfall)
Energy(MWhr)
5469
5527
5855
5646
5540
5605
5400
5002
5307
5571
6939
7292
Capacity(MW)
5761
5980
6108
5956
5851
5996
5871
5301
5646
6481
7654
8447
Ancillary Services
AGC Range
100
100
100
100
100
100
100
100
100
100
100
100
Required (MW)
AGC Rate Required
50
50
50
50
50
50
50
50
50
50
50
50
(MW/Min)
AGC Range
200
200
200
200
200
200
200
200
200
200
200
200
Available (MW)
Reliability Must Run
0
0
0
0
0
0
0
0
0
0
0
0
Required (MW)
Black Start Adequate
Y Y Y Y Y Y Y Y Y Y Y Y
(Y/N)
Minimum Operating Reserve Requirements
East(MW)
0
0
0
0
0
0
0
0
0
0
0
0
West(MW)
0
0
0
0
0
0
0
0
0
0
0
0
Docket No. ER11-1844
Exhibit No. NYI-23
Page 42 of 47
SAA Notes
System Advisory/Summary Hourly Details H1-12 Hourly Details H13-24 Transmission Interfaces SAA
Notes
Security and Adequacy
Date/Time
Start
End
Comment
Assessment Notes-Title
Issued
Date/Time
Date/Time
Due to anticipated surplus
baseload generation, Ontario
market participants have
withdrawn about 600 MW of
capacity from the IESO-
2012/04/06
2012/04/08
2012/04/09
administered market for the
System note
12:39
00:00
07:00
period April 5, 23:00 to April
9, 07:00. The capacity
reduction will be reflected in
the Forecast Surplus Baseload
Generation reports for this
period.
Surplus Baseload Generation
is expected to exceed
forecasted exports of 1800
MW for HE01-HE07. IESO
2012/04/08
2012/04/09
2012/04/09
Minimum Generation Alert
may take actions to minimize
13:47
00:00
07:00
the effect of SBG. These
actions may include the
curtailment of imports and
reduction of generation units.
Docket No. ER11-1844
Exhibit No. NYI-23
Page 43 of 47
Transmission Interfaces
System Advisory/Summary Hourly Details H1-12 Hourly Details H13-24 Transmission Interfaces SAA
Notes
Internal Transmission Interface Limitations
Operating
Date/Time
Start
End
Facility
Comments
Limit
Issued
Date/Time
Date/Time
FIO - Flow Into
2012/03/07
2012/02/14
2012/04/13
Hawthorne T3 o/s, HT1P1 +
2400
Ottawa
10:53
15:00
17:00
HT4 Bus open as C/A.
Madawaska
Generation -
2012/03/07
2012/03/07
2012/12/31
All i/s. Assumed 25 MW G/R
400
Madawaska 115 kV
14:33
10:16
23:59
armed.
generation
Flow North - flow
north on circuits
2012/03/07
2012/03/07
2012/12/31
1900
All i/s.
X503E, X504E and
11:12
11:10
23:00
D5H
Flow South - flow
south on circuits
2012/03/07
2012/03/07
2012/12/31
1550
All i/s.
X503E, X504E and
11:13
11:12
23:00
D5H
WMFE - Wawa-
2012/03/20
2012/03/07
2012/12/31
590
All i/s.
Mackay Flow East
11:41
11:13
23:00
TEK - Transfer East
2012/03/07
2012/03/07
2012/12/31
350
All i/s.
of Kenora
10:42
14:00
23:59
TEM - Transfer East
2012/03/07
2012/03/07
2012/12/31
475
All i/s.
of Mackenzie
10:43
14:00
23:59
TWM - Transfer
2012/03/07
2012/03/07
2012/12/31
350
All i/s.
West of Mackenzie
10:43
14:00
23:59
Lakehead(Ecct)E -
2012/03/07
2012/03/07
2012/12/31
Lakehead East
9999
All i/s.
10:43
14:00
23:59
Circuit Flow East
EWTE - East-West
2012/03/07
2012/03/07
2012/12/31
325
All i/s.
Transfer East
10:43
14:00
23:59
Miss(Ecct)E -
2012/03/07
2012/03/07
2012/12/31
Mississagi East
550
All i/s.
10:43
14:00
23:59
Circuits Flow East
SFW Global -
2012/03/07
2012/03/07
2012/12/31
Sudbury Flow West
9999
All i/s.
10:43
14:00
23:59
Global
FID - Flow Into
2012/03/07
2012/03/07
2012/12/31
390
All i/s.
Dobbin
10:43
14:00
23:59
FIO - Flow Into
2012/03/07
2012/03/07
2012/12/31
2900
All i/s.
Ottawa
10:43
14:00
23:59
Miss(Ecct)W -
2012/03/07
2012/03/07
2012/12/31
Docket No. ER11-1844
Exhibit No. NYI-23
Page 44 of 47
Mississagi East
10:43
14:00
23:59
9999
All i/s.
Circuits Flow West
EWTW - East-West
2012/03/07
2012/03/07
2012/12/31
350
All i/s.
Transfer West
10:43
14:00
23:59
Chats Falls Area
Generation - Chats
2012/03/07
2012/03/07
2012/12/31
650
All i/s.
Falls GS 230 kV
14:29
14:26
23:59
Area Generation
P33C Inflow - P33C
2012/03/07
2012/03/07
2012/12/31
335
All i/s.
Chats Falls Inflow
15:16
14:28
23:59
2012/03/07
2012/03/07
2012/12/31
All i/s. Assumed maximum G/R
Beauharnois Delivery
790
15:16
14:32
23:59
armed.
D5A Import - D5A
2012/03/07
2012/03/07
2012/12/31
Import From
240
All i/s.
14:55
14:34
23:59
Maclaren
D5A Export - D5A
2012/03/07
2012/03/07
2012/12/31
Export From
190
All i/s.
14:55
14:35
23:59
Maclaren
FABCW - Flow
Away From Bruce
2012/03/08
2012/03/08
2012/12/31
Complex plus wind
5800
All i/s.
10:51
10:51
23:59
generation in the
Bruce Area
Positive BLIP -
2012/03/08
2012/03/08
2012/12/31
Positive Buchanan
3000
All i/s.
10:52
10:51
23:59
Longwood Input
Negative BLIP -
2012/03/08
2012/03/08
2012/12/31
Negative Buchanan
1500
All i/s.
10:53
10:52
23:59
Longwood Input
FETT - Flow East To
2012/03/08
2012/03/08
2012/12/31
5000
All i/s.
Toronto
10:54
10:54
23:59
CLAN - Claireville
2012/04/04
2012/03/08
2012/12/31
2000
All i/s.
North
11:07
10:54
23:59
CLAS - Claireville
2012/03/08
2012/03/08
2012/12/31
1000
All i/s.
South
10:55
10:55
23:59
TEK - Transfer East
2012/03/15
2012/03/19
2012/05/10
175
K24F o/s.
of Kenora
12:11
11:30
16:30
TEM - Transfer East
2012/03/07
2012/03/19
2012/05/10
300
K24F o/s.
of Mackenzie
10:54
11:30
16:30
EWTE - East-West
2012/03/07
2012/03/19
2012/05/10
250
K24F o/s.
Transfer East
10:54
11:30
16:30
Flow North - flow
north on circuits
2012/04/04
2012/03/30
2012/04/11
1450
Essa JL504 on outage.
X503E, X504E and
14:52
14:28
06:00
D5H
Flow South - flow
south on circuits
2012/04/04
2012/04/04
2012/04/11
Serie Compensation on X504E
Docket No. ER11-1844
Exhibit No. NYI-23
Page 45 of 47
X503E, X504E and
10:56
10:00
06:00
o/s.
1400
D5H
Intertie Transmission Interface Limitations
Operating
Date/Time
Start
End
Facility
Comments
Limit
Issued
Date/Time
Date/Time
Ontario - Quebec
Kipawa 115 kV
2012/03/07
2012/03/07
2012/04/30
100
All i/s.
Export Winter or
11:18
11:17
23:00
Summer
OMTW - Ontario-
2012/03/07
2012/03/07
2012/12/31
Manitoba Transfer
300
All i/s.
10:46
14:00
23:59
West
OMTE - Ontario-
2012/03/07
2012/03/07
2012/12/31
Manitoba Transfer
300
All i/s.
10:46
14:00
23:59
East
MPFS - Ontario-
2012/03/07
2012/03/07
2012/12/31
Minnesota Transfer
150
All i/s.
10:47
14:00
23:59
South
MPFN - Ontario-
2012/03/07
2012/03/07
2012/12/31
Minnesota Transfer
100
All i/s.
10:46
14:00
23:59
North
Ontario - Quebec
Beauharnois 230 kV
2012/03/07
2012/03/07
2012/12/31
460
All i/s.
Export Winter or
15:19
14:58
23:59
Summer
Ontario - Quebec
Beauharnois 230 kV
2012/03/07
2012/03/07
2012/12/31
790
All i/s.
Import Winter or
15:19
14:59
23:59
Summer
Ontario - Quebec
Maclaren 230 kV
2012/03/07
2012/03/07
2012/12/31
190
All i/s.
Export Winter or
15:21
15:20
23:59
Summer
Ontario - Quebec
Maclaren 230 kV
2012/03/07
2012/03/07
2012/12/31
240
All i/s.
Import Winter or
15:22
15:21
23:59
Summer
Ontario - Quebec
Masson 115 kV
2012/03/07
2012/03/07
2012/12/31
50
All i/s.
Export Winter or
15:23
15:22
23:59
Summer
Ontario - Quebec
Masson 115 kV
2012/03/07
2012/03/07
2012/12/31
166
All i/s.
Import Winter or
15:25
15:24
23:59
Summer
Ontario - Quebec
Docket No. ER11-1844
Exhibit No. NYI-23
Page 46 of 47
Paugan 230 kV
2012/03/07
2012/03/07
2012/12/31
Export Winter or
0
All i/s.
15:28
15:26
23:09
Summer
Ontario - Quebec
Paugan 230 kV
2012/03/07
2012/03/07
2012/12/31
335
All i/s.
Import Winter or
15:30
15:28
23:59
Summer
Ontario - Quebec
2012/03/07
2012/03/07
2012/12/31
Quyon 230 kV
140
All i/s.
15:34
15:30
23:59
Export Winter
Ontario - Quebec
2012/03/07
2012/03/07
2012/12/31
Quyon 230 kV
0
All i/s.
15:33
15:32
23:59
Import Winter
Ontario - Quebec
2012/03/07
2012/03/07
2012/12/31
Quyon 203 kV
120
All i/s.
15:33
15:33
23:59
Export Summer
Ontario - Quebec
2012/03/07
2012/03/07
2012/12/31
Quyon 203 kV
0
All i/s.
15:36
15:35
23:59
Import Summer
Ontario - Quebec
Bryson 115 kV
2012/03/07
2012/03/07
2012/12/31
0
All i/s.
Export Winter or
15:38
15:37
23:59
Summer
Ontario - Quebec
Bryson 115 kV
2012/03/07
2012/03/07
2012/12/31
65
All i/s.
Import Winter or
15:39
15:38
23:59
Summer
Ontario - Quebec
Outaouais 230 kV
2012/03/07
2012/03/07
2012/12/31
1230
All i/s.
Export Winter or
15:41
15:40
23:59
Summer
Ontario - Quebec
Outaouais 230 kV
2012/03/07
2012/03/07
2012/12/31
1230
All i/s.
Import Winter or
15:41
15:41
23:59
Summer
OMTW - Ontario-
2012/03/07
2012/03/19
2012/05/10
Manitoba Transfer
50
K24F o/s.
10:57
11:30
17:30
West
MPFS - Ontario-
2012/03/07
2012/03/19
2012/05/10
Minnesota Transfer
30
K24F o/s.
10:57
11:30
17:30
South
MPFN - Ontario-
2012/03/07
2012/03/19
2012/05/10
Minnesota Transfer
50
K24F o/s.
10:57
11:30
17:30
North
OMTE - Ontario-
2012/03/07
2012/03/19
2012/05/10
Manitoba Transfer
250
K24F o/s.
10:57
11:30
17:30
East
Docket No. ER11-1844
Exhibit No. NYI-23
Page 47 of 47
Ontario - Quebec
Rapide 115 kV
2012/04/04
2012/03/29
2012/04/11
0
D4Z o/s.
Import Winter or
07:44
10:15
15:00
Summer
Ontario - Quebec
Beauharnois 230 kV
2012/03/27
2012/04/01
2012/04/09
HQ Chateauguay T14, GC1 &
0
Export Winter or
13:33
17:00
04:00
GC2 o/s.
Summer
Ontario - Michigan
2012/04/04
2012/04/05
2012/05/01
1970
Base limits. L4D b/p.
Export Winter
15:25
09:00
01:00
Ontario Niagara -
2012/04/04
2012/04/05
2012/05/01
BP76 o/s, Michigan PARs
New York Export
1550
15:25
09:00
00:00
regulating
Winter
Ontario Niagara -
2012/04/04
2012/04/05
2012/05/01
BP76 o/s, Michigan PARs
New York Import
950
15:25
09:00
00:00
regulating
Winter
Ontario - Michigan
2012/04/04
2012/04/05
2012/05/01
1540
Base limits. L4D b/p.
Import Winter
15:25
09:00
01:00
Ontario - Michigan
2012/04/06
2012/04/06
2012/04/09
BP76 o/s, Michigan PARs
1720
Export Winter
05:17
05:16
07:00
regulating
Ontario - Michigan
2012/04/06
2012/04/06
2012/04/09
BP76 o/s, Michigan PARs
1740
Import Winter
05:17
05:17
07:00
regulating
Ontario - Michigan
2012/04/08
2012/04/08
2012/04/09
Limited due to current system
1400
Export Winter
13:00
14:00
23:59
conditions.
DOCKET NO. ER11-1844
EXHIBIT NO. NYI-24
Docket No. ER11-1844
Exhibit No. NYI-24
Page 1 of 55
Northeast Power Coordinating Council
Reliability Assessment
For
Winter 2006 - 2007
Conducted by the
NPCC CO-12 Working Group
November 2006
Docket No. ER11-1844
Exhibit No. NYI-24
Page 2 of 55
TABLE OF CONTENTS
1.
EXECUTIVE SUMMARY
4
2.
INTRODUCTION
6
3.
DEMAND FORECASTS FOR WINTER 2006-2007
7
SUMMARY OF AREA FORECASTS
8
4.
RESOURCE ADEQUACY
14
NPCC SUMMARY FOR WINTER 2006-2007
14
PROJECTED LOAD AND CAPACITY ANALYSIS BY AREA
15
DELAYS TO IN-SERVICE OF NEW GENERATION RESOURCES
18
FUEL INFRASTRUCTURE BY AREA
19
5.
TRANSMISSION ADEQUACY
22
INTER-REGIONAL TRANSMISSION ADEQUACY
22
INTER AREA TRANSMISSION ADEQUACY
22
TRANSMISSION ADEQUACY ASSESSMENT BY AREA
23
6.
OPERATIONAL READINESS FOR 2006-2007
26
LOAD RESPONSE PROGRAMS
26
7.
POST-SEASONAL ASSESSMENT AND HISTORICAL REVIEW
29
WINTER 2005-2006 POST-SEASONAL ASSESSMENT
29
WINTER HISTORICAL REVIEW (PRE-2005-2006)
31
8.
WINTER 2006-2007 RELIABILITY ASSESSMENTS OF NEIGHBORING
REGIONS
32
RELIABILITYFIRST CORP. 2006-2007 WINTER ASSESSMENT
32
DEMAND
32
RESOURCES
33
FUEL
34
TRANSMISSION
35
OPERATIONAL ISSUES
35
APPENDIX I -2006-2007 WINTER EXPECTED LOAD AND CAPACITY FORECASTS
36
TABLE 1 - NPCC SUMMARY
36
TABLE 2 - MARITIMES
37
TABLE 3 - NEW ENGLAND
38
TABLE 4 - NEW YORK
39
TABLE 5 - ONTARIO
40
TABLE 6 - QUÉBEC
41
APPENDIX II - SUMMARY OF NORMAL AND EXPECTED FEASIBLE TRANSFER CAPABILITY
UNDER PEAK CONDITIONS
42
APPENDIX III - NPCC OPERATIONAL CRITERIA AND PROCEDURES
51
APPENDIX IV - WEB SITES
54
APPENDIX V - REFERENCES
55
NPCC Reliability Assessment Winter 2006-2007 Final Report
Page 2 of 55
Docket No. ER11-1844
Exhibit No. NYI-24
Page 3 of 55
Information in this report has been provided by the Operations Planning Working Group
of the NPCC Task Force on Coordination of Operation (CO-12) with additional
information from Reliability Councils adjacent to NPCC.
The CO-12 Working Group members are:
Jason Drenth
Independent Electricity System Operator (IESO)
Wendell Ingalls
Nova Scotia Power
Dean Landers
New Brunswick System Operator (NBSO)
Ken Layman
New York ISO (NYISO)
Paul Metsa (Chair)
TransÉnergie
Paul Roman
Northeast Power Coordinating Council (NPCC)
Helve Saarela
ISO New England (ISO-NE)
Information from neighboring Reliability Councils provided by:
Bill Harm
PJM Interconnection, LLC (PJM)
Jeff Mitchell
Reliability First (RFC)
Kim Sauerwine
PJM Interconnection, LLC (PJM)
Additional support by:
Phil Fedora (Chair CP-8) Northeast Power Coordinating Council
Ken Wei
New York ISO (NYISO)
NPCC Reliability Assessment Winter 2006-2007 Final Report
Page 3 of 55
Docket No. ER11-1844
Exhibit No. NYI-24
Page 4 of 55
1.
Executive Summary
This report focuses on the assessment of reliability within NPCC for the Winter
Operating Period of 2006-2007. Portions of this report are based on work previously
done for the NPCC Reliability Assessment for the 2006 Summer Operating Period1. For
example, many of the Operational Readiness items discussed in the NPCC Reliability
Assessment for Summer 2006 remain applicable for the Winter Operating Period except
where noted in this report.
The NPCC CP-8 Working Group performed a probabilistic analysis to estimate the
projected use of Area Operating Procedures designed to mitigate resource shortages for
the 2006-2007 Winter Operating Period under various scenarios. Detailed study results
for each of these scenarios can be obtained from the NPCC CP-8 Working Group -
Multi-Area Probabilistic Reliability Assessment for Winter 2006/07.
Those aspects that the Operations Planning Working Group (CO-12) have examined to
determine the reliability and adequacy for NPCC for this Winter Operating Period are
discussed in detail in the specific report sections. The following Summary of Findings
addresses the significant points of the report discussion.
These findings are based on forecasted projections of load requirements, resource
configurations and transmission configurations. This report identifies NPCC and the
associated Areas’ ability to deal with the differing resources and transmission
configurations plus the actions needed to reasonably ensure that NPCC and the associated
Areas are prepared to deal with possible uncertainties identified in this report.
Summary of Findings
• The forecasted capacity outlook for NPCC during the peak week (week beginning
January 14, 2007)2 indicates a net capacity margin3 of approximately 12,970 MW.
This equates to a net capacity margin of 11.2 % in terms of the 115,591 MW
forecasted peak load. The forecasted minimum net capacity margin for NPCC
occurs during the week beginning January 21. The margin is then 12,920 MW.
The week with the largest net capacity margin is forecasted to occur the week
beginning December 24, 2006. (23,829 MW). The net margins for the 2006-2007
Winter Operating Period are generally lower than what had been forecasted for
the previous winter. However, most are not very different when a year to year
comparison is done. The overall difference is reflected in the purchases outside
NPCC. The margin reflected in this assessment is lower than last year’s as a
result of fewer purchases from outside NPCC in this year’s assessment.
1 A copy of this report can be found on the NPCC website
2 Load and Capacity Forecast Summaries for NPCC, Maritimes, New England, New York, Ontario, and
Québec are included in Appendix I.
3 The Net Capacity Margin is defined as installed capacity + firm purchases - firm sales + interruptible
loads -maintenance and forced outages - peak load - operating reserves.
NPCC Reliability Assessment Winter 2006-2007 Final Report
Page 4 of 55
Docket No. ER11-1844
Exhibit No. NYI-24
Page 5 of 55
• During each Area’s forecasted peak week, the forecasted net capacity margin
ranges from a margin of approximately 4.1 % margin in Québec to a 25.0 %
margin in New York.
• There is approximately 1,350 MW of forecasted new installed capacity for this
operating period compared to last year. Québec has 1,080 MW of new capacity.
Most of this capacity is already in service, so that any delays to the rest of the
capacity additions should not materially impact the overall spare capacity
projections for NPCC.
• The Resource and Transmission Assessments used in this report are mere
snapshots in time and base case studies. Changes to the base case assumptions
can alter this report’s findings.
• The summer assessment indicated that each NPCC Area was reasonably prepared
or was reviewing the necessary strategies and procedures to deal with operational
problems and emergencies as they develop. The CO-12 Working Group believes
that these preparations remain valid for dealing with the various operating
scenarios expected during the Winter Operating Period. Maritimes and Québec,
which are winter peaking areas, have additional preparation as a function of these
conditions.
NPCC Reliability Assessment Winter 2006-2007 Final Report
Page 5 of 55
Docket No. ER11-1844
Exhibit No. NYI-24
Page 6 of 55
2.
Introduction
The NPCC Task Force on Coordination of Operation (TFCO) established the CO-12
Working Group to conduct overall assessments of the reliability of the generation and
transmission system in the NPCC Region for the Summer Operating Period (defined as
the months of May through September) and the Winter Operating Period (defined as the
months of December through March).
The CO-12 incorporated the following elements into the assessment of this Winter
Operating Period.4
• Utilization of data standards for the reporting of Load and Capacity values to
provide a uniform assessment between NPCC Areas and allow for consistent
comparison of the results associated with the other parallel pre-seasonal
assessments.
• Examination of historical operational experiences and assessment of their
applicability.
• Reporting of the potential sensitivities on an Area basis, which may impact
resource adequacy, including temperature deviations, merchant plant delays, load
forecast uncertainties, fuel availability, load response programs and transmission
adequacy.
4 For the purposes of this report, the Winter Operating Period includes the week beginning November 26,
2006 to the week beginning March 25, 2007 inclusive.
NPCC Reliability Assessment Winter 2006-2007 Final Report
Page 6 of 55
Docket No. ER11-1844
Exhibit No. NYI-24
Page 7 of 55
3.
Demand Forecasts for Winter 2006-2007
The forecasted non-coincident peak demand for NPCC during the Winter Operating
Period is 115,647 MW. This non-coincident peak demand translates to a coincident peak
demand of 115,591 MW and is forecasted for the week beginning January 14, 2007.
Load and Capacity forecast summaries for NPCC, Maritimes, New England, New York,
Ontario, and Québec are included in Appendix I.
Ambient weather conditions are an important variable impacting the demand forecasts.
However, unlike the summer demand forecasts, the non-coincident peak demand varies
only slightly from the coincident peak forecast in the winter. This is mainly due to the
fact that the drivers that impact the peak demand are concentrated into a specific period
in time. In winter, the peak demands are determined mainly by low temperatures along
with the reduced hours of daylight that occurs over the first few weeks of January.
While the peak demands appear to be confined to a few weeks in January, each Area is
aware that reduced margins could occur during any week of the operating period as a
result of weather variables and / or higher than normal outage rates.
The impact of extreme ambient weather conditions on load forecasts can be demonstrated
by various means. The IESO and Maritimes represent the resulting load forecast
uncertainty in their respective Areas as a mathematical function of the base load. The
NYISO and TransÉnergie (transmission operations division of Hydro-Québec) use a
weather index that relates air temperature and wind speed to the load response and
increases the load by a MW factor for each degree below the base value. ISO-NE relates
air temperature to the load response and increases the load by a MW factor for each
degree below the base value.
Each area’s forecast demand and the associated load forecast uncertainty relating to
weather variables is described in greater detail in the Summary of Area Forecasts below.
NPCC Reliability Assessment Winter 2006-2007 Final Report
Page 7 of 55
Docket No. ER11-1844
Exhibit No. NYI-24
Page 8 of 55
Summary of Area Forecasts
Maritimes
Based on the Maritimes Area 2006-2007 demand forecast, a peak of 5,564 MW is
predicted to occur for the Winter Operating Period. The actual peak for Winter 2005-
2006 was 4,987 MW on December 21, 2005, which was approximately 593 MW
(10.63%) lower than last year’s forecast of 5,580 MW. The reduction in demand was due
to a combination of higher than normal temperatures, resulting in a lower electric heating
load, and a reduction of approximately 200 MW of industrial load due to a labor dispute.
The load forecast for the Maritimes Area represents the expected load for the 2006-2007
Winter Operating Period. It should be noted that the Maritimes Area load is simply the
mathematical sum of the forecasted weekly peak loads of the sub-areas (New Brunswick,
Nova Scotia, Prince Edward Island, and the area served by the Northern Maine
Independent System Operator). As such, it does not take the effect of load coincidence
within the week into account. If the total Maritimes Area load included a coincidence
factor, the forecast load would be approximately 1-3% lower.
New England
ISO New England’s reference forecast (50% chance of being exceeded) for this Winter
Operating Period projects a peak demand of 22,550 MW. This projected peak is 230
MW lower than last year’s weather normalized peak demand of 22,780 MW. New
England’s all-time winter peak demand of 22,818 MW occurred on January 15, 2004. If
extremely cold weather occurs for a prolonged period during the upcoming Winter
Operating Period, the winter peak demand could reach 23,475 MW (10% chance of being
exceeded).
The demand forecast for New England is based on weekly weather distributions. The
weekly weather distributions were built using 30 years of temperature data at the time of
daily electrical peaks (for non-holiday weekdays). The reference load forecast is based
on a 50/50 probability of occurrence. While this temperature sampling is used to project
temperature sensitive loads, a complete process of sampling and econometric models is
used to project the overall aggregate electrical demand. A reasonable approximation for
“normal weather” associated with this projection is 6.8 °F (-14 °C). At these forecasted
load levels, a one degree Fahrenheit decrease in the temperature will result in
approximately 150 MW of additional load.
The following graph illustrates the range of potential peak demands that ISO New
England may experience this winter and compares them to historical peaks.
NPCC Reliability Assessment Winter 2006-2007 Final Report
Page 8 of 55
Docket No. ER11-1844
Exhibit No. NYI-24
Page 9 of 55
New England Weekly Load Profiles
Peak Load Exposures and Historical Peaks (1980 - 2006)
24,000
23,000
22,000
21,000
20,000
19,000
18,000
Week Beginning
Reference
90/10
Historical Peak
NPCC Reliability Assessment Winter 2006-2007 Final Report
Page 9 of 55
Docket No. ER11-1844
Exhibit No. NYI-24
Page 10 of 55
New York
The New York Area peak load forecast for this Winter Operating Period is 26,311 MW,
which is 961 MW higher than the forecast of 25,350 MW for the 2005-2006 Winter
Operating Period. This forecast load is 3.0 % higher than the all-time winter peak load of
25,541 MW that occurred on December 20, 2004. The daily peak demand observed by
New York during the Winter Operating Period occurs in the late afternoon or early
evening hours.
The NYISO uses a weather index that relates dry bulb air temperature and wind speed to
the load response in the determination of the forecast. At the forecast load levels, a one-
degree decrease in this index will result in approximately 100 MW of additional load. A
reasonable temperature at which the New York load could reach the forecast peak is
12.9 °F (-11 °C).
The following illustration provides the range of potential peak demands that the New
York may experience this winter.
New York Weekly Load Profiles
28,000
27,000
26,000
25,000
24,000
23,000
22,000
21,000
Week Beginning
Extreme Load
Normal Load
Historical Max Load
NPCC Reliability Assessment Winter 2006-2007 Final Report
Page 10 of 55
Docket No. ER11-1844
Exhibit No. NYI-24
Page 11 of 55
Ontario
The forecasted weather normal, hourly peak demand for this Winter Operating Period is
24,677 MW. This hourly average peak is forecasted to occur during the week beginning
January 14, 2006. This weather normal projection is about 3.8 % higher than last year’s
winter peak of 23,766 MW, which was experienced during a cold snap in mid-December
2005.
Weather variations from normal can propel the demand significantly higher than the
weather normal values. For example, when the temperature is below -5 °C (23 °F), a
decrease in daily average temperature of one degree Celsius will result in about a 150
MW increase from the weather normal forecast. Likewise, a 10 km/h (6 mph) increase in
wind speed will result in approximately a 110 MW increase to the weather normal
forecast.
As seen last winter, warmer than normal temperatures can also have dramatic effects on
demands. During the winter period, when temperatures are above -5 °C (23 °F), an
increase in temperature of one degree Celsius results in a load reduction of approximately
100 MW.
The IESO reflects this weather sensitivity through Load Forecast Uncertainty (LFU) and
extreme weather demand forecasts.
LFU is used to capture, in MW, the impact of the variations in weather. In this way,
various demand levels can be derived and given an associated probability of occurring
based on the likelihood of observing the underlying weather. For this forecast, there is a
50% chance that the monthly peak demand will be exceeded due to the variability of
weather. LFU represents the impact on the peak demand of one standard deviation in the
weather elements. The values of LFU associated with this analysis range around 2 - 3 %
of the predicted normal weather demands. The highest values of LFU for Ontario appear
during the end of January and during March. LFU equates to a potential increase in
demand of about 600 MW over the projected weather normal demands for the peak week.
The winter operating period can also experience extreme weather driven demands where
the system is likely to be under stress. For any given week, the forecasted extreme
weather demand is determined by using the coldest day in the past thirty years as the
reference point. Depending upon the week in this assessment period, the values that
could be experienced under extreme weather conditions can be 3.5 to 5.5 % higher than
the normal weather prediction. The extreme forecast demand for the Winter Operating
period is approximately 1,050 MW over the normal weather prediction for the peak week
and equates to an increase of about 8.3 % over last years actual peak.
The following graph indicates the range of possible demands that the IESO may
experience over this Winter Operating Period.
NPCC Reliability Assessment Winter 2006-2007 Final Report
Page 11 of 55
Docket No. ER11-1844
Exhibit No. NYI-24
Page 12 of 55
Ontario Weekly Load Profiles
27,000
26,000
25,000
24,000
23,000
22,000
21,000
20,000
Week beginning
Normal Forecast
Normal + 1 LFU
Extreme Forecast
Québec
Hydro-Quebec’s reference peak load forecast for the 2006-2007 Winter Operating Period
with a 50 % probability of being exceeded is 36,391 MW. This is practically the same as
the 2005-2006 forecast of 36,418 MW. This value does not include the supply of
approximately 145 MW of load to Cornwall (154 MW with losses). This load is supplied
by generation at Beauharnois and Les Cèdres Generating Stations. The Cornwall load is
included in the Appendix I Load and Capacity table so that the load forecast in that table
for the week beginning January 14 is 36,545 MW.
Throughout the Winter Operating Period, as seen in Table 6 of Appendix I, weekly peak
load varies from 30,878 MW for the week beginning November 26 to 36,545 MW for the
week beginning January 14 and back to 29,649 MW for the week beginning March 25.
Since there is a large proportion of electrical heating load on the Québec system, an
episode of extreme weather could induce a large load increase. At normal winter
temperatures, a 1 degree Celsius drop in temperature or a 5 km/h wind speed increase
causes a load increase of 400 MW on the system. Furthermore, by analyzing extreme
historical weather conditions that have occurred in the past 40 years, TransÉnergie has
calculated that the load could reach 40,300 MW during the worst of these episodes. This
is equivalent to approximately 110 % of the normal peak value.
NPCC Reliability Assessment Winter 2006-2007 Final Report
Page 12 of 55
Docket No. ER11-1844
Exhibit No. NYI-24
Page 13 of 55
When forecasting the weekly load curves, three basic forecasts are generated: a 50 %, a
25 % and a 10 % chance of being exceeded for any given week. This provides a range of
potential peak demands that the system may experience during the peak period.
The following graph demonstrates the range of potential weekly peak demands on the
system for the 2006-2007 Winter Operating Period for a normal range of temperature
values.
Québec Weekly Load Profiles
39,000
37,000
35,000
33,000
31,000
29,000
27,000
25,000
Week beginning
Weekly 50%
Weekly 75%
Weekly 90%
NPCC Reliability Assessment Winter 2006-2007 Final Report
Page 13 of 55
Docket No. ER11-1844
Exhibit No. NYI-24
Page 14 of 55
4.
Resource Adequacy
NPCC Summary for Winter 2006-2007
Table 1 of Appendix I is the NPCC load and capacity summary for the Winter Operating
Period. Appendix I, Tables 2 to 6, contains the load and capacity summary for each Area
of NPCC. Each entry in Table 1 is simply the aggregate of the corresponding entry for
the five NPCC Areas. The following table (Table A) summarizes the load and capacity
situation for the peak week beginning on January 14, 2007 compared to the winter 2005-
2006 forecasted peak week (week beginning January 15, 2006).
TABLE A
All values in MW
Forecasted week of
Forecasted week of
Difference
Jan. 14, 2007
Jan. 15, 2006
Winter 2006-2007
Winter 2005-2006
Installed Capacity
154,059
152,713
1,346
Purchases into NPCC
80
1,300
-1,220
Sales out of NPCC
182
182
0
Total Capacity
153,957
153,831
126
Load
115,591
114,450
1,141
Interruptible load
2,793
2,249
544
Maintenance/Derating
6,885
6,017
868
Required. reserve
7,331
7,359
-28
Unplanned Outages
13,973
14,238
-265
Net margin
12,970
14,015
-1,045
The net margins for the 2006-2007 Winter Operating Period are generally lower than
what had been forecasted for the previous winter. The overall difference is reflected in
the purchases from outside NPCC. The margin reflected in this assessment is lower than
last year’s as a result of fewer purchases from outside NPCC in this year’s assessment.
The resource adequacy assessment was performed on the basis of projected available
capacity. Inadequate fuel supply, lower than normal water reservoirs, higher than
anticipated forced outages or delays in anticipated new facilities can impact these
capacity projections.
The following are each Area's assessments supporting this overall resource adequacy
assessment.
NPCC Reliability Assessment Winter 2006-2007 Final Report
Page 14 of 55
Docket No. ER11-1844
Exhibit No. NYI-24
Page 15 of 55
Projected Load and Capacity Analysis by Area
Maritimes
The Maritimes Area is expecting a net increase of 53 MW of installed generation
scheduled for addition to the Maritimes Area during the Winter Operating Period. There
will be 72 MW of new wind generation and the retirement of 19 MW of bio-mass
thermal. The total installed capacity for the assessment period ranges from a low of
6,852 MW to a high of 6,928 MW. The total capacity available during the forecasted
peak load week is 6,703 MW when firm sales are taken into account.
When allowances for known maintenance and deratings, required operating reserve and
unplanned outages are considered, the Maritimes Area is projecting adequate net margins
for the Winter Operating Period. These net margins range from 363 to 1,442 MW (7 %
to 31 %). The corresponding 2005-2006 winter Maritimes capacity margin range was
also 7 % to 31 %.
The Maritimes Area assesses its seasonal resource adequacy in accordance with NPCC
C-13 Operational Planning Coordination procedure. As such, the assessment considers
the regional operating reserve criteria; 100 % of the largest single contingency and 50 %
of the second largest contingency.
The Maritimes Area is forecasting normal hydro conditions for the 2006-2007 Winter
Operating Period. The Maritimes Area hydro resources are run of the river facilities with
limited reservoir storage facilities. These facilities are primarily utilized as peaking units
and providing operating reserve.
The Maritimes Area is not relying on outside assistance or external resources during the
Winter Operating Period.
New England
Under expected weather and normal resource outages, capacity within New England is
forecasted to be sufficient to meet load plus operating reserve requirements during this
Winter Operating Period. The lowest projected net margin of 1,740 MW is expected to
occur during the week beginning January 28, 2007 while the highest projected net
capacity margin of 9,403 MW is expected to occur during the week beginning March 25,
2007, if all assumed system conditions materialize under the reference load forecast
(50 % chance of being exceeded). Low and high operable capacity margins of -1,176
MW and 8,612 MW, respectively, are projected under the high load forecast (10 %
chance of being exceeded).
Net margin is based on known outages, an allowance for unplanned outages, anticipated
generation additions and retirements, projected firm purchases and sales, and the impact
of expected Demand Response Programs.
In addition to the allowance for unplanned outages, an allowance for higher unplanned
outages due to possible natural gas shortages of New England generators is included in
January and February.
NPCC Reliability Assessment Winter 2006-2007 Final Report
Page 15 of 55
Docket No. ER11-1844
Exhibit No. NYI-24
Page 16 of 55
During times of capacity deficiencies, ISO New England invokes ISO-NE Operating
Procedure No. 4 - Actions During a Capacity Deficiency (OP-4) which includes public
appeals for conservation, purchasing emergency energy from the neighboring Areas,
interrupting real time demand response providers, and implementing voltage reductions.
While ISO New England expects to have adequate operable capacity margins for this
winter under expected weather and normal resource outages, if operable capacity
shortages occur due to higher than expected resource unavailability or higher than
expected load conditions, ISO New England may have to implement ISO-NE OP-4 or
ISO-NE Operating Procedure No. 21 - Action During an Energy Emergency (OP-21).
OP-21 is a new emergency operating procedure designed to provide additional
commitment and dispatch flexibility to manage and conserve fuel-limited supply-side
resources.
New York
NYISO forecasts a minimum net margin of 5,375 MW during the week beginning on
March 18, 2007. These margins range up to 8,892 MW and are generally over 6,500
MW. The net margin for the NPCC peak week (week beginning January 14, 2007) is
forecasted to be 6,827 MW. The capacity values and resultant margins indicated in
Appendix I, Table 4, are representative of the actual total installed capacity in New York.
However, the NYISO conducts semi-annual and monthly Installed Capacity (ICAP)
auctions to secure agreements with enough generation to meet its yearly ICAP
requirement. The yearly ICAP requirement is based on the amount of generation needed
to reliably serve the summer peak load and reserve requirements after accounting for
generation outages. For the 2006-2007 Winter Operating Period, the ICAP requirement
is 39,288 MW and is based on the summer peak load forecast. The generation that has
been selected as ICAP in the New York market is contractually obligated to bid its
capacity into the New York markets, and is not necessarily equivalent to the amount of
generation physically located in the New York Area (NYISO). Generation physically
located in the Area that has not been selected as ICAP, is not bound by any ICAP
obligations.
Generation resources, which are external to the New York Area, that provide ICAP to the
New York market are included in the total ICAP supply. Resources within the New York
Area that provide firm capacity to an entity external to the Area are not included in the
ICAP total (i.e. this generation cannot participate in the ICAP market).
Ontario
All resources that were projected to be in service for the summer 2006 and winter 2005-
2006 assessments have been declared in service. This represents a net increase of
capacity from the winter of 2005-2006 of 412 MW.
NPCC Reliability Assessment Winter 2006-2007 Final Report
Page 16 of 55
Docket No. ER11-1844
Exhibit No. NYI-24
Page 17 of 55
Ontario is also expecting a net increase of 5 MW of new generation resources during the
actual Winter Operating period. This increase is due to improvements in efficiency to
one nuclear generating unit.
With the addition of the new generation, Ontario is expected to have a net capacity
margin of approximately 8.3 % over the peak week (2,063 MW). However if all
generating unit planned outages were to proceed as requested, the margin would be
reduced to about -1.7 % during the week beginning March 4, 2007.
This analysis is based on a review of known outages, a projection of unknown outages,
and a forecast of price responsive loads.
For this report period, known outages include those resources that are scheduled to be on
planned outages, transmission constrained resources as well as the difference between the
installed capacity and the dependable capacity associated with certain resources.
Unknown outages represent an estimate of the forced outages that may be experienced in
this study period.
A value of approximately 427 MW of price responsive load has been assumed to be
available for this forecast period based on past operational experience.
The net capacity margins, in Table 5 of Appendix I, depict an estimate of the spare
capacity margin that does not consider all the additional off-market control actions
available to the IESO. For example, the IESO can institute a 3 % or 5 % voltage
reduction. These control actions have the effect of reducing the demand by 1.7 % to
2.6 %, which, equates to approximately 400 MW to 600 MW on the peak week for
weather normal demands.
The risks associated with this analysis are that demands may be heavier than expected
due to extreme weather, units on outage may not return to service as scheduled or units
forced unavailable may be higher than projected. The projected margins and control
actions available to the IESO are continuously assessed. Should the IESO determine that
the Ontario Area is deficient, the appropriate course of action will be taken. Actions can
include the adjustment of outage programs and/or securing of assistance via market
mechanisms or as a final step, the acquisition of emergency energy from other Areas.
Québec
For the next winter peak period, Québec will have
41,451 MW of total installed
generation capacity, increasing to 41,617 MW in February 2007. This constitutes a 1,043
MW increase from last year. This includes 5,064 MW of firm capacity purchases from
Churchill-Falls Labrador Co. and 2,257 MW from Québec private producers (consisting
of small private producers, Trans Canada Energy, Alcan and a certain number of wind
farms). Hydro-Québec Production is commissioning the Eastmain 1 Generating Station
in James Bay (160 MW in October 2006 and 160 MW in February 2007). HQP is also
commissioning the Mercier G.S. in the southern part of the system (18 MW this winter
and 12 MW later in 2007).
NPCC Reliability Assessment Winter 2006-2007 Final Report
Page 17 of 55
Docket No. ER11-1844
Exhibit No. NYI-24
Page 18 of 55
Also, a small amount of generating capacity is being added to the system in the fall of
2006 from the refurbishments of two hydro units (Outardes 3 - 52 MW and Outardes 4 -
14 MW). These refurbishments will be in service in December, 2006.
At peak load, 1,880 MW of known maintenance, derating and hydraulic restrictions is
expected. This brings the operable capacity to 39,571 MW in January. In addition to
this, a total of 500 MW of firm capacity purchases is included. From this total, 300 MW
will come from New York and 200 MW from New-Brunswick (Milbank).
The winter peak is expected to materialize during the week of January 14, 2007. The
forecast is 36,391 MW. In Table 6 of Appendix I, 154 MW is added to this amount for
the Cornwall load, which is fed by radial generation from Québec. The total peak load in
Table 6 is therefore 36,545 MW. Firm sales to neighboring systems, excluding the firm
sale to Cornwall, amount to 330 MW. This is entirely sold to New England. When the
required operating reserve, the interruptible load and the allowance for unplanned outages
and load uncertainty are taken into account, the net margin at peak load is 1,486 MW.
This is a 918 MW increase over last year’s net margin at peak. During the 2006-2007
Winter Operating Period, net margins varying from 1,486 MW to 6,248 MW, can be
observed for Québec.
Delays to In-service of New Generation Resources
Maritimes
In the Maritimes Area 72 MW of wind power generation is scheduled for addition during
the Winter Operating Period. There is 19 MW of thermal bio-mass generation scheduled
to be retired. There is no significant impact on the capacity outlook of the Area if
commissioning of this generation is delayed.
New England
It is assumed that approximately 23 MW of new generation will become commercial
before the Winter Operating Period. If this capacity is not available due to delays, there
will be no significant adverse impacts on the forecasted capacity margins.
New York
Net resource additions, totaling 41 MW are expected to be available for service during
the winter period. The Maple Ridge phase 2 wind project with a capacity of 100 MW is
expected to be available during the Winter Operating Period, and the uprate of the
existing Ginna station is expected to be completed for an additional 95 MW. The overall
capacity in the New York Area will be reduced by 154 MW due to the retirement of
Huntley 65 and 66.
NPCC Reliability Assessment Winter 2006-2007 Final Report
Page 18 of 55
Docket No. ER11-1844
Exhibit No. NYI-24
Page 19 of 55
Ontario
Given the minimal increase to the resource scenario for this Winter Operating Period,
delays to the in service of new generation will not dramatically affect the resource
adequacy scenario.
Québec
Net resource additions, totalling 1,080 MW will be available for service during the winter
period. Trans Canada Energy has commissioned its 547 MW natural gas Generating
Station and 109 MW of wind generation is to be placed in service before the peak period.
Meanwhile, Hydro-Québec production has put in service two of the three 160 MW units
at Eastmain 1 Generating Station and three out of five 6 MW units at Mercier Generating
Station. Also, refurbishments at Outardes 3 and Outardes 4 will add 66 MW to the
capacity of the Québec Area. Finally, a new
20 MW private producer will be
commissioned for the winter period. No delays are expected for the additions and
refurbishments on the system.
Fuel Infrastructure by Area
The following is a self-assessment by each Area of the expected fuel supply
infrastructure.
Maritimes
The Maritimes Area does not consider potential fuel-supply interruptions in the regional
assessment. The fuel supply in the Maritimes area is very diverse and includes nuclear,
natural gas, coal, oil (both light and residual), Orimulsion, hydro, tidal, municipal waste,
and wood. Fuel supplies are expected to be adequate during the projected peak winter
demand. Extreme weather conditions should have no impact on the fuel supply to the
Area. Responsibility for fuel switching plans lies with the generation owner. All
applicable units have the required procedures. The only units with fuel-switching
capability are at Tuft’s Cove, NS (natural gas or oil) and Dalhousie, New Brunswick
(Orimulsion or oil). Each Facility maintains an adequate supply of its primary fuel.
New England
Generators in New England are primarily fueled by natural gas, followed by oil, nuclear,
coal, hydro and renewable resources. The region’s heavy reliance on natural gas to
generate electricity has led to winter reliability concerns, especially following the January
14-16, 2004 cold snap and the unforeseen results of Hurricanes Katrina and Rita during
the fall of 2005. Some of the issues that contributed to the problems encountered during
the cold snap are constrained regional pipeline capacity into New England, the “non-
firm” contracting practices of gas-fired generators, fuel arbitrage, and the disconnect in
bidding timelines between the electricity and natural gas markets.
NPCC Reliability Assessment Winter 2006-2007 Final Report
Page 19 of 55
Docket No. ER11-1844
Exhibit No. NYI-24
Page 20 of 55
New England’s gas-fired electricity generators continue to compete with the ever-
growing core natural gas market
(i.e. for space heating) for finite supply and
transportation infrastructure. Many of New England’s gas-fired generators are opting to
purchase fuel from the spot market or from non-affiliated fuel managers rather than enter
into firm supply/transportation contracts. ISO New England has been performing a pre-
winter review of natural gas pipeline transportation contracts held by regional gas-fired
generators to identify: 1) which units have the contracts in place to generate electricity on
cold winter days; and conversely, 2) the amount of gas-fired capacity that is projected to
be unavailable based on their fuel supply arrangements.
During the 2006-2007 Winter Operating Period, it is estimated that under the reference
load forecast, 4,200 MW of gas-only generation in New England may be unavailable due
to gas supply issues. About 1,550 MW of gas-only capacity has already been converted
to dual-fuel capability prior to last winter. It is projected that an additional 800 MW will
be converted by around January
2007.
These new dual-fuel conversions will
significantly contribute to reliably operating the system through winter peak-demand
conditions.
In addition, new market rules and revised operating procedures have been developed to
address some of the issues brought to light following the cold snap investigation.
Included among the measures to be taken during cold weather conditions are temporarily
shifting the electric market bidding and commitment process to be more synchronized
with the gas nomination cycles, and allowing generation offers to exceed the current
$1,000/MWh Effective Offer Cap. Furthermore, the new rules provide enhanced market
and operational information during times of extremely cold weather. ISO Operations
personnel are now routinely in contact with their operations counterparts in the gas
industry (gas control) to identify maintenance and share critical system information for
supporting reliable operations in times of system stress.
New York
Traditionally, the New York Area has been dependent on fossil fuels for the largest
portion of the installed capacity. Recent capacity additions or enhancements use natural
gas as the primary fuel. Extreme weather or other conditions that might limit the
availability of natural gas are not anticipated to impact system reliability in New York. A
number of the steam units in southeastern New York have
“dual-fuel” capability,
employing the use of residual or distillate oil as an alternative to natural gas. Adequate
supplies of all fuel types are expected to be available.
Ontario
The majority of generation facilities operating on the IESO-controlled grid are
represented by three basic types of fuel (Hydroelectric, Nuclear and Fossil). The fossil-
fueled facilities are predominately fired by coal. A portion of these fossil-fired resources
NPCC Reliability Assessment Winter 2006-2007 Final Report
Page 20 of 55
Docket No. ER11-1844
Exhibit No. NYI-24
Page 21 of 55
is fueled by natural gas or oil, with a majority of the oil-fired capability being dual fuel
capable (natural gas and oil).
Fuel for a portion of the coal-fired resources is delivered by boat. During the winter
months, shipping capability is limited by ice and weather conditions on the Great Lakes.
While these conditions may prevent delivery for extended periods, all sites relying on this
delivery mechanism stockpile the fuel.
Similar to other Areas, natural gas supplies for electricity generation in Ontario also
compete with space heating requirements. However, due to last winter’s mild
temperatures and a relatively quiet Gulf Hurricane season, natural gas supplies and
delivery infrastructures are expected to be adequate for the Winter Operating Period.
At the time of this report, the IESO has not been made aware of any fuel supply concerns.
It is therefore expected that adequate supplies of these fuels will be available for the
Winter Operating Period.
Québec
Québec's electrical energy is largely produced by hydro generating stations located on
different river systems, which are geographically dispersed. The major systems have
multi-year storage capability. For planning purposes and day-to-day operation of the
Québec system, these multi-year water reserves and other non-hydroelectric resources
can be relied upon allowing Québec to cope with periods of low inflows (lower than
annual average). Hydro-Québec Production has 876 MW of gas turbines (Jet turbines
fuelled by oil or kerosene), 675 MW of nuclear production and 600 MW of classic
thermal production (Oil). This accounts for about 5.2 % of the total capacity. The gas
turbines and oil generation are used for peaking purposes; fuel supply is not an issue in
this case. The new private producer, Trans Canada Energy (TCE), is a natural gas
generating station. This generation is delivered under a firm purchase contract to Hydro-
Québec Distribution and a firm purchase contract for the natural gas has been secured by
TCE.
In its 2005 Triennial Review of Resource Adequacy, Québec required 3,431 MW of
reserves to meet the NPCC reliability planning criterion. This represents 9.3 % of the
peak load. For the 2006-2007 winter peak, a capacity margin of 4,486 MW is expected,
which represent 12.7 % based on the internal peak demand. This is higher than the
required reserves as stated in the Québec 2005 Triennial review of Resource Adequacy.
Each year, Québec submits to the NPCC an Interim or Triennial Review and Hydro-
Québec must demonstrate its reliability to the Québec Energy Board. This exercise is
done with the same tools and assumptions as those used in the assessment of resource
adequacy for the NPCC.
NPCC Reliability Assessment Winter 2006-2007 Final Report
Page 21 of 55
Docket No. ER11-1844
Exhibit No. NYI-24
Page 22 of 55
5.
Transmission Adequacy
Transmission studies are usually performed on the basis of meeting summer loads as
these represent the highest stress on the system from a reactive support and thermal
transfer capability perspective. No specific NPCC Regional Transmission study has been
performed for this Winter Operating Period. Recognizing this limitation, the CO-12
working group reviewed the Normal Transfer Capability (NTC) and the Feasible Transfer
Capabilities (FTC) under peak loads between the Areas of NPCC.
The following is a transmission adequacy assessment from the perspective of the ability
to support differing levels of energy transfers, from Inter-Region, Inter-Area and Intra-
Area perspectives.
Inter-Regional Transmission Adequacy
The phase angle regulators (PARs) on the Michigan - Ontario Interface (PS4 on 230 kV
circuit L4D and PS51 on circuit L51D) are available but are presently by-passed, pending
completion of an agreement being negotiated with the International Transmission
Company for the operation of the PARs. Until this agreement is in place, PS4 and PS51
will only be operated off neutral tap under emergency conditions, prior to voltage
reductions or load shedding operating actions. Due to a forced outage, 230 kV circuit
B3N (230 kV Scott - Bunce Creek circuit) has been out of service since 2003. The
circuit was returned to service in November 2006 without a phase shifter at Bunce Creek.
Until a new phase shifter is installed replacing one that failed at Bunce Creek (estimated
to be 2008) and/or the agreement can be reached, it was assumed that the Michigan -
Ontario Ties will remain free flowing for the study period.
Inter Area Transmission Adequacy
The tables in Appendix II provide a summary of the normal transfer capabilities (NTC)
on the interfaces between NPCC Areas and for some specific load zone areas. They also
indicate the corresponding feasible transfer capabilities (FTC) under peak conditions
based on internal limitations or other factors and indicate the rationale behind reductions
from the normal transfer capability.
Maritimes to Québec NTC and FTC remain as they were last year. The Québec to
Maritimes FTC is down to 900 MW from 1,200 MW, due to the outage of a 315/230 kV
transformer at Matapédia Transformer Station. New York (Frontier) to Ontario NTC and
FTC are down from 1,410 MW to 1,250 MW, due to limitations on the New York
system. The simultaneous FTC from New York to PJM is down from 3,125 MW to
2,300 MW. Ontario to New York (Frontier) NTC and FTC are down from 2,000 MW to
1,600 MW. Ontario to Beauharnois FTC is up from 245 MW to 470 MW. The former
value is the TTC intended to cover all operating conditions but the latter value
corresponds to the transfer capability likely to be available at peak load under emergency
conditions.
NPCC Reliability Assessment Winter 2006-2007 Final Report
Page 22 of 55
Docket No. ER11-1844
Exhibit No. NYI-24
Page 23 of 55
The 100 MW Variable Frequency Transformer (VFT) at the Langlois Transformer
Station near Les Cèdres Generating Station was commissioned in January
2005.
Currently, imports via this interconnection are prohibited except during emergencies.
The status of the interconnection should change by March 2007, when full import-export
operation will be possible.
Transmission Adequacy Assessment by Area
Maritimes
The Maritimes bulk transmission system is projected to be adequate to supply the
demand requirements for the Winter Operating Period. There are no major maintenance
outages scheduled on the Maritimes bulk transmission system during the Winter
Operating Period.
There have been no major additions to the Maritimes bulk transmission system.
Interconnection capability remains unchanged and is capable of delivering up to 700 MW
to New England and up to 785 MW to Québec.
New England
During the upcoming Winter Operating Period, New England expects various new
transmission facilities to be placed in-service. The first stage of the NSTAR 345 kV
Reliability Project involves the addition of two new 345 kV underground cables from
Stoughton, Mass. into the Boston area, providing a much needed increase in import
capability for this area. The first of those cables went into service in November. The
Killingly, Connecticut 345/115 kV transformer will provide a new, independent supply to
the eastern Connecticut 115 kV system from the north. The Plumtree to Norwalk
combined overhead/underground 345 kV project, which was placed into service in
October, provides the first leg of a new 345 kV loop through Southwest Connecticut
designed to increase import into the area.
The new 345 kV New Haven to North Rutland project creates a new 345 kV path from
southern Vermont into central Vermont, relieving overloads on the 115 kV system and
providing voltage support in the area.
Upgrades to the structures and the addition of the Killingly transformer will require
outages of the 347 line (Lake Road, Connecticut to Sherman Road, Rhode Island) which
will reduce Connecticut import capability.
Another significant outage is the 301 line from Carpenter Hill to Ludlow, which will be
out of service from January through March and will reduce east-west transfers.
ISO-NE continually monitors transmission facility additions and coordinates outages in
order to mitigate any possible reliability risks that may be associated with changes in the
transmission system.
NPCC Reliability Assessment Winter 2006-2007 Final Report
Page 23 of 55
Docket No. ER11-1844
Exhibit No. NYI-24
Page 24 of 55
New York
Major transmission facility additions to the New York bulk power system are not planned
for the winter 2006-2007 period.
For the Flat Rock Wind Generation project to connect to the NYISO power system, the
Chase’s Lake Road 230 kV station will tap into the existing Adirondack - Porter #11
230kV circuit. A 230 kV circuit from Chase’s Lake Road to Rector Road will terminate
at the Rector Road 230/34.5 kV station, and will be available during the winter capability
period. The New York Area transmission system is expected to be adequate during the
Winter Operating Period.
Ontario
The major transmission projects in Ontario during the 2006-2007 Winter Operating
Period are taking place at two stations on the Michigan interface; Scott and Lambton TS.
The outages have already begun and will extend past the winter operating period. A
major breaker replacement project will be undertaken at Scott TS; this work is expected
to be competed by the beginning of the 2007 Summer Operating Period. In parallel,
major work is underway at the Lambton switch yard. Major work here includes replacing
the strain bus work with rigid bus, re-terminating three circuits, the addition of two new
circuits and upgrading three breakers. The overall goal is to reduce the short circuit
limitations in the area and allow for the addition of approximately 1700 MW of new gas
fired generation in the area over the next 2 years.
There are no long-term internal transfer limitations identified that will significantly
impact this load and capacity analysis. However there may be periodic short-term
limitations on transfers. For example, on very cold winter nights the transfer north of
Essa may limit the amount of hydroelectric generation that can be shut down overnight,
limiting ponding operations.
Québec
TransÉnergie has three major projects for the
2006-2007 Winter Operating Period.
Hydro-Québec Production is in the process of commissioning the 480 MW Eastmain 1
Generating Station. As mentioned in the summer 2006 assessment, TransÉnergie has
therefore commissioned a 60 km (37 mile) double circuit 315 kV line from Eastmain 1 to
the Némiscau substation. For this Operating Period, TransÉnergie is placing in service
the Eastmain 1 13.8/315 kV transformers to connect the generators to the system.
A 345 Mvar 315 kV capacitor bank is also being added to the high voltage system at the
Hertel substation near Montréal to improve voltage support in the load area of the system.
Under certain circumstances, internal transfer capability in the southern part of the
province is limited by voltage support.
NPCC Reliability Assessment Winter 2006-2007 Final Report
Page 24 of 55
Docket No. ER11-1844
Exhibit No. NYI-24
Page 25 of 55
Finally, a new 735/315 kV 1110 MVA transformer is being placed in service at the
Arnaud substation on the Churchill Falls system. A large local load increase requires
TransÉnergie to add transformer capacity at this station.
During the Winter Operating Period no major maintenance outages are scheduled on the
TransÉnergie system. Transmission margins for the peak period are adequate to carry the
net internal demand plus the firm capacity sales. Moreover, enough transmission
capability remains on the system to carry additional resources that would be called upon
if load was greater than the forecast.
Voltage support in the southern part of the system (load area) is a concern during the
winter operating period especially during episodes of heavy load. TransÉnergie has an
agreement with HQ Production (the largest producer on the system) that maintenance on
generators will be finished by December 1, 2006, and that all possible generation will be
available. This, along with yearly testing of reactive capability of the generators, ensures
maximum availability of reactive power. The end of TransÉnergie maintenance on the
high voltage transmission system is also targeted for December 1, 2006. Moreover,
TransÉnergie has a target for the availability of both high voltage and low voltage
capacitor banks, that no more than 200 Mvar should be unavailable during the Winter
Operating Period. The target for the low voltage banks is 90% availability.
On May 27 2006, smoothing reactor XL50 (At Radisson) on pole 1 of the Radisson-
Nicolet-Sandy Pond Multi terminal DC (MTDC) link was damaged. The spare was
installed and failed on July 17. During the rest of the summer, the MTDC link was
operated in hybrid monopolar mode, after a series of tests were made to make sure that
this mode was operable. During September, a smoothing reactor from Nicolet was
relocated to Radisson and installed. This now permits normal bipolar operation. The
actual situation is to rely on a single spare smoothing reactor located at Nicolet.
NPCC Reliability Assessment Winter 2006-2007 Final Report
Page 25 of 55
Docket No. ER11-1844
Exhibit No. NYI-24
Page 26 of 55
6.
Operational Readiness for 2006-2007
Load Response Programs
Each Area utilizes various methods of demand management associated with interruptible
loads. In those Areas where market based structures have been implemented or are
evolving there has been a shift in contractual obligations of the interruptible loads. The
move is an attempt to manage load interruption, as a result of demand exceeding
resources, by giving industrial and commercial customers the ability to respond to price
signals in the wholesale electricity marketplace. The following is a summary of current
interruptible load programs available or in development to be available for this Winter
Operating Period in each Area.
Maritimes
The Maritimes Area does not have any Load Response Programs. Interruptible and
Dispatchable loads are forecast on a weekly basis as indicated in Appendix I, Table 2,
and are available for use when corrective action is required within the Area.
New England
During times of capacity deficiencies, ISO New England declares ISO-NE Operating
Procedure No. 4 - Actions during a Capacity Deficiency (OP 4), which includes public
appeals for conservation, purchasing emergency energy from the neighboring Areas,
activating demand response resources, and implementing voltage reductions.
Demand response resources are activated through ISO-NE’s Demand Response
Programs. Demand Response Providers enroll resources directly with ISO-NE and enter
into agreements with retail customers requiring them to reduce their electricity
consumption during OP-4 actions.
During the 2006-2007 Winter Operating Period, ISO-NE will administer the following
programs, designed to provide emergency resources:
• 30-Minute Real-Time Demand Response Program
• 2-Hour Real-Time Demand Response Program
• Real-Time Profiled Response Program
Participants within the Real-Time Demand Response Program will be involved in one of
two sub-programs based on their response time
(30 Minutes or
2 Hours). Each
subprogram will require the participant to interrupt during pre-specified actions of OP-4.
Participants in the Real-Time Profiled Response Program will also be required to respond
during certain actions of OP-4.
NPCC Reliability Assessment Winter 2006-2007 Final Report
Page 26 of 55
Docket No. ER11-1844
Exhibit No. NYI-24
Page 27 of 55
Demand response resources totaling
566 MW are assumed available during OP-4
conditions for the 2006-2007 Winter Operating Period in the Load and Capacity table for
New England (Table 3, Appendix I).
In addition to the reliability-based programs, ISO-NE also administers a Real-Time Price
Response program and offers the Day-Ahead Load Response Program. Resources in any
of the Demand Response programs have the option to participate in the Day-Ahead Load
Response Program. Participants in the Day-Ahead Load Response Program will offer an
amount of energy into the Day-Ahead market and, if cleared, will be required to interrupt
as offered. Within the Price Response program, participants will have the option to
voluntarily reduce energy consumption in real time when the zonal price is or is
forecasted to be greater than or equal to $100/MWh. Due to their voluntary nature, these
programs are not included as capacity in the 2006-2007 Winter Operating Period in the
New England Load and Capacity table.
New York
The NYISO Emergency Demand Response Program (EDRP) and Special Case Resources
(SCR) load relief programs are only active during the Summer Operating Period.
Ontario
As mentioned in the resource adequacy assessment, under the IESO-Administered
Market, there are expected to be approximately 427 MW of price responsive loads
available during the peak week. A majority of these loads are treated as a resource that
will be dispatched by the IESO once the price of energy in the real time market has
exceeded the bid (to buy) price submitted by the load. The subject load must then reduce
their demand according to the dispatch instructions.
The Emergency Load Reduction Program (ELRP) is a program that was implemented for
the summer of 2006. The ELRP helps address reliability needs by creating incentives for
load reduction. The IESO will implement ELRP before applying more severe emergency
control actions such as voltage reductions, requesting Ontario generators to apply for
environmental variances, and emergency energy purchases from neighboring
jurisdictions. When a requirement for ELRP is forecasted either in the day-ahead or early
on the day-at-hand, ELRP participants will indicate the load reduction they are willing to
provide. For a commitment to reduce load, ELRP participants are paid a standby
payment until activation. Following an ELRP activation, participants are paid for their
actual measured and verified load reduction.
NPCC Reliability Assessment Winter 2006-2007 Final Report
Page 27 of 55
Docket No. ER11-1844
Exhibit No. NYI-24
Page 28 of 55
In June
2006, the IESO implemented a new reliability program, the Day Ahead
Commitment Process with an expiry date of November 30, 2006. On November 17,
2006, the IESO Board of Directors approved that the Day Ahead Commitment Process
shall continue until such time as another program is implemented that provides at least
equivalent reliability benefits. The process will be reviewed annually. The process is
aimed at reducing the number of import failures and providing more assurance to internal
generation. The design provides a commitment to imports and internal generators, with
financial guarantees, in order to provide greater reliability. It uses a simple commitment
process that limits the impacts on market prices and uplifts. It required only minor
changes to both IESO and participant systems and processes.
Québec
Hydro-Québec Distribution, with TransÉnergie, has developed a voltage reduction
program at a large number of distribution substations. Successive upgrades to an already
existing system and regular testing by TransÉnergie has prompted Hydro-Québec
Distribution to consider the voltage reduction system as a 250 MW resource available in
its NERC resource assessment. This program is included in the “Interruptible Load”
column in the Appendix I, Table 6.
There are also two interruptible load programs. One program involves large industrial
customers and the other involves medium size industrial consumers, dispersed in all parts
of the system. However, most interruptible load is concentrated in the southern part of
the system, where most of the load occurs. These programs sum to 1,040 MW as shown
in Table 6. Clients must be notified 3 to 18 hours in advance, depending on the nature of
their individual contracts.
(The programs total more than 1,040 MW but a factor is
applied to estimate the actual availability of the interruptible load). Table 6 therefore
presents 1,290 MW of interruptible load. (Interruptible load plus the voltage reduction
program)
A public appeal program is in place to reduce load if the reserve criterion cannot be met
or if a particular event occurs on the system. For example, an appeal was made during
the 2003-2004 peak load period (this was the historical peak) to sustain reserves during
that very high load period and because a 735 kV line (Line 7004 Micoua - Laurentides)
had been previously damaged by an ice storm in the Manicouagan region. At that time,
the appeal was judged to provide about 800 MW of load relief.
NPCC Reliability Assessment Winter 2006-2007 Final Report
Page 28 of 55
Docket No. ER11-1844
Exhibit No. NYI-24
Page 29 of 55
7.
Post-Seasonal Assessment and Historical Review
Winter 2005-2006 Post-Seasonal Assessment
NPCC
The sections below describe each Area’s winter 2005-2006 operational experiences and
compare it to the forecast from the last seasonal assessment. The summer
2006
operational experience is described in the
“NPCC Summer
2006 Post-Seasonal
Assessment (CO-12)” and in the “Review of Actual 2006 Summer Use of Operating
Procedures (CP-8)”, previously published.
Maritimes
The Maritimes Area experienced above normal temperatures from mid-December
through March. The actual weekly peak loads experienced during this period were
typically 14 to 20 % lower than forecast. The coincident peak load experienced by the
Maritimes Area during the Winter Operating Period was 4,987 MW on December 21,
2005 at 19:00 EDT. This is 593 MW lower (10.63 %) than the forecast of 5,580 MW.
This is due to a combination of higher than normal temperatures, resulting in a lower
electric heating load, and a reduction of approximately 200 MW of industrial load due to
a labor dispute.
New England
During the 2005-2006 Winter Operating Period, temperatures were very mild and no
significant operating events occurred. A peak load of 21,733 MW was experienced on
December 14, 2005 at hour ending 19:00.
At the time of New England’s 2005-2006 winter peak, the temperature was 17 °F (-8 °C),
which is well above the 6.8 °F (-14 °C) that is associated with “normal weather”.
December was the coldest month of the winter, with the lowest temperatures of the
season occurring around the time of the peak load on December 13 and 14. The average
January weekday temperature at the time of the peak hour was 33 °F (1 °C).
Before the winter began, ISO-NE put a winter Action Plan in place to mitigate any risks
associated with fuel availability and/or energy emergencies that could have resulted due
to the Hurricanes Katrina and Rita. The objectives of this plan were to develop
Emergency Energy procedures, improve communications with the New England
stakeholders and consumers, encourage the utilization of dual-fuel generating capability,
expand demand-side management programs and develop Market Rule additions and
changes, including the creation of Operating Procedure No. 21 - Actions during and
Energy Emergency.
NPCC Reliability Assessment Winter 2006-2007 Final Report
Page 29 of 55
Docket No. ER11-1844
Exhibit No. NYI-24
Page 30 of 55
New York
The New York Area recorded a winter peak of 25,060 MW on December 14, 2005. The
all-time winter peak for the New York Area is 25,541 MW which occurred on December
20, 2004. The peak load was 290 MW lower than the forecasted peak load of 25,350
MW. There was sufficient resources available as the net available resources was 32, 492
MW.
Ontario
The Winter Operating Period began with below normal temperatures in early December
climbing to above normal temperatures in January and February. January was the mildest
on record with afternoon temperatures averaging +2.5 °C (36.5 °F). For the Toronto
area, which is Ontario’s load centre, there were only 18 days in the Winter Operating
Period where the minimum daily temperature was below -10 °C (14 °F). This is in
contrast to the historical average of 39 days for this period. Additionally, there were no
days in the Winter Operating Period where the minimum daily temperature was below
-20 °C (-4 °F) in the Toronto area. This is in contrast to the historical average of five
days for this period.
With the milder than expected temperatures came lower than expected demands. The
peak winter demand occurred during the week beginning December 18, 2005. The
demand that week reached a peak of 23,766 MW. This is 5 % below the all time winter
peak of 24,979 MW which was set on Dec.20, 2004 and was 2% below the forecasted
2005-2006 winter peak of 24,272 MW.
The net result of the milder than normal temperatures and subsequently lower primary
demands was more than sufficient capacity to meet load and reserve requirements during
the 2005-2006 Winter Operating Period.
Québec
The forecasted peak internal demand for the 2005-2006 Winter Operating Period was
36,418 MW. The actual peak internal demand was 33,636 MW, occurring on February
27, 2006 at 18h00. This is 2,782 MW lower than the projection. The normal weather
conditions did not occur during the 2005-2006 winter. It is exceptional to even have a
peak in late February, but no cold spell worth mentioning occurred in January.
The installed capacity in Québec was 40,408 MW for this operating period. The
maintenance outages, deratings and unplanned outages were 2,145 MW. At peak,
purchases were 85 MW (50 MW from New York and 35 MW from Ontario). Sales were
1,580 MW (146 MW to Cornwall and 1,339 MW to New England through Phase II,
Highgate and Stanstead-derby). Only 330 MW of sales to New England and 146 MW to
Cornwall had been forecasted for the peak load period. Interruptible load (351 MW) was
used for commercial reasons by Hydro-Québec-Production. The required operating
reserve at all times is 1,500 MW. The actual operating reserve was 2,839 MW. No
unusual events occurred during this period and no Operating Procedures were enacted.
NPCC Reliability Assessment Winter 2006-2007 Final Report
Page 30 of 55
Docket No. ER11-1844
Exhibit No. NYI-24
Page 31 of 55
All the new equipment that was scheduled to be in service on the system for the 2005-
2006 Winter Operating Period was effectively commissioned.
The voltage support in the load area of the system was adequate, in part because the load
was lower than usual and in part because much attention is paid to the availability of
shunt capacitors and of generator reactive power during the peak period.
Winter Historical Review (Pre-2005-2006)
As summarized in the table below, the forecasted non-coincident peak for this Winter
Operating Period in NPCC Areas is 115,647 MW.
Table B
Historical Peak Demands by Area Occurring November to March (MW)
Total NPCC
New
New
Year
Ontario
Maritimes
Québec
Non-Coincident
England
York
Demand
2000-2001
23,126
4,822
20,088
23,764
30,277
102,077
2001-2002
22,623
4,783
19,872
22,798
30,080
100,156
2002-2003
24,158
5,376
21,535
24,454
34,989
110,512
2003-2004
24,937
5,716
22,818
25,262
36,268
115,001
2004-2005
23,905
5,419
22,635
25,541
34,956
112,456
2005-2006
23,766
4,987
21,733
25,060
33,636
109,182
2006-2007
24,677
5,564
22,550
26,311
36,5455
115,647
Forecast
5 Forecasted peak load for Quebec includes 145 MW in Cornwall (154 MW with losses).
NPCC Reliability Assessment Winter 2006-2007 Final Report
Page 31 of 55
Docket No. ER11-1844
Exhibit No. NYI-24
Page 32 of 55
8.
Winter 2006-2007 Reliability Assessments of Neighboring Regions
This assessment was produced by ReliabilityFirst Corporation for their NERC
Assessment and sent to CO-12 to be included in this report.
ReliabilityFirst Corp. 2006-2007 Winter Assessment
The former ECAR, MAAC, and MAIN regional reliability councils have combined to
form ReliabilityFirst Corporation (RFC), which began operation on January 1, 2006 as
one of the now eight regional reliability councils under NERC. Many of the former
members of MAAC, most of the former ECAR members, and some of the former MAIN
members are now members of RFC. Two former ECAR members have joined the SERC
region, and the remaining former MAIN members have joined either the MRO or SERC
regions. Transmission owners that belong to RFC, except for some in Kentucky and a
small portion in Ohio, are members of either the MISO or PJM regional transmission
organizations (RTOs). Transition to a single set of processes and procedures is still in
progress for all of the previous heritage regional activities.
Heritage regional
requirements still apply to the former members now in RFC.
All RFC members are affiliated with either MISO or PJM for operations and reliability
coordination with the exception of Ohio Valley Electric Corporation
(OVEC), a
generation and transmission utility located in Kentucky and Ohio and E.ON US (a.k.a.
LG&E Energy), a vertically integrated utility located primarily in Lexington and
Louisville, Kentucky. OVEC is not affiliated with either RTO, but OVEC reliability
coordinator services are performed by PJM. In addition, the Federal Energy Regulatory
Commission (FERC) has approved the withdrawal of E.ON US from MISO effective
September 1, 2006. At that time, Tennessee Valley Authority (TVA) became the
reliability coordinator for E.ON US, which is now included in the TVA reliability plan.
TVA is also included in the former ECAR regional reliability plan, which remains in
effect.
Effective January 1, 2007, E.ON US will become a member of the SERC region and will
no longer be a part of the RFC region. This assessment includes E.ON US information
and data for the entire winter 2006/07 season.
Demand
RFC’s total internal demand forecast for Winter 2006/07 is 154,800 MW. This is 4,984
MW (3.3%) higher than the actual peak demand experienced by the RFC member
companies during the winter of 2005/06. The regional demand forecast is derived by
aggregating the demand forecasts of the companies. The RFC member forecasts are
based on expected average winter weather conditions and expected economic conditions
during the winter of 2006/07 based on late 2005 economic forecasts. The Winter
2005/06 demand forecasts are not available for comparison to the Winter 2006/07
forecasts. Demand-side management programs and interruptible demand contracts that
could be utilized, if necessary, are expected to total 2,200 MW at the time of the winter
peak.
NPCC Reliability Assessment Winter 2006-2007 Final Report
Page 32 of 55
Docket No. ER11-1844
Exhibit No. NYI-24
Page 33 of 55
At this time in the transition of ECAR, MAAC, and MAIN to ReliabilityFirst, the
regional assessment does not specifically address peak demand uncertainty and
variability, or the variability in demand due to weather. Planning for such uncertainties is
the responsibility of each individual Load Serving Entity. As a sensitivity analysis, a
calculation based on a weather induced 5% load increase (7,700 MW) was performed.
Even with such a load increase, the reserve margin would be adequate to meet the
demand.
Resources
Generation projects are expected to add an additional 2,540 MW of capacity resources in
the RFC region prior to the 2006/07 winter peak. An additional 403 MW of capacity
resources are expected to go in service during the winter season, for a total increase of
2,943 MW. These are all considered to be committed capacity resources for the purpose
of this assessment.
RFC expects net capacity resources in the region to be 228,563 MW (net seasonal
capability), which is about 3,500 MW more capacity resources for the RFC regional area
than there were in the winter of 2005/06. RFC forecasts its capacity margin to be 33.2%.
The forecast capacity margin in the ECAR, MAAC, and MAIN regions last winter were
31.8%, 32.8%, and 39.6%, respectively. The reserve margin for this winter of 49.8%
exceeds the MAAC reserve requirement of 15%, the MAIN recommended reserve of
14%, and the state of Wisconsin requirement of 18%. ECAR did not have a specified
reserve requirement.
RFC has developed a reserve requirement criterion, to become effective in the spring of
2008, for the 2008 summer peak season. ReliabilityFirst does not require individual
members to plan for resource unavailability due to extreme credible contingencies that
might occur. Therefore, RFC has not surveyed its members to determine how the
individual members plan for resource unavailability beyond the largest single
contingency.
At this time, members have made arrangements to purchase 3,389 MW and sell 2,544
MW outside the RFC region. An additional 1,035 MW of member-owned capacity is
located outside of the region, for a minimum net expected import of 1,880 MW. None of
these transactions are necessary for the members of the region to meet their respective
reserve criterion.
Since the formation of RFC occurred only recently, a comprehensive study of resource
deliverability has not yet been conducted. However, the PJM RTO conducts analyses to
determine that the aggregate PJM capacity can be delivered to the aggregate PJM load.
PJM has approximately
5,300 MW of uncommitted resources, which includes
approximately 800 MW of uncommitted capacity and approximately 4,500 MW of
energy only capacity that is not considered committed capacity for this assessment.
A previous analysis conducted in ECAR had determined that about 2,000 MW of
capacity might not be deliverable. That analysis determined the levels of export
restriction from one area of the ECAR region to other areas in the region under first
contingency conditions.
NPCC Reliability Assessment Winter 2006-2007 Final Report
Page 33 of 55
Docket No. ER11-1844
Exhibit No. NYI-24
Page 34 of 55
MISO has developed a deliverability test consistent with its tariff which may or may not
result in additional committed capacity within RFC, and which has not been included in
this assessment.
The capacity and reserve margin data listed above includes the projected generator
additions as committed capacity and excludes the undeliverable and energy only
generation from committed capacity. Based on the projected reserve levels, the
committed capacity resources in the ReliabilityFirst region are expected to be adequate
this winter.
Fuel
The ReliabilityFirst region has a diversified fuel supply. About 47% of the capacity uses
coal for its fuel, with another 14% of the capacity being nuclear fueled. Oil and natural
gas fuels
7% and 28% of the capacity respectively, and
3% of the capacity is
hydroelectric. The remaining 1% of capacity uses a variety of renewable and other
energy supplies.
RFC does not perform an explicit fuel supply interruption study, but reviews the potential
for major supply problems based on past disruptions reoccurring. Adequate pipeline
capacity is expected to be available during the winter, when needed to operate the gas
units. Although some 67,000 MW of the regional capacity is fueled by gas, high reserve
margins will allow the expected gas usage to be minimized, if needed. Additionally, the
Energy Information Administration reports that natural gas in storage at the end of
August is the highest it has been in the last five years at this time of the year and 12%
above the
5 year average of gas in storage
(see web site at
availability this winter.
At this time there are no known conditions affecting coal deliveries by rail that are
expected to cause coal delivery problems for ReliabilityFirst members this winter. Since
only 3% of the regional capacity is hydroelectric, and more than half of the hydro
capacity in RFC is pumped storage, there is no expectation that hydro conditions will be a
regional concern.
RFC expects each company to be ready to mitigate any fuel supply disruption that may
occur. Although RFC has not compiled a list of mitigation actions that could be taken,
some members may resort to fuel switching for those units with dual-fuel capability, if it
becomes necessary to maintain reliable fuel supplies. Data available to RFC indicates
that 13% (30,500 MW) of the regional capacity has dual-fuel capability. RFC has not
verified with individual members the ease or difficulty involved with switching to
alternate fuels.
The most likely impacts of extreme winter weather on fuel supplies are frozen coal and
low gas pressure due to high residential gas use. Coal is routinely freeze treated during
winter when weather conditions indicate the need. Anticipated reserve margins should be
sufficient to minimize the need for gas-fired electric generation. Extreme weather
conditions during peak load conditions should not materially affect the ability to
adequately supply generation across the region.
NPCC Reliability Assessment Winter 2006-2007 Final Report
Page 34 of 55
Docket No. ER11-1844
Exhibit No. NYI-24
Page 35 of 55
Transmission
Historically, the heritage regions have experienced widely varying power flows due to
transactions and prevailing weather conditions across the region. As a result, the
transmission system could become constrained during peak periods because of unit
unavailability and unplanned transmission outages concurrent with large power
transactions. Generation redispatch has the potential to mitigate some of these potential
constraints. Notwithstanding the benefits of this redispatch, should transmission
constraint conditions occur, local operating procedures, as well as the NERC
transmission loading relief
(TLR) procedure may be required to maintain adequate
transmission system reliability.
Certain critical flowgates that have experienced TLRs in previous winters continue to be
identified as heavily loaded in various reliability assessments and may require operator
intervention to ensure adequate reliability levels are maintained. No major system
changes have been identified that would adversely impact reliability.
RFC actively participated in the existing interregional seasonal transmission assessment
efforts. Transfer capability results are included in each of the interregional seasonal
reports. Simultaneous import capabilities are projected to be adequate for the winter. A
new interregional agreement, the Eastern Interconnection Reliability Assessment Group
(ERAG), has been executed between RFC and the five other regions in the Eastern
Interconnection. This new agreement will become effective for the
2007 summer
assessments.
Operational Issues
The PJM portion of RFC has no significant reliance on any one fuel source, and it doesn’t
depend on outside resources to any great extent. Furthermore, its membership's
compliance with applicable criteria prevents any undeliverable load pockets. PJM is
large enough that geographic diversity of weather helps balance its load factor and the
load diversity is further enhanced by markets that are mature and well tested. External
units that are considered capacity in PJM must sign an agreement specifying that if a
capacity emergency is called, that unit’s capacity must be provided to PJM.
Transmission availability is secured before an external unit can be considered PJM
capacity. The MISO portion of RFC also has no significant reliance on any one fuel
source.
RFC does not anticipate any generating unit or transmission facility outages or any
unusual operating conditions that could impact reliability this winter.
In addition to the NERC TLR procedure, other operating procedures are available to
maintain reliable system operations, such as a multiregional agreement involving
balancing authorities around Lake Erie, to use generation and phase angle regulator
redispatch to mitigate emergency TLR procedures and curtailments in situations where
the affected system(s) is about to curtail firm demand.
RFC does not expect local environmental restrictions on any generating units to
significantly impact availability during peak load conditions.
NPCC Reliability Assessment Winter 2006-2007 Final Report
Page 35 of 55
Docket No. ER11-1844
Exhibit No. NYI-24
Page 36 of 55
Appendix I -2006-2007 Winter Expected Load and Capacity Forecasts
Table 1 - NPCC Summary
Week
Installed
Total
Load
Interruptible
Known
Req. Operating
Unplanned
Net
Beginning
Capacity
Purchases1
Sales1
Capacity2
Forecast
Load
Maint./Derat.
Reserve
Outages
Margin3
Sundays
MW
MW
MW
MW
MW
MW
MW
MW
MW
MW
26-Nov-06
154,003
80
182
153,901
104,531
2,810
13,860
7,332
10,574
20,414
3-Dec-06
154,044
80
182
153,942
108,114
2,815
12,863
7,331
10,174
18,275
10-Dec-06
154,044
80
182
153,942
110,953
2,815
9,170
7,331
10,174
19,130
17-Dec-06
154,044
80
182
153,942
112,555
2,815
5,779
7,331
10,174
20,918
24-Dec-06
154,044
80
182
153,942
109,950
2,790
5,448
7,331
10,174
23,829
31-Dec-06
154,054
80
182
153,952
112,995
2,790
5,131
7,331
13,973
17,312
7-Jan-07
154,059
80
182
153,957
114,839
2,793
5,549
7,331
13,973
15,058
14-Jan-07
154,059
80
182
153,957
115,591
2,793
6,885
7,331
13,973
12,970
21-Jan-07
154,059
80
182
153,957
114,577
2,793
7,949
7,331
13,973
12,920
28-Jan-07
154,059
80
182
153,957
113,863
2,793
7,480
7,331
14,273
13,803
4-Feb-07
154,230
80
182
154,128
113,322
2,810
7,929
7,331
14,273
14,083
11-Feb-07
154,230
80
182
154,128
111,156
2,810
8,661
7,331
14,273
15,517
18-Feb-07
154,230
80
182
154,128
109,164
2,810
8,258
7,331
14,273
17,913
25-Feb-07
154,230
80
182
154,128
106,648
2,810
10,237
7,331
9,173
23,550
4-Mar-07
154,210
80
182
154,108
105,002
2,817
17,578
7,331
9,173
17,841
11-Mar-07
154,210
80
182
154,108
102,045
2,817
19,157
7,331
9,173
19,220
18-Mar-07
154,210
80
182
154,108
99,727
2,817
20,792
7,331
9,173
19,902
25-Mar-07
154,210
80
182
154,108
97,062
2,817
19,621
7,331
9,173
23,738
Notes and Definitions
1) Purchases and Sales represent those contracts with areas outside NPCC
2) Total Capacity = Installed capacity + Purchases - Sales
3) Net capacity margin = Total capacity - Load forecast + Interruptible load - Known maintenance - Operating reserve - Unplanned outages
NPCC Reliability Assessment Winter 2006-2007 Final Report
Page 36 of 55
Docket No. ER11-1844
Exhibit No. NYI-24
Page 37 of 55
Table 2 - Maritimes
Week
Installed
Firm
Firm
Total
Load
Interruptible
Known
Req. Operating
Unplanned
Net
Beginning
Capacity
Purchases
Sales
Capacity
Forecast
Load
Maint./Derat.
Reserve
Outages
Margin
Sundays
MW
MW
MW
MW
MW
MW
MW
MW
MW
MW
26-Nov-06
6,852
0
205
6,647
4,703
527
49
830
266
1,326
3-Dec-06
6,893
0
205
6,688
4,912
532
78
829
266
1,135
10-Dec-06
6,893
0
205
6,688
5,065
532
78
829
266
982
17-Dec-06
6,893
0
205
6,688
5,190
532
78
829
266
857
24-Dec-06
6,893
0
205
6,688
5,071
507
78
829
266
951
31-Dec-06
6,903
0
205
6,698
5,216
507
64
829
265
831
7-Jan-07
6,908
0
205
6,703
5,312
510
64
829
265
743
14-Jan-07
6,908
0
205
6,703
5,508
510
64
829
265
547
21-Jan-07
6,908
0
205
6,703
5,390
510
64
829
265
665
28-Jan-07
6,908
0
205
6,703
5,356
510
100
829
265
663
4-Feb-07
6,908
0
205
6,703
5,554
527
219
829
265
363
11-Feb-07
6,908
0
205
6,703
5,556
527
183
829
265
397
18-Feb-07
6,908
0
205
6,703
5,564
527
205
829
265
367
25-Feb-07
6,908
0
205
6,703
5,298
527
89
829
265
749
4-Mar-07
6,928
0
205
6,723
4,994
534
483
829
265
686
11-Mar-07
6,928
0
205
6,723
4,871
534
105
829
265
1,187
18-Mar-07
6,928
0
205
6,723
4,752
534
89
829
265
1,322
25-Mar-07
6,928
0
205
6,723
4,632
534
89
829
265
1,442
NPCC Reliability Assessment Winter 2006-2007 Final Report
Page 37 of 55
Docket No. ER11-1844
Exhibit No. NYI-24
Page 38 of 55
Table 3 - New England
Week
Installed
Firm
Firm
Total
Load
Interruptible
Known
Req. Operating Unplanned
Net
Beginning
Capacity1
Purchases2
Sales2
Capacity
Forecast3
Load4
Maint./Derat.5
Reserve6
Outages7
Margin
Sundays
MW
MW
MW
MW
MW
MW
MW
MW
MW
MW
26-Nov-06
33,215
407
343
33,279
21,231
566
1,900
1,800
4,080
4,834
3-Dec-06
33,215
407
343
33,279
21,434
566
1,900
1,800
3,680
5,031
10-Dec-06
33,215
407
343
33,279
21,727
566
1,800
1,800
3,680
4,838
17-Dec-06
33,215
407
343
33,279
21,738
566
500
1,800
3,680
6,127
24-Dec-06
33,215
407
343
33,279
21,801
566
100
1,800
3,680
6,464
31-Dec-06
33,215
407
343
33,279
22,079
566
0
1,800
7,480
2,486
7-Jan-07
33,215
407
343
33,279
22,550
566
0
1,800
7,480
2,015
14-Jan-07
33,215
407
343
33,279
22,550
566
0
1,800
7,480
2,015
21-Jan-07
33,215
407
343
33,279
22,550
566
0
1,800
7,480
2,015
28-Jan-07
33,215
407
343
33,279
22,325
566
200
1,800
7,780
1,740
4-Feb-07
33,215
407
343
33,279
22,054
566
100
1,800
7,780
2,111
11-Feb-07
33,215
407
343
33,279
22,025
566
100
1,800
7,780
2,140
18-Feb-07
33,215
407
343
33,279
21,759
566
0
1,800
7,780
2,506
25-Feb-07
33,215
407
343
33,279
20,757
566
0
1,800
2,680
8,608
4-Mar-07
33,215
407
343
33,279
20,403
566
300
1,800
2,680
8,662
11-Mar-07
33,215
407
343
33,279
20,205
566
500
1,800
2,680
8,660
18-Mar-07
33,215
407
343
33,279
19,835
566
2,000
1,800
2,680
7,530
25-Mar-07
33,215
407
343
33,279
19,262
566
700
1,800
2,680
9,403
Notes
1) Installed Capacity from October 1, 2006 Seasonal Claimed Capability (SCC) Report, including Settlement Only generators
2) Purchases and Sales based on 2006 CELT Report and information from ISO-NE Settlements department
3) Load Forecast assumes Peak Load Exposure as reported in the 2006 CELT Report
4) Interruptible Loads as reported in Demand Response Enrollment Statistics as of October 2, 2006
5) Includes known maintance as of October 5, 2006
6)1,800 MW of operating reserve assumes 100% of the first largest contingency at 1,200 MW and 50% of the second largest contingency of 1,200 MW
7) Assumed unplanned outages based on historical observation of outages, with an additional 4,200 MW of outages for generation at risk due to gas supply during eight
weeks in January and February, and additional capacity deratings to reflect the assumption that Mystic 8 and 9 and Seabrook will be limited to a total of 1,200 MW
NPCC Reliability Assessment Winter 2006-2007 Final Report
Page 38 of 55
Docket No. ER11-1844
Exhibit No. NYI-24
Page 39 of 55
Table 4 - New York
Week
Installed
Firm
Firm
Total
Load
Interruptible
Known
Req. Operating
Unplanned
Net
Beginning
Capacity
Purchases
Sales
Capacity
Forecast
Load
Maint./Derat.
Reserve
Outages
Margin
Sundays
MW
MW
MW
MW
MW
MW
MW
MW
MW
MW
26-Nov-06
41,296
410
273
41,433
24,647
0
2,793
1,800
3,378
8,815
3-Dec-06
41,296
410
273
41,433
24,981
0
2,392
1,800
3,378
8,882
10-Dec-06
41,296
410
273
41,433
25,418
0
1,398
1,800
3,378
9,439
17-Dec-06
41,296
410
273
41,433
26,311
0
1,220
1,800
3,378
8,724
24-Dec-06
41,296
410
273
41,433
26,311
0
1,220
1,800
3,378
8,724
31-Dec-06
41,296
410
273
41,433
26,311
0
1,052
1,800
3,378
8,892
7-Jan-07
41,296
410
573
41,133
26,311
0
1,481
1,800
3,378
8,163
14-Jan-07
41,296
410
573
41,133
26,311
0
2,817
1,800
3,378
6,827
21-Jan-07
41,296
410
573
41,133
26,311
0
3,049
1,800
3,378
6,595
28-Jan-07
41,296
410
573
41,133
26,311
0
2,284
1,800
3,378
7,360
4-Feb-07
41,296
410
523
41,183
26,311
0
2,749
1,800
3,378
6,945
11-Feb-07
41,296
410
523
41,183
25,212
0
3,059
1,800
3,378
7,734
18-Feb-07
41,296
410
523
41,183
24,596
0
2,717
1,800
3,378
8,692
25-Feb-07
41,296
410
523
41,183
24,134
0
3,418
1,800
3,378
8,453
4-Mar-07
41,296
410
273
41,433
23,620
0
5,530
1,800
3,378
7,105
11-Mar-07
41,296
410
273
41,433
23,107
0
6,332
1,800
3,378
6,816
18-Mar-07
41,296
410
273
41,433
22,850
0
8,030
1,800
3,378
5,375
25-Mar-07
41,296
410
273
41,433
22,593
0
7,454
1,800
3,378
6,208
NPCC Reliability Assessment Winter 2006-2007 Final Report
Page 39 of 55
Docket No. ER11-1844
Exhibit No. NYI-24
Page 40 of 55
Table 5 - Ontario
Week
Installed
Firm
Firm
Total
Load
Interruptible
Known
Req. Operating
Unplanned
Net
Beginning
Capacity
Purchases
Sales
Capacity
Forecast
Load
Maint./Derat.
Reserve
Outages
Margin
Sundays
MW
MW
MW
MW
MW
MW
MW
MW
MW
MW
26-Nov-06
31,189
0
0
31,189
23,072
427
5,260
1,402
1,350
532
3-Dec-06
31,189
0
0
31,189
23,790
427
5,135
1,402
1,350
-61
10-Dec-06
31,189
0
0
31,189
23,856
427
2,725
1,402
1,350
2,283
17-Dec-06
31,189
0
0
31,189
24,124
427
2,193
1,402
1,350
2,547
24-Dec-06
31,189
0
0
31,189
22,459
427
2,372
1,402
1,350
4,033
31-Dec-06
31,189
0
0
31,189
23,921
427
2,135
1,402
1,350
2,808
7-Jan-07
31,189
0
0
31,189
24,257
427
2,124
1,402
1,350
2,483
14-Jan-07
31,189
0
0
31,189
24,677
427
2,124
1,402
1,350
2,063
21-Jan-07
31,189
0
0
31,189
24,420
427
2,956
1,402
1,350
1,488
28-Jan-07
31,189
0
0
31,189
24,289
427
3,016
1,402
1,350
1,559
4-Feb-07
31,194
0
0
31,194
24,143
427
3,036
1,402
1,350
1,690
11-Feb-07
31,194
0
0
31,194
23,815
427
3,494
1,402
1,350
1,560
18-Feb-07
31,194
0
0
31,194
23,392
427
3,511
1,402
1,350
1,966
25-Feb-07
31,194
0
0
31,194
23,131
427
4,905
1,402
1,350
833
4-Mar-07
31,194
0
0
31,194
22,992
427
6,278
1,402
1,350
-401
11-Mar-07
31,194
0
0
31,194
21,961
427
7,033
1,402
1,350
-125
18-Mar-07
31,194
0
0
31,194
21,619
427
7,033
1,402
1,350
217
25-Mar-07
31,194
0
0
31,194
20,926
427
7,538
1,402
1,350
405
NPCC Reliability Assessment Winter 2006-2007 Final Report
Page 40 of 55
Docket No. ER11-1844
Exhibit No. NYI-24
Page 41 of 55
Table 6 - Québec
Week
Installed
Firm
Firm
Total
Load
Interruptible
Known
Req. Operating
Unplanned
Net
Beginning
Capacity1
Purchases2
Sales3
Capacity
Forecast4
Load5
Maint./Derat.
Reserve
Outages
Margin
Sundays
MW
MW
MW
MW
MW
MW
MW
MW
MW
MW
26-Nov-06
41,451
250
330
41,371
30,878
1,290
3,858
1,500
1,500
4,925
3-Dec-06
41,451
250
330
41,371
32,997
1,290
3,358
1,500
1,500
3,306
10-Dec-06
41,451
250
330
41,371
34,887
1,290
3,169
1,500
1,500
1,605
17-Dec-06
41,451
250
330
41,371
35,192
1,290
1,788
1,500
1,500
2,681
24-Dec-06
41,451
250
330
41,371
34,308
1,290
1,678
1,500
1,500
3,675
31-Dec-06
41,451
250
330
41,371
35,468
1,290
1,880
1,500
1,500
2,313
7-Jan-07
41,451
500
330
41,621
36,409
1,290
1,880
1,500
1,500
1,622
14-Jan-07
41,451
500
330
41,621
36,545
1,290
1,880
1,500
1,500
1,486
21-Jan-07
41,451
500
330
41,621
35,906
1,290
1,880
1,500
1,500
2,125
28-Jan-07
41,451
500
330
41,621
35,582
1,290
1,880
1,500
1,500
2,449
4-Feb-07
41,617
450
330
41,737
35,260
1,290
1,825
1,500
1,500
2,942
11-Feb-07
41,617
450
330
41,737
34,548
1,290
1,825
1,500
1,500
3,654
18-Feb-07
41,617
450
330
41,737
33,853
1,290
1,825
1,500
1,500
4,349
25-Feb-07
41,617
450
330
41,737
33,328
1,290
1,825
1,500
1,500
4,874
4-Mar-07
41,577
200
330
41,447
32,993
1,290
4,987
1,500
1,500
1,757
11-Mar-07
41,577
200
330
41,447
31,901
1,290
5,187
1,500
1,500
2,649
18-Mar-07
41,577
200
330
41,447
30,671
1,290
3,640
1,500
1,500
5,426
25-Mar-07
41,577
200
330
41,447
29,649
1,290
3,840
1,500
1,500
6,248
Notes
1) Includes HQ capacity, available capacity from Churchill Falls at the Newfoundland-Québec border
and independant power producers (IPP).
2) Firm purchase from New Brunswick and short term firm purchases by HQD
3) Sales to NE. Does not include firm sale of 145 MW to Cornwall. (154 MW with losses).
4) Expected weekly internal peak load plus 154 MW for Cornwall load including losses.
5) Includes 250 MW of load management through voltage reduction.
NPCC Reliability Assessment Winter 2006-2007 Final Report
Page 41 of 55
Docket No. ER11-1844
Exhibit No. NYI-24
Page 42 of 55
Appendix II - Summary of Normal and Expected Feasible Transfer Capability Under Peak Conditions
The following figure and table is intended to show Normal Transfer Capability between Areas which represents transfers capability
under ideal system conditions. It is recognized that the actual transfer conditions may differ depending on system conditions or
configurations such as actual voltage profiles etc.. The Feasible Transfer Capability values represent an expected transfer capability
under the peak load scenarios with the assumed Transmission configuration identified in Section 6 of this report. This Feasible
Transfer Capability is based on historical operating experience and the total for each area represents the simultaneous transfer between
areas that may be achievable. It should be noted that real-time transfer limits may change depending on the operation of the system at
the time and readers are encouraged to review information on the Available Transfer Capability (ATC) and Total Transfer Capabilities
Diagram 1
NPCC Reliability Assessment Winter 2006-2007 Final Report
Page 42 of 55
Docket No. ER11-1844
Exhibit No. NYI-24
Page 43 of 55
Transfers from Maritimes to
Interconnection
Normal Transfer
Feasible Transfer
Rationale for Constraint
Point
Capability (NTC) at
Capability (FTC)
Interconnection Points
under Peak Conditions
(MW)
(MW)
Québec
NB / MTP - MDW
785
785
Lines 2101, 2102
(HQ), lines 3008,
3010 (NB)
Lines 3012, 3113,
3114 (NB)
Total
785
785
New England
NB / BHE
700
700
Total
700
700
NPCC Reliability Assessment Winter 2006-2007 Final Report
Page 43 of 55
Docket No. ER11-1844
Exhibit No. NYI-24
Page 44 of 55
Transfers from New England to
Interconnection
NTC at
FTC under Peak
Rationale for Constraint
Point
Interconnection
Conditions (MW)
Points (MW)
Maritimes
BHE / NB
300
250
Transfer capability is dependent upon operating conditions in northern Maine.
Total
300
250
New York
VT / D
0
WMA / F
800
CT / G
800
NOR / K
286
Sub Total
1886
1,200
Feasible Simultaneous Transfer to New York excluding Cross Sound Cable. This is assumed to be the TTC as of
Nov. 17 2006. ISO-NE planning assumptions are based on an interface limit of 900 MW, as reported in the 2006
Regional System Plan.
CT (CSC) / K
330
330
The Cross Sound Cable is a DC tie and is not included in the Feasible Simultaneous Transfer capability with NY.
Total
2,216
1,805
Québec
CMA / NIC-DEC
1,700
0
Phase 2 is required for internal Québec transmission needs at the time of peak and Phase I cannot be used due to
HVDC link
transmission limitations within New England during peak load conditions. Capability of the facility is 2,000 MW;
conditions in HQ limit the capability to 1,700 MW; conditions in NE, NY & PJM may limit to 1,200 MW or less.
Highgate (VT) -
170
0
Capability of the facility is 220 MW; conditions in Vermont limit the capability to 100 MW or less. The DOE
Bedford (BDF)
permit is 170 MW. When the delivery from Québec to NE at Highgate is zero, it is expected that the delivery to
Line 1429
Québec from NE will be zero due to transmission limitations in New England
Derby (VT) -
0
0
There is no capability to export to Québec through this interconnection.
Stanstead (STS)
Line 1400
Total
1,870
0
The New England to Québec transfer limit at peak load is assumed to be 0 MW. It should be noted that this limit
is dependant on New England generation and could be increased up to approximately 350 MW depending on
New England dispatch. If energy was needed in Québec and the generation could be secured in the Real-Time
market, this action could be taken to increase the transfer limit.
NPCC Reliability Assessment Winter 2006-2007 Final Report
Page 44 of 55
Docket No. ER11-1844
Exhibit No. NYI-24
Page 45 of 55
Transfers from New York to
Interconnection
NTC at
FTC under Peak
Rationale for Constraint
Point
Interconnection
Conditions (MW)
Points (MW)
New England
D / VT
150
F / WMA
800
K / CT
800
K / NOR
286
Sub Total
2,036
1,400
Feasible Simultaneous Transfer to New England excluding Cross Sound Cable. This is assumed to be the same as
the TTC as of Nov. 17 2006. ISO-NE planning assumptions are based on an interface limit of 1,600 MW, as
reported in the 2006 Regional System Plan.
K / CT (CSC)
330
330
The Cross Sound Cable is a DC tie and is not included in the Feasible Simultaneous Transfer capability with NY.
Total
2,366
1,805
Ontario
D / East
400
400
Lines L33P, L34P
A / Niagara
1,250
1,250
New York limitation.
Lines PA301, PA302,
BP76, PA27
Total
1,650
1,650
Simultaneous Transfers between NY and Ontario may be impacted by loop flows and assume phase shifting
capability of MECS interface is not available
PJM
A / PJM
550
C / PJM
1,100
G / PJM
2,000
J / PJM
0
Total
3,650
2,300
Feasible Simultaneous Transfer to PJM on peak
Québec
D / Chat L7040
1,000
1,000
D / CRT
0
0
Emergency use of the Variable Frequency Transformer (VFT) has the potential of increasing transfer to Québec
Lines CD11, CD22
by 100 MW.
Total
1,000
1,000
NPCC Reliability Assessment Winter 2006-2007 Final Report
Page 45 of 55
Docket No. ER11-1844
Exhibit No. NYI-24
Page 46 of 55
Transfers from Ontario to
Interconnection
NTC at
FTC under Peak
Rationale for Constraint
Point
Interconnection
Conditions (MW)
Points (MW)
New York
East / D
400
400
Lines L33P, L34P
Niagara / A
2,000
1,600
Limits based on New York limitations.
Lines PA301, PA302,
BP76, PA27
Total
2,400
2,000
Simultaneous Transfers between NY and Ontario may be impacted by loop flows and assume phase shifting
capability of MECS interface is not available.
MISO Michigan
Lines L4D, L51D,
2,350
2,350
Represents a worst case scenario for the implementation of Policy of operation.
J5D
Total
2,350
2,350
Simultaneous Transfers between Michigan and Ontario may be impacted by loop flows, assume phase shifting
capability of MECS interface is not available, and the generation dispatch on the 120 kV system in the MISO -
Bunce Creek area.
Québec
NE / RPD - KPW
110
110
Lines D4Z, H4Z
Ottawa / BRY - PGN
140
52
Circuit Q4C is capable of 140 MW less 1/2 of Chat-Falls units that are considered in Québec Installed Capacity
Lines X2Y, P33C
(140-88=52)
Ottawa / Brascan
115
115
Only One of H9A or D5A can be in services at any time. The transfer capability reflects the usage of D5A.
Lines D5A, H9A
East / Beau
470
470
Lines B5D, B31L
Total
835
747
MISO
NW / MAN
350
Lines K21W, K22W
NW / MIN
140
Line F3M
Total
490
375
Feasible Simultaneous Transfer to MISO NW.
NPCC Reliability Assessment Winter 2006-2007 Final Report
Page 46 of 55
Docket No. ER11-1844
Exhibit No. NYI-24
Page 47 of 55
Transfers from Québec to
Interconnection
NTC at
FTC under Peak
Rationale for Constraint
Point
Interconnection
Conditions (MW)
Points (MW)
Maritimes
MTP-MDW / NB
1,200
900
Capability is reduced because of the outage of one 315/230 transformer at Matapedia..
Lines 2101, 2102
(HQ), lines 3008,
3010 (NB)
Lines 3012, 3113,
3114 (NB)
Total
1,200
900
New England
NIC-DEC / CMA
2,000
1,100
Capability of the facility is 2,000 MW; actual conditions in NE, NY, PJM may lower this value. Limitations on
HVDC link
the Quebec system under peak load conditions will limit this facility to 1,100 MW.
Bedford (BDF) -
220
200
Limitations on the Quebec system under peak load conditions.
Highgate (VT)
Line 1429
Stanstead (STS) -
80
80
Derby (VT)
Line 1400
Total
2,300
1,380
New York
Chateauguay - D
1,500
615
Limitations on the Quebec System under peak load conditions
Line 7040
CRT - D
325
180
Transfer limit is 325 MW less projected peak Cornwall load of 145 MW tapped off the circuit
Lines CD11, CD22
Total
1,825
795
Ontario
RPD-KPW / NE
85
85
Lines D4Z, H4Z
BRY-PGN / Ottawa
410
232
Limitations on the Quebec System under peak load conditions restrict deliveries as follows P33C - 167 MW and
Lines X2Y, P33C
X2Y - 65 MW,
NPCC Reliability Assessment Winter 2006-2007 Final Report
Page 47 of 55
Docket No. ER11-1844
Exhibit No. NYI-24
Page 48 of 55
Brascan - Ottawa
200
200
Only One of H9A or D5A can be in services at any time. The transfer capability reflects usage of D5A
Lines D5A, H9A
Beau / East
800
400
Limitations on the Quebec System under peak load conditions.
Lines B31L, B5D
Total
1,495
917
Note: Limitations on the Québec system under peak load conditions may be due to resource limitations as opposed to transmission limitations, so
that the Feasible Transfer Capability does not necessarily correspond to the TTC’s published elsewhere.
NPCC Reliability Assessment Winter 2006-2007 Final Report
Page 48 of 55
Docket No. ER11-1844
Exhibit No. NYI-24
Page 49 of 55
Transfers from Regions External to NPCC
Interconnection
NTC at
FTC under Peak
Rationale for Constraint
Point
Interconnection
Conditions (MW)
Points (MW)
MISO / ONT
1,720
1,720
Represents a worst case scenario for the implementation of Policy on operation.
Lines L4D, L51D,
J5D, B3N
Total
1,7200
1,720
Simultaneous Transfers between Michigan and Ontario may be impacted by loop flows and assumes phase
shifting capability of MECS interface is not available.
MISO / ONT
NW / MAN
300
Lines K21W, K22W
NW / MIN
90
Line F3M
Total
390
325
Feasible Simultaneous Transfer to Ontario.
PJM / New York
A
150
C
400
G
1,100
J
1,000
Total
2,650
2,075
Feasible Simultaneous Transfer to New York.
NPCC Reliability Assessment Winter 2006-2007 Final Report
Page 49 of 55
Docket No. ER11-1844
Exhibit No. NYI-24
Page 50 of 55
Area Acronym Description
Maritimes Area
Ontario
NB
-
New Brunswick
NW
-
North West Sub-Area
West
-
Western Sub-Area
New England Area
Niagara
-
Niagara
BHE
-
Bangor-Hydro Electric
NE
-
North-East Sub-Area
CMA
-
Central Massachusetts
Ottawa
-
Ottawa
VT
-
Vermont
East
-
East
WMA
-
Western Massachusetts
CT
-
Connecticut
Quebec
NOR
-
Norwalk
Brascan
-
Brascan
RPD-KPW
-
Rapide-des-Iles/ Kipawa
New York Area
BRY-PGN
-
Bryson - Paugan
The New York Area is divided into 11 zones (A - K)
that are defined based on the transmission system
CHAT
-
Chateauguay
topology.
Cedar Rapids
CRT
-
Transmission
BDF-STS
-
Bedford/ Stanstead
BEAU
-
Beauharnois
NIC-Dec
-
Nicolet /Des Cantons
MTP-MDW
-
Matapedia-Madawaska
NPCC Reliability Assessment Winter 2006-2007 Final Report
Page 50 of 55
Docket No. ER11-1844
Exhibit No. NYI-24
Page 51 of 55
Appendix III - NPCC Operational Criteria and Procedures
A-2 Basic Criteria for Design and Operation of Interconnected Power Systems
Description: This Criterion establishes the basic principles and requirements for the
design and the operation of the NPCC bulk power system.
A-3 Emergency Operation Criteria
Description: Objectives, principles and requirements are presented to assist the NPCC
Areas in formulating plans and procedures to be followed in an emergency or during
conditions which could lead to an emergency.
A-6 Operating Reserve Criteria
Description: This Criterion establishes standard terminology and minimum
requirements governing the amount, availability and distribution of operating reserve.
Procedures are included for corrective action and mutual assistance in case of operating
reserve shortages. The objective is to ensure a high level of reliability in the NPCC
Region that is, as a minimum, consistent with the standards specified by the North
American Electric Reliability Council (NERC).
B-3 Guidelines for Inter-Area Voltage Control
Description: This document establishes procedures and principles to be considered for
occasions where a deficiency or an excess of reactive power can affect bulk power
system voltage levels in a large portion of an Area or in two adjacent Areas.
B-12 Guidelines for On-Line Computer System Performance During Disturbances
Description: Establishes guidelines for the performance of NPCC Area on-line
computer systems during a power system disturbance.
B-13 Guide for Reporting System Disturbances
Description: Establishes TFCO’s requirement and guideline for reporting system
disturbances. Reporting by operating entity is to NPCC and TFCO.
B-20 Guidelines for Identifying Key Facilities and Their Critical Components for
System Restoration”
Description: Establishes requirements and guidelines for the identification of Key
Facilities and their Critical Components that are required for restoration of the power
system following a partial or total system blackout.
C-1
NPCC Emergency Preparedness Conference Call Procedures-NPCC Security
Conference Call Procedures
NPCC Reliability Assessment Winter 2006-2007
Page 51 of 55
Docket No. ER11-1844
Exhibit No. NYI-24
Page 52 of 55
C-4 Monitoring Procedures for Guidelines for Inter-Area Voltage Control
Description: This procedural document establishes TFCO's monitoring and reporting
requirements for conformance with NPCC's Guidelines for Inter-AREA Voltage Control
(Document B-3).
C-5 Monitoring Procedures for Emergency Operation Criteria
Description: This procedural document establishes TFCO's monitoring and reporting
requirements for conformance with NPCC's Emergency Operation Criteria (Document A-
3).
C-7 Monitoring Procedures for Guide for Rating Generating Capability
Description: This procedural document establishes the TFCO's monitoring and
reporting requirements for conformance with the NPCC, Guide for Rating Generating
Capability (Document B-9).
C-8 Monitoring Procedures for Control Performance Guide During Normal
Conditions
Description: This procedural document establishes a performance measure for NPCC
Areas and systems and outlines the reporting function for NPCC Control Performance
Guide During Normal Conditions (Document B-2)
C-9 Monitoring Procedures for Operating Reserve Criteria
Description: This procedural document establishes the TFCO's monitoring and
reporting requirements for conformance with the NPCC Operating Reserve Criteria
(Document A-6)
C-11 Monitoring Procedures for Interconnected System Frequency Response (This
Document has recently been revised and will have a new designation as Reference
Document RD-10)
Description: This procedural document defines procedures for monitoring frequency
responses to large generation losses.
C-12 Procedures for Shared Activation of Ten Minute Reserve
Description: This procedural document outlines procedures to share the activation of
ten-minute reserve on an Area basis. The methods prescribed by the procedure are
intended to ensure that lost generation or energy purchases are quickly replaced by
several areas simultaneously loading generation in the few minutes immediately
following a loss.
NPCC Reliability Assessment Winter 2006-2007
Page 52 of 55
Docket No. ER11-1844
Exhibit No. NYI-24
Page 53 of 55
C-13 Operational Planning Coordination
Appendix D - NPCC Critical Facilities List
Description: This document coordinates the notification of planned facility outages
among the Areas. It also establishes formal procedures for Area communications in
advance of a period of likely capacity shortages as well as for weekly and emergency
NPCC conference call among the Areas.
C-15 Procedures for Solar Magnetic Disturbances on Electrical Power Systems
Description: This procedural document clarifies the reporting channels and information
available to the operator during solar alerts and suggests measures that may be taken to
mitigate the impact of a solar magnetic disturbance.
C-20 Procedures During Abnormal Operating Conditions
Description: This procedure is intended to complement the Emergency Operation
Criteria
(Document A-3) by providing specific instructions to the System Operator
during such conditions in an NPCC Area or Areas.
C-35 NPCC Inter-Area Power System Restoration Procedure
Description: This procedure provides guidance and training material to the system
operator to manage system restoration events that affect the NPCC and adjoining Areas.
C-36 Procedures for Communications During Emergencies
Description: This procedure outlines how communications be conducted for various
situations.
C-37 Operating Procedures for ACE diversity Interchange
Description: This procedure is intended to spell out how to utilize Area Control Error
Diversity Interchange among NPCC entities and PJM.
C-38 Procedure for Operating Reserve Assistance
Description: This procedure is intended to provide the structure for NPCC Areas to
assist each other in meeting 10-minute reserve.
NPCC Reliability Assessment Winter 2006-2007
Page 53 of 55
Docket No. ER11-1844
Exhibit No. NYI-24
Page 54 of 55
Appendix IV - Web Sites
Independent Electricity System Operator
ISO- New England
LEER Members
MAPP
Maritimes
Maritimes Electric Company Ltd.
New Brunswick System Operator
Nova Scotia Power
Northern Maine Independent System Administrator
Midwest Reliability Organization (MRO)
New York ISO
North East Power Coordinating Council
ReliabilityFirst Corporation
TransÉnergie
NPCC Reliability Assessment Winter 2006-2007
Page 54 of 55
Docket No. ER11-1844
Exhibit No. NYI-24
Page 55 of 55
Appendix V - References
NPCC 2006-2007 Winter Multi-Area Probabilistic Reliability Assessment - November
2006
NPCC Reliability Assessment for Winter 2005-2006 - November, 2005
NPCC Reliability Assessment for Summer 2006 - April 2006
2006-2007 Winter RFC-NPCC Interregional Transmission System Reliability
Assessment
NPCC Reliability Assessment Winter 2006-2007
Page 55 of 55
DOCKET NO. ER11-1844
EXHIBIT NO. NYI-25
Docket No. ER11-1844
Exhibit No. NYI-25
Page 1 of 3
Docket No. ER11-1844-000
IESO Data Request Responses to
NYISO Second Set of Data Requests
Page 2 of 4
Question NYISO/IESO 2-2:
MISO, in response to NYISO data requests NYISO/MISO 1-18 through NYISO/MISO 1-
21, and ITC, in response to NYISO data requests NYISO/ITC 1-30 through NYISO/ITC
1-33, each indicated that the MI/ON PARs will be operated to conform actual power
flows to scheduled power flows at the Ontario/Michigan interface without regard to the
number of MI/ON PARs that are in service. In light of MISO’s and ITC’s responses to
the identified Data Requests, please respond to the following questions:
a.
Explain whether the operation of the Hydro One PARs to conform actual power
flows to scheduled power flows at the Michigan-Ontario interface from 4/1/2003
to 8/31/2006 would have been an effective method of mitigating Lake Erie loop
flow.
b.
Explain whether the operation of the Hydro One PARs to conform actual power
flows to scheduled power flows at the Michigan-Ontario interface from 9/1/2006
to 2/15/2012 would have been an effective method of mitigating Lake Erie loop
flow.
c.
Explain whether the operation of the Hydro One PARs to conform actual power
flows to scheduled power flows at the Michigan-Ontario interface from 4/1/2003
to 8/31/2006 would have provided benefits to IESO’s transmission system and
customers.
d.
Explain whether the operation of the Hydro One PARs to conform actual power
flows to scheduled power flows at the Michigan-Ontario interface from 9/1/2006
to 2/15/2012 would have provided benefits to IESO’s transmission system and
customers.
e.
Explain whether the operation of the Hydro One PARs to conform actual power
flows to scheduled power flows at the Michigan-Ontario interface from 4/1/2003
to 8/31/2006 would have provided benefits to Hydro One’s transmission system
and customers.
f.
Explain whether the operation of the Hydro One PARs to conform actual power
flows to scheduled power flows at the Michigan-Ontario interface from 9/1/2006
to 2/15/2012 would have provided benefits to Hydro One’s transmission system
and customers.
g.
Explain whether the operation of the Hydro One PARs to conform actual power
flows to scheduled power flows at the Michigan-Ontario interface from 4/1/2003
to 8/31/2006 would have provided benefits to MISO’s transmission system and
customers.
h.
Explain whether the operation of the Hydro One PARs to conform actual power
flows to scheduled power flows at the Michigan-Ontario interface from 9/1/2006
to 2/15/2012 would have provided benefits to MISO’s transmission system and
customers.
Docket No. ER11-1844
Exhibit No. NYI-25
Page 2 of 3
Docket No. ER11-1844-000
IESO Data Request Responses to
NYISO Second Set of Data Requests
Page 3 of 4
i.
Explain whether the operation of the Hydro One PARs to conform actual power
flows to scheduled power flows at the Michigan-Ontario interface from 4/1/2003
to 8/31/2006 would have provided benefits to ITC’s transmission system and
customers.
j.
Explain whether the operation of the Hydro One PARs to conform actual power
flows to scheduled power flows at the Michigan-Ontario interface from 9/1/2006
to 2/15/2012 would have provided benefits to ITC’s transmission system and
customers.
k.
Explain why Hydro One and IESO have not regularly operated the Hydro One
PARs to conform actual power flows to scheduled power flows at the Michigan-
Ontario interface from the date when the Original PAR failed (shortly prior to
4/1/2003) to the date when the Bunce Creek/Scott transmission line was restored
to service (approximately 8/31/2006).
l.
Explain why Hydro One and IESO have not regularly operated the Hydro One
PARs to conform actual power flows to scheduled power flows at the Michigan-
Ontario interface from the date when the Bunce Creek/Scott transmission line
was restored to service (approximately 8/31/2006) to the present (approximately
2/15/2012).
m. Explain why Hydro One and IESO are not regularly operating the Hydro One
PARs to conform actual power flows to scheduled power flows at the Michigan-
Ontario interface today.
IESO Response:
Due to the similar nature of the data requested we have grouped our responses as
follows:
Parts (a) and (b)
We believe that operating the Hydro One PARs during this period would have had
some effect in mitigating loop flows, however their effectiveness would be reduced
from having all four PARs in service. It is important to note that, without an operating
agreement in place between the IESO/MISO the IESO was unable to operate the
PARs in regulate mode during this period.
Parts (c) and (d)
We suspect that there would likely have been occasions during these periods when
greater control of circulation would have provided benefits to IESO’s transmission
system and customers though no formal assessment of that has been undertaken.
Parts (e), (f), (g), (h), (i) and (j)
This information is not within the IESO’s knowledge or control.
Docket No. ER11-1844
Exhibit No. NYI-25
Page 3 of 3
Docket No. ER11-1844-000
IESO Data Request Responses to
NYISO Second Set of Data Requests
Page 4 of 4
Parts (k), (l) and (m)
The IESO did not have an operating agreement with MISO until August 8, 2011
which was predicated on ITC turning over operational control of the B3N PARs to
MISO. This component was only formalized as part of the Presidential Permit
received on February 24, 2012 and will now form the basis for operations across the
interface.
Response Provided by: Nicholas Ingman, Manager, Operational Excellence
DOCKET NO. ER11-1844
EXHIBIT NO. NYI-26
Docket No. ER11-1844
Exhibit No. NYI-26
Page 1 of 1
Pike, Robert
From:
Deborah Klueber [DKlueber@misoenergy.org]
Sent:
Monday, March 26, 2012 4:09 PM
To:
AC Advisory Committee Exploder (adv_committee@lists.midwestiso.org); RSC Reliability
Subcommittee (rscommittee@lists.midwestiso.org); MSC Market Subcommittee
(marketsc@lists.midwestiso.org); PAC Planning Advisory Committee
(planningac@lists.midwestiso.org)
Subject:
[MISO] Michigan-Ontario Interface Phase Angle Regulators
Dear Stakeholders,
As discussed at the March 6th Market Subcommittee (MSC) and the March 20th Reliability
Subcommittee (RSC), ITC took receipt of an amended Presidential Permit from the U.S. Department
of Energy on February 24, 2012. The amended permit completes regulatory authorization allowing
energizing, testing and operating the Phase Angle Regulator (“PAR”) at Bunce Creek (B3N). ITC has
started the process of energizing and testing the B3N PAR, which is currently scheduled to be
completed by EOD April 4, 2012.
MISO, IESO, ITC and Hydro One have formally set 1000 hours EDT Thursday, April 5, 2012 as the
target for starting coordinated operation of PARs on the Michigan-Ontario interface.
The Hydro One L4D PAR at Lambton is not expected to be available by April 5th, 2012. As a result,
MISO does not intend to change the methodology for pricing transactions scheduled across the
Michigan-Ontario interface as originally planned. The existing pricing methodology will remain in
place until further notice.
Please direct questions to Kevin Frankeny (kfrankeny@misoenergy.org).
Thank you.
1
DOCKET NO. ER11-1844
EXHIBIT NO. NYI-27
Docket No. ER11-1844
Exhibit No. NYI-27
Page 1 of 1
NYISO/ITC 5-4. Please explain why ITC decided to select a different manufacturer
for the Replacement PARs from the one that supplied the Original
PAR (i.e., ABB), and provide all Documents and Communications
Related To that decision.
Response to NYISO/ITC 5-4: ABB was chosen to manufacture the Original PAR by
DTE who owned the system at the time when the Original PAR was installed. ITC does
not use ABB as the preferred supplier for transformers. Therefore, when the New PARs
were constructed under the ownership of ITC, a different manufacturer was used.
To the extent they exist, all Documents and Communications related to that decision have
already been provided.
Response prepared by: Tim Greenen
5
DOCKET NO. ER11-1844
EXHIBIT NO. NYI-28
REDACTED
PROTECTED MATERIAL
DOCKET NO. ER11-1844
EXHIBIT NO. NYI-29
REDACTED
PROTECTED MATERIAL
DOCKET NO. ER11-1844
EXHIBIT NO. NYI-30
Docket No. ER11-1844
Exhibit No. NYI-30
Page 1 of 1
Simplified Example
MI/ON PARs - Free Flowing
Assume:
1.450 MW of LE loop flow across the MI/ON Interface
2.The MI/ON PARs are not being operated to match flow to
schedule at the MI/ON Interface
3.Positive (+) LE loop flow is in the clockwise direction
DOCKET NO. ER11-1844
EXHIBIT NO. NYI-31
Docket No. ER11-1844
Exhibit No. NYI-31
Page 1 of 1
Simplified Example
All MI/ON PARs Operating to Match Flow to Schedule
Assume:
1.450 MW of potential LE loop flow across the MI/ON Interface
2.All four MI/ON PARs are operating to perfectly* match flow to schedule
3.Positive (+) LE loop flow is in the clockwise direction
*Each PAR tap move affects
a significant quantity of
MWs (50+MW). Spot‐on
control of a line or of the
MI/ON Interface is unlikely
in practice. MISO and IESO
operate to a +/‐200MW
Control Band for the MI/ON
Interface.
DOCKET NO. ER11-1844
EXHIBIT NO. NYI-32
Docket No. ER11-1844
Exhibit No. NYI-32
Page 1 of 1
Simplified Example
Three MI/ON PARs Operating—Scenario 1
Assume:
1.450 MW of potential LE loop flow across the MI/ON Interface
2.Three MI/ON PARs perfectly matching individual line flows to schedule,
L4D PAR out‐of‐service/bypassed
3.Positive (+) LE loop flow is in the clockwise direction
50MW of LE loop flow could
be controlled with 3 out of 4
PARs controlling without
actively generating counter
flow to further reduce LE loop
flow
DOCKET NO. ER11-1844
EXHIBIT NO. NYI-33
Docket No. ER11-1844
Exhibit No. NYI-33
Page 1 of 1
Simplified Example
Three MI/ON PARs Operating—Scenario 2
Assume:
1.450 MW of potential LE loop flow across the MI/ON Interface
2.Three MI/ON PARs operated to attempt to match MI/ON Interface flow to
schedule, L4D PAR out‐of‐service/bypassed
3.Positive (+) LE loop flow is in the clockwise direction
Reduce LE loop
flow by 200MW by
introducing
950MW of counter
flow on the
operational MI/ON
PARs
Throughout the process of increasing counter flow, the loading on L4D transmission line will increase to the point where it will be
over its thermal rating (1200MW), limiting further PAR movement. It is reasonable to assume that limits on controlling loop flow
with one PAR out of service will be a result of network contingency constraints rather than PAR equipment ratings or PAR tap
range restrictions.
DOCKET NO. ER11-1844
EXHIBIT NO. NYI-34
Docket No. ER11-1844
Exhibit No. NYI-34
Page 1 of 4
NYISO/MISO 1-18. If one of the Replacement PARs is unavailable, will MISO/ITC and
IESO/Hydro One still operate the remaining four MI/ON PARs to better conform actual
power flows to scheduled power flows at the MISO/IESO interface?
a. If the four remaining MI/ON PARs will not be operated to better conform actual
power flows to scheduled power flows at the MISO/IESO interface, how will
MISO/ITC and IESO/Hydro One operate the four remaining MI/ON PARs in this
situation?
b. If the four remaining MI/ON PARs will be operated to better conform actual
power flows to scheduled power flows at the MISO/IESO interface, how effective
does MISO expect the four remaining PARs will be at conforming actual power
flows to scheduled power flows?
Response:See response to NYISO/MISO 1-19.
Sponsor:
KevinFrankeny
Docket No. ER11-1844
Exhibit No. NYI-34
Page 2 of 4
NYISO/MISO 1-19. If both of the Replacement PARs are unavailable, will MISO/ITC and
IESO/Hydro One still operate the three remaining MI/ON PARs to better conform actual power
flows to scheduled power flows at the MISO/IESO interface?
a. If the three remaining MI/ON PARs will not be operated to better conform actual
power flows to scheduled power flows at the MISO/IESO interface, how will
MISO/ITC and IESO/Hydro One operate the three remaining MI/ON PARs in
this situation?
b. If the three remaining MI/ON PARs will be operated to better conform actual power
flows to scheduled power flows at the MISO/IESO interface, how effective does
MISO expect the three remaining MI/ON PARs will be at conforming actual
power flows to scheduled power flows?
Response:Yes. Operating agreements related to the MI/ON PARs require conforming actual
power flows to scheduled power flows to the maximum extent practical. Unavailability of one or
more of the MI/ON PARs is one of many operational factors that may affect the overall ability of
the MI/ON PARs to conform actual power flows to scheduled power flows.
a. There have been no equipment and/or system conditions identified that would make
conforming actual power flows to scheduled power flows impractical (e.g.. overall
control ability reduced to near zero), and operating agreements do not specifically
address this condition.
b. While MISO expects the effectiveness of the MI/ON PARs will vary as equipment status
and/or system conditions change, there have been no studies performed that quantify the
effectiveness of the MI/ON PARs for any sub-optimal condition (e.g., all PARs and
Transmission elements in service).
Sponsored by:
KevinFrankeny
Docket No. ER11-1844
Exhibit No. NYI-34
Page 3 of 4
NYISO/MISO 1-20. If one of the three Hydro One PARs is unavailable, will MISO/ITC and
IESO/Hydro One still operate the four remaining MI/ON PARs to better conform actual power
flows to scheduled power flows at the MISO/IESO interface?
a. If the four remaining MI/ON PARs will not be operated to better conform actual
power flows to scheduled power flows at the MISO/IESO interface, how will
MISO/ITC and IESO/Hydro One operate the four remaining MI/ON PARs in this
situation?
b. If the four remaining MI/ON PARs will be operated to better conform actual
power flows to scheduled power flows at the MISO/IESO interface, how effective
does MISO expect the four remaining MI/ON PARs will be at conforming actual
power flows to scheduled power flows?
Response:See response to NYISO/MISO 1-19.
Sponsored by:
Kevin Frankeny
Docket No. ER11-1844
Exhibit No. NYI-34
Page 4 of 4
NYISO/MISO 1-21. If more than one of the three Hydro One PARs are unavailable, will
MISO/ITC and IESO/Hydro One still operate the remaining MI/ON PARs to better
conform actual power flows to scheduled power flows at the MISO/IESO interface?
a. If the remaining MI/ON PARs will not be operated to better conform actual
power flows to scheduled power flows at the MISO/IESO interface, how will
MISO/ITC and IESO/Hydro One operate the remaining MI/ON PARs in this
situation?
b. If the remaining MI/ON PARs will be operated to better conform actual power
flows to scheduled power flows at the MISO/IESO interface, how effective does
MISO believe the remaining MI/ON PARs will be at conforming actual power
flows to scheduled power flows?
Response:See Response to NYISO/MISO 1-19.
Sponsor:
KevinFrankeny
DOCKET NO. ER11-1844
EXHIBIT NO. NYI-35
Docket No. ER11-1844
Exhibit No. NYI-35
Page 1 of 2
NYISO/MISO 3-1. Please consider MISO’s responses to NYISO/MISO
1-18 through
NYISO/MISO 1-21, and respond to the questions below.
On pages 26 and 31 of Mr. Chatterjee’s Direct Testimony he states that the MI/ON PARs
will “fully mitigate Lake Erie loop flow approximately 74% of the time and will mitigate
it by approximately 600 MW the remainder of the year.” The NYISO would like to
understand the impact of MI/ON PAR outages at the Ontario/Michigan interface on this
assertion. For purposes of the questions below, please assume that all MI/ON PARs are in
service and available, except for the PARs that are specifically identified as being out-of-
service. Where there are multiple PARs to choose from (for example, where the question
states that two of the three Hydro One PARs are out-of-service), Recipient should
identify the PARs it is assuming to be out-of-service and respond to the question on that
basis.
a.
Does Recipient agree that the degree (in MW) to which the MI/ON PARs are
capable of mitigating Lake Erie loop flow will depends on the number and
location of the MI/ON PARs that are in service? If not, explain why not.
b.
If one of the Replacement PARs is out-of-service, how frequently (in percentage
terms) does Recipient expect the MI/ON PARs will fully mitigate Lake Erie loop
flow?
c.
If one of the Replacement PARs is out-of-service, to what degree (in MW) does
Recipient expect the MI/ON PARs to reduce Lake Erie loop flow at times when
they are not able to fully mitigate such loop flow?
d.
If both of the Replacement PARs are out-of-service, how frequently (in
percentage terms) does Recipient expect the MI/ON PARs will fully mitigate
Lake Erie loop flow?
e.
If both of the Replacement PARs are out-of-service, to what degree (in MW) does
Recipient expect the MI/ON PARs to reduce Lake Erie loop flow at times when
they are not able to fully mitigate such loop flow?
f.
If one of the Hydro One PARs is out-of-service, how frequently (in percentage
terms) does Recipient expect the MI/ON PARs will fully mitigate Lake Erie loop
flow?
g.
If one of the Hydro One PARs is out-of-service, to what degree (in MW) does
Recipient expect the MI/ON PARs to reduce Lake Erie loop flow at times when
they are not able to fully mitigate such loop flow?
h.
If two of the Hydro One PARs are out-of-service, how frequently (in percentage
terms) does Recipient expect the MI/ON PARs will fully mitigate Lake Erie loop
flow?
Docket No. ER11-1844
Exhibit No. NYI-35
Page 2 of 2
i.
If two of the Hydro One PARs are out-of-service, to what degree (in MW) does
Recipient expect the MI/ON PARs to reduce Lake Erie loop flow at times when
they are not able to fully mitigate such loop flow?
j.
If Recipient is unable to respond to any of the questions included in
NYISO/MISO 3-1, for each question that Recipient is unable to respond to, please
explain why Recipient is unable to respond and explain what would be required in
order for Recipient to be able to respond.
k. Provide all Documents that were used to develop or support Recipient’s responses
to NYISO/MISO 3-1 (including all sub-parts).
Response: MISO maintains its prior objections to NYISO/MISO 3-1 on the grounds previously
stated and because MISO has already responded to the requests, which have already been asked,
albeit more succinctly, in NYISO/MISO 1-19. Notwithstanding these objections and by way of
further answer, MISO agrees that the effectiveness of the MI/ON PARs will vary as equipment
status and/or system conditions change but MISO is unable to respond to the various
hypothetical scenarios posed in NYISO/MISO 3-1as MISO has already stated in response to
NYISO/MISO 1-19 (i.e., there have been no studies performed that quantify the effectiveness of
the MI/ON PARs for any sub-optimal condition). See response to NYISO/MISO 1-19 for
responses to NYISO/MISO 3-1 (a) - (k).
Supplemental Response: For NYISO/MISO 3-1 (f)(g) MISO sustains its objections and refers
to its prior responses to NYISO/MISO 3-1. However, Kevin Frankeny further explains that,
based upon his professional judgment and experience, MISO believes that with the Hydro One
L4D PAR out of service, overall capacity to reduce loop flows will decline so MISO would
expect the MI/ON PARs to fully mitigate loop flows 40-50% of the time. However, the MI/ON
PARs will still be able to mitigate Lake Erie loop flow by approximately 300-350 MW.
Sponsored by:
Counsel and Kevin Frankeny
DOCKET NO. ER11-1844
EXHIBIT NO. NYI-36
Docket No. ER11-1844
Exhibit No. NYI-36
Page 1 of 16
Difference Between Scheduled
and Actual Power Flows,
measured at the NYISO IESO
Time
Border
4/5/12 0:00
519.7836914
Percent of Hours within Bandwidth
56.6%
4/5/12 1:00
90.42636108
Percent of Hours that MI/ON Interface flow
2.96%
4/5/12 2:00
285.6725464
is within ±10 MW of MI/ON Interface
4/5/12 3:00
240.4515381
schedule
4/5/12 4:00
151.8051758
4/5/12 5:00
-16.52056885
4/5/12 6:00
-235.7324829
4/5/12 7:00
167.118042
4/5/12 8:00
151.3554077
4/5/12 9:00
247.026001
4/5/12 10:00
-113.3775024
4/5/12 11:00
49.50775146
4/5/12 12:00
221.8931885
4/5/12 13:00
336.7866211
4/5/12 14:00
97.00646973
4/5/12 15:00
125.0534668
4/5/12 16:00
-14.35137939
4/5/12 17:00
177.5014648
4/5/12 18:00
241.2165527
4/5/12 19:00
12.00231934
4/5/12 20:00
186.9154053
4/5/12 21:00
777.0767822
4/5/12 22:00
434.5740967
4/5/12 23:00
-223.8074951
4/6/12 0:00
-582.1624756
4/6/12 1:00
-140.1992188
4/6/12 2:00
-57.63934326
4/6/12 3:00
82.58709717
4/6/12 4:00
0.959228516
4/6/12 5:00
11.63232422
4/6/12 6:00
-17.42431641
4/6/12 7:00
265.5340576
4/6/12 8:00
431.7463379
4/6/12 9:00
318.8789063
4/6/12 10:00
293.9780273
4/6/12 11:00
263.8701172
4/6/12 12:00
-0.610351563
4/6/12 13:00
203.5817871
4/6/12 14:00
252.4589844
4/6/12 15:00
418.9614258
4/6/12 16:00
207.3728027
4/6/12 17:00
204.5977783
4/6/12 18:00
279.3048096
Docket No. ER11-1844
Exhibit No. NYI-36
Page 2 of 16
4/6/12 19:00
103.3198242
4/6/12 20:00
335.098877
4/6/12 21:00
328.9111328
4/6/12 22:00
425.6151123
4/6/12 23:00
74.32568359
4/7/12 0:00
-109.1774902
4/7/12 1:00
38.38183594
4/7/12 2:00
6.511901855
4/7/12 3:00
124.6118164
4/7/12 4:00
-26.69128418
4/7/12 5:00
86.68951416
4/7/12 6:00
108.6903076
4/7/12 7:00
264.8718262
4/7/12 8:00
467.1732178
4/7/12 9:00
340.4663086
4/7/12 10:00
599.8535156
4/7/12 11:00
517.557373
4/7/12 12:00
360.5212402
4/7/12 13:00
179.0429688
4/7/12 14:00
160.9556885
4/7/12 15:00
112.1230469
4/7/12 16:00
154.0576172
4/7/12 17:00
140.8904419
4/7/12 18:00
-43.8125
4/7/12 19:00
-31.65966797
4/7/12 20:00
489.652832
4/7/12 21:00
331.4287109
4/7/12 22:00
510.1717529
4/7/12 23:00
161.6162109
4/8/12 0:00
178.4547119
4/8/12 1:00
-9.758544922
4/8/12 2:00
-53.45910645
4/8/12 3:00
69.81591797
4/8/12 4:00
96.02514648
4/8/12 5:00
161.1608887
4/8/12 6:00
55.42480469
4/8/12 7:00
-4.115234375
4/8/12 8:00
409.9591064
4/8/12 9:00
327.7597656
4/8/12 10:00
436.1645508
4/8/12 11:00
180.0700684
4/8/12 12:00
142.2744141
4/8/12 13:00
-249.5599365
4/8/12 14:00
-247.2435303
4/8/12 15:00
-16.81994629
4/8/12 16:00
9.254943848
4/8/12 17:00
-165.552063
Docket No. ER11-1844
Exhibit No. NYI-36
Page 3 of 16
4/8/12 18:00
-90.45361328
4/8/12 19:00
-167.6184082
4/8/12 20:00
66.87683105
4/8/12 21:00
73.97705078
4/8/12 22:00
18.24572754
4/8/12 23:00
127.3005371
4/9/12 0:00
-139.8227539
4/9/12 1:00
-207.5923462
4/9/12 2:00
-246.8155518
4/9/12 3:00
-207.0609131
4/9/12 4:00
-390.015625
4/9/12 5:00
-39.94909668
4/9/12 6:00
-13.45983887
4/9/12 7:00
391.2185059
4/9/12 8:00
292.5102539
4/9/12 9:00
24.51672363
4/9/12 10:00
94.2253418
4/9/12 11:00
77.3614502
4/9/12 12:00
276.4885254
4/9/12 13:00
195.3647461
4/9/12 14:00
-3.617919922
4/9/12 15:00
-5.023193359
4/9/12 16:00
96.47607422
4/9/12 17:00
292.1813965
4/9/12 18:00
102.2976074
4/9/12 19:00
204.6379395
4/9/12 20:00
322.5043945
4/9/12 21:00
203.2366943
4/9/12 22:00
115.8656006
4/9/12 23:00
-262.4246826
4/10/12 0:00
-172.3164673
4/10/12 1:00
-127.8937988
4/10/12 2:00
-451.6188354
4/10/12 3:00
-393.185791
4/10/12 4:00
-321.9037476
4/10/12 5:00
-223.0695801
4/10/12 6:00
-19.96704102
4/10/12 7:00
155.8468018
4/10/12 8:00
529.3842773
4/10/12 9:00
630.8100586
4/10/12 10:00
355.1210938
4/10/12 11:00
36.8815918
4/10/12 12:00
63.28186035
4/10/12 13:00
211.4835205
4/10/12 14:00
363.2711182
4/10/12 15:00
306.4067383
4/10/12 16:00
260.4003906
Docket No. ER11-1844
Exhibit No. NYI-36
Page 4 of 16
4/10/12 17:00
146.3271484
4/10/12 18:00
310.588501
4/10/12 19:00
672.0206299
4/10/12 20:00
435.6181641
4/10/12 21:00
-19.01605225
4/10/12 22:00
316.6878662
4/10/12 23:00
172.5063477
4/11/12 0:00
-149.2025146
4/11/12 1:00
-212.5186768
4/11/12 2:00
-63.34844971
4/11/12 3:00
149.0308838
4/11/12 4:00
126.9100342
4/11/12 5:00
20.56066895
4/11/12 6:00
-368.8222656
4/11/12 7:00
346.5622559
4/11/12 8:00
164.1812744
4/11/12 9:00
301.4191895
4/11/12 10:00
287.4538574
4/11/12 11:00
310.6951904
4/11/12 12:00
330.5887451
4/11/12 13:00
384.0098877
4/11/12 14:00
464.9038086
4/11/12 15:00
414.7253418
4/11/12 16:00
168.8986816
4/11/12 17:00
444.7738037
4/11/12 18:00
602.7176514
4/11/12 19:00
667.5649414
4/11/12 20:00
649.4034424
4/11/12 21:00
370.0964355
4/11/12 22:00
317.2694092
4/11/12 23:00
474.3509521
4/12/12 0:00
369.8187256
4/12/12 1:00
-121.6680908
4/12/12 2:00
-155.6824951
4/12/12 3:00
5.552124023
4/12/12 4:00
39.34527588
4/12/12 5:00
76.16430664
4/12/12 6:00
282.3626709
4/12/12 7:00
599.7711182
4/12/12 8:00
199.8986816
4/12/12 9:00
604.2329102
4/12/12 10:00
531.628418
4/12/12 11:00
357.0574341
4/12/12 12:00
293.218811
4/12/12 13:00
220.6610718
4/12/12 14:00
197.4884033
4/12/12 15:00
199.5705566
Docket No. ER11-1844
Exhibit No. NYI-36
Page 5 of 16
4/12/12 16:00
269.4825439
4/12/12 17:00
191.4365234
4/12/12 18:00
64.88439941
4/12/12 19:00
-50.06652832
4/12/12 20:00
404.9152832
4/12/12 21:00
216.6630859
4/12/12 22:00
185.802002
4/12/12 23:00
265.9315186
4/13/12 0:00
260.5175781
4/13/12 1:00
268.0480957
4/13/12 2:00
147.4076538
4/13/12 3:00
244.3168945
4/13/12 4:00
178.7562256
4/13/12 5:00
486.9039307
4/13/12 6:00
573.0478516
4/13/12 7:00
341.140625
4/13/12 8:00
176.8798828
4/13/12 9:00
-17.68377686
4/13/12 10:00
37.71343994
4/13/12 11:00
286.6452637
4/13/12 12:00
125.4152832
4/13/12 13:00
160.5986938
4/13/12 14:00
130.2590332
4/13/12 15:00
107.2468262
4/13/12 16:00
217.0814209
4/13/12 17:00
372.5838623
4/13/12 18:00
339.7397461
4/13/12 19:00
201.5871582
4/13/12 20:00
54.39038086
4/13/12 21:00
334.6959229
4/13/12 22:00
471.6118164
4/13/12 23:00
557.8251953
4/14/12 0:00
67.56207275
4/14/12 1:00
211.1768799
4/14/12 2:00
297.9500732
4/14/12 3:00
308.1089478
4/14/12 4:00
317.5307617
4/14/12 5:00
282.1781616
4/14/12 6:00
52.65124512
4/14/12 7:00
84.35876465
4/14/12 8:00
326.7832031
4/14/12 9:00
176.0336914
4/14/12 10:00
394.2269287
4/14/12 11:00
3.463378906
4/14/12 12:00
-77.82702637
4/14/12 13:00
123.404541
4/14/12 14:00
202.6225586
Docket No. ER11-1844
Exhibit No. NYI-36
Page 6 of 16
4/14/12 15:00
-87.80340576
4/14/12 16:00
-48.78729248
4/14/12 17:00
66.20446777
4/14/12 18:00
-70.52661133
4/14/12 19:00
-159.0998535
4/14/12 20:00
30.16540527
4/14/12 21:00
-83.96923828
4/14/12 22:00
128.6334229
4/14/12 23:00
309.8033447
4/15/12 0:00
-40.21264648
4/15/12 1:00
-8.448852539
4/15/12 2:00
-69.77404785
4/15/12 3:00
-25.43927002
4/15/12 4:00
-56.8581543
4/15/12 5:00
-18.51464844
4/15/12 6:00
-119.3981323
4/15/12 7:00
-206.821991
4/15/12 8:00
-85.70361328
4/15/12 9:00
-260.3158569
4/15/12 10:00
-253.7092285
4/15/12 11:00
-25.91229248
4/15/12 12:00
80.55456543
4/15/12 13:00
22.94628906
4/15/12 14:00
72.81958008
4/15/12 15:00
190.9216309
4/15/12 16:00
59.1305542
4/15/12 17:00
43.91253662
4/15/12 18:00
98.06640625
4/15/12 19:00
-5.328857422
4/15/12 20:00
595.6398926
4/15/12 21:00
-81.55932617
4/15/12 22:00
68.34716797
4/15/12 23:00
92.75427246
4/16/12 0:00
-475.6491089
4/16/12 1:00
-359.6322632
4/16/12 2:00
-555.2411499
4/16/12 3:00
-579.5578003
4/16/12 4:00
-508.4633789
4/16/12 5:00
-623.1851807
4/16/12 6:00
-294.2467651
4/16/12 7:00
-459.4553833
4/16/12 8:00
23.53442383
4/16/12 9:00
226.1452637
4/16/12 10:00
225.2633057
4/16/12 11:00
414.3183594
4/16/12 12:00
404.4312744
4/16/12 13:00
376.140625
Docket No. ER11-1844
Exhibit No. NYI-36
Page 7 of 16
4/16/12 14:00
468.880249
4/16/12 15:00
335.4747314
4/16/12 16:00
267.4537354
4/16/12 17:00
363.0200195
4/16/12 18:00
198.1651001
4/16/12 19:00
266.2389526
4/16/12 20:00
286.1904297
4/16/12 21:00
171.4407959
4/16/12 22:00
-180.1567688
4/16/12 23:00
-585.3446045
4/17/12 0:00
-635.5088501
4/17/12 1:00
-243.0881348
4/17/12 2:00
-426.717041
4/17/12 3:00
-415.175415
4/17/12 4:00
-700.4644775
4/17/12 5:00
-427.3042908
4/17/12 6:00
-166.050293
4/17/12 7:00
-185.0869141
4/17/12 8:00
-76.42199707
4/17/12 9:00
-85.60192871
4/17/12 10:00
-55.05096436
4/17/12 11:00
-91.11376953
4/17/12 12:00
46.82275391
4/17/12 13:00
57.82421875
4/17/12 14:00
4.745239258
4/17/12 15:00
59.50500488
4/17/12 16:00
-15.86999512
4/17/12 17:00
-6.933837891
4/17/12 18:00
110.0002441
4/17/12 19:00
98.07128906
4/17/12 20:00
458.9755859
4/17/12 21:00
318.2631836
4/17/12 22:00
35.75415039
4/17/12 23:00
-260.1754761
4/18/12 0:00
-258.8221436
4/18/12 1:00
-350.8850403
4/18/12 2:00
-610.1663208
4/18/12 3:00
-516.1502686
4/18/12 4:00
-653.8570557
4/18/12 5:00
-798.3808594
4/18/12 6:00
-394.4767456
4/18/12 7:00
-356.6844482
4/18/12 8:00
-240.5355835
4/18/12 9:00
-360.4022217
4/18/12 10:00
-679.5739746
4/18/12 11:00
-321.0087891
4/18/12 12:00
-263.881897
Docket No. ER11-1844
Exhibit No. NYI-36
Page 8 of 16
4/18/12 13:00
-195.0345459
4/18/12 14:00
-86.9130249
4/18/12 15:00
38.50317383
4/18/12 16:00
-73.44799805
4/18/12 17:00
31.24267578
4/18/12 18:00
127.8552246
4/18/12 19:00
26.95043945
4/18/12 20:00
200.3482666
4/18/12 21:00
-293.5703125
4/18/12 22:00
264.0546875
4/18/12 23:00
67.39807129
4/19/12 0:00
17.2109375
4/19/12 1:00
-361.3962402
4/19/12 2:00
-662.1350708
4/19/12 3:00
-681.409668
4/19/12 4:00
-449.1828613
4/19/12 5:00
-752.8244629
4/19/12 6:00
-470.6343994
4/19/12 7:00
-147.1105957
4/19/12 8:00
-318.7940063
4/19/12 9:00
-417.4847412
4/19/12 10:00
-327.3395386
4/19/12 11:00
-465.8690796
4/19/12 12:00
-304.852417
4/19/12 13:00
-307.1873779
4/19/12 14:00
-190.1816406
4/19/12 15:00
-257.5883789
4/19/12 16:00
-275.7263184
4/19/12 17:00
-381.3718262
4/19/12 18:00
-364.3867188
4/19/12 19:00
-47.03735352
4/19/12 20:00
-68.51708984
4/19/12 21:00
35.57617188
4/19/12 22:00
-132.0300293
4/19/12 23:00
307.4000244
4/20/12 0:00
39.90893555
4/20/12 1:00
-130.1173096
4/20/12 2:00
-165.8537598
4/20/12 3:00
-80.12695313
4/20/12 4:00
26.7512207
4/20/12 5:00
-93.65380859
4/20/12 6:00
-104.8353271
4/20/12 7:00
308.0148926
4/20/12 8:00
42.35498047
4/20/12 9:00
-122.9775391
4/20/12 10:00
-150.2619629
4/20/12 11:00
-55.21594238
Docket No. ER11-1844
Exhibit No. NYI-36
Page 9 of 16
4/20/12 12:00
-61.94335938
4/20/12 13:00
-23.69140625
4/20/12 14:00
38.83935547
4/20/12 15:00
75.46166992
4/20/12 16:00
-42.65576172
4/20/12 17:00
-99.6887207
4/20/12 18:00
141.5754395
4/20/12 19:00
197.7020264
4/20/12 20:00
126.2631836
4/20/12 21:00
150.4512939
4/20/12 22:00
205.0377197
4/20/12 23:00
67.45654297
4/21/12 0:00
189.3649902
4/21/12 1:00
272.0140381
4/21/12 2:00
-64.4822998
4/21/12 3:00
-18.57519531
4/21/12 4:00
-235.8745117
4/21/12 5:00
0.89831543
4/21/12 6:00
37.18347168
4/21/12 7:00
77.5489502
4/21/12 8:00
93.02062988
4/21/12 9:00
-78.44189453
4/21/12 10:00
-83.52600098
4/21/12 11:00
83.86181641
4/21/12 12:00
156.1967773
4/21/12 13:00
187.7407227
4/21/12 14:00
200.857666
4/21/12 15:00
287.1884766
4/21/12 16:00
249.0706787
4/21/12 17:00
295.5871582
4/21/12 18:00
178.9819336
4/21/12 19:00
103.9797363
4/21/12 20:00
303.9858398
4/21/12 21:00
30.24694824
4/21/12 22:00
-180.501709
4/21/12 23:00
-51.55419922
4/22/12 0:00
-215.704834
4/22/12 1:00
-358.699585
4/22/12 2:00
-433.6878052
4/22/12 3:00
-347.0401611
4/22/12 4:00
-215.4257813
4/22/12 5:00
-142.1876221
4/22/12 6:00
-221.1276855
4/22/12 7:00
-2.209472656
4/22/12 8:00
112.3618164
4/22/12 9:00
124.8757324
4/22/12 10:00
-30.91821289
Docket No. ER11-1844
Exhibit No. NYI-36
Page 10 of 16
4/22/12 11:00
174.7520752
4/22/12 12:00
263.5549316
4/22/12 13:00
184.5413818
4/22/12 14:00
128.7779541
4/22/12 15:00
162.1774902
4/22/12 16:00
216.1379395
4/22/12 17:00
-21.98510742
4/22/12 18:00
57.17041016
4/22/12 19:00
-10.37939453
4/22/12 20:00
-43.26708984
4/22/12 21:00
-142.4680176
4/22/12 22:00
-243.3775635
4/22/12 23:00
-355.0552979
4/23/12 0:00
-47.46386719
4/23/12 1:00
-392.5994873
4/23/12 2:00
-478.8514404
4/23/12 3:00
-346.4300537
4/23/12 4:00
-452.3209229
4/23/12 5:00
-424.1644897
4/23/12 6:00
-122.5249023
4/23/12 7:00
188.845459
4/23/12 8:00
-19.55932617
4/23/12 9:00
-26.30078125
4/23/12 10:00
-52.38696289
4/23/12 11:00
182.9523926
4/23/12 12:00
107.979126
4/23/12 13:00
235.0307617
4/23/12 14:00
252.9929199
4/23/12 15:00
214.3326416
4/23/12 16:00
183.0751953
4/23/12 17:00
219.1130371
4/23/12 18:00
93.46899414
4/23/12 19:00
209.380127
4/23/12 20:00
297.1986084
4/23/12 21:00
113.475708
4/23/12 22:00
25.91479492
4/23/12 23:00
122.9942627
4/24/12 0:00
-372.3853149
4/24/12 1:00
-333.6153564
4/24/12 2:00
-40.99853516
4/24/12 3:00
50.96514893
4/24/12 4:00
193.9692383
4/24/12 5:00
88.36560059
4/24/12 6:00
-167.9799805
4/24/12 7:00
-117.1513672
4/24/12 8:00
-88.01843262
4/24/12 9:00
-210.211792
Docket No. ER11-1844
Exhibit No. NYI-36
Page 11 of 16
4/24/12 10:00
-29.13220215
4/24/12 11:00
64.71533203
4/24/12 12:00
10.53900146
4/24/12 13:00
-52.60931396
4/24/12 14:00
-195.1902466
4/24/12 15:00
-188.2663574
4/24/12 16:00
-418.7711487
4/24/12 17:00
-231.6263428
4/24/12 18:00
-194.3319092
4/24/12 19:00
72.296875
4/24/12 20:00
249.7463379
4/24/12 21:00
-71.55541992
4/24/12 22:00
-38.14001465
4/24/12 23:00
114.7590332
4/25/12 0:00
-32.77990723
4/25/12 1:00
-50.09228516
4/25/12 2:00
-47.65234375
4/25/12 3:00
-154.4915466
4/25/12 4:00
-23.36572266
4/25/12 5:00
-18.96875
4/25/12 6:00
-352.855011
4/25/12 7:00
-69.29455566
4/25/12 8:00
-160.9417725
4/25/12 9:00
-274.7651367
4/25/12 10:00
-58.30175781
4/25/12 11:00
-21.67883301
4/25/12 12:00
-116.9763184
4/25/12 13:00
-162.3218994
4/25/12 14:00
-215.0814209
4/25/12 15:00
239.0267334
4/25/12 16:00
-72.48022461
4/25/12 17:00
-284.7826538
4/25/12 18:00
-116.1010742
4/25/12 19:00
-38.75927734
4/25/12 20:00
217.9954834
4/25/12 21:00
-11.20025635
4/25/12 22:00
-162.8338013
4/25/12 23:00
-171.1630249
4/26/12 0:00
-66.78741455
4/26/12 1:00
-202.8572693
4/26/12 2:00
-307.2962646
4/26/12 3:00
-247.9781342
4/26/12 4:00
-144.7072144
4/26/12 5:00
-199.4056396
4/26/12 6:00
-220.9859619
4/26/12 7:00
-207.8548584
4/26/12 8:00
-189.2307129
Docket No. ER11-1844
Exhibit No. NYI-36
Page 12 of 16
4/26/12 9:00
-227.6756592
4/26/12 10:00
-266.864502
4/26/12 11:00
-188.5447998
4/26/12 12:00
28.63171387
4/26/12 13:00
-322.4182739
4/26/12 14:00
-441.9581299
4/26/12 15:00
-109.6519775
4/26/12 16:00
-224.0482178
4/26/12 17:00
15.83374023
4/26/12 18:00
-161.3922119
4/26/12 19:00
-52.29833984
4/26/12 20:00
-127.7263184
4/26/12 21:00
-325.8422852
4/26/12 22:00
-109.9526367
4/26/12 23:00
-117.4978027
4/27/12 0:00
-240.7691956
4/27/12 1:00
-164.481781
4/27/12 2:00
-49.87988281
4/27/12 3:00
-365.2006531
4/27/12 4:00
-253.4188385
4/27/12 5:00
-559.6690063
4/27/12 6:00
-453.5018921
4/27/12 7:00
-425.552002
4/27/12 8:00
-404.3999939
4/27/12 9:00
-567.6843872
4/27/12 10:00
-454.6569519
4/27/12 11:00
-424.4208984
4/27/12 12:00
-513.829834
4/27/12 13:00
-429.8726196
4/27/12 14:00
-284.5604553
4/27/12 15:00
-202.4656372
4/27/12 16:00
-309.6728516
4/27/12 17:00
-486.3002319
4/27/12 18:00
-370.8144531
4/27/12 19:00
-102.93396
4/27/12 20:00
-215.9914551
4/27/12 21:00
-138.7198181
4/27/12 22:00
-372.9552612
4/27/12 23:00
-125.1159668
4/28/12 0:00
-100.1078796
4/28/12 1:00
44.91149902
4/28/12 2:00
-161.4517822
4/28/12 3:00
-112.4159546
4/28/12 4:00
-73.11242676
4/28/12 5:00
-119.2728271
4/28/12 6:00
219.9366455
4/28/12 7:00
327.644165
Docket No. ER11-1844
Exhibit No. NYI-36
Page 13 of 16
4/28/12 8:00
272.7932129
4/28/12 9:00
443.5961914
4/28/12 10:00
-112.8061523
4/28/12 11:00
42.95739746
4/28/12 12:00
107.9969482
4/28/12 13:00
192.2806396
4/28/12 14:00
338.3342285
4/28/12 15:00
294.1508789
4/28/12 16:00
160.78479
4/28/12 17:00
147.47229
4/28/12 18:00
240.965332
4/28/12 19:00
97.52227783
4/28/12 20:00
307.7233887
4/28/12 21:00
218.7189941
4/28/12 22:00
-17.38586426
4/28/12 23:00
13.91625977
4/29/12 0:00
-291.8194885
4/29/12 1:00
7.012451172
4/29/12 2:00
90.16784668
4/29/12 3:00
31.94836426
4/29/12 4:00
-42.28900146
4/29/12 5:00
-54.38818359
4/29/12 6:00
-140.9173584
4/29/12 7:00
-261.6331787
4/29/12 8:00
0.145568848
4/29/12 9:00
-252.8756104
4/29/12 10:00
-235.3994141
4/29/12 11:00
-146.9041748
4/29/12 12:00
-125.0856934
4/29/12 13:00
-20.25134277
4/29/12 14:00
143.5858154
4/29/12 15:00
41.33660889
4/29/12 16:00
-26.84783936
4/29/12 17:00
78.43029785
4/29/12 18:00
288.0238037
4/29/12 19:00
122.7996826
4/29/12 20:00
505.4787598
4/29/12 21:00
126.7121582
4/29/12 22:00
-228.1494751
4/29/12 23:00
-304.7106934
4/30/12 0:00
-267.2219238
4/30/12 1:00
92.1048584
4/30/12 2:00
-64.05224609
4/30/12 3:00
-72.1854248
4/30/12 4:00
139.7290039
4/30/12 5:00
-94.55395508
4/30/12 6:00
98.51989746
Docket No. ER11-1844
Exhibit No. NYI-36
Page 14 of 16
4/30/12 7:00
40.81829834
4/30/12 8:00
246.4030762
4/30/12 9:00
266.1763916
4/30/12 10:00
50.05859375
4/30/12 11:00
109.5064697
4/30/12 12:00
182.1619873
4/30/12 13:00
186.3104248
4/30/12 14:00
33.5246582
4/30/12 15:00
-6.515686035
4/30/12 16:00
5.933837891
4/30/12 17:00
53.86828613
4/30/12 18:00
11.87475586
4/30/12 19:00
-34.13232422
4/30/12 20:00
62.55993652
4/30/12 21:00
21.31970215
4/30/12 22:00
50.56414795
4/30/12 23:00
-66.09710693
5/1/12 0:00
-187.3547974
5/1/12 1:00
5.18737793
5/1/12 2:00
142.7265625
5/1/12 3:00
138.8612061
5/1/12 4:00
170.8652344
5/1/12 5:00
155.440918
5/1/12 6:00
-33.32315063
5/1/12 7:00
-328.9412842
5/1/12 8:00
-150.0429688
5/1/12 9:00
-102.8673706
5/1/12 10:00
196.9434814
5/1/12 11:00
-113.0557251
5/1/12 12:00
-46.74816895
5/1/12 13:00
-15.49719238
5/1/12 14:00
5.041748047
5/1/12 15:00
304.1063232
5/1/12 16:00
-33.46801758
5/1/12 17:00
83.71313477
5/1/12 18:00
33.75048828
5/1/12 19:00
-61.93145752
5/1/12 20:00
158.7244873
5/1/12 21:00
170.8586426
5/1/12 22:00
110.1535645
5/1/12 23:00
197.088623
5/2/12 0:00
182.6998291
5/2/12 1:00
33.18884277
5/2/12 2:00
108.6260986
5/2/12 3:00
69.61376953
5/2/12 4:00
247.5921631
5/2/12 5:00
32.4465332
Docket No. ER11-1844
Exhibit No. NYI-36
Page 15 of 16
5/2/12 6:00
346.2368164
5/2/12 7:00
266.546875
5/2/12 8:00
-103.4343262
5/2/12 9:00
35.21685791
5/2/12 10:00
37.94165039
5/2/12 11:00
20.8458252
5/2/12 12:00
-39.86218262
5/2/12 13:00
115.5843506
5/2/12 14:00
-10.04058838
5/2/12 15:00
111.935791
5/2/12 16:00
46.72210693
5/2/12 17:00
177.3980103
5/2/12 18:00
78.24188232
5/2/12 19:00
282.7363281
5/2/12 20:00
62.94946289
5/2/12 21:00
-303.9246826
5/2/12 22:00
-59.99487305
5/2/12 23:00
90.11291504
5/3/12 0:00
-277.8481445
5/3/12 1:00
198.8271484
5/3/12 2:00
332.2193604
5/3/12 3:00
-33.23138428
5/3/12 4:00
226.1313477
5/3/12 5:00
61.3260498
5/3/12 6:00
-155.7435303
5/3/12 7:00
210.1916504
5/3/12 8:00
-66.27124023
5/3/12 9:00
-282.2237549
5/3/12 10:00
-191.085083
5/3/12 11:00
-239.807251
5/3/12 12:00
94.72131348
5/3/12 13:00
-310.6671448
5/3/12 14:00
-183.3446655
5/3/12 15:00
-153.8908691
5/3/12 16:00
-427.8289185
5/3/12 17:00
-209.8580627
5/3/12 18:00
76.08950806
5/3/12 19:00
-68.50772095
5/3/12 20:00
16.40032959
5/3/12 21:00
-96.39453125
5/3/12 22:00
-39.37866211
5/3/12 23:00
20.61621094
5/4/12 0:00
45.31817627
5/4/12 1:00
35.48736572
5/4/12 2:00
178.3203125
5/4/12 3:00
161.1296387
5/4/12 4:00
230.4971924
Docket No. ER11-1844
Exhibit No. NYI-36
Page 16 of 16
5/4/12 5:00
73.52062988
5/4/12 6:00
217.9846191
5/4/12 7:00
630.2862549
5/4/12 8:00
362.9243164
5/4/12 9:00
307.7193604
5/4/12 10:00
268.0302124
5/4/12 11:00
381.9373779
5/4/12 12:00
221.4105225
5/4/12 13:00
228.5743408
5/4/12 14:00
119.802124
5/4/12 15:00
116.767334
5/4/12 16:00
338.6273193
5/4/12 17:00
180.8600464
5/4/12 18:00
605.4056396
5/4/12 19:00
310.81073
5/4/12 20:00
446.3617554
5/4/12 21:00
412.4099121
5/4/12 22:00
487.3009033
5/4/12 23:00
318.9676514
5/5/12 0:00
24.60925293
5/5/12 1:00
155.5606689
5/5/12 2:00
110.3920898
5/5/12 3:00
-42.29211426
5/5/12 4:00
-194.7582397
5/5/12 5:00
-41.36303711
5/5/12 6:00
-220.3170166
5/5/12 7:00
74.26391602
5/5/12 8:00
218.7286377
5/5/12 9:00
316.4484863
5/5/12 10:00
277.5793457
5/5/12 11:00
261.4320068
5/5/12 12:00
442.132019
5/5/12 13:00
434.6153564
5/5/12 14:00
215.1848755
5/5/12 15:00
257.6817627
5/5/12 16:00
150.5512695
5/5/12 17:00
324.9055786
5/5/12 18:00
522.081665
5/5/12 19:00
407.6992188
5/5/12 20:00
405.0129395
5/5/12 21:00
175.6643066
5/5/12 22:00
216.5280762
5/5/12 23:00
165.5614624
DOCKET NO. ER11-1844
EXHIBIT NO. NYI-37
Docket No. ER11-1844
Exhibit No. NYI-37
Page 1 of 1
NYTO/ITC 1-86. Please describe the degree to which the Replacement PARs ability to control
loop flow is dependent upon the operation of IESO’s PARs or other facilities.
Response NYTO/ITC 1-86: In order to maximize the loop flow control effect of the PARs, the
operation of all the PARs must be coordinated. This coordination is embedded in the ITC-Hydro
One Interconnection Facilities Agreement filed at DOE. Some loop flow mitigation could occur
by operating the ITC B3N PARs in isolation of the operation of the Ontario PARs on the
interface but the results would be sub-optimal, and be contrary to NERC compliance
requirements. The operational actions of the other parties around Lake Erie, such as operation of
the Ramapo PAR and the generation dispatch configuration, greatly affects the magnitude of
loop flow and therefore the ability of the ITC-Hydro One PARs to control the loop flow.
Response prepared by Mike Moltane
87


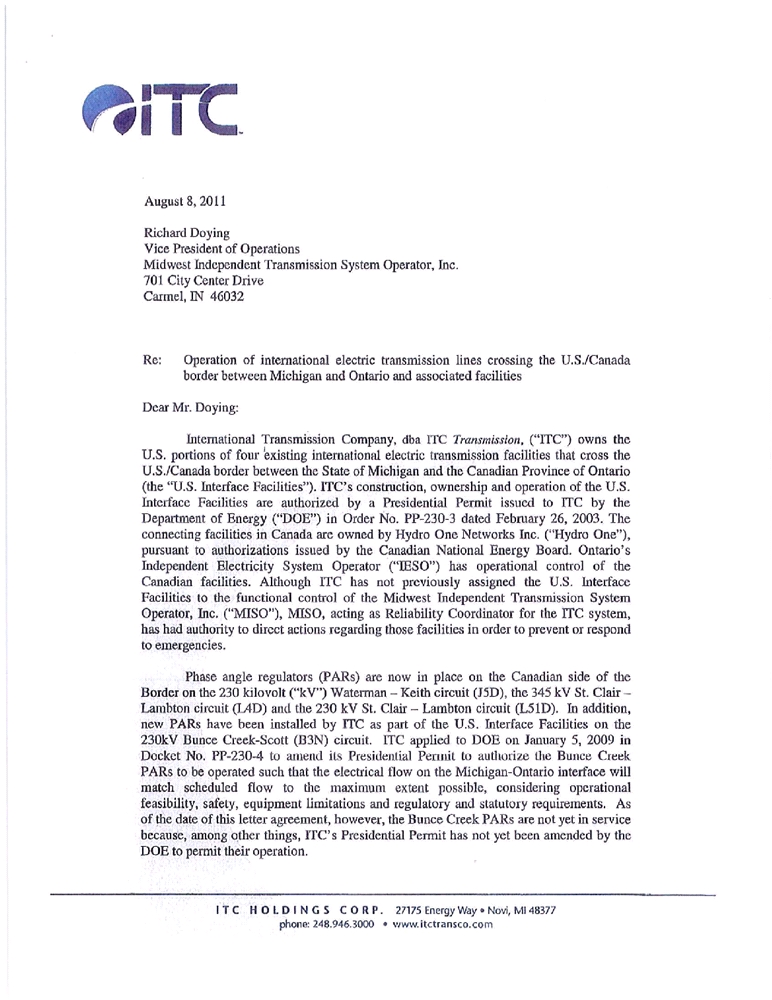


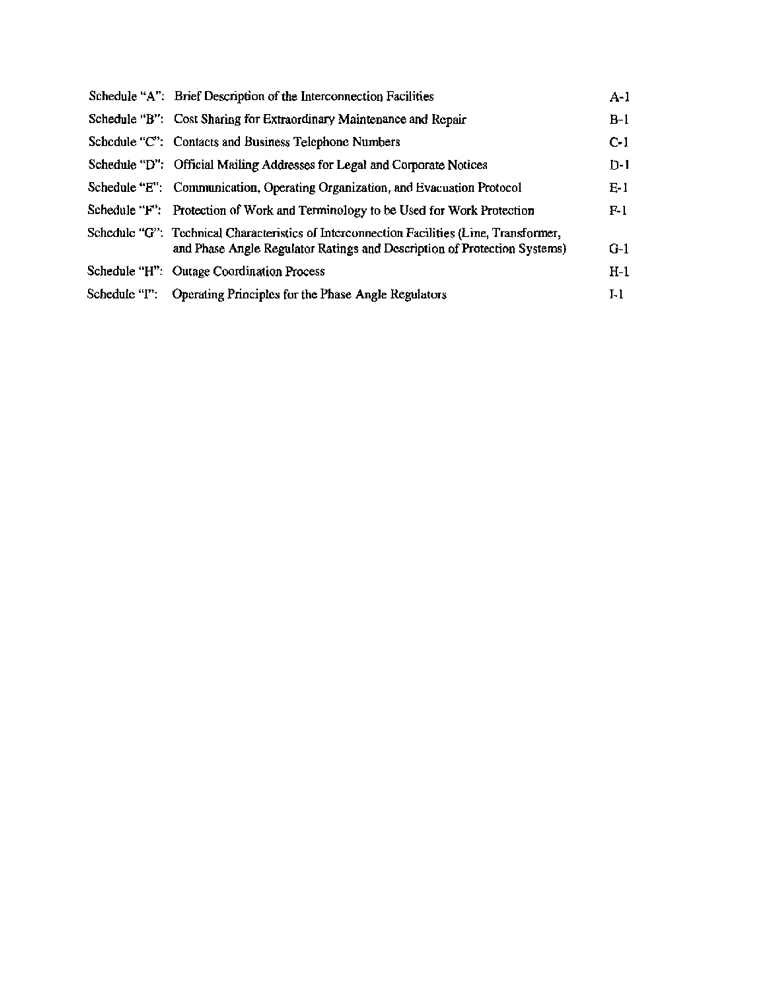
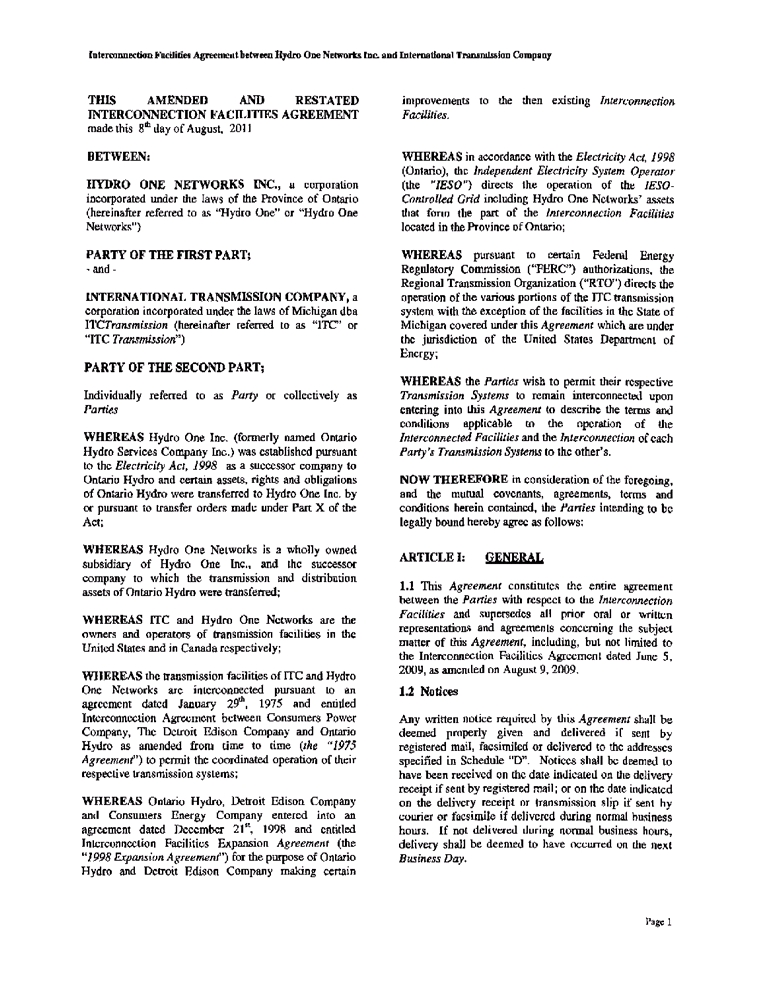
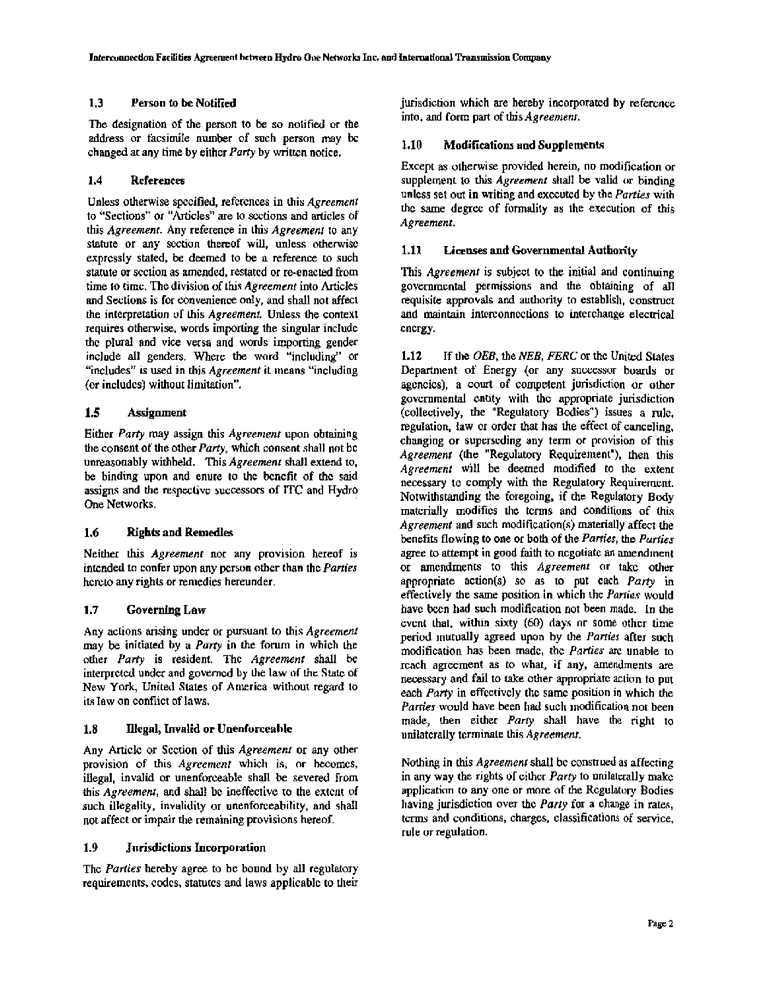


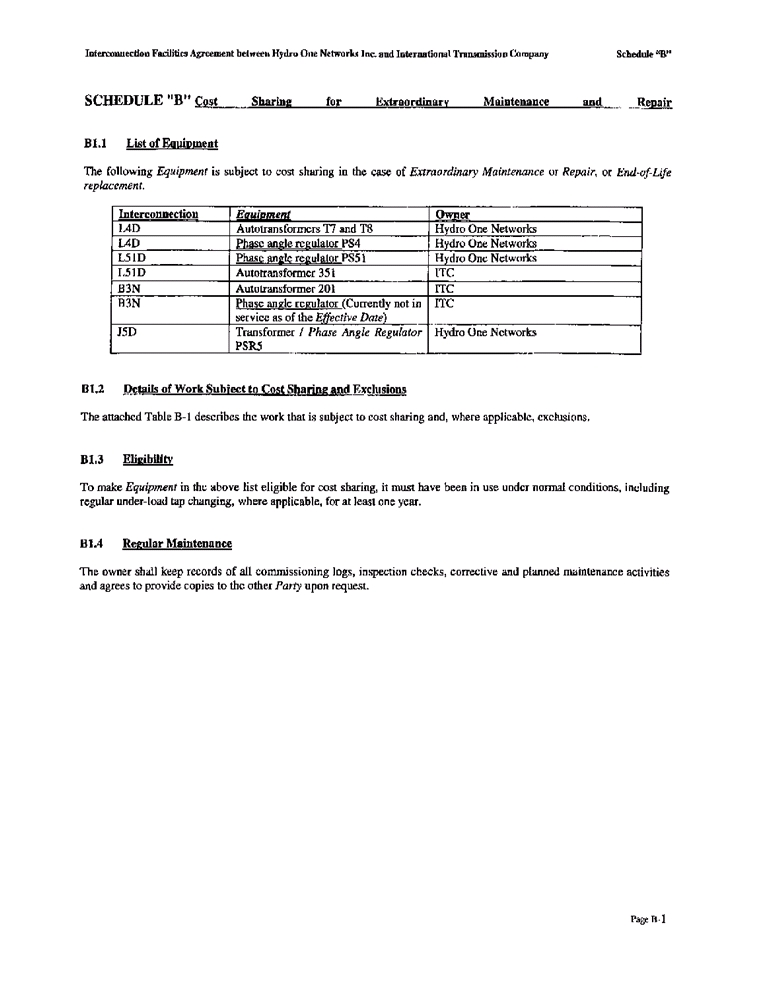

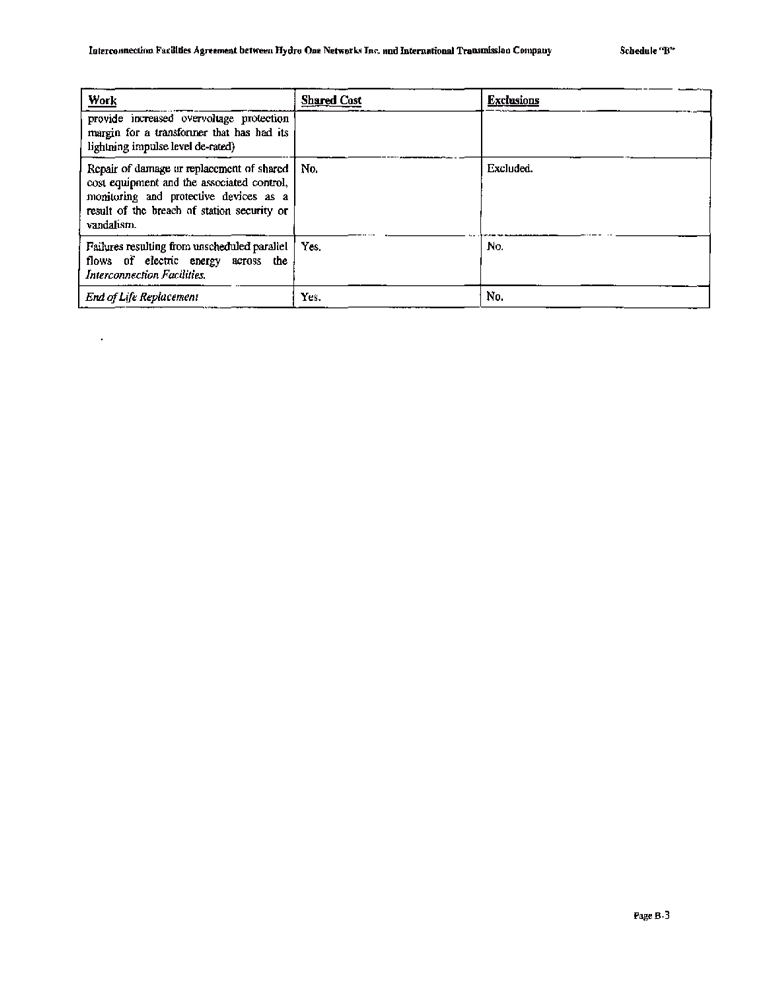


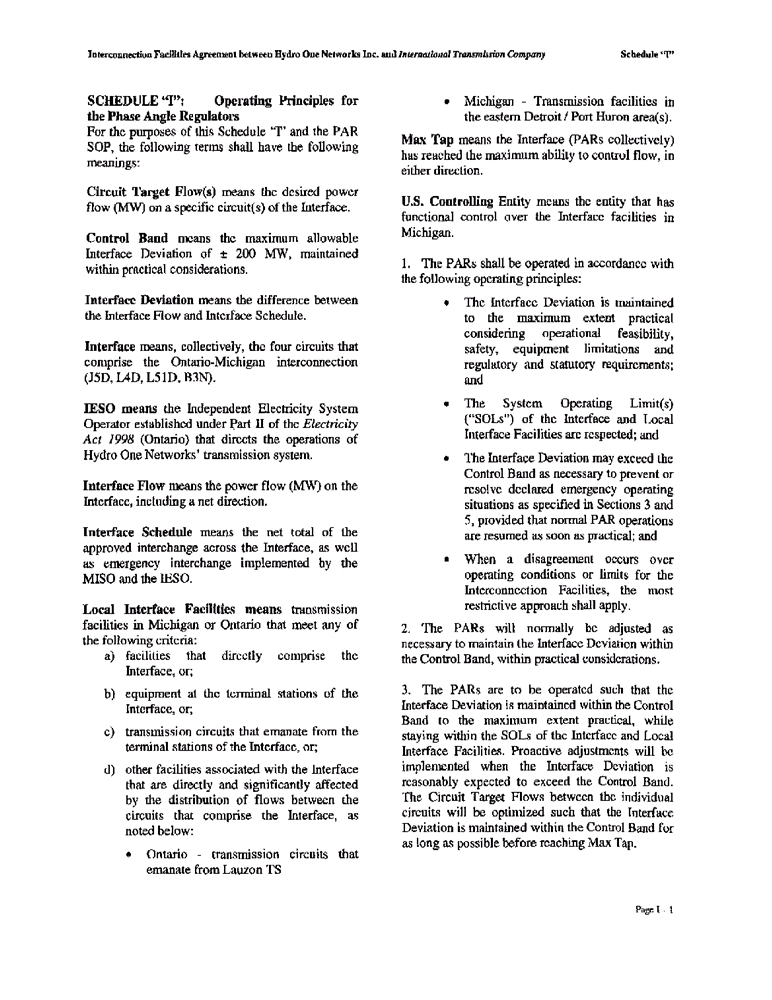
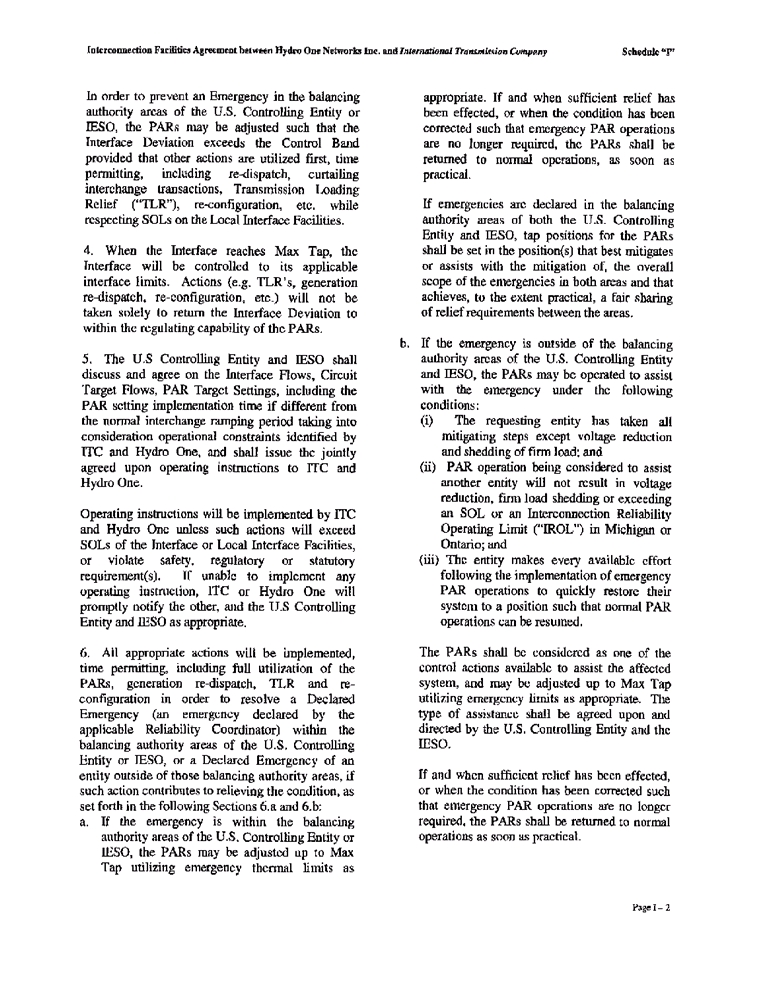


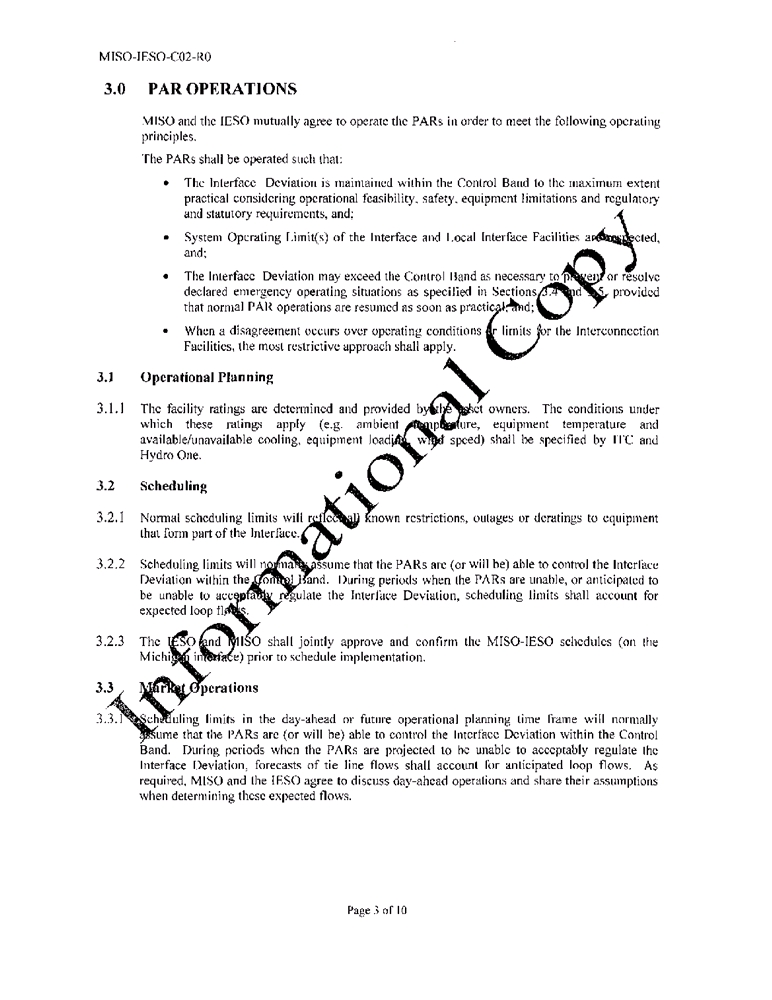
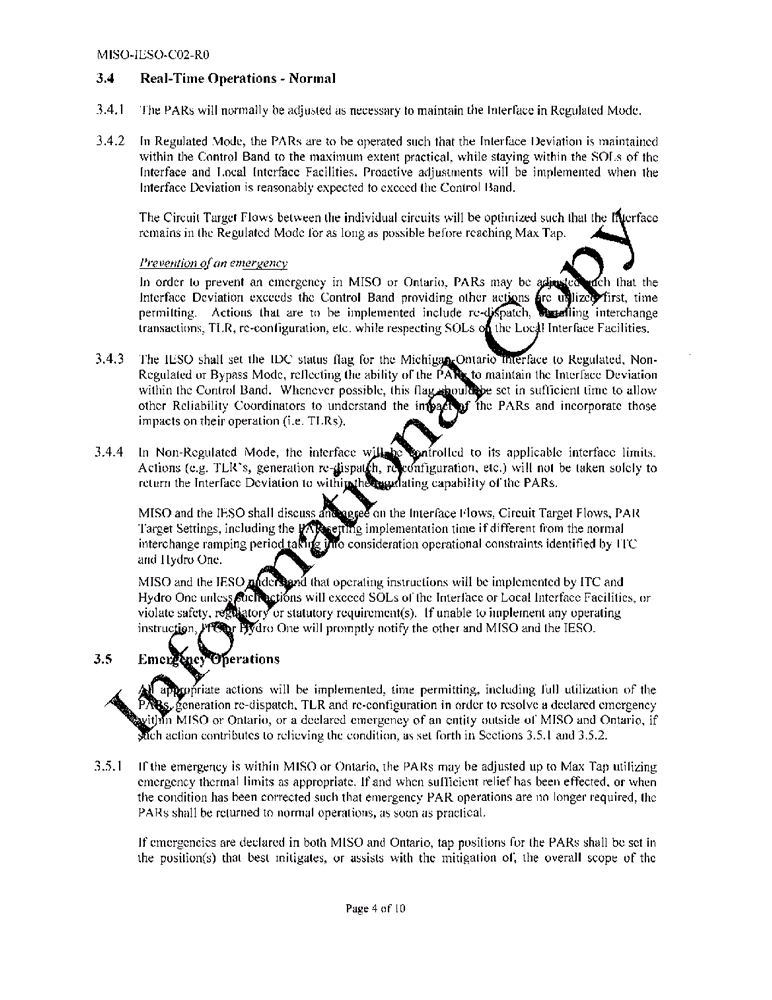

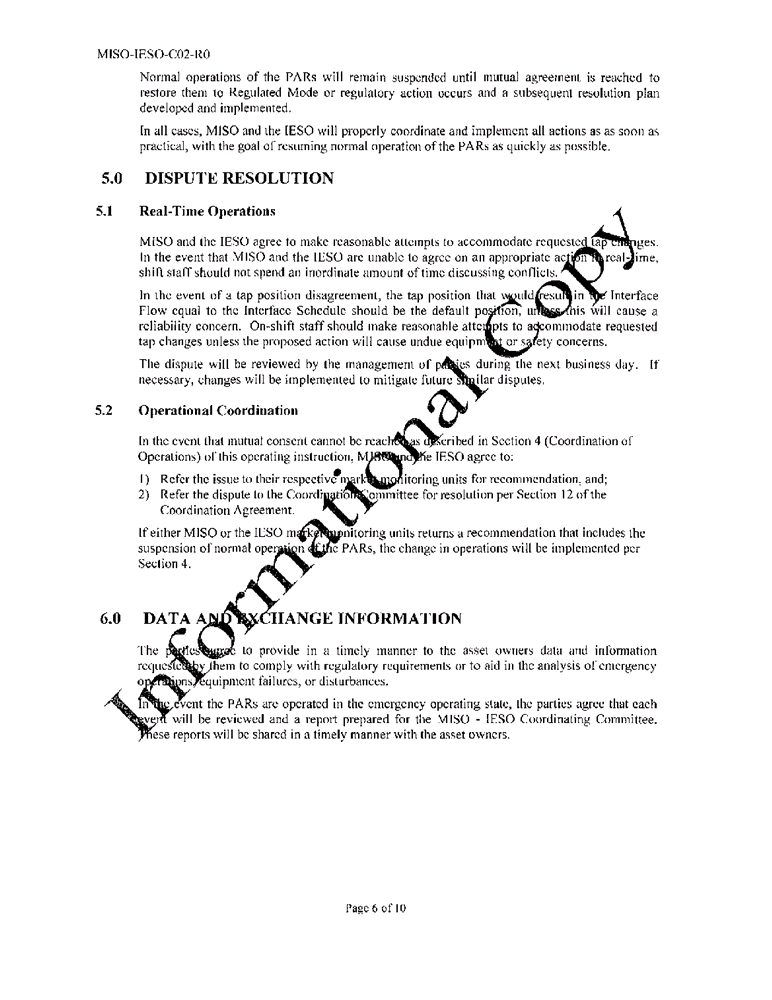

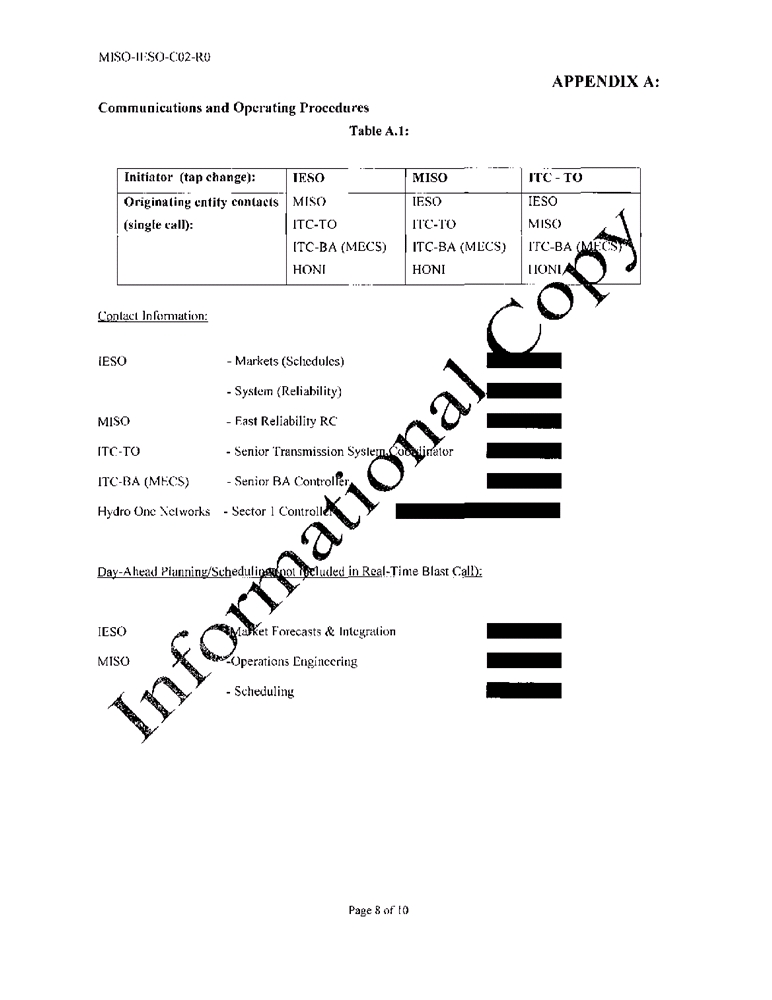
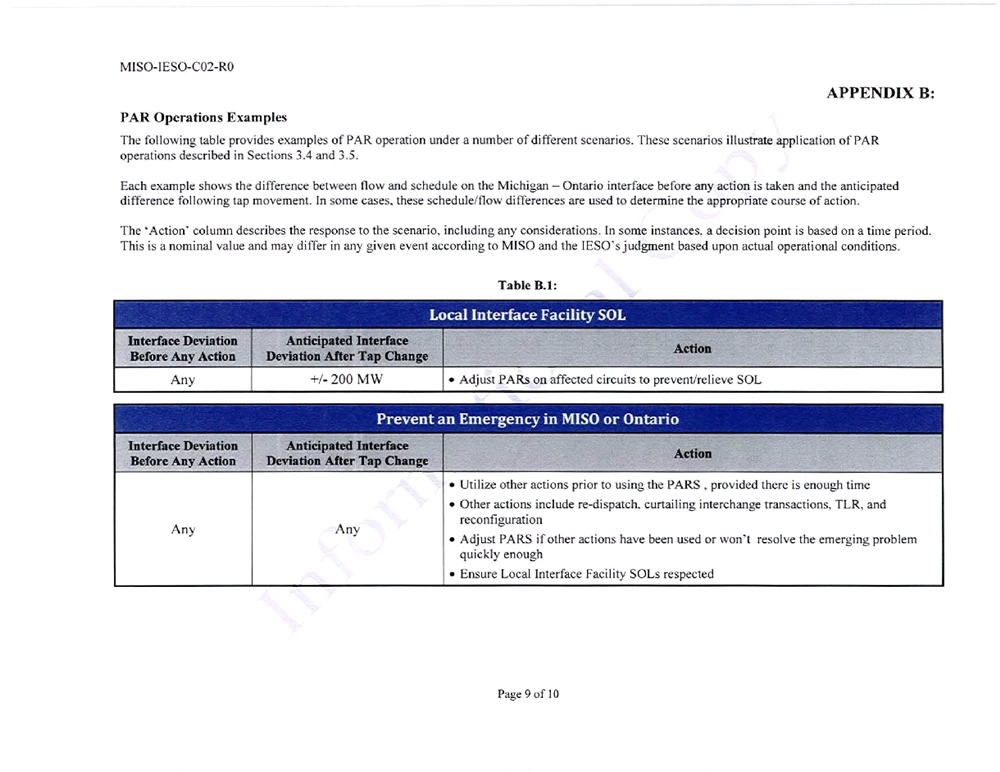
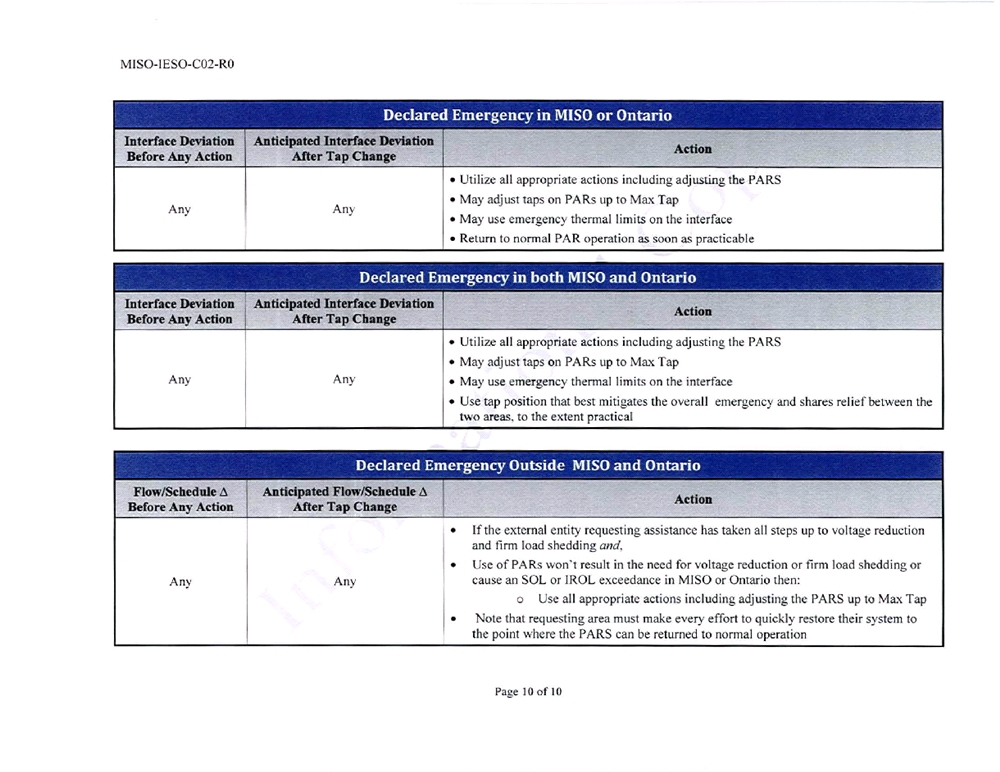


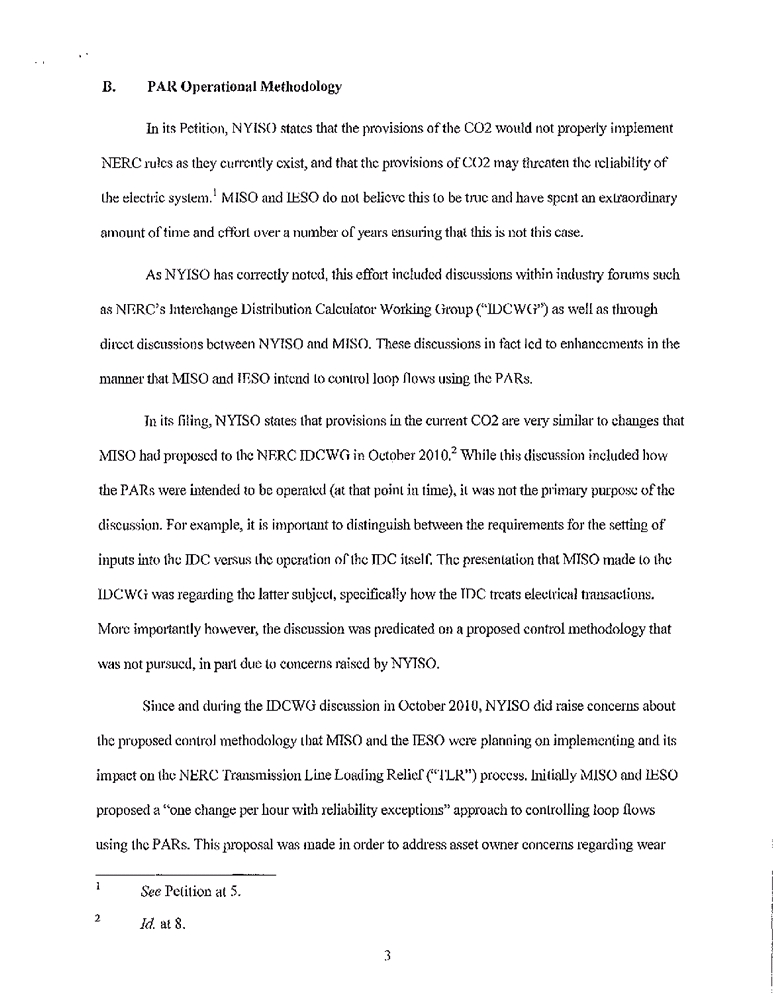


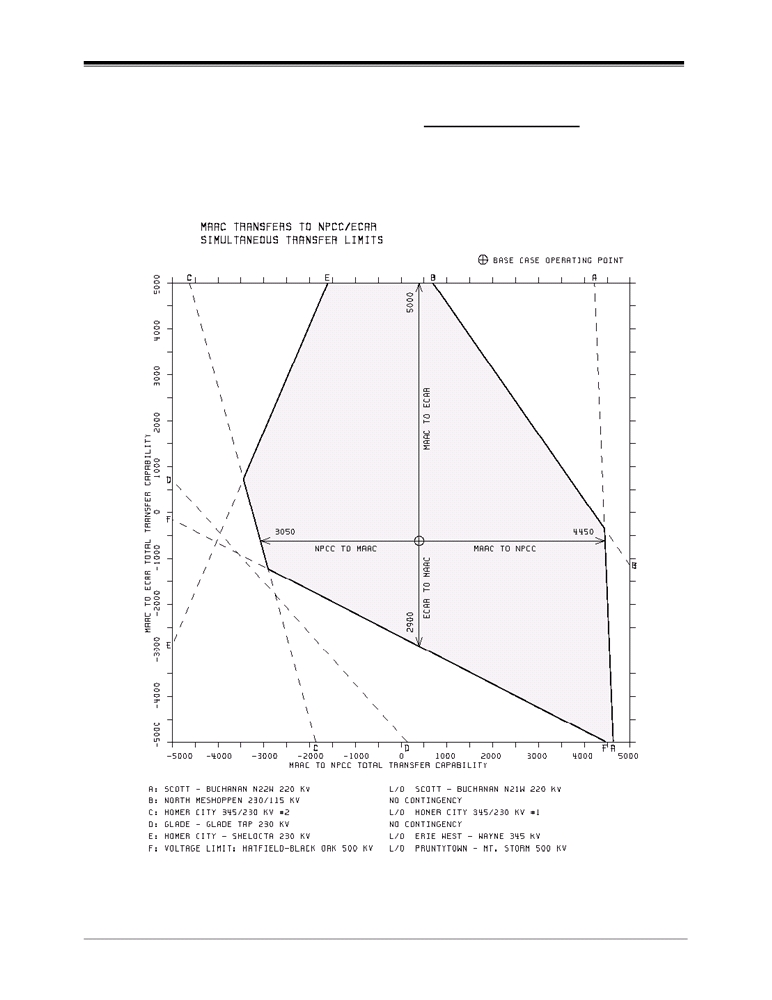
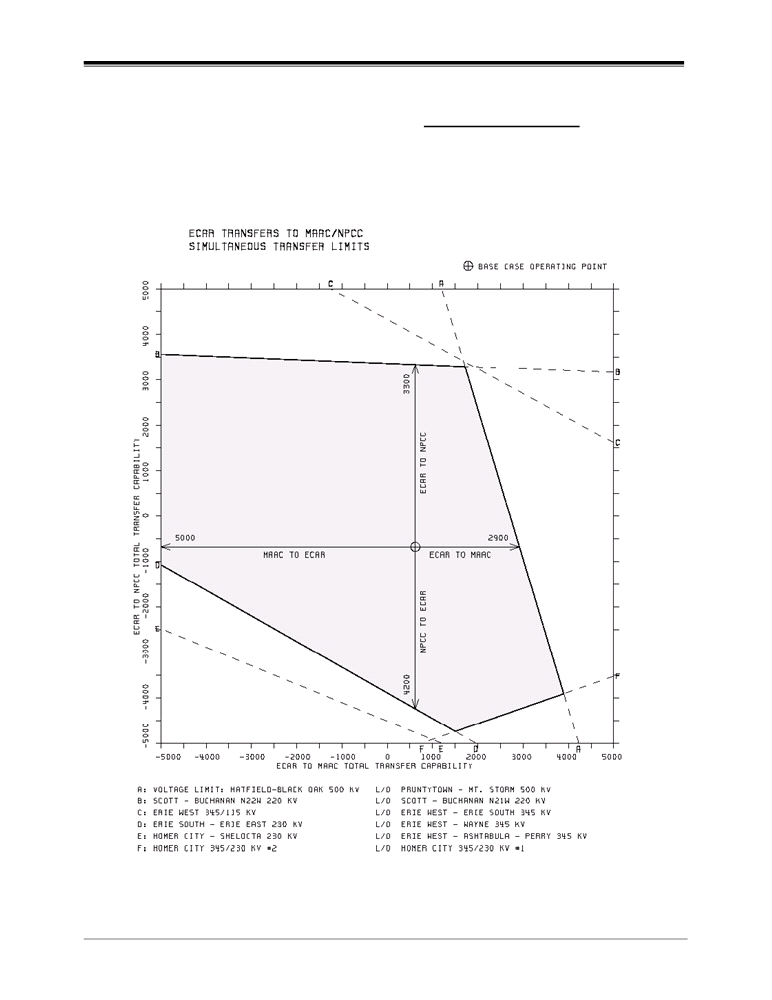
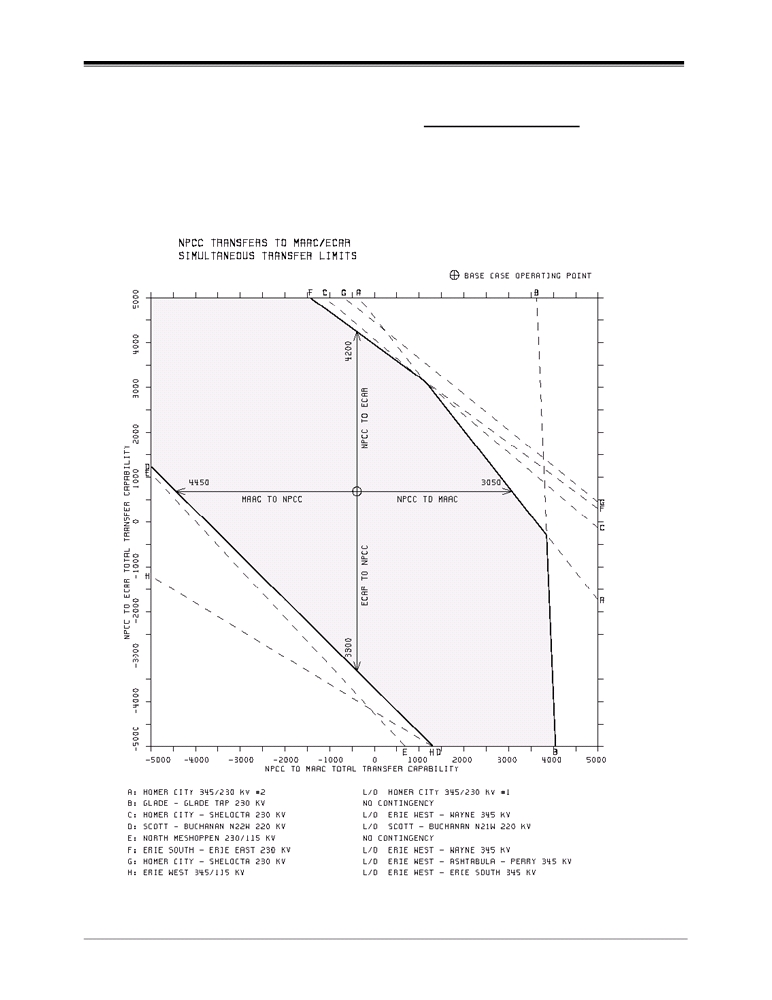
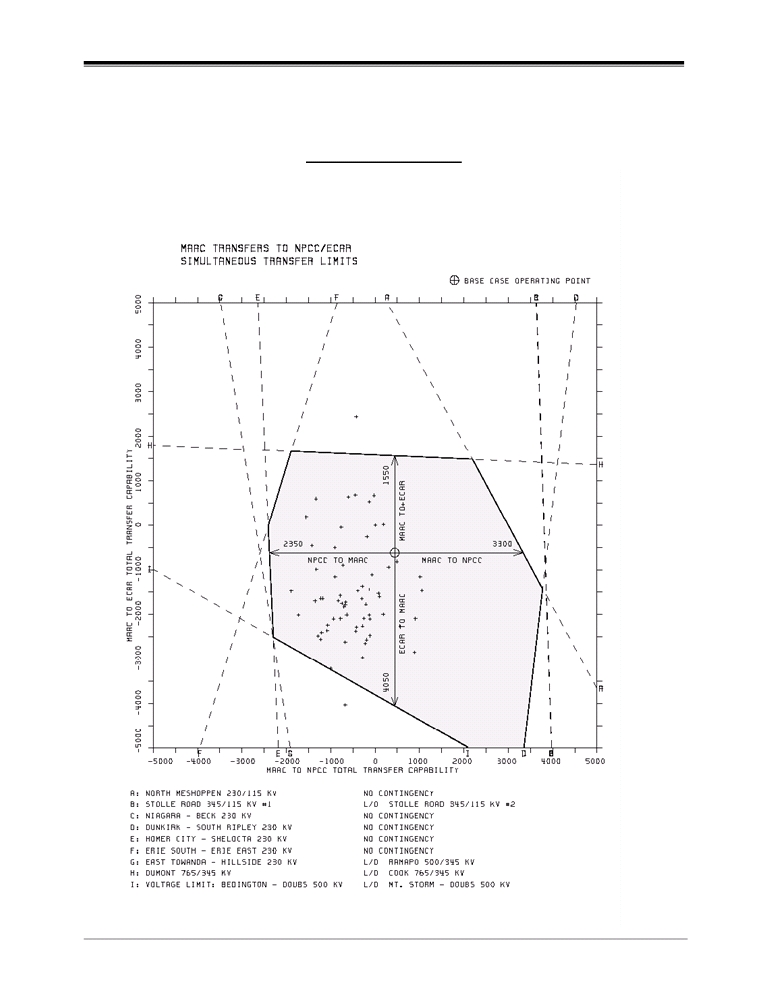
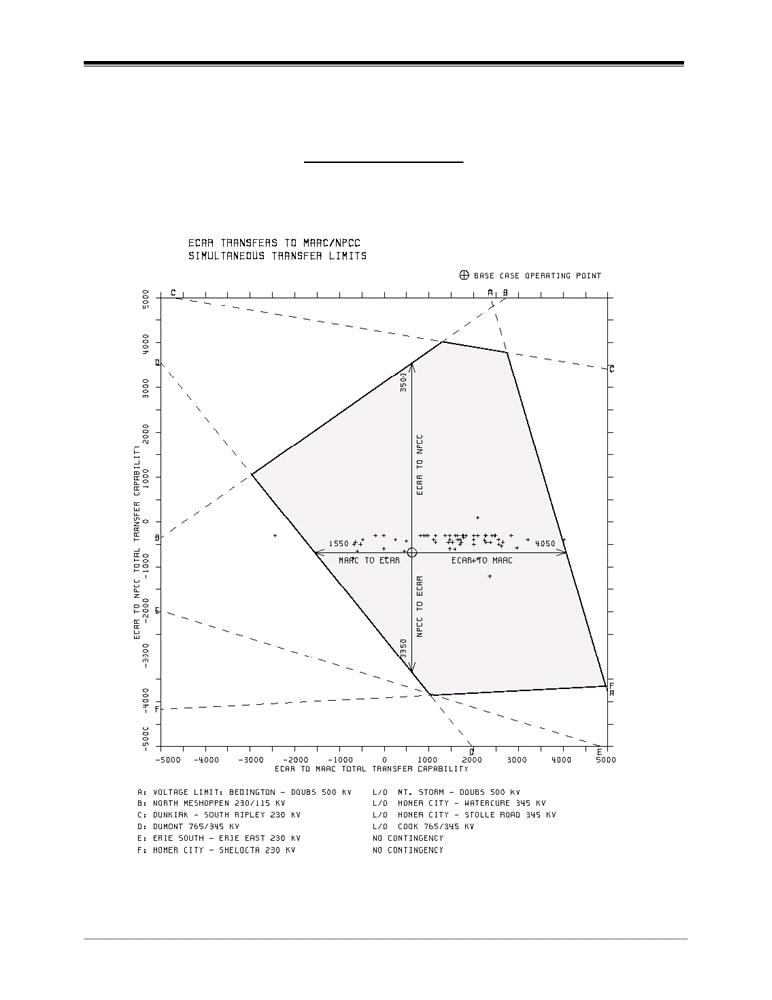
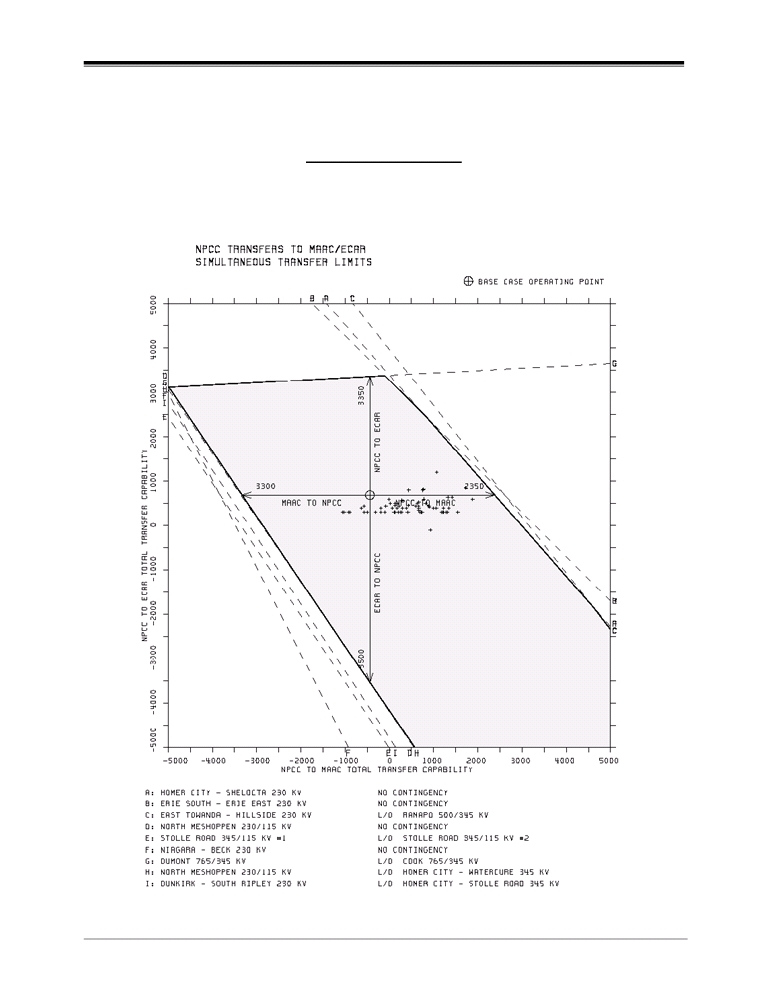
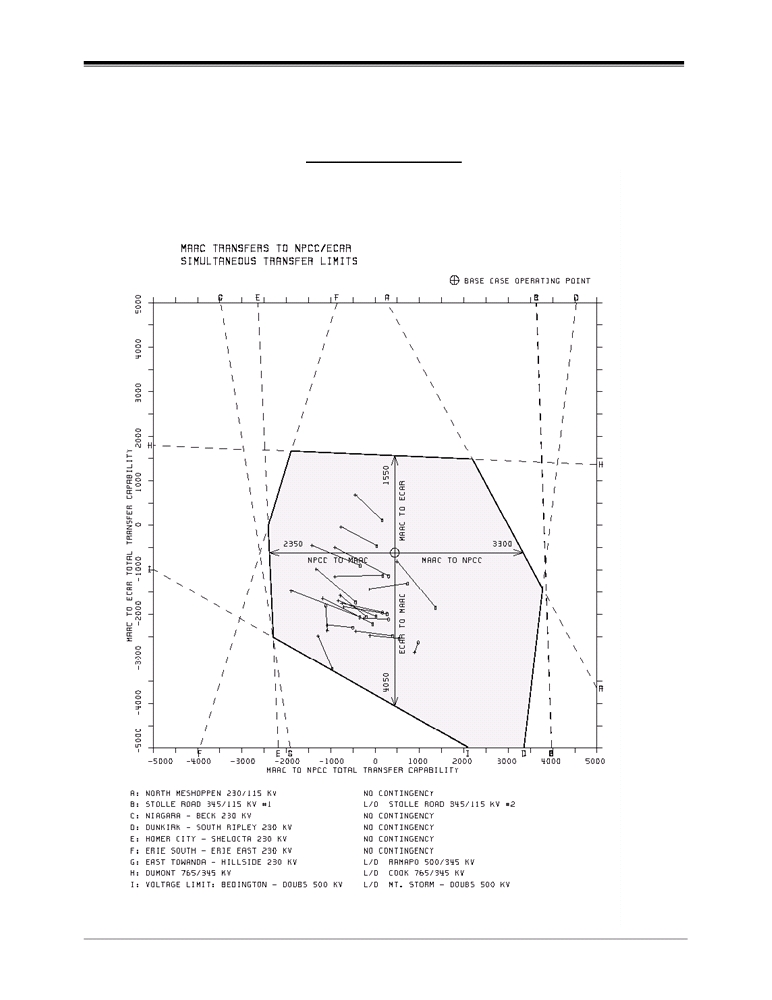
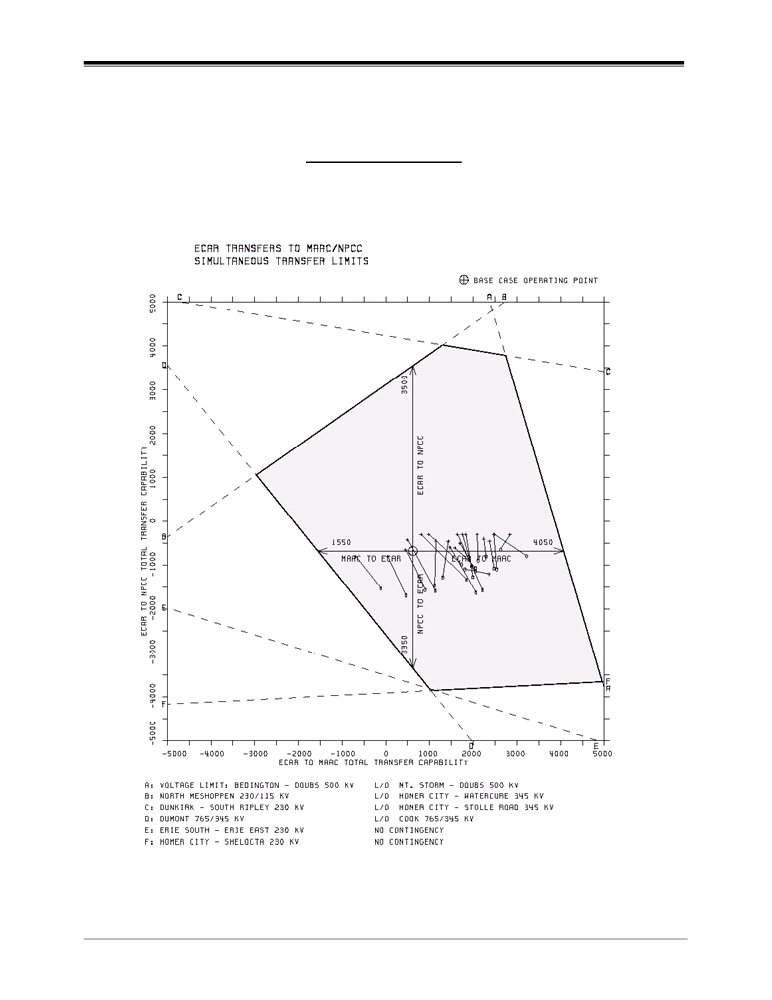
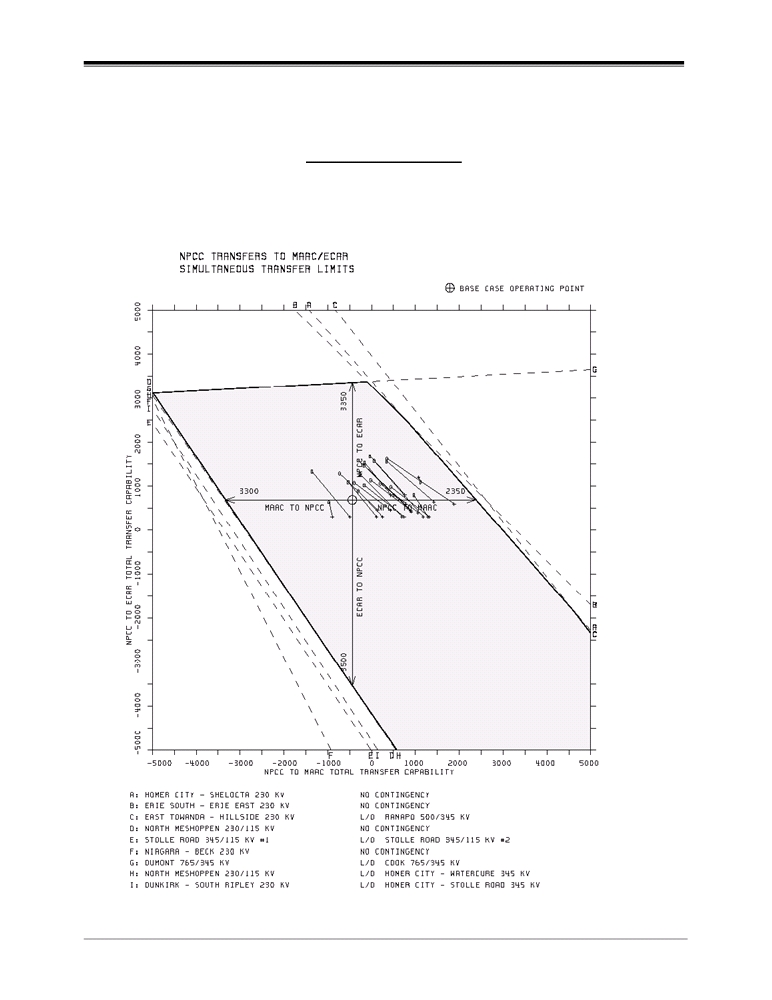


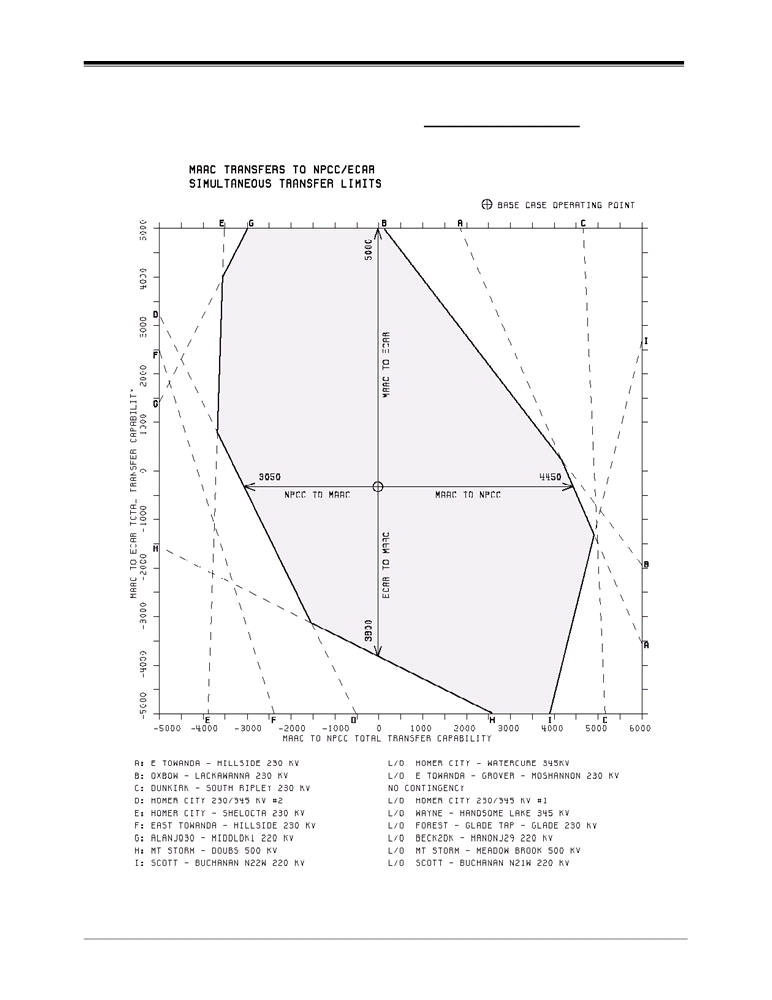
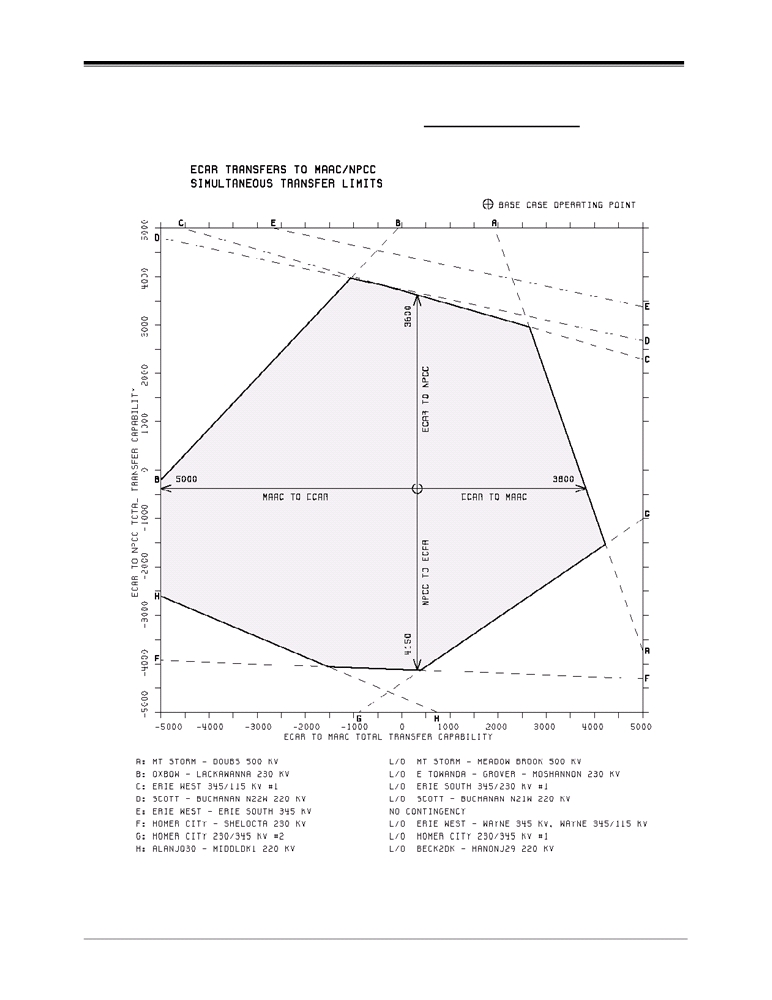
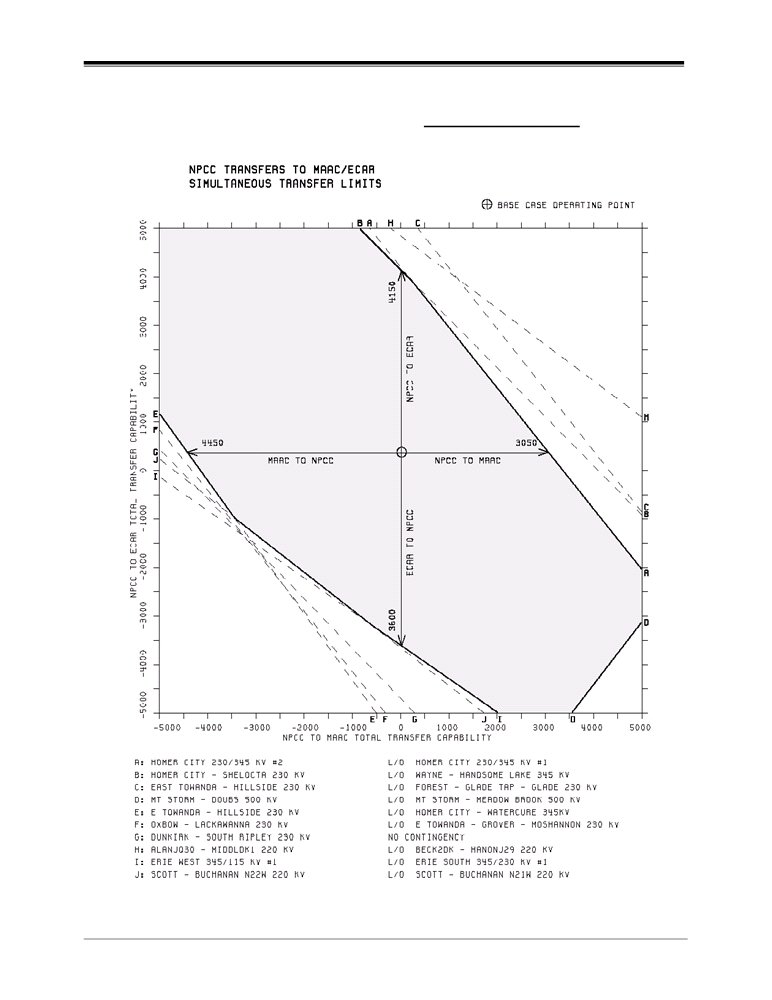
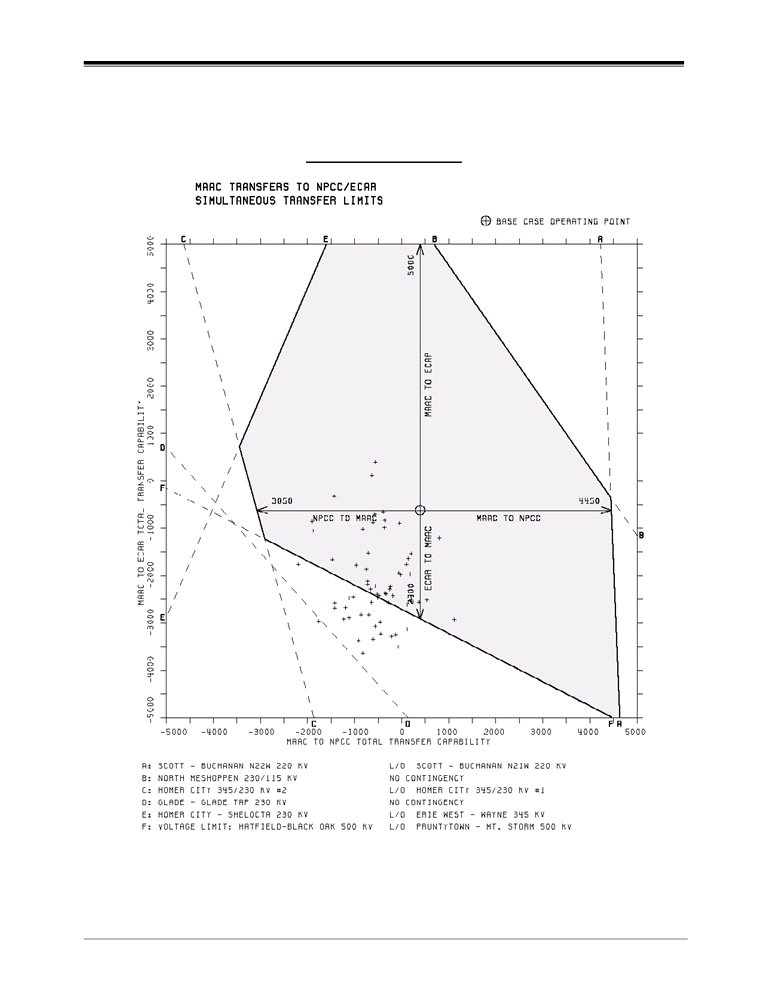
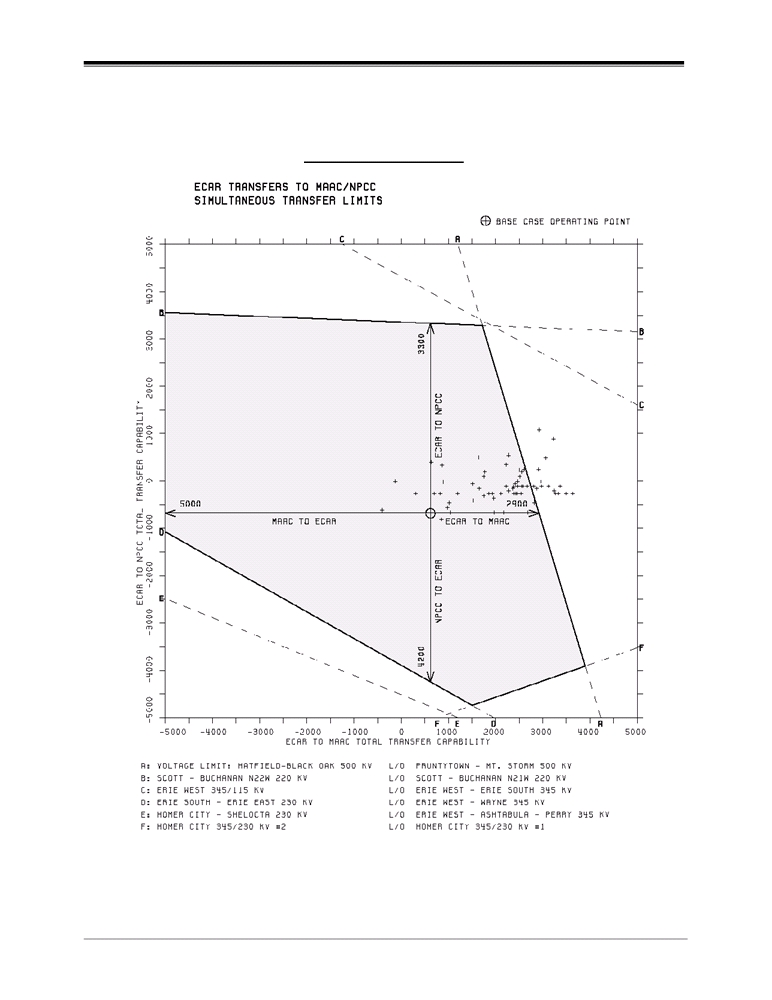
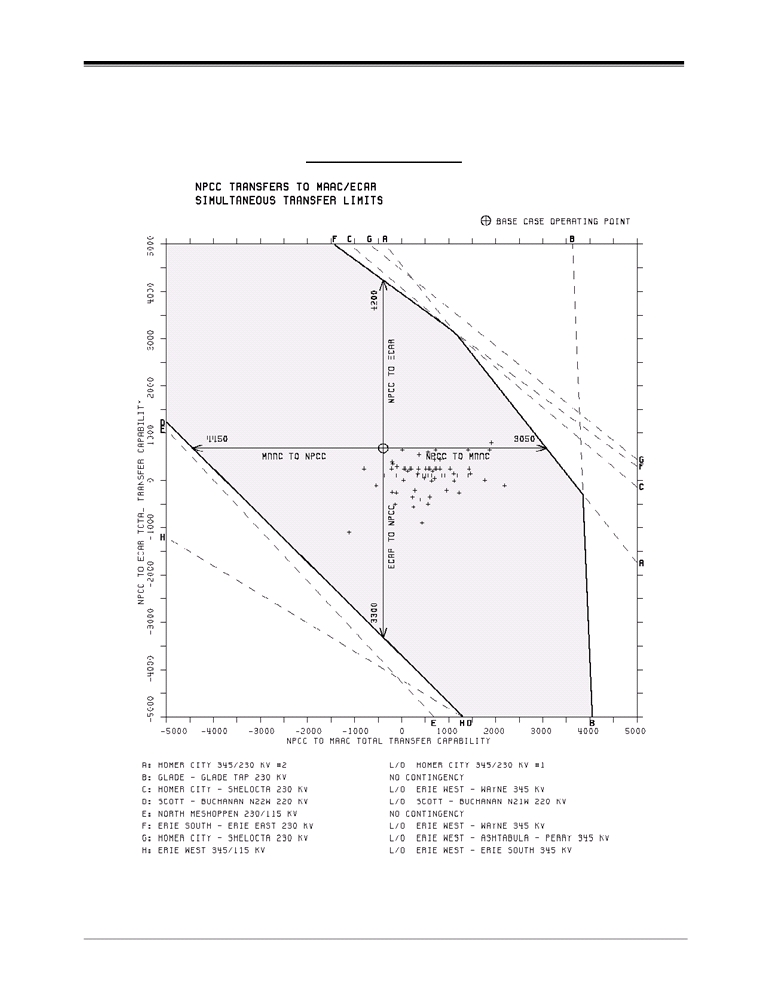
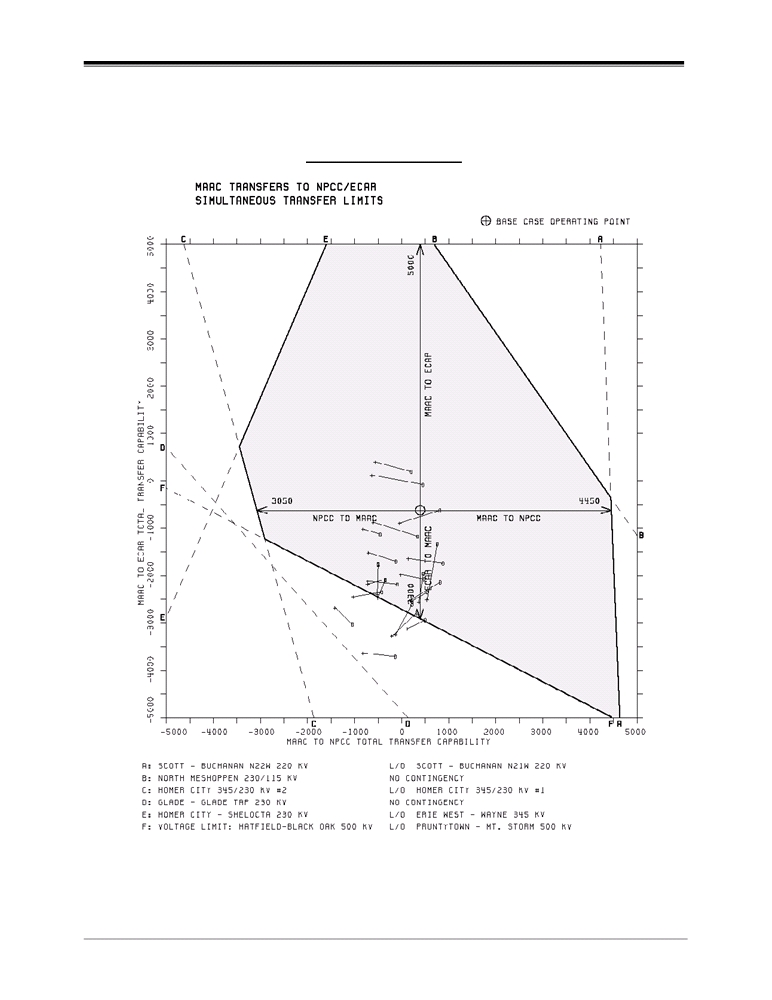
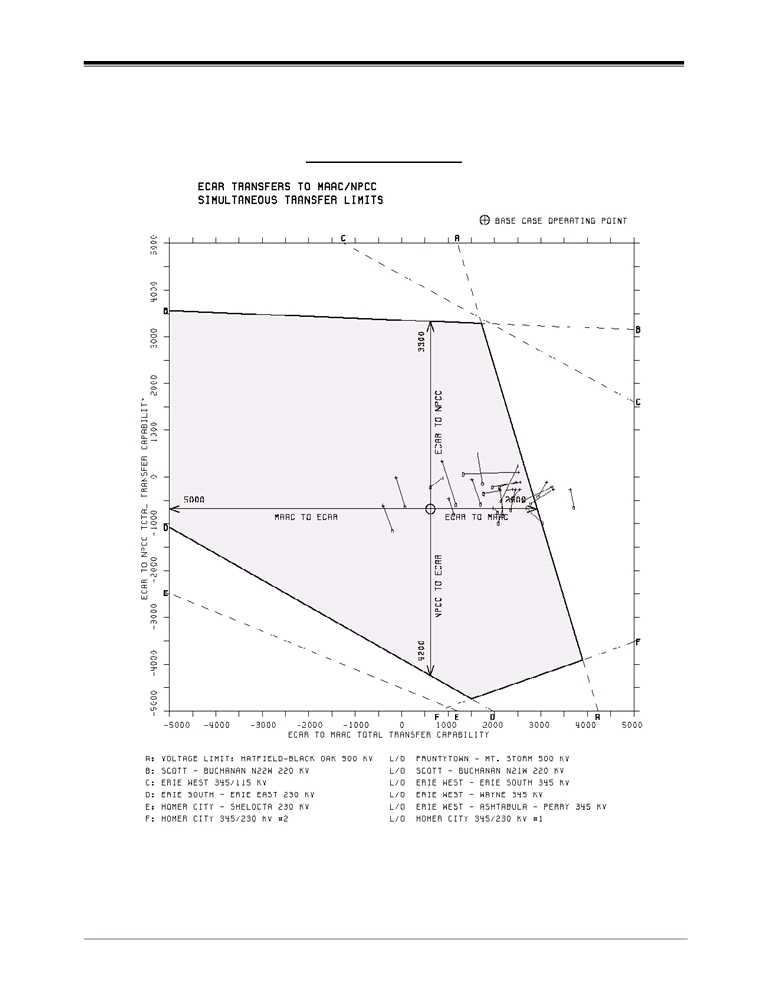
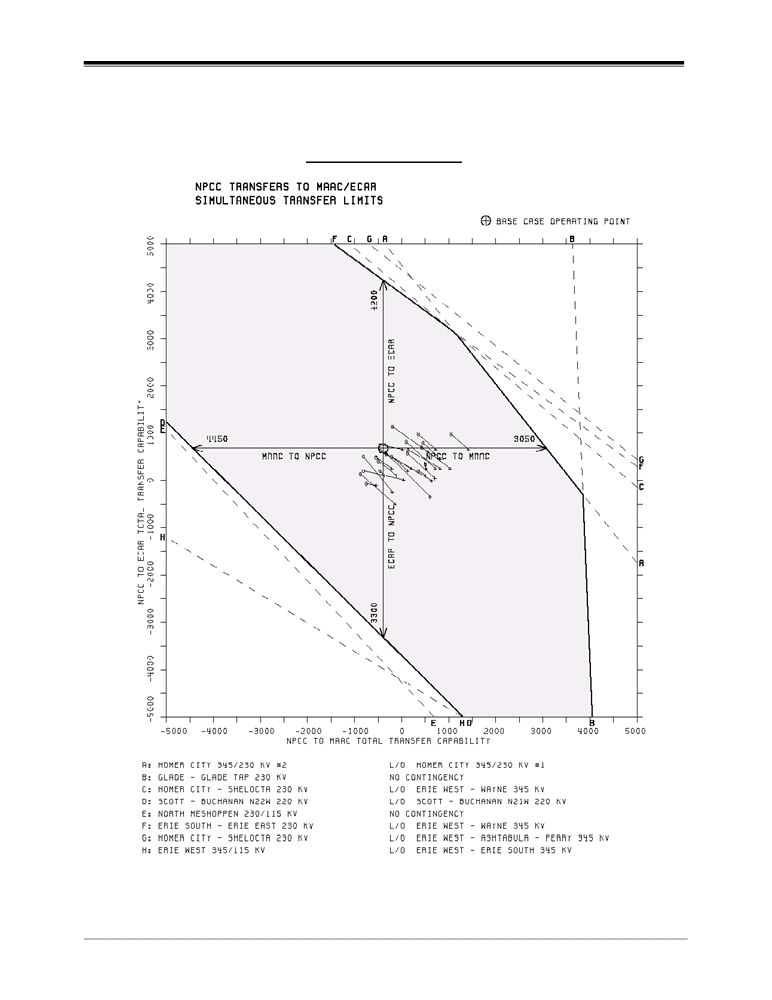
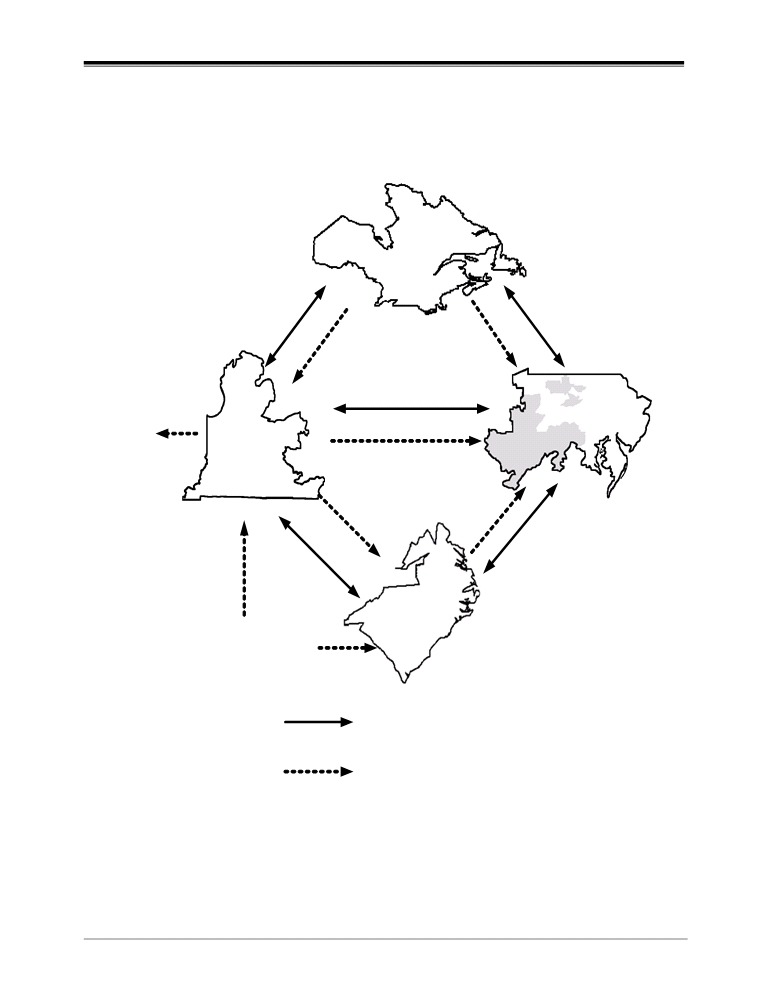


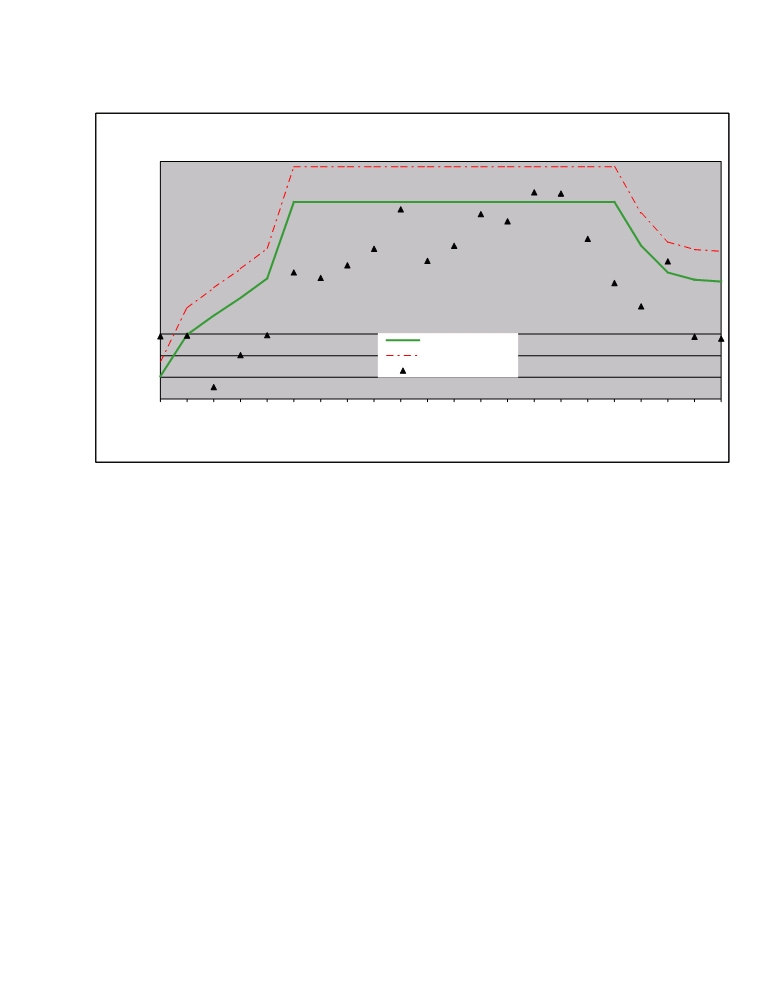
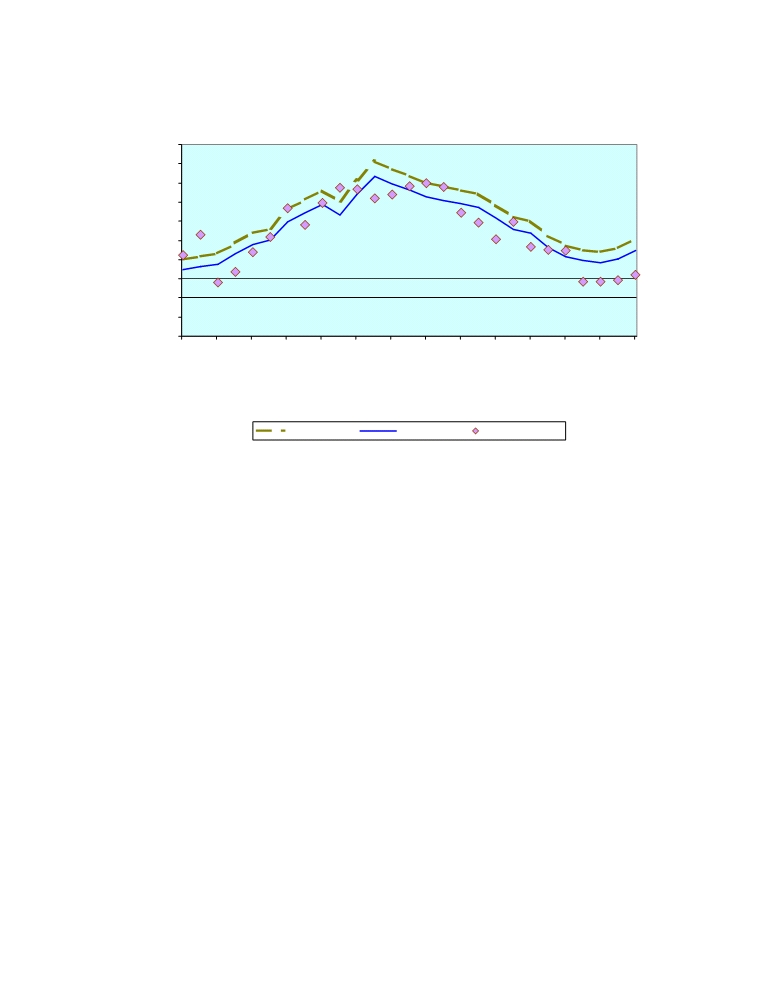
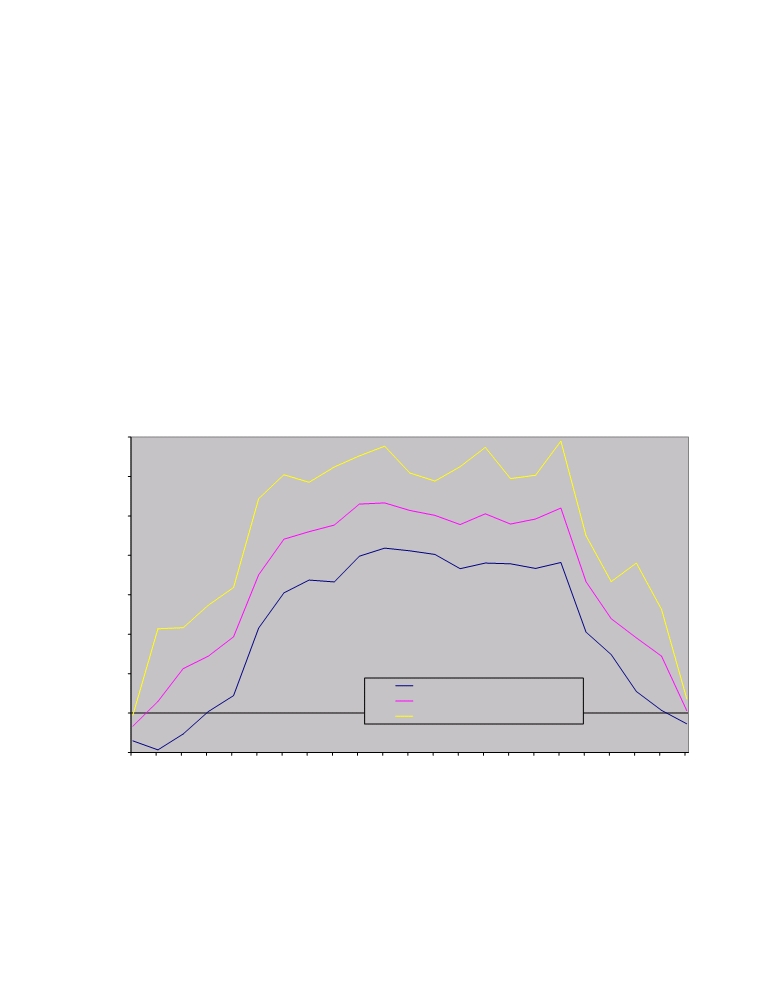


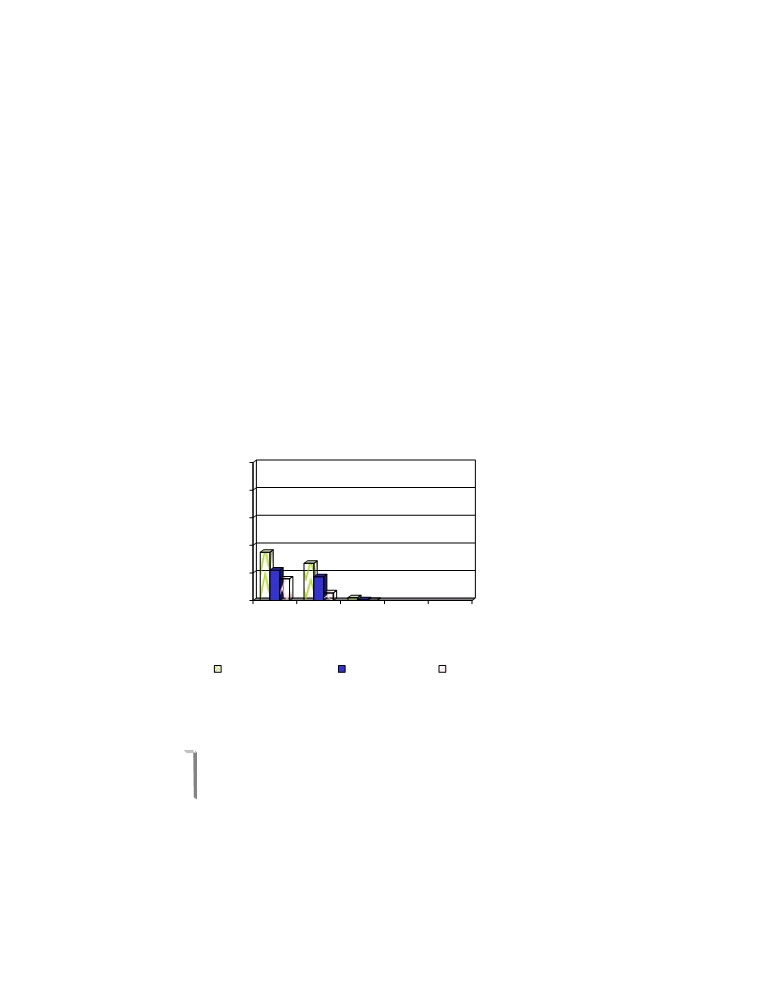

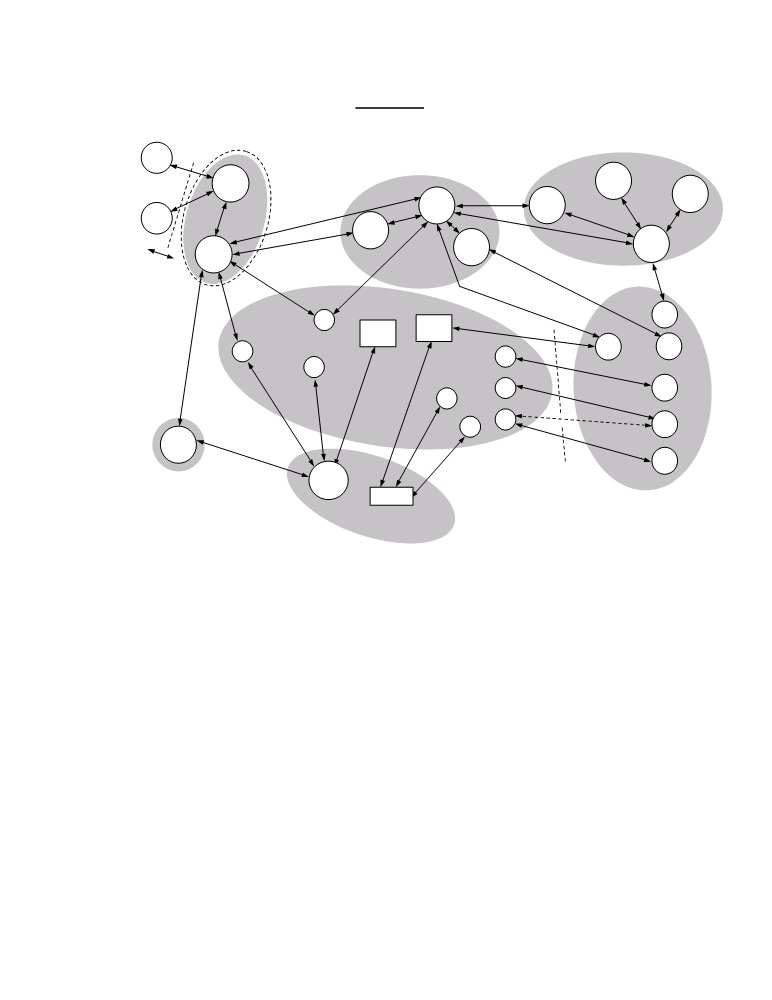


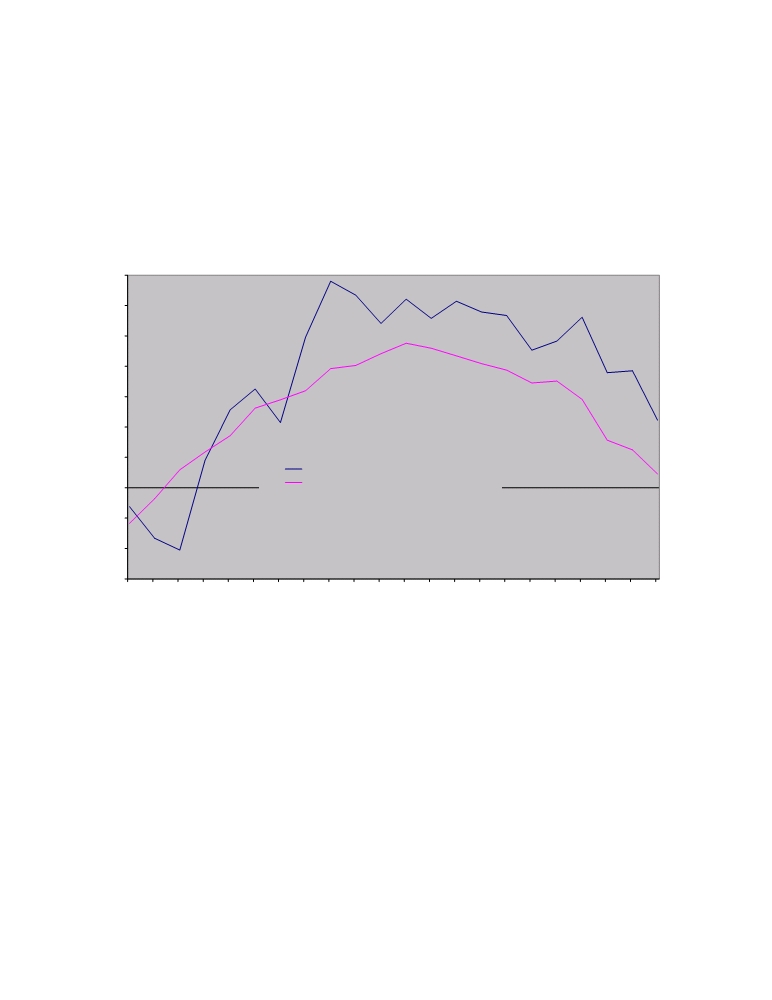


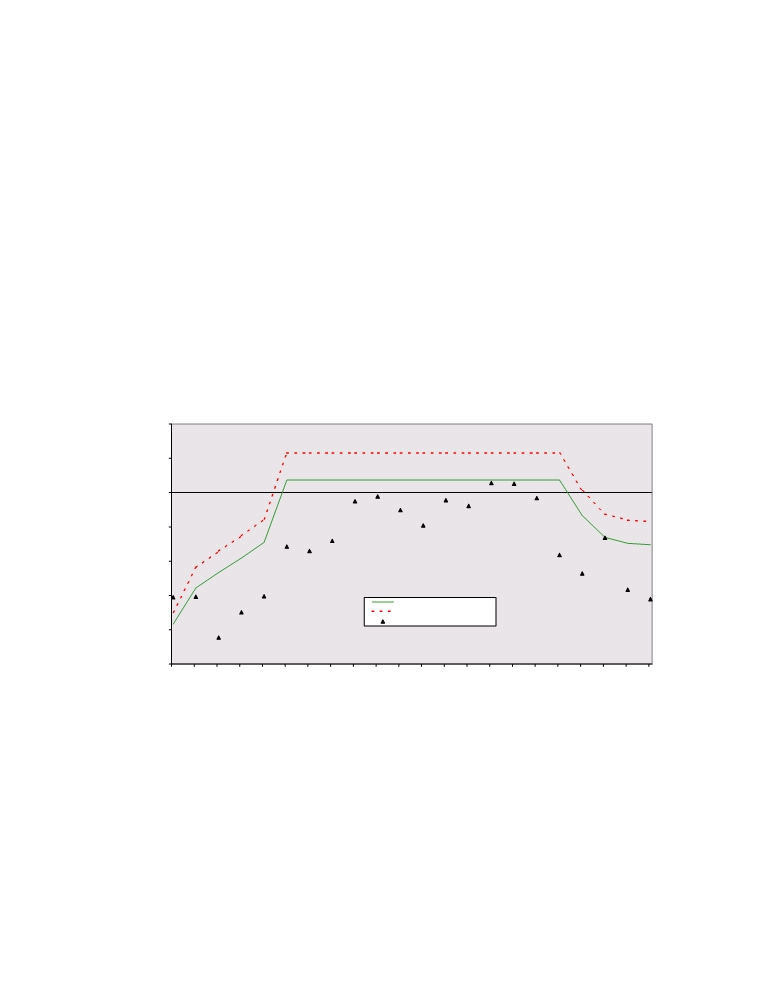
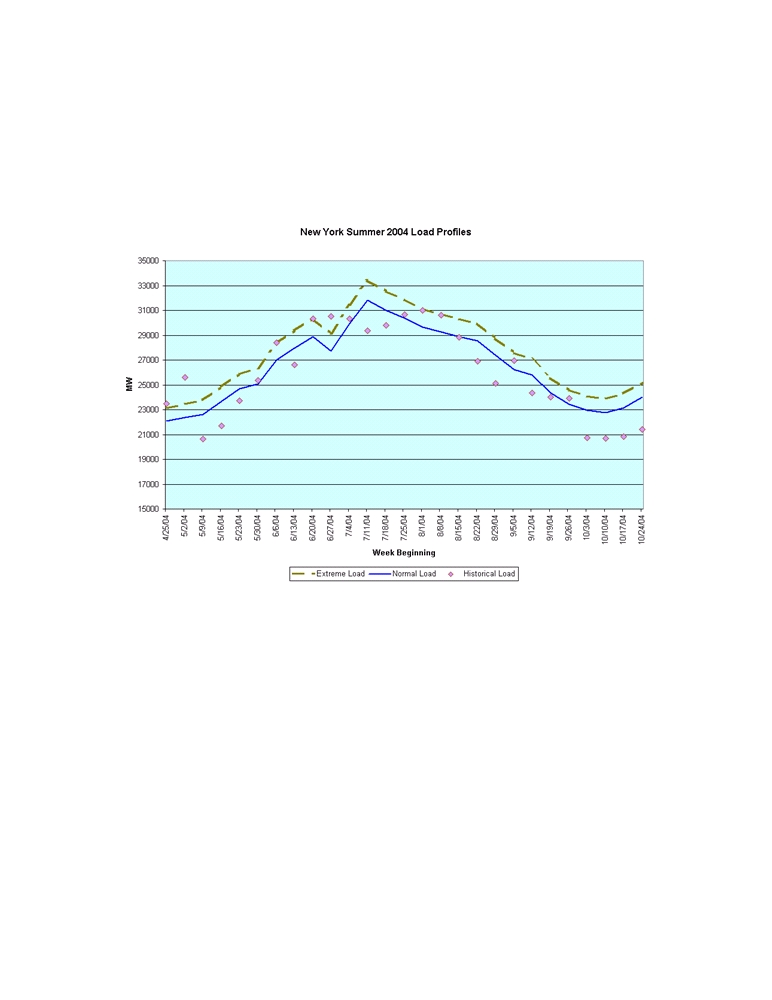


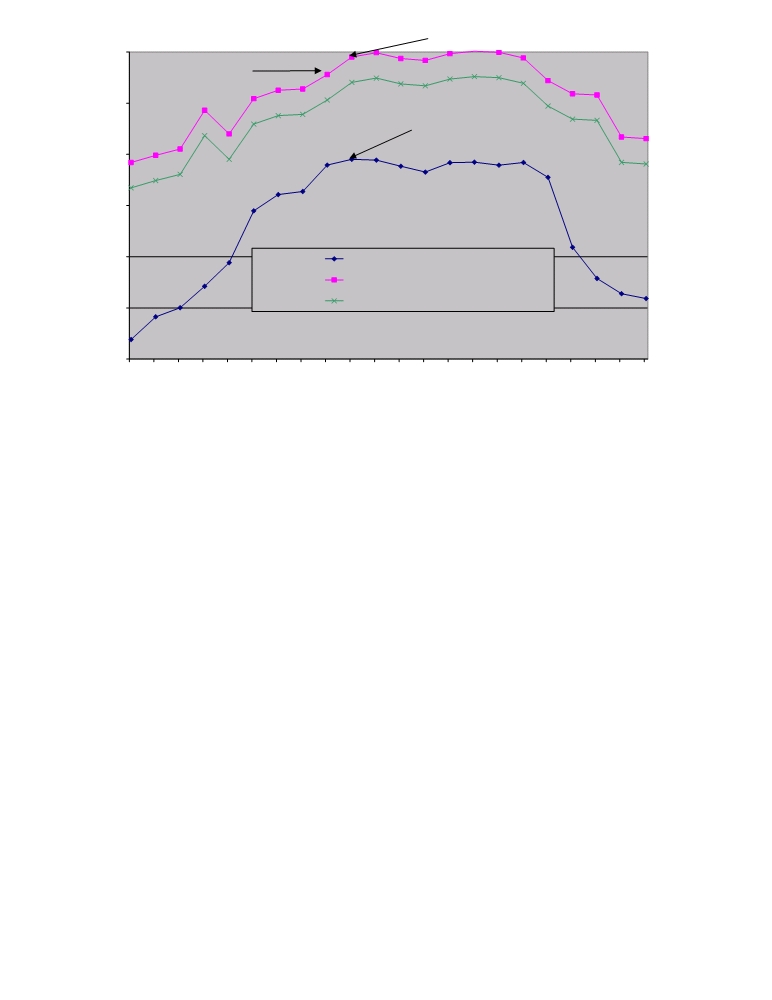


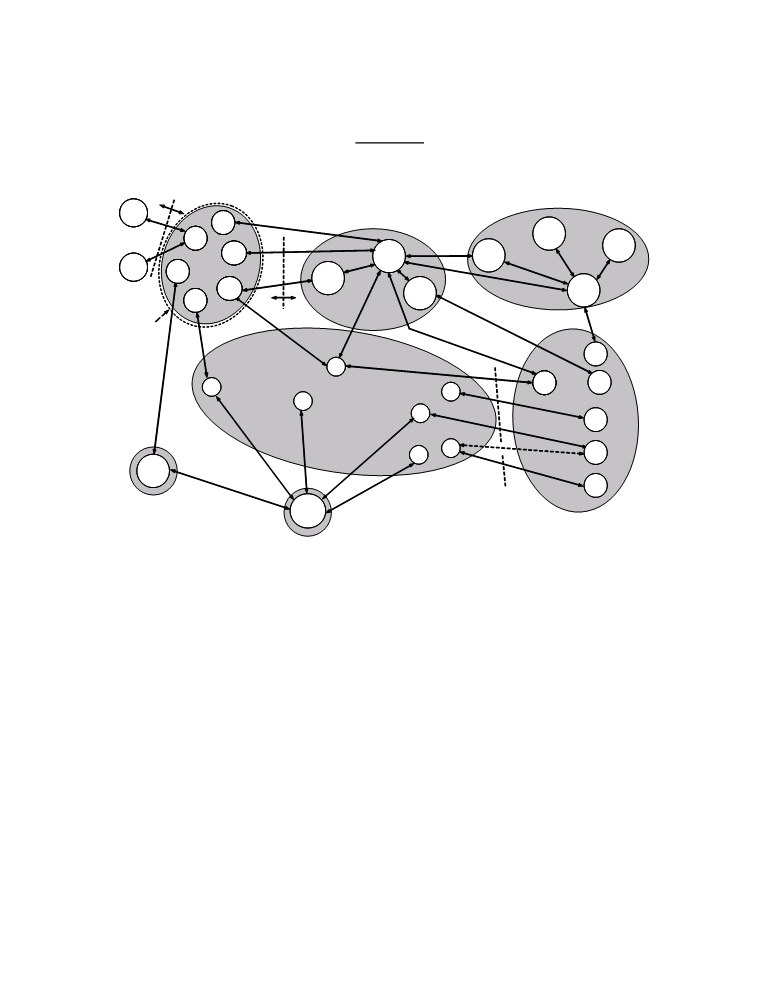


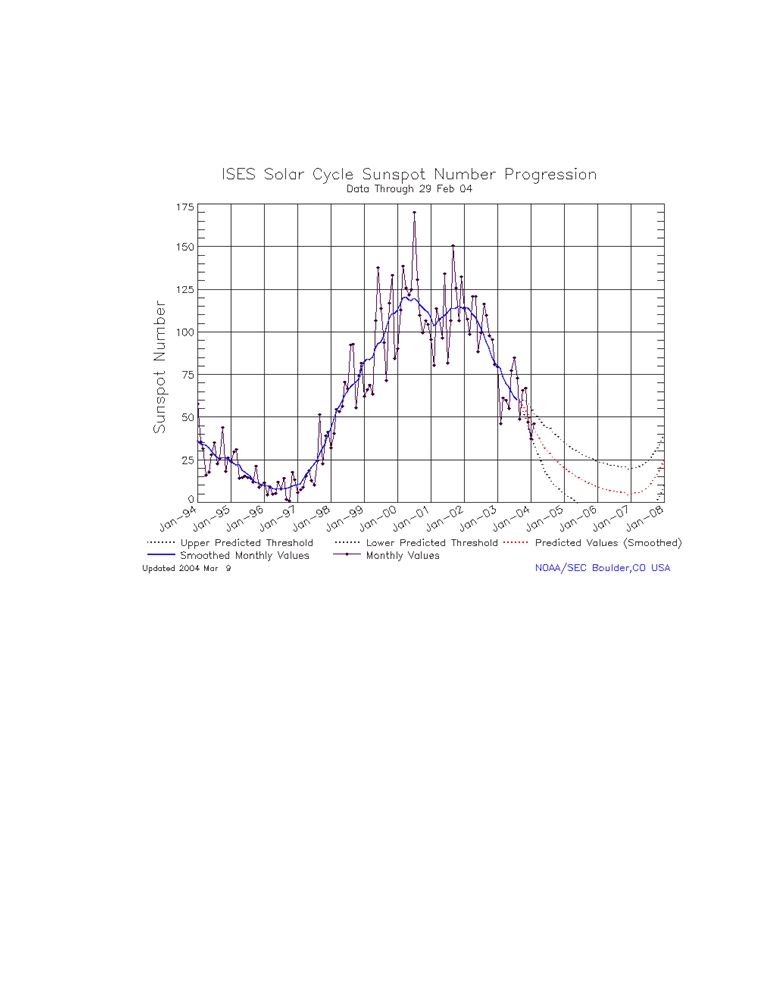


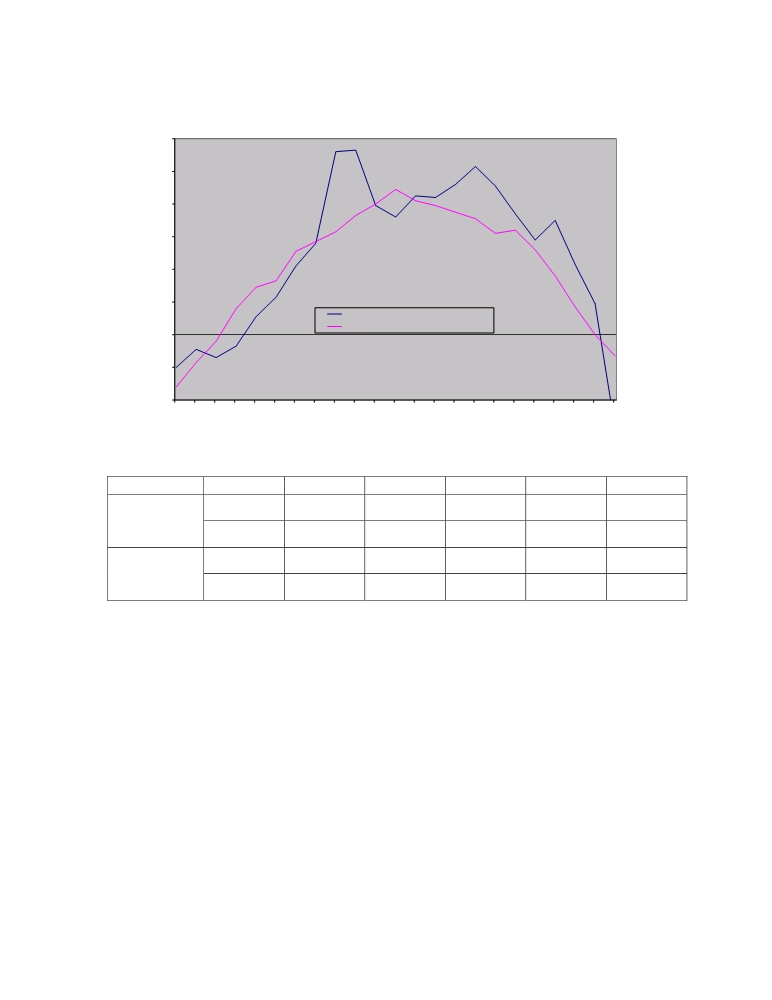
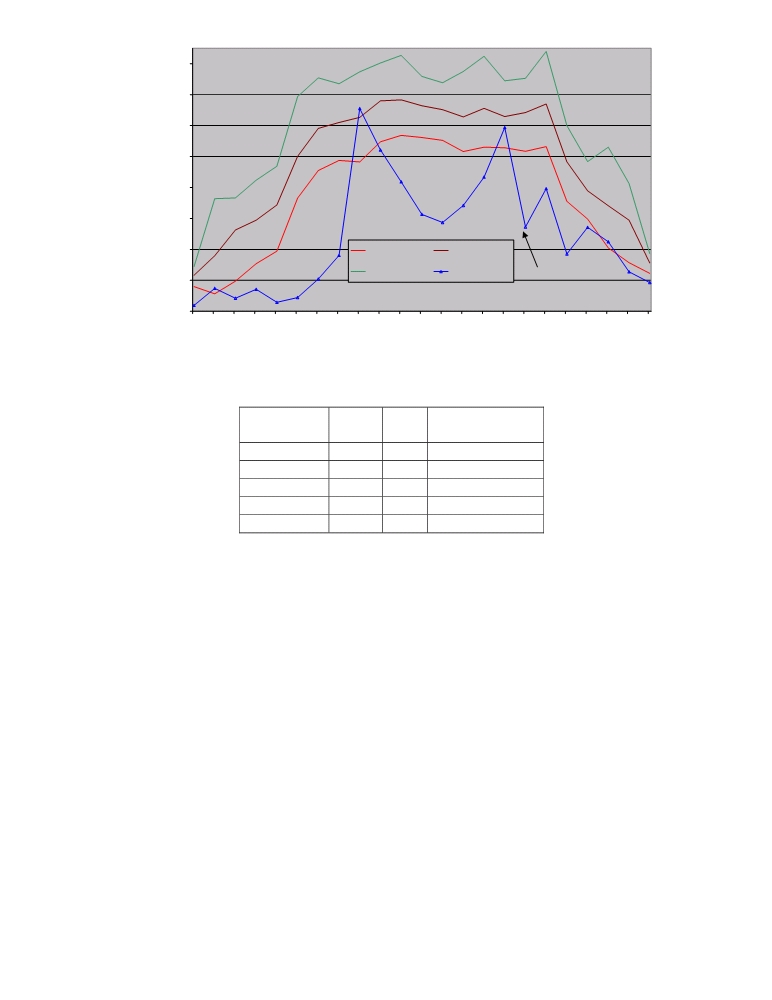


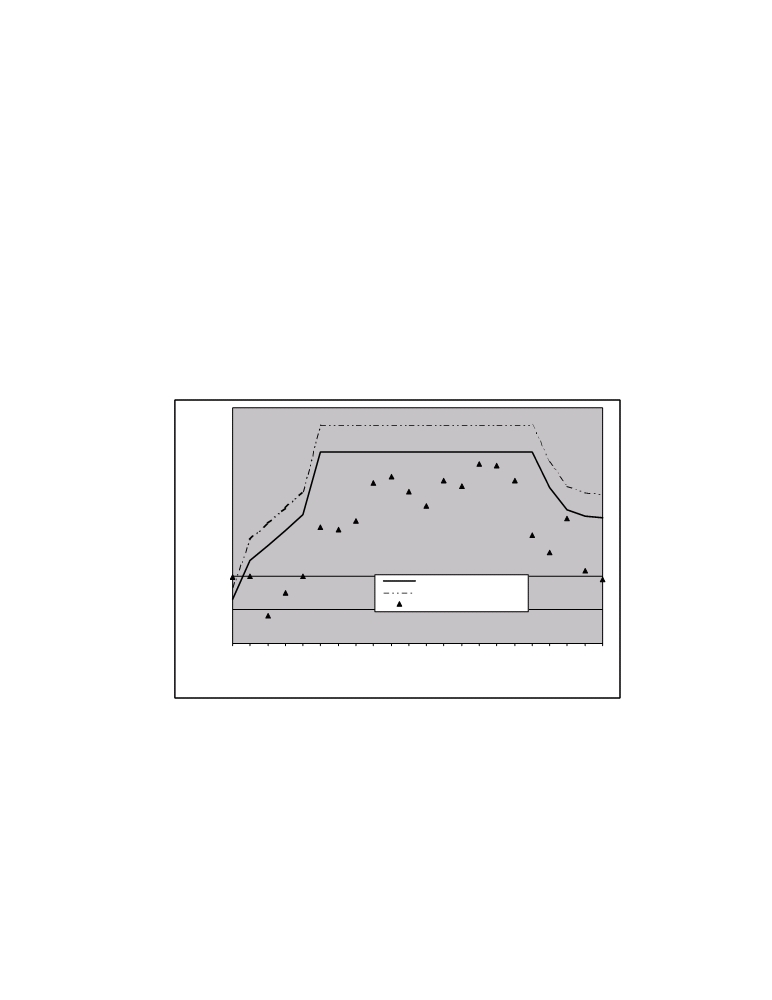
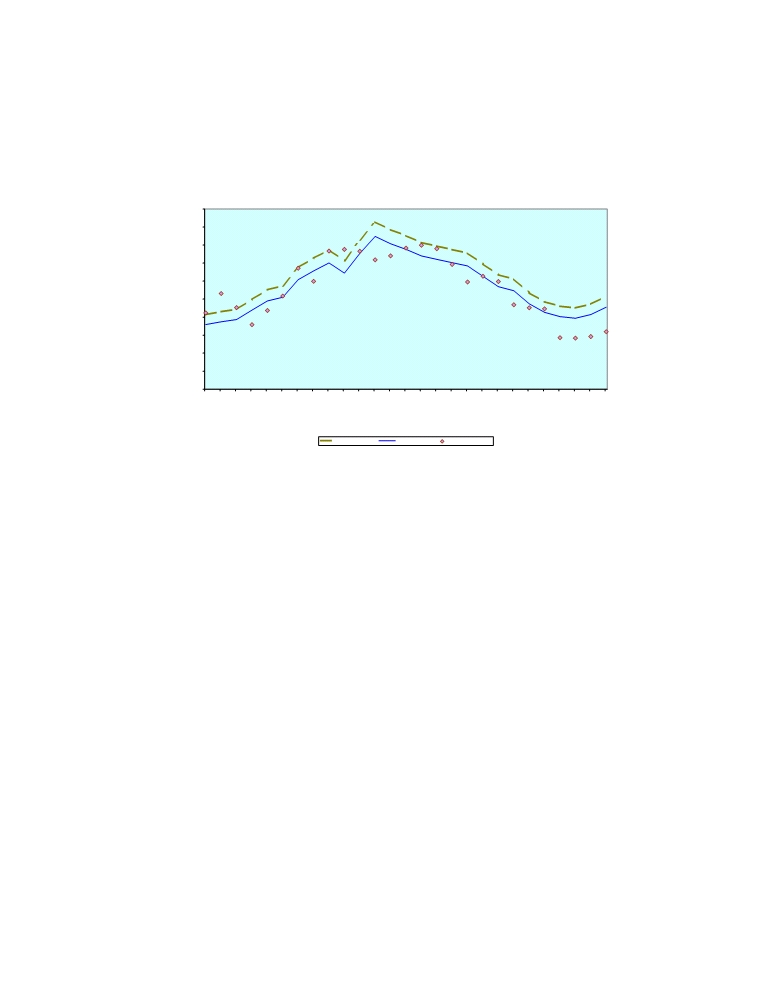
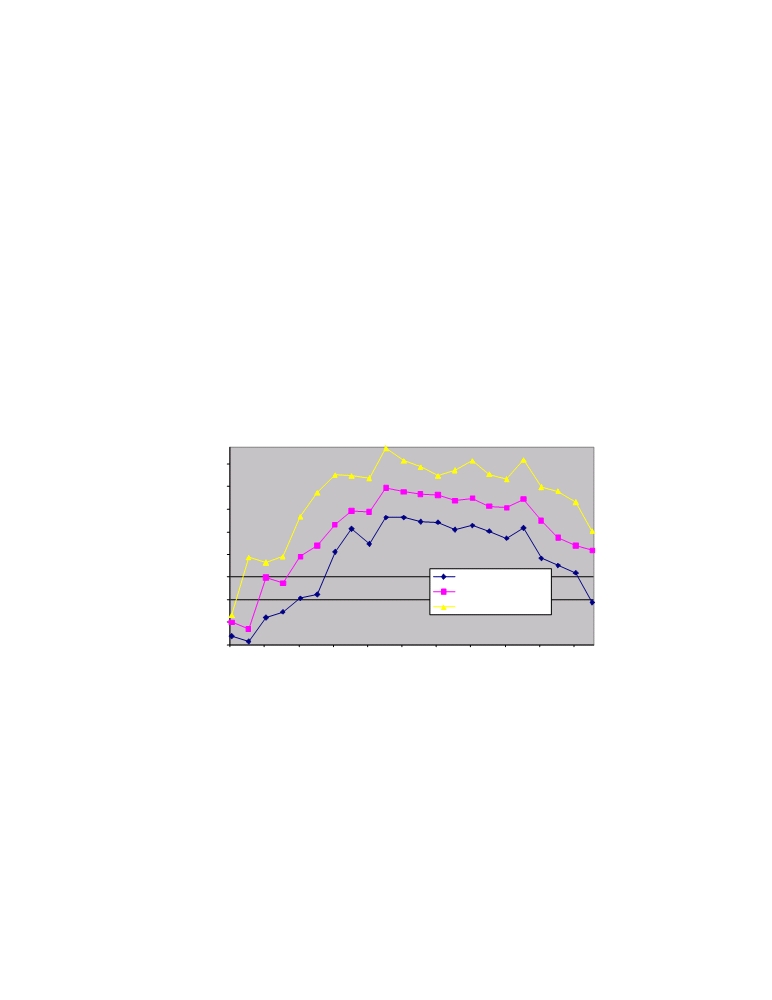


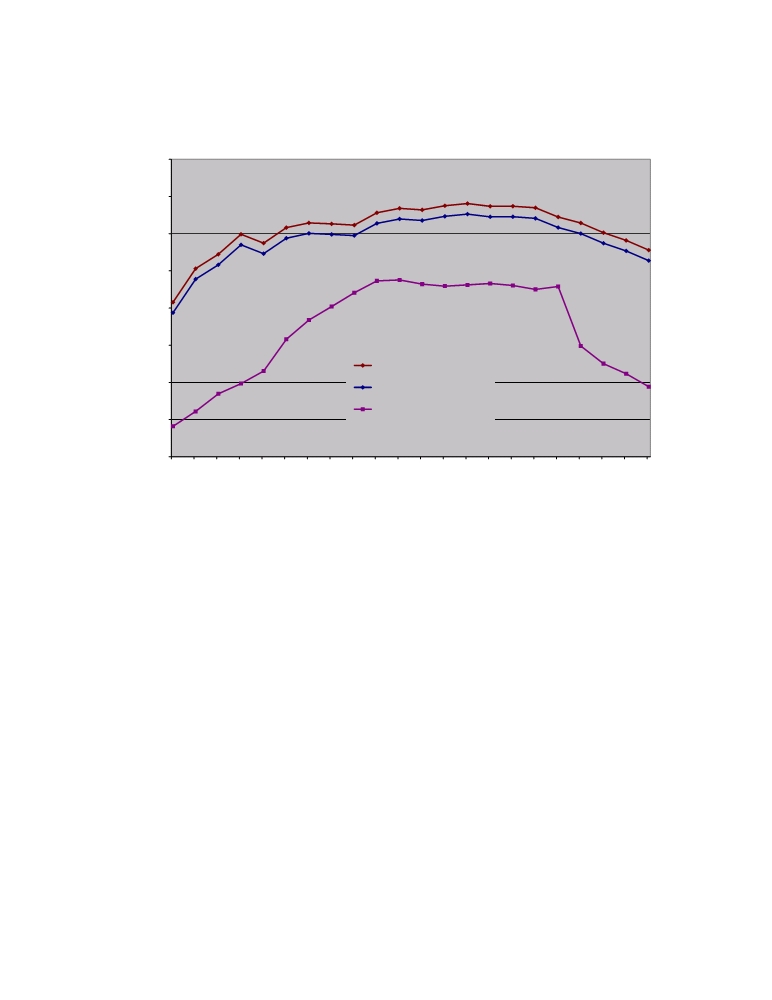


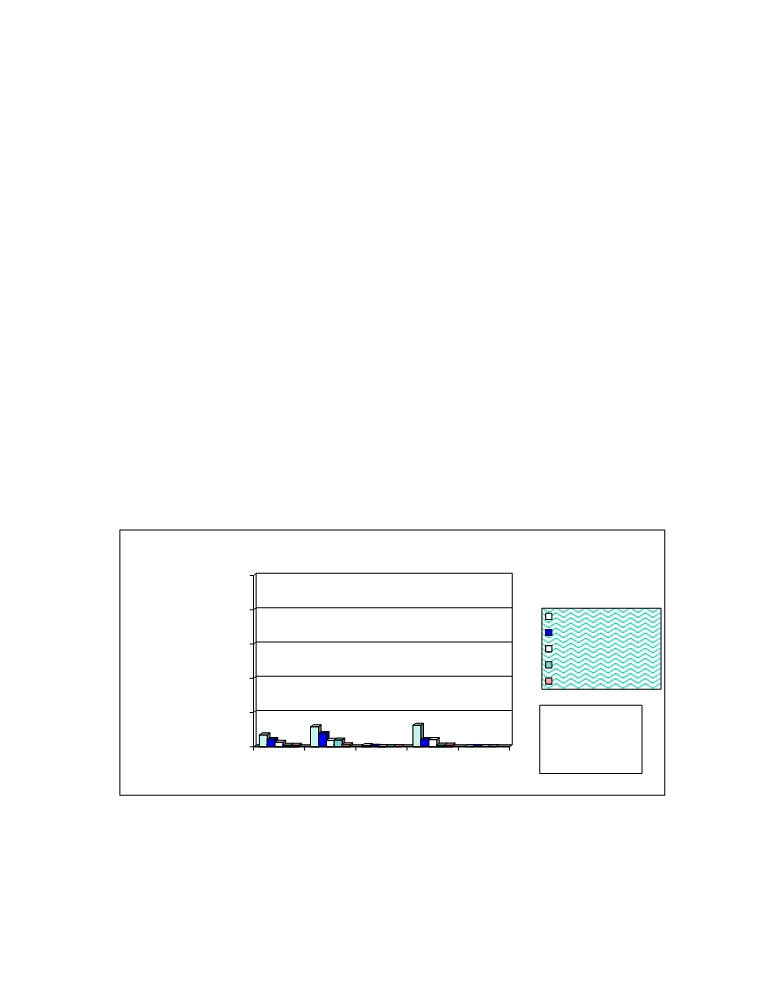
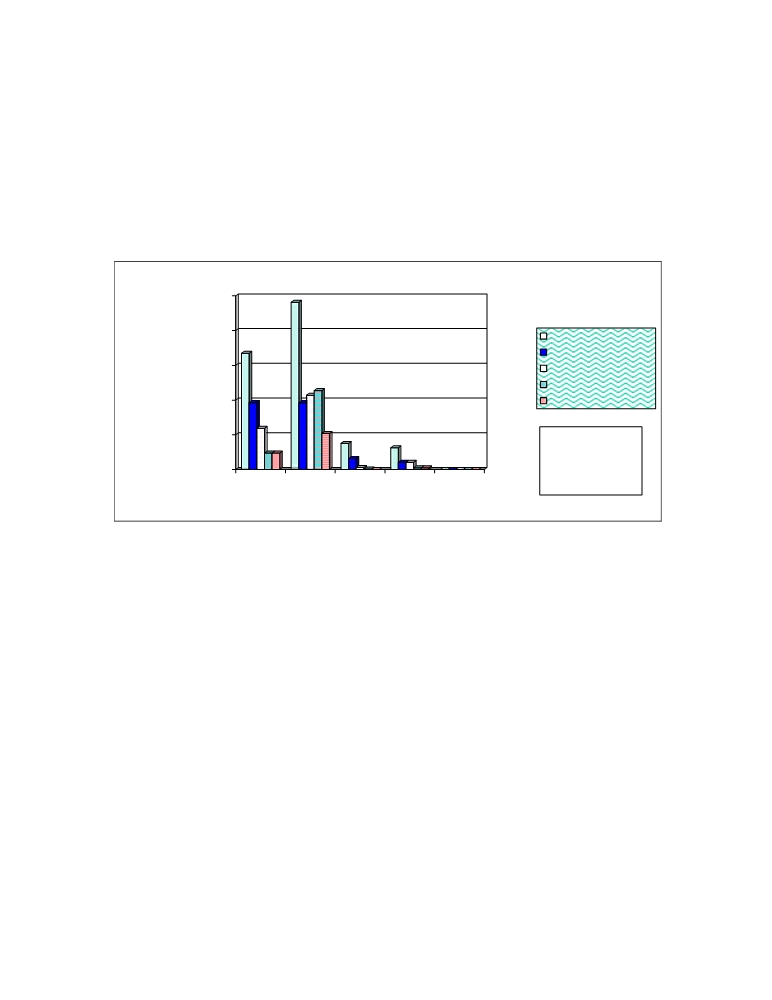

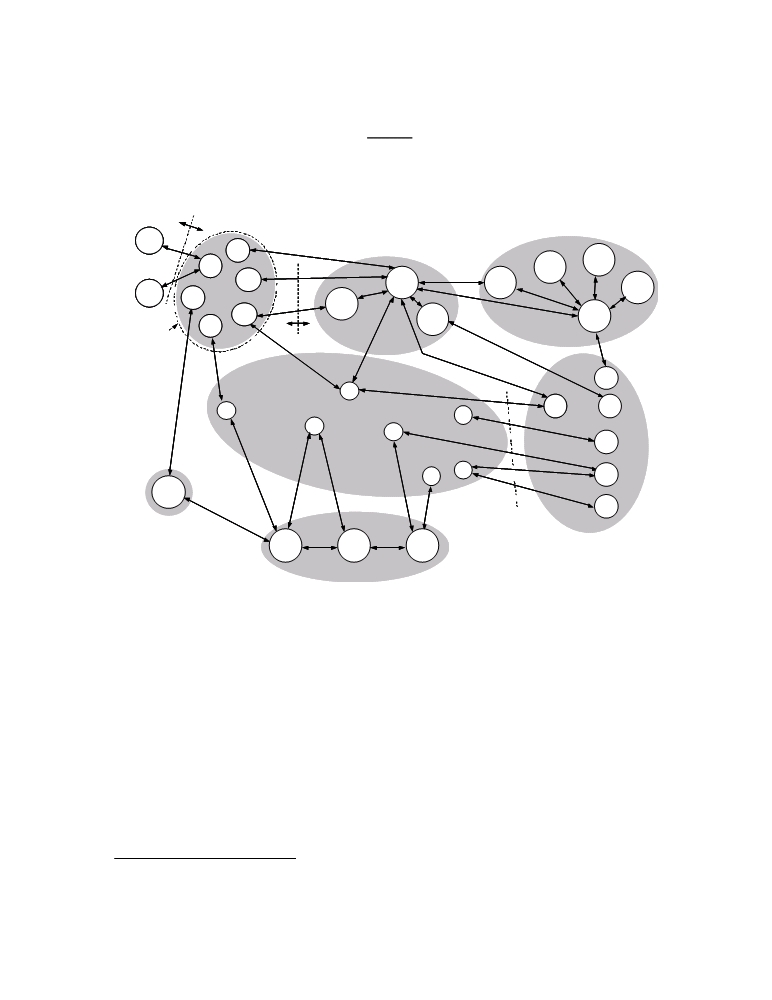


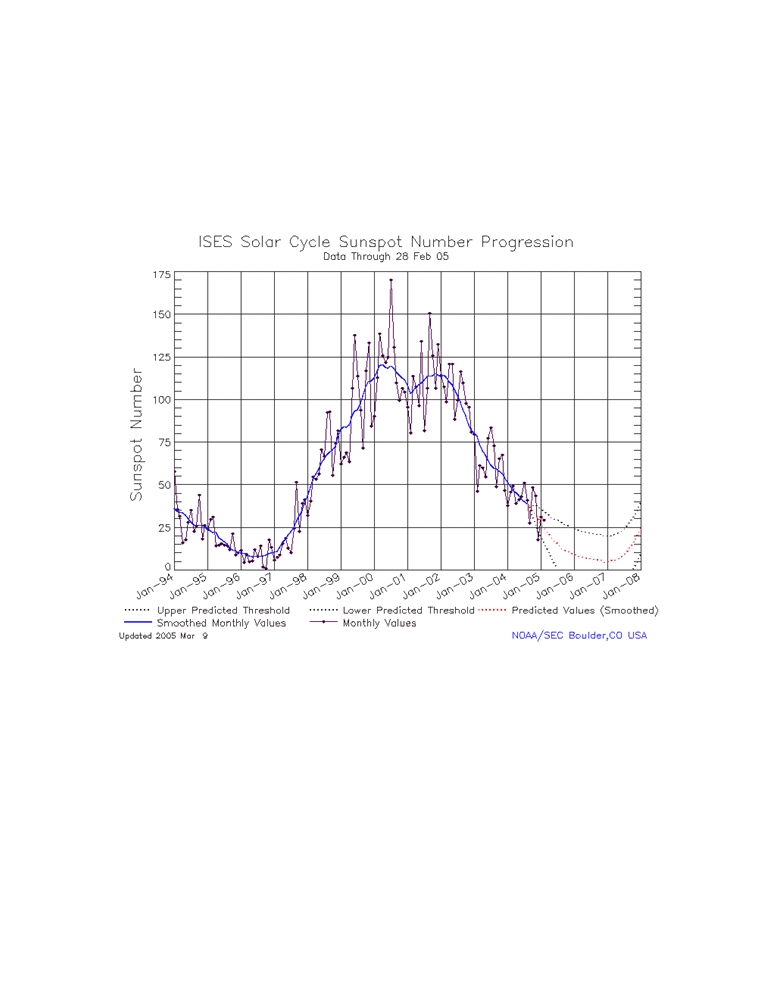


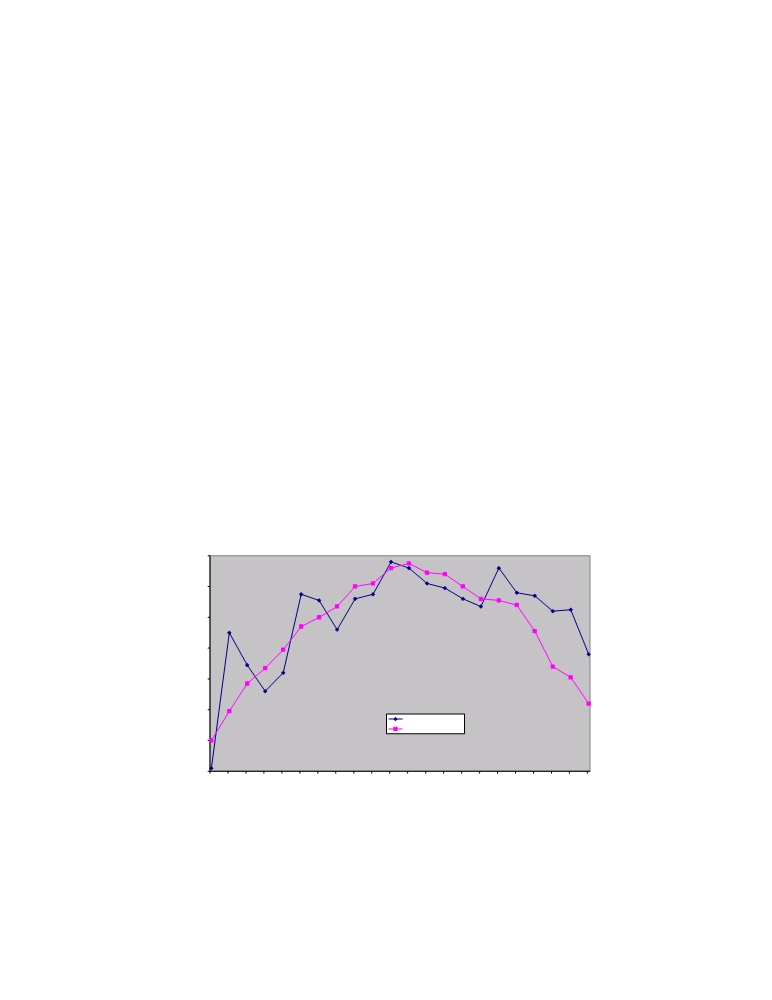
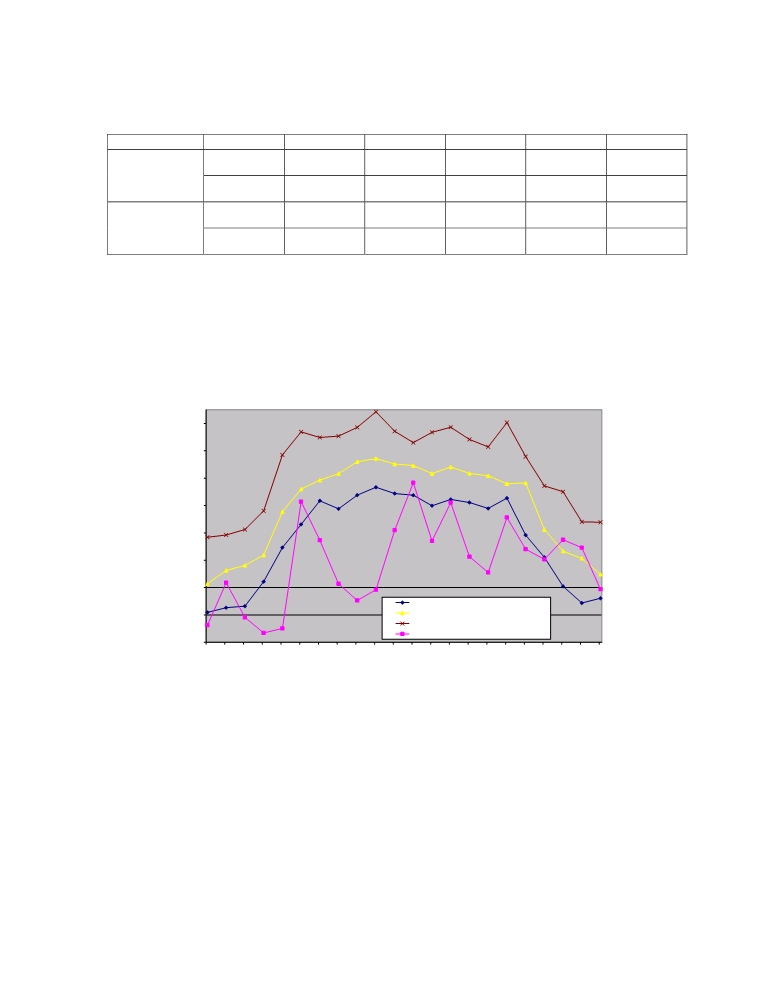

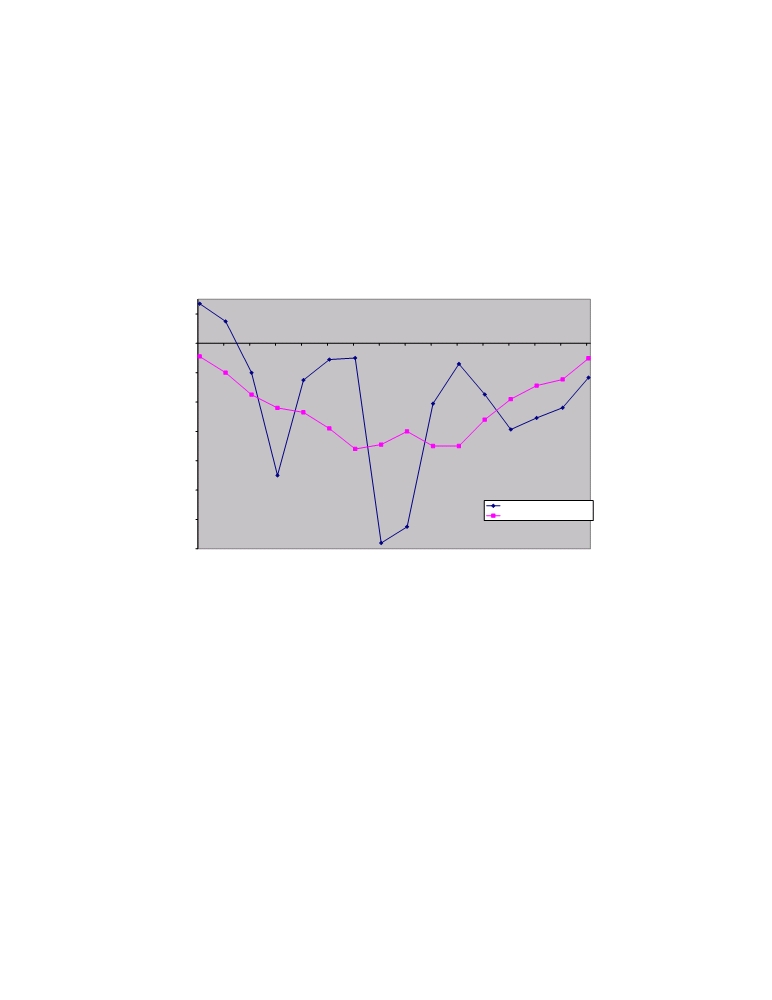
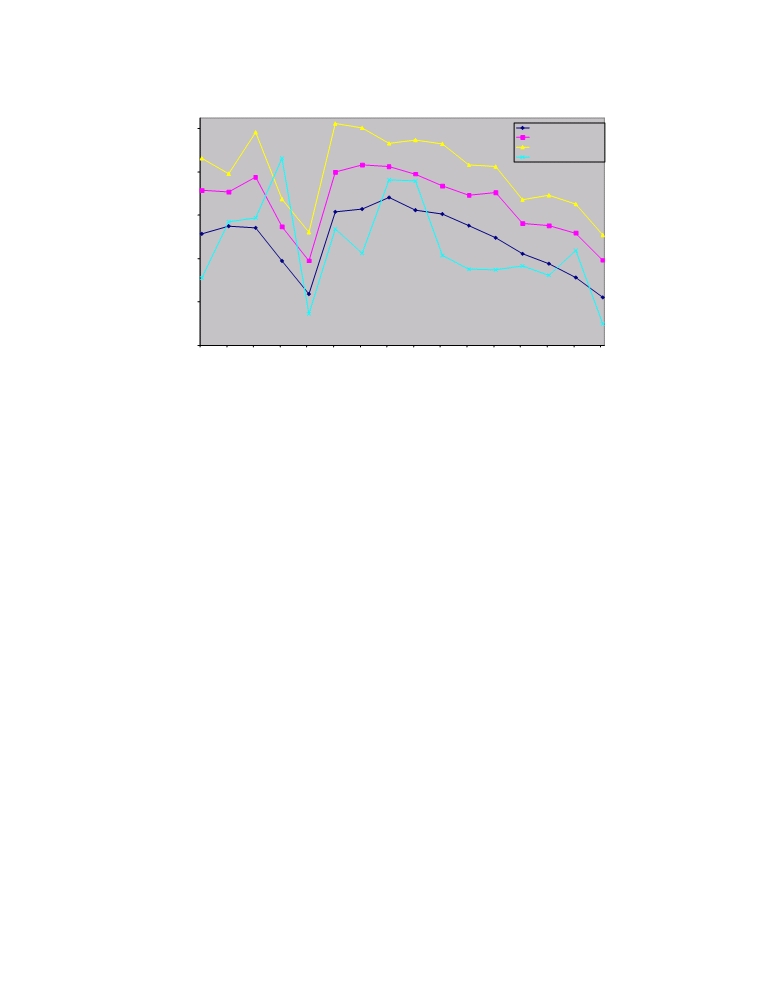


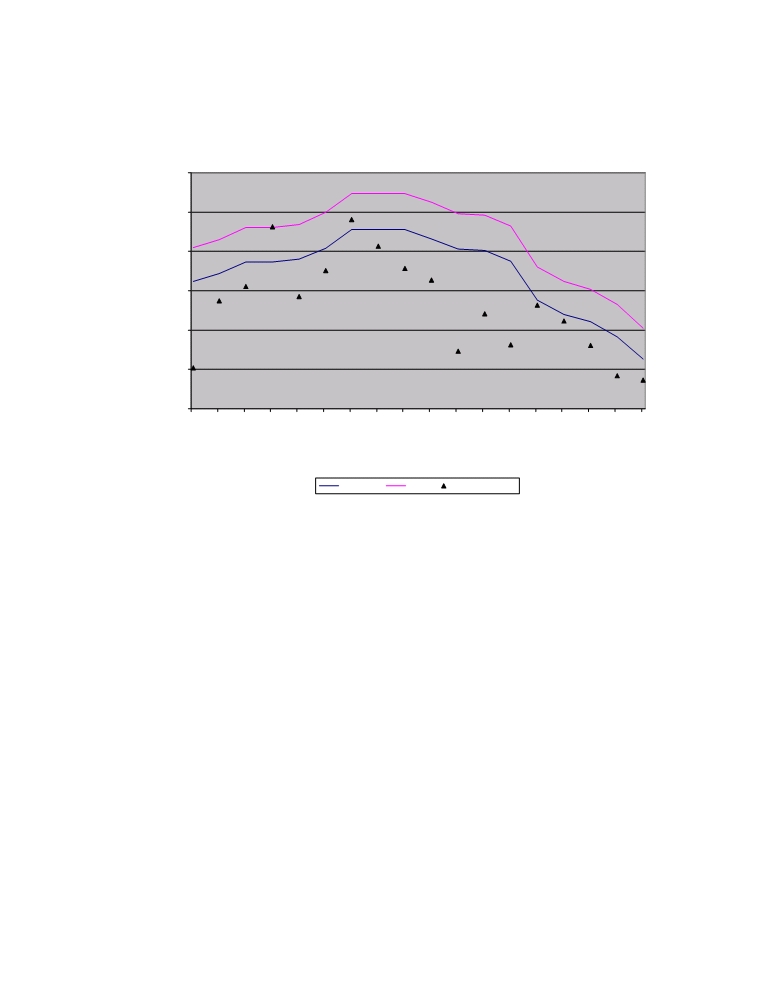
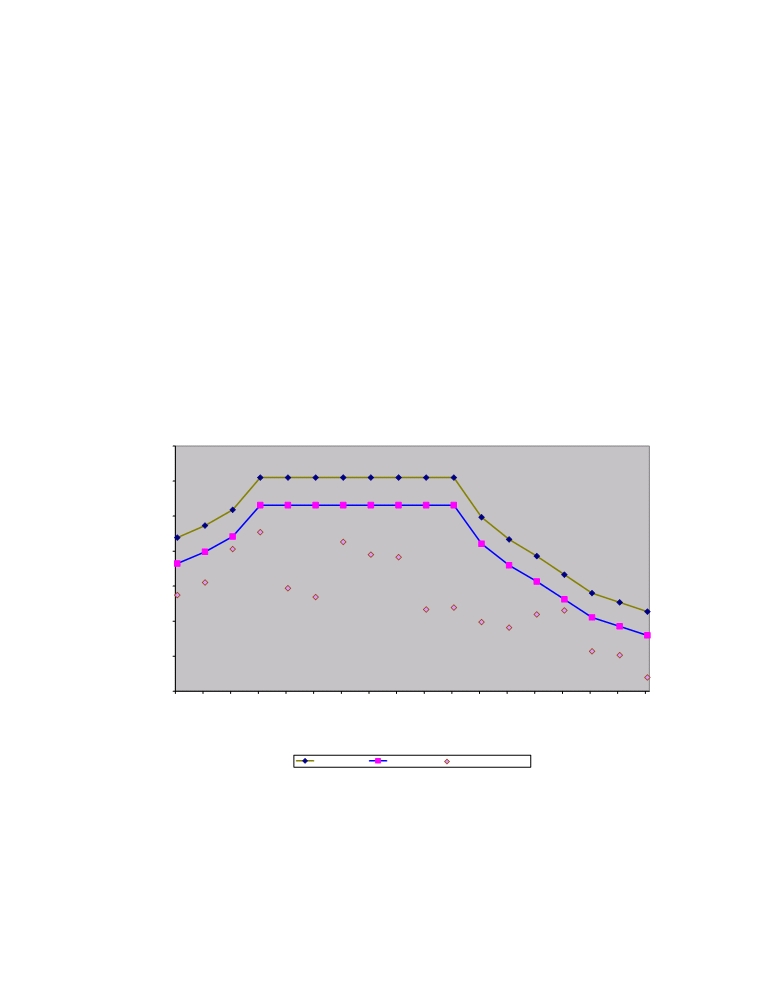

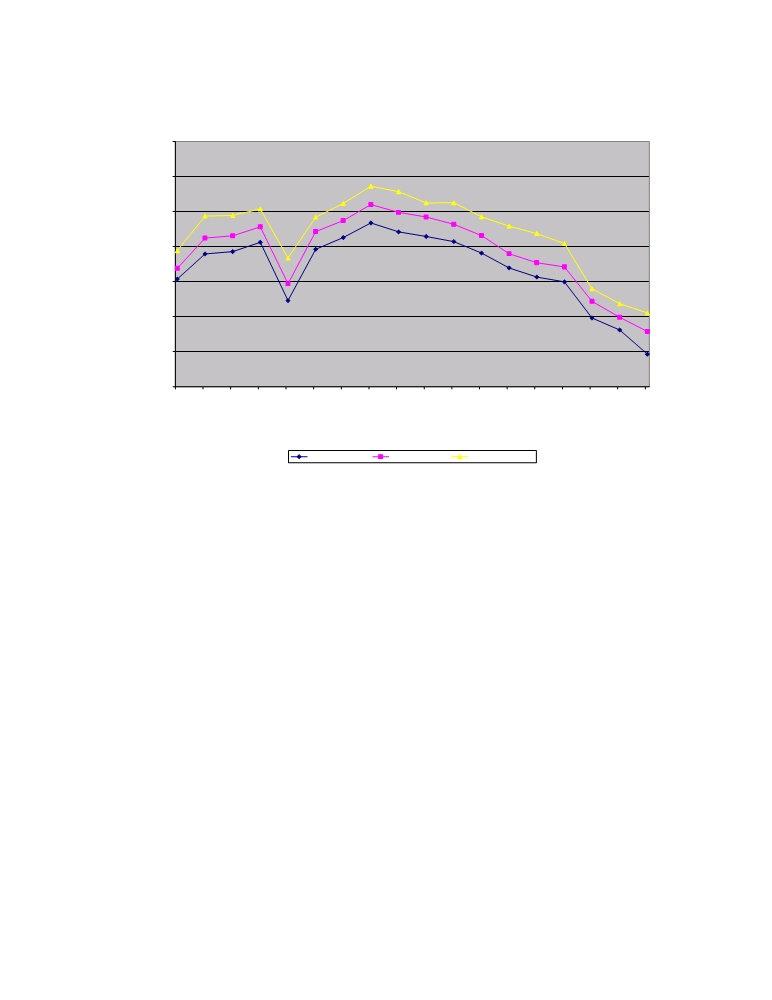
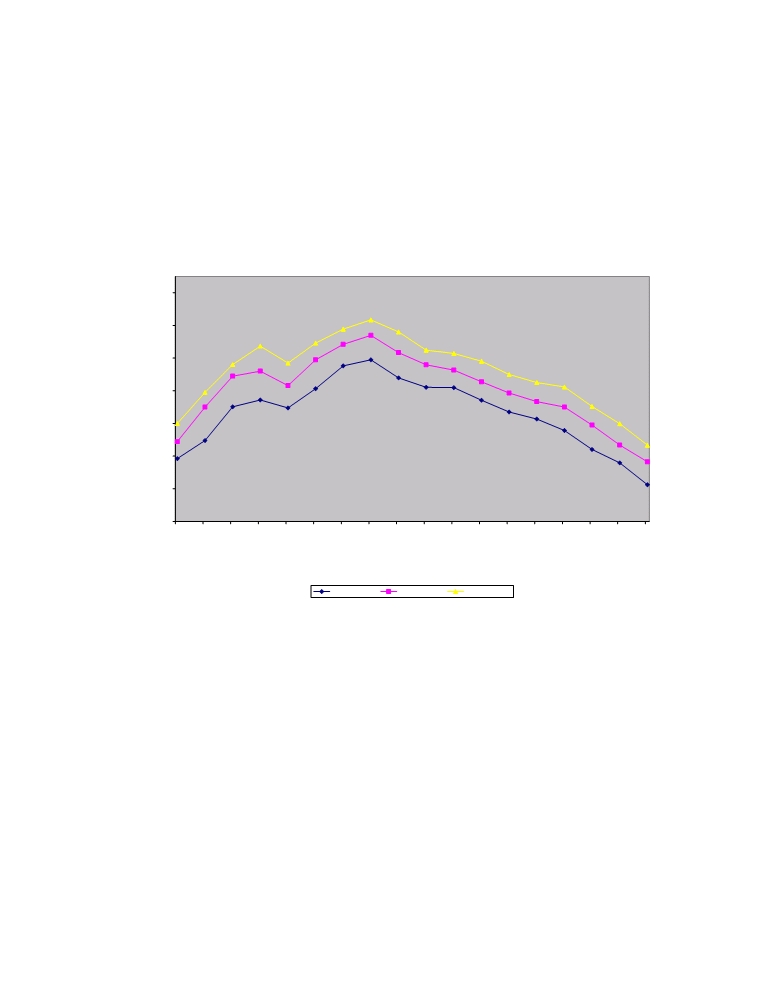


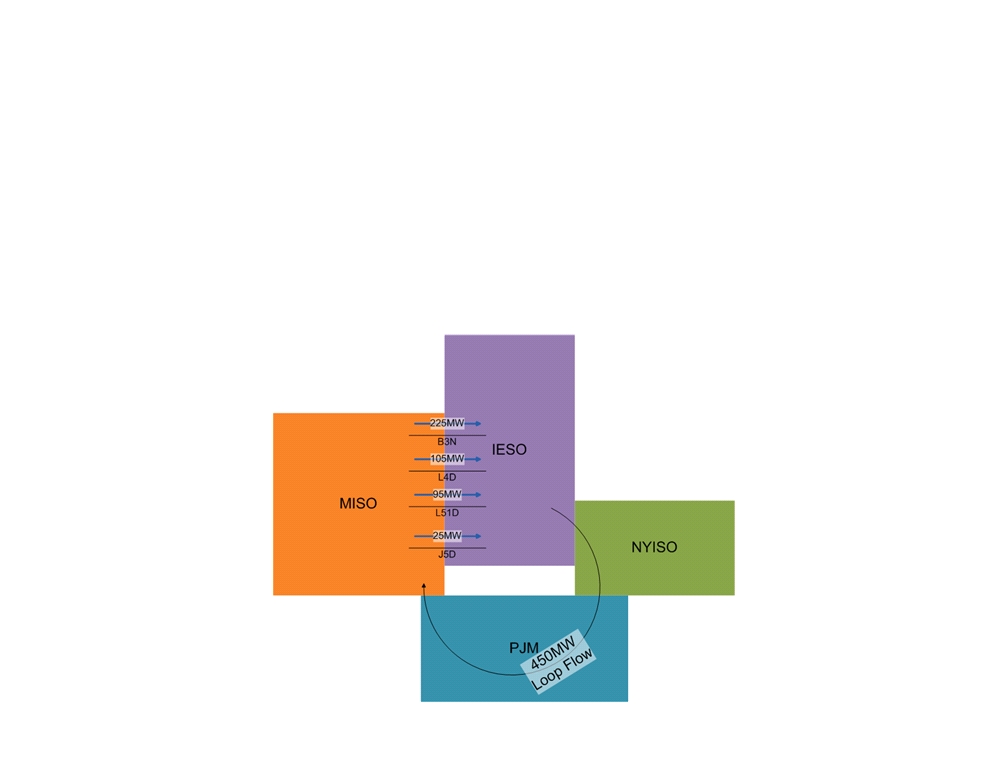

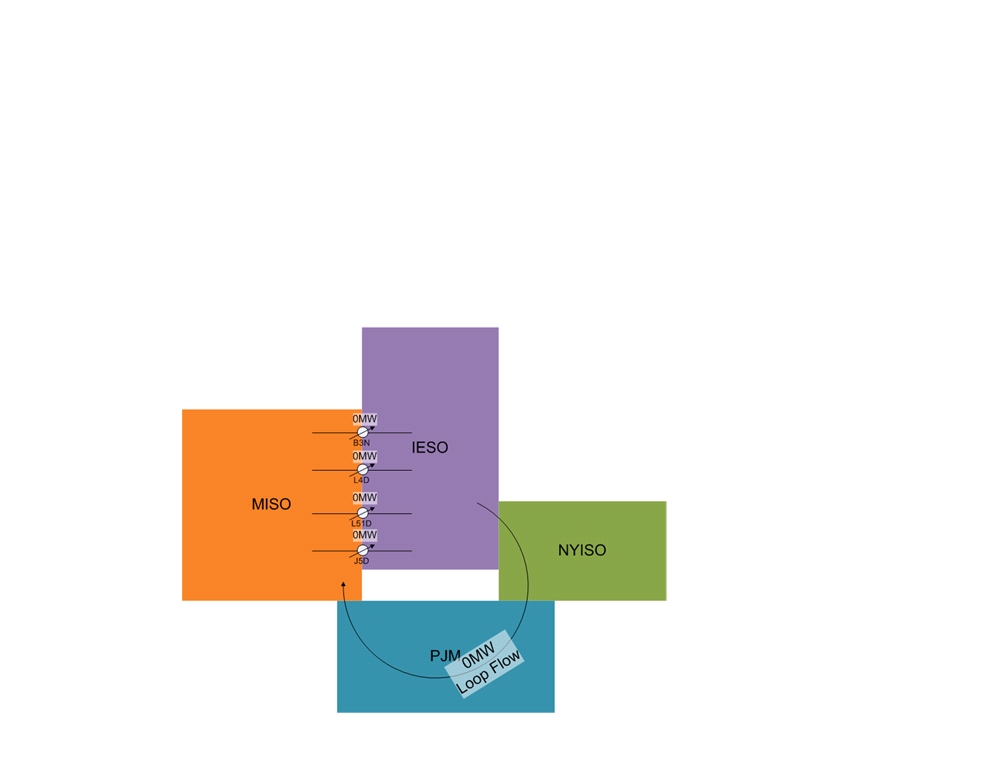


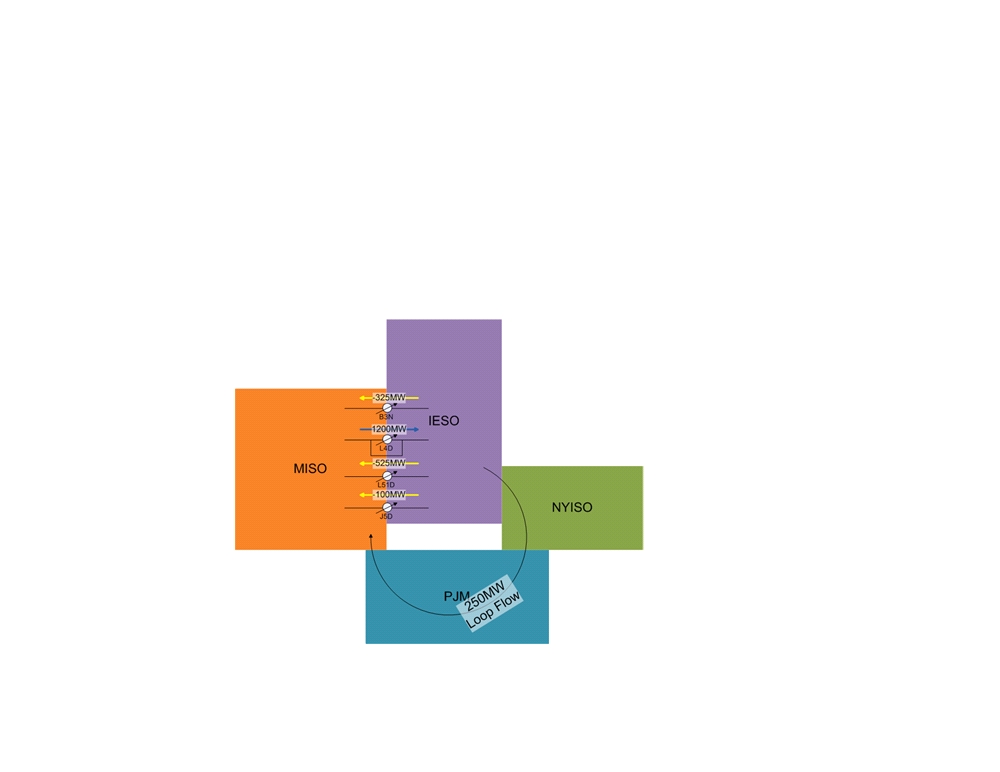


