10 Krey Boulevard Rensselaer, NY 12144
THIS FILING LETTER DOES NOT CONTAIN ANY PRIVILEGED OR CONFIDENTIAL
INFORMATION. REPORT SECTIONS II AND III DO NOT CONTAIN ANY PRIVILEGED OR CONFIDENTIAL INFORMATION. THE BODY OF REPORT SECTION I, AND
SECTION I ATTACHM ENTS I-A THROUGH I-D DO NOT CONTAIN ANY PRIVILEGED OR CONFIDENTIAL INFORMATION. REPORT SECTION I ATTACHMENTS I-E AND I-F CONTAIN PRIVILEGED AND CONFIDENTIAL INFORMATION AND ARE SUMITTED IN A SEPARATE DOCUMENT.
December 20, 2011
Kimberly D. Bose, Secretary
Federal Energy Regulatory Commission 888 First Street, N.E.
Washington, D.C. 20426
Re: Annual Report in Docket Nos. ER01-3001-___, ER03-647-___ and
Request for Privileged Treatment of Attachments 1 and 2 to Report Section I
Dear Ms. Bose:
Enclosed for filing in the above-referenced dockets is the New York Independent System
Operator’s (“NYISO’s”) annual report to the Federal Energy Regulatory Commission (“Commission”) on the NYISO’s Installed Capacity (“ICAP”) Demand Curves and New Generation Projects in the New York Control Area.1 By order dated March 25, 2010, the Commission granted the NYISO
permission to submit this annual report by December 20 of each year2 and by Order dated February 3, 2010, directed the NYISO to file this report for informational purposes only.3
I. List of Documents Submitted
The NYISO submits this report comprised of the following separate sections:
I. Capacity Market Report and Withholding Analysis
II. Report on New Generation Projects
III. New Generation Projects and Net Revenue Analysis
1 New York Independent System Operator, Inc., 117 FERC ¶ 61,086 (2006); New York Independent
System Operator, Inc., 103 FERC ¶ 61,201 (2003), 108 FERC ¶ 61,280 (2004), 121 FERC ¶ 61,090 (2007), 123 FERC ¶ 61,206 (2008). In Docket ER03-647, the NYISO files an annual report regarding its Demand Side Management programs on January 15, and a semi-annual report on its Demand Side Management programs and new generation projects on June 15 each year.
2 New York Independent System Operator, Inc., 130 FERC ¶ 61,237 (2010).
3 New York Independent System Operator, Inc., Order, Docket Nos. ER01-3001 and ER03-647 (Feb. 3,
2010).
Kimberley D. Bose, Secretary December 20, 2011
Page 2
II. Request for Confidential Treatment of Attachments 1 and 2 of Report Section I
In accordance with Sections 388.107 and 388.112 of the Commission’s Regulations,4 Article 6 of the NYISO’s Market Administration and Control Area Services Tariff, Sections 1.0(4) and 4.0 of the NYISO’s Code of Conduct, the NYISO requests Privileged and Confidential treatment of the
contents of Confidential Attachments I-E and I-F of Report Section I (the “Confidential Attachments”). The NYISO also requests that Confidential Attachments be exempted from public disclosure under the Freedom of Information Act (“FOIA”), 5 U.S.C. §522.5
The Confidential Attachments contain privileged and commercially sensitive, and trade secret information that is not made public by the NYISO and that could cause competitive harm to the
affected Market Participants,6 and could adversely affect competition in the markets administered by the NYISO, if publicly disclosed. This information includes the identity of Installed Capacity
Suppliers and offers, and the basis therefor, and costs of the Installed Capacity Suppliers. This
confidential, commercially sensitive information is exempt from disclosure under 5 U.S.C. §522(b)(4). For this reason, the NYISO requests that the contents of Confidential Attachments received Privileged and Confidential treatment and be exempt from FOIA disclosure.
The NYISO requests waiver of any obligation it may have under the Commission’s regulations or the Secretary’s rules to submit a redacted version of the Confidential Attachments. The NYISO
incorporated into the body of Report Section I a masked or aggregated version of the information that is contained in the Confidential Attachments and thereby makes publicly available the information
contained in Confidential Attachments that is not confidential and commercially sensitive. In that
regard, the NYISO has provided a redacted version of the information contained in the Confidential Attachments within the body of the report.
The Confidential Attachments I-E and I-F are submitted separately and are identified and
marked in accordance with the Commission’s regulations and rules published by the Secretary’s Office for submitting Privileged information.
4 18 C.F.R. §§ 388.107, 388.112 (2010).
5 The information provided by the NYISO for which the NYISO claims an exemption from FOIA disclosure is labeled “Contains Privileged Information - Do Not Release.”
6 Terms with initial capitalization not defined herein have the meaning set forth in the NYISO’s Market Administration and Control Area Services Tariff.
Kimberley D. Bose, Secretary December 20, 2011
Page 3
III. Correspondence
Copies of correspondence concerning this filing should be addressed to:
Robert E. Fernandez, General Counsel
Raymond Stalter, Director of Regulatory Affairs *Gloria Kavanah, Senior Attorney
New York Independent System Operator, Inc.
10 Krey Boulevard
Rennselaer, N.Y. 12144
Tel: (518) 356-6000
Fax: (518) 356-4702
rfernandez@nyiso.com
rstalter@nyiso.com
gkavanah@nyiso.com
* persons designated to receive service.
Respectfully submitted,
/s/
Gloria Kavanah
Counsel for
New York Independent System Operator, Inc.
cc:Michael A. Bardee
Gregory Berson
Connie Caldwell
Anna Cochrane
Jignasa Gadani
Lance Hinrichs
Jeffrey Honeycutt
Michael Mc Laughlin
Kathleen E. Nieman
Daniel Nowak
Rachel Spiker
CERTIFICATE OF SERVICE
I hereby certify that I have this day served the foregoing document upon each person
designated on the official service list compiled by the Secretary in this proceeding in accordance with the requirements of Rule 2010 of the Rules of Practice and Procedure, 18 C.F.R. §385.2010.
Dated at Rensselaer, NY this 20th day of December, 2011.
/s/ Joy A. Zimberlin
Joy A. Zimberlin
New York Independent System Operator, Inc
10 Krey Blvd.
Rensselaer, NY 12114 (518) 356-6207
Contents
I.Capacity Market Report and Withholding Analysis.................1
A. Overview..............................................................1
B. Recent Installed Capacity Auction Results....................................4
C. Potential Withholding in the Capacity Markets.................................9
1. All Regions in the NYCA..............................................9
Unoffered Capacity...............................................11
Unsold Capacity.................................................12
2. New York City Locality..............................................14
3. ROS Capacity Market................................................16
Additional Details................................................16
Analysis of Unoffered Capacity......................................19
Analysis of Unsold Capacity........................................21
i. Monthly Price Impacts........................................21
ii. Class Average Going Forward Costs............................22
iii. Unsold Capacity Impact Analysis..............................25
iv. Conclusions...............................................27
Attachment I-A. Unsold Capacity Offers (Masked)
Attachment I-B. Existing Generating Facilities
Attachment I-C. Class Average Avoidable Costs
Attachment I-D. Class Average Going Forward Costs
Confidential Attachment I-E. Unsold Capacity Offers (Unmasked)
Confidential Attachment I-F. Market Participant Explanations
II.Report on New Generation Projects...........................40
Attachment II-A. Interconnection Queue
III.New Generation Projects and Net Revenue Analysis................47
Proposed Resource Additions................................................48
Revenue Analysis.........................................................49
Attachment III-A. ICAP Auction Activity
i
Charts
Chart 1. NYCA Market Clearing Prices............................................6
Chart 2. NYCA Offered MW....................................................6
Chart 3. NYC Market Clearing Prices..............................................7
Chart 4. NYC Offered MW......................................................7
Chart 5. Long Island Market Clearing Prices........................................8
Chart 6. Long Island Offered MW.................................................8
Chart 7. Average Percent of Unoffered MW........................................11
Chart 8. Average Percent of Unsold Capacity.......................................12
Chart 9. In-City Mitigation Results 2011..........................................15
Chart 10. NYC Generator and SCR UCAP.........................................16
Chart 11. ROS Capacity Available, Offered, Sold and Exported........................17
Chart 12. NYISO Interconnection Queue Projects...................................47
Chart 13. UCAP-based Revenue Margins..........................................55
Chart 14. UCAP-based Capacity Margins..........................................55
Chart 15. Capacity Market Revenues Relative to CONE Requirements...................56
Tables
Table 1. Unoffered and Unsold Capacity by Locality.................................13
Table 2. ROS Unoffered and Unsold Capacity MW by Type of Market Participant.........18
Table 3. Maximum Price Impact of Unoffered Capacity..............................21
Table 4. Maximum Price Impact of ROS Unsold MW................................22
Table 5. Going Forward Cost Definitions..........................................23
Table 6. Unsold MW Used for GFC Calculations....................................25
Table 7. Price Impact Analysis Results............................................27
Table 8. June 2011 Status of the 2008 CRP Market - Based Solutions and TOs’ Plans.......49
Table 9. Available Capacity vs. Required Capacity..................................50
Table 10. Annual Revenue Requirements in UCAP Terms ($/MW).....................51
Table 11. Benchmark Annual Revenues in UCAP Terms ($/MW).......................53
Table 12. Revenue Margins.....................................................53
ii
I.Capacity Market Report and Withholding Analysis
A. Overview
This report (the “December 2011 Report”) reviews the outcomes of the Installed Capacity
markets administered by the New York Independent System Operator (“NYISO”), assesses the effectiveness of the Installed Capacity1 (“ICAP”) Demand Curves in attracting investment in
new generation, and examines potential withholding activity in the NYISO-administered
Capacity auctions for the three Capacity regions in the New York Control Area (“NYCA”): New York City (“NYC”), Long Island (“LI”), and the Rest of State (“ROS”).2 The December 2011
Report covers the Winter 2010-2011 and Summer 2011 Capability Periods, which span from
November 2010 through October 2011. Similar NYISO reports previously filed cover earlier
periods. The analyses conducted for this report are consistent with the methodology established and first used for the report filed January 15, 2010 in these dockets3 covering November 2008
through October 2009 (“January 2010 Report”).
Capacity prices during the Winter 2010-2011 Capability Period exhibited less variation than the previous Winter Capability Periods for the NYCA, and the NYC and Long Island
Localities. The addition of Capacity and an increase in Capacity imports into the NYCA, Long Island and NYC led to historically lower auction prices during the Winter Capability period. Auction prices for the Long Island Locality were set by the NYCA Market-Clearing Price in all six months of the Winter Capability Period.
During the Summer 2011 Capability Period, ICAP auction clearing prices in NYC
exhibited large variation, but on average, were consistent with clearing prices from previous Summer Capability Periods. The average NYC ICAP Spot Market Auction price for Summer 2011 was $4.64/kW-month lower on average than the Summer 2010 average, which was mostly driven by increased Capacity in NYC. Summer 2011 Capacity prices in Long Island and for the NYCA were also lower on average than prices in Summer 2010. The Long Island price was set by the NYCA price for the all months except for September.
1 Terms in upper case not defined herein shall have the meaning set forth in the NYISO’s Market Administration and Control Area Services Tariff (“Services Tariff”).
2 The NYISO administers three Capacity auctions: NYCA, New York City, and Long Island. References in this report to the Rest of State are to the geographic area within the NYCA that excludes the New York City and Long Island Localities.
3 See New York Independent System Operator, Inc.’s Updated Status Report on Stakeholder Discussions Regarding Annual Installed Capacity Demand Curve Reports and Plan for Future Reports (“NYISO Updated Status Report”) at p. 4 (filed with the Commission in these dockets on November 12, 2009). Section I. C. 3. of this report contains an updated analysis of NYCA unsold capacity.
Page 1
For the December 2011 Report period, there was minimal change in the proportion of
Load Serving Entity (“LSE”) Capacity requirements being met from purchases in the NYISO-
administered Capacity markets versus other sources, such as bilateral contracts, when compared
to previous reporting periods. In UCAP terms, in the Winter 2010-2011 Capability Period,
47.31% of LSE Capacity requirements were met through bilateral purchases, while the remaining percent of LSE obligations were met through the NYISO-administered auctions. Similarly, in the Summer 2010 Capability Period, 48.39% of LSE capability requirements were met through bilateral purchases, while the remaining LSE obligations were satisfied through purchases made in the NYISO-administered auctions.
In the NYC and LI Localities, the seasonal average quantities of unsold and unoffered
capacity were less than two percent of available supplies (see Charts 7 and 8). Unsold and
unoffered capacity quantities from ROS resources were about 5.5 percent in Winter 2010-2011
and 3.2 percent in Summer 2011.4 The ICAP offered and purchased in NYCA and each of the
two Localities exceeded the Locational Minimum Installed Capacity Requirements, and prices
have been below the net cost of new entry (“Net CONE”) reflected on the ICAP Demand
Curves.
Overall, the clearing prices resulting from the ICAP Demand Curves in the ICAP Spot
Market Auctions support the conclusion that the ICAP Spot Market Auctions continue to be
attractive to Installed Capacity Suppliers. It continues to be difficult to correlate the effects of
the ICAP Demand Curves on investment in new generation in the NYCA mainly because over
the past several years New York has had Capacity available in excess of the Locational
Minimum Installed Capacity Requirements. The NYISO understands that developers will look
to anticipated future revenues when making near-term investment decisions. At this time, the
current ICAP market structure provides sufficient market signals to anticipate future revenues.
While there were no Reliability Needs identified in the NYISO’s 2010 Reliability Needs
Assessment, the NYISO will continue to monitor potential reliability risks and other issues that
may affect the reliability outlook for New York’s bulk electric system. This effort includes
tracking the planned development of new generation and other proposed interconnection
projects, assessing demand response resources’ participation in the ICAP/SCR program, tracking
and evaluating potential reliability impacts of generator retirements, and evaluating the
cumulative effect of emerging environmental regulations on the existing generation fleet.
4 Section I. C. 3. of this report provides information and analysis of the unoffered and unsold capacity from ROS resources.
Page 2
Over the past year, the NYISO has been engaged in several regulatory proceedings
regarding its Installed Capacity market. These proceedings include revisions the ICAP Demand Curves, revisions to the In-City buyer-side capacity mitigation rules, added provisions for the potential creation of new capacity zones, and changes to the baseline load calculation for Special Case Resources (“SCRs”).
The third triennial Demand Curve reset process was completed on September 15, 2011
with the Commission’s acceptance of the ICAP Demand Curves, which were effective beginning with the October 2011 ICAP Spot Market Auction and will continue through Winter 2014-
2015.5 The fourth triennial Demand Curve reset process will begin in mid-2012 and will follow the process set forth in Section 5.14 of the Services Tariff.
On September 27, 2010, the NYISO proposed enhancements to its In-City buyer-side capacity mitigation measures in a filing at the Commission under Section 205 of the Federal Power Act.6 On November 16, 2010, and in subsequent orders, the Commission accepted the tariff revisions (as revised, the In-City Buyer-Side Mitigation Measures).
The Commission issued an Order on Compliance7 on September 8, 2011, directing the NYISO to develop and file tariff revisions that implement criteria for the determination of new capacity zones (“NCZs”). The NYISO’s NCZ Compliance Filing on November 7, 20118
included modifications to the Services Tariff to identify the deliverability criteria that will be used to determine whether a NCZ is required. That filing is pending before the Commission as of the December 20, 2011 filing of this report.
The Commission issued a Final Rule on demand response compensation in wholesale
energy markets on March 15, 2011. The DR Final Rule ensures that demand response resources are compensated at the market price for energy when the resources are dispatched and are costeffective. The DR Final Rule prescribed a net-benefits test to determine when demand response resources are cost effective. The NYISO made its compliance filing on August 19, 2011. The DR Final Rule also requires a second compliance filing on the feasibility of the dynamic benefits test, which the NYISO plans to file in September 2012.
5 New York Independent System Operator, Inc., 136 FERC ¶ 61,192 (2011).
6 See FERC Docket ERl0-3043, "Proposed Enhancement to In City Buyer-Side Capacity
Mitigation Measures, Request for Expedited Commission Action, and Contingent Request for Waiver of Prior Notice Requirement” (dated September 27, 2010).
7 New York Independent System Operator, Inc., 136 FERC ¶ 61,165 (2011).
8 See FERC Docket Nos. ER04-449 and ER12-360, “NCZ Compliance Filing” (dated November
7, 2011).
Page 3
The Commission issued a Final Rule on demand response compensation in wholesale
energy markets on March 15, 2011.9 The DR Final Rule provides for demand response
resources are compensated at the market price for energy when the resources are dispatched and
are cost-effective. However, the Commission specified in its December 15, 2011 Order that
when the locational marginal price is greater than or equal to the threshold price, all demand
resources that qualify for compensation will receive the locational marginal price payment, but if
that price is less than the threshold price, the Final Rule does not apply to determine the
payment to a demand response resource, and any payment will be governed by the existing RTO
or ISO tariff.10 The DR Final Rule prescribed a net-benefits test to determine the threshold
price when demand response resources are cost effective. The NYISO made its compliance
filing on August 19, 2011. The DR Final Rule also requires a second compliance filing, on the
feasibility of the dynamic benefits test, which the NYISO plans to file in September 2012.
The NYISO continues to believe that the ICAP Demand Curves and their use for the NYISO ICAP markets remains sound. The Demand Curves are structured to provide signals to develop new Capacity when and where it is needed, particularly when compared to the de facto vertical demand curves in place prior to the Summer 2003 Capability Period. 11 Although the specific parameters of the ICAP Demand Curves (i.e., the slope and the height), likely will
continue to be subject to debate in the ICAP Demand Curve reset process, there can be little
doubt that the ICAP Demand Curves provide better price signals to investors than the vertical
demand curves. The ICAP Demand Curves by their very design ameliorate the unstable prices
resulting from the prior vertical demand curves, provide market-driven compensation for
Capacity above the minimum Capacity requirement, and reduce incentives for withholding.
B. Recent Installed Capacity Auction Results
Committed Capacity remains well above minimum Installed Capacity requirements for
the NYCA, and for the NYC and Long Island Localities. In general, the Dependable Maximum
Net Capability (“DMNC”) available from many generators in the NYCA increases in the winter
9 Demand Response Compensation in Organized Wholesale Energy Markets, Final Rule, 18 CFR Part 35, 134 FERC ¶ 61,187 [Order No. 745] (dated March 15, 2011)(“DR Final Rule”).
10 See Order on Rehearing and Clarification, 745-A, issued December 15, 2011, 137 FERC ¶ 61,215 [Order No. 745-A] (dated December 15, 2011).
11 Prior to the May 2003 ICAP Spot Market Auction, Deficiency Auctions used a “stepped”
demand curve with a vertical line segment at the minimum requirement level. All NYISO Demand
Curves have horizontal sections above and below these line segments, at a maximum price and $0.00/kW-
month, respectively, as defined in the Services Tariff.
Page 4
because of the lower ambient temperatures. Capacity offers from External Control Areas also fluctuate seasonally. Further, the NYCA Demand Curve price can decline to zero when supply exceeds the minimum Capacity requirement in the NYCA by 12 percent or more. Accordingly, the NYCA auction clearing prices are consistently at or below half of the estimated net cost of new entry for the peaking unit Capacity.
The amount of Capacity committed to the NYCA, including imports, continues to be
high. The monthly average import levels into the entire NYCA were 1,905.4 MW in the Winter
2010-2011 Capability Period and 2,073.4 MW in the Summer 2011 Capability Period. This
represents a 600 MW monthly increase over levels imported for the previous Winter Capability
Period and a 100 MW monthly decrease relative to the prior Summer Capability Period.
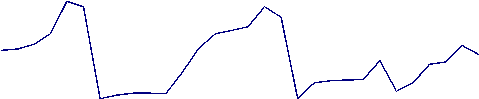
ICAP Market Clearing Prices and auction activity levels from November 1999 through October 2011 for the NYCA, NYC, and Long Island are shown in tabular form in Attachment III-A. Market clearing prices are depicted in graphic form in Charts 1, 3, and 5, and Capacity commitment levels (including unsold MW) are depicted in Charts 2, 4, and 6, below. The
NYCA Unsold MW depicted in Chart 2 includes unsold MW located in ROS, as well as the
Unsold MW depicted in Charts 4 and 6 for the NYC, and Long Island Localities, respectively.
Page 5

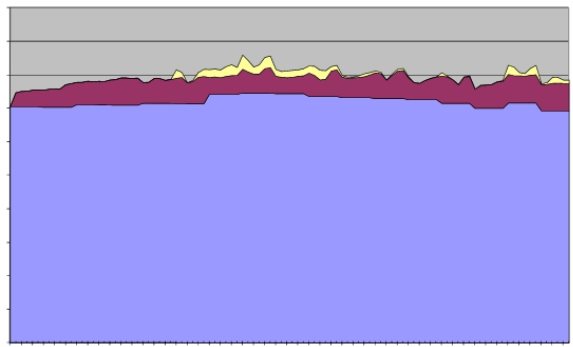
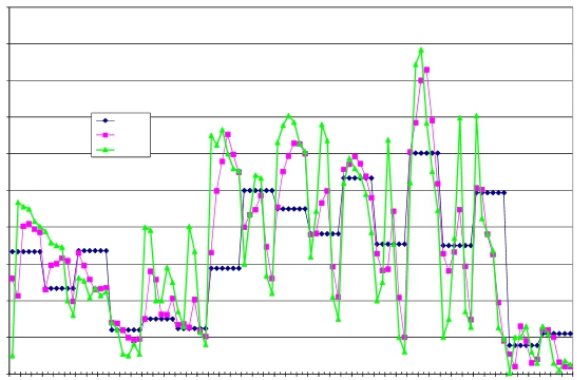
Chart 1. NYCA Market Clearing Prices
$5.00
$4.50
$4.00
$3.50Strip
Monthly
$3.00Spot
$2.50
$2.00
$1.50
$1.00
$0.50
$-
Chart 2. NYCA Offered MW
50000
45000
40000
35000
30000
25000
20000
15000
10000
5000
0
NYCA RequirementNYCA ExcessNYCA Unsold
Page 6

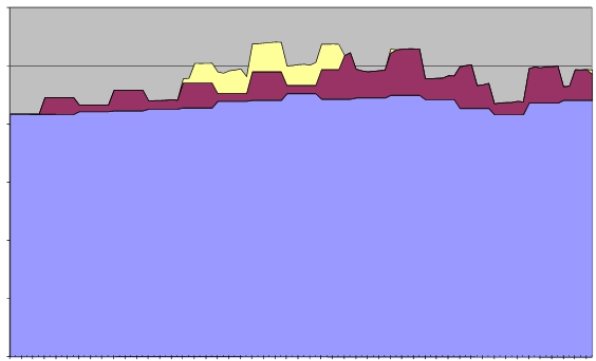

Chart 3. NYC Market Clearing Prices
$16.00
$14.00
Strip
$12.00Monthly
Spot
$10.00
$8.00
$6.00
$4.00
$2.00
$-
Chart 4. NYC Offered MW
12000
10000
8000
6000
4000
2000
0
NYC RequirementNYC ExcessNYC Unsold
Page 7


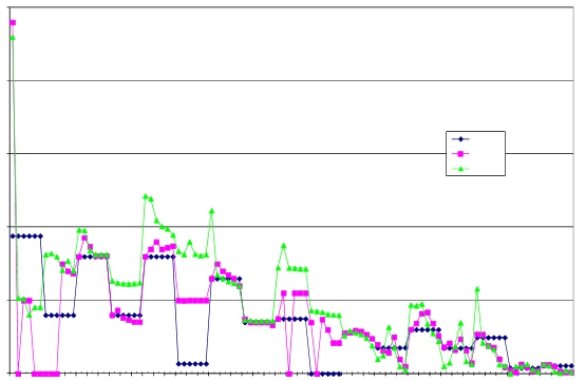
Chart 5. Long Island Market Clearing Prices
$25.00
$20.00
Strip
$15.00Monthly
Spot
$10.00
$5.00
$-
Chart 6. Long Island Offered MW
7000
6000
5000
4000
3000
2000
1000
0
LI RequirementLI ExcessLI Unsold
Page 8
C. Potential Withholding in the Capacity Markets
1. All Regions in the NYCA
This section of the report addresses potential withholding in NYISO-administered
Capacity auctions in all regions in the NYCA from November 2010 through October 2011. It focuses on market outcomes and related behavior since May 2007.
In order to determine for this report whether any potential withholding occurred, the NYISO analyzed the differences between available supply and the supply committed through self-supply, bilateral transactions, and the NYISO-administered auctions. In particular, the
NYISO examined:
• the available NYCA Capacity that was available to be offered into the ICAP Spot
Market Auctions but was not offered (“unoffered capacity”),12
• available NYCA Capacity that was offered into the Spot Market Auctions but was
not sold (“unsold capacity”),
• unoffered capacity as a percentage of available Capacity, and
• unsold capacity as a percentage of offered Capacity.
When Capacity is available but not offered, it is an indication that physical withholding
may have occurred. Similarly, when Capacity is offered at a price that causes it not to clear, it is
an indication that economic withholding may have occurred. The amounts of unoffered and
unsold capacity are determined from the ICAP Spot Market Auction results, because this auction
is the last opportunity for Installed Capacity Suppliers to sell their Capacity. The existence of
unoffered and unsold capacity, however, does not necessarily imply the intent to raise market
prices.
As reflected in the NYISO’s previous reports on the Installed Capacity Demand Curves,
patterns of unsold capacity have varied across each of the Localities. For the entire NYCA, there
generally has been more unsold capacity in winter months than summer months. In Long Island,
historical levels of unsold capacity have averaged near zero; for this reporting period, the
average level of unsold capacity increased slightly, by 5.1 MW per month on average, in Winter
2010-2011, and 9.2 MW per month, on average, in Summer 2011. In NYC, the high amounts of
unsold capacity between Summer 2006 and Winter 2007-2008 coincided with the addition of
12 Available supply is defined as the lesser of the NYISO-accepted DMNC tested capacity and the Capacity Resource Interconnection Service (“CRIS”) MW value, with the Equivalent Demand Forced Outage Rates (“EFORd”) applied.
Page 9
approximately 1,000 MW of new Capacity. These amounts subsided with the introduction of the supply-side mitigation rules in 2008.
There are three types of ICAP auctions in each Capability Period: a Capability Period
Auction (also referred to as the “six-month strip auction”), six Monthly Auctions, and six ICAP
Spot Market Auctions. Capacity may be offered into any or all of the auctions. The NYCA
ICAP requirements are settled for three locations: one each for the NYC and the Long Island
Localities, and one for the NYCA as a whole. Local reliability rules require LSEs in NYC and
on Long Island to procure minimum levels of Capacity from Installed Capacity Suppliers that are
electrically located within the respective Locality. Such Capacity is also credited toward each
NYC and Long Island LSE’s overall NYCA obligation. The NYISO establishes Locational
Minimum Installed Capacity Requirements on an annual basis according to NYISO
Procedures.13
With the exception of the NYC Locality, the Services Tariff does not require Installed
Capacity Suppliers to offer Capacity into the ICAP markets. Until the implementation of the
ICAP mitigation measures set forth in Attachment H of the Services Tariff, which were
effectuated in May 2008, the majority of Capacity in NYC - that of the “Divested Generation
Owners” - had been subject to Commission-approved ICAP mitigation measures that imposed
bid caps and required the units’ Capacity to be offered into the ICAP auctions. Capacity
resources constructed subsequent to the Commission’s approval of the bid caps were not subject
to bid caps or mandated to offer into the auctions. That Capacity and other Capacity inside and
outside of the NYC Locality could be sold in bilateral transactions or offered in one or more of
the NYISO’s ICAP auctions. The Commission’s March 7, 2008 Order14 removed the
requirements unique to the Divested Generation Owners and approved mitigation measures
applicable to all In-City Capacity. The March 7, 2008 Order effectuated new In-City mitigation
measures, based on Pivotal Supplier determinations combined with offering conduct and price
impact thresholds, to determine whether an market power had been exercised. These measures
are set forth in Attachment H of the Services Tariff (including revisions over time, “Supply-side
Mitigation Measures”).
In developing the information for this report, the NYISO examined auction outcomes of
the Capability Periods from Summer 2007, which begins May 1, 2007, through Summer 2011,
13 See Section 2 and Attachment B of the NYISO Installed Capacity Manual.
14 New York Independent System Operator, Inc., Docket No. EL07-39-000, Order Conditionally Approving Proposal, 122 FERC ¶ 61,211.
Page 10
which ended October 31, 2011. Since the Capacity product transacted in NYISO-administered ICAP auctions is UCAP, the following information was examined:
1. Certification data, reflecting the certified MW of UCAP from all Resources within New
York available to supply Capacity to the NYCA. The analysis did not include resources
physically located outside of the NYCA.
2. The amount of UCAP supplied, which includes UCAP sold in any of the NYISO ICAP
auctions, UCAP certified as self-supplied against an LSE’s Capacity obligation, and
UCAP committed through bilaterals.
Unoffered Capacity
Chart 7 displays unoffered capacity as a percent of available Capacity in each region, for
each of the three regions.
Chart 7. Average Percent of Unoffered MW
10.00%
8.00%
6.00%
4.00%
2.00%
0.00%
Summer 2007Winter 2007-Summer2008Winter 2008-Summer2009Winter 2009-Summer 2010Winter 2010-Summer 2011
08091011
LINYCROS
The Long Island Locality has fairly consistent seasonal fluctuations in the amounts of
unoffered capacity, which can be seen in Chart 7. The Long Island Locality is characterized by
Capacity procurement chiefly through bilateral transactions and self-supply. While it appears the
amount of unoffered capacity on Long Island fluctuates between 0.01% and 2.26%, much of the
Page 11
unoffered capacity is not actually available. A portion of the unoffered capacity in Long Island
is associated with generation stations permitted for less than 80 MW, although the DMNC of the
units at each station when aggregated exceeds 80 MW. For example, in four instances on Long
Island, there are two units at a site, and each individual unit at that site can produce more than 40
MW. In the event that one unit is out of service and the Market Participant wishes to run the
other unit at output levels higher than 40 MW, the NYISO must have that higher (actual) DMNC
value in its software system in order for the bid to pass validation. These units do not offer all of
their available Capacity because the site permit restrictions limit the combined output to 79.9
MW.
Prior to Summer 2008, in NYC, the low level of unoffered capacity was principally due to the must-offer requirement applicable to the Divested Generation Owners. Beginning with the Summer 2008 Capability Period, the near absence of unoffered capacity can be attributed to the Supply-side Mitigation Measures effectuated in 2008.
Chart 8 displays unsold capacity as a percent of available Capacity in each region, for each of the three regions.
Chart 8. Average Percent of Unsold Capacity
10.00%
8.00%
6.00%
4.00%
2.00%
0.00%
Summer 2007 Winter 2007-08Summer2008 Winter 2008-09Summer2009 Winter 2009-10 Summer 2010 Winter 2010-11 Summer 2011
LINYCROS
Page 12
Unsold Capacity
For all Capability Periods beginning with Summer 2007, nearly all Long Island Capacity
that was offered was sold. In NYC, the average amount of unsold capacity as percentage of
available Capacity trended at near zero levels from the start of the Summer 2008 Capability
Period. For the Summer 2007 and after, nearly all the MW of Capacity resources located in ROS
that offered Capacity into the ICAP auctions were sold. This result has been consistently
observed despite a reduction in the NYCA Installed Reserve Margin from 18 to 16.5 percent for
the 2007-2008 Capability Year and from 16.5 to 15 percent for the 2008-2009 Capability Year,
which was then followed by increases to 16.5 percent for the 2009-2010 Capability Year and
then 18% for the 2010-2011 Capability Year, before the latest reduction to 15.5 percent for the
2011-2012 Capability Year. As discussed below in the ROS section, the amount of unsold
capacity in the ROS region displayed a significant increase in the Winter 2010-2011 and
Summer 2011 Capability Periods.
Table 1 displays the breakdown of unsold and unoffered for each Locality. As part of the
NYISO’s August 24, 2010 ICAP compliance filing,15 the NYISO stated that it would include
unoffered and unsold capacity in the NYC Locality in its Installed Capacity Demand Curves
reports filed annually with the Commission. The unoffered and unsold capacity values for NYC
and ROS are also included to give a full representation of the data that underlies this report.
Table 1. Unoffered and Unsold Capacity by Locality
UnofferedUnsold
MonthNYCLIROSNYCLIROS
Nov-1044.383.9310.20.023.61,378.3
Dec-1015.184.6305.50.00.01,301.7
Jan-1147.982.9317.20.00.0487.9
Feb-111990.6431.60.00.0389.0
Mar-1112.2102.0432.60.02.61,026.7
Ap r-1 125.198.34250.04.61,418.1
May-1126.617.2298.20.00.0141.4
Jun-112314.5176.50.00.0262.3
Jul-1125.414.790.20.31.0921.3
Au g -1 135.311.290.90.027.8844.1
Sep-1162.668.3390.80.012.8499.3
Oct-1147.524.3212.2149.013.6495.7
15 See New York Independent System Operator, Inc., Resubmittal of August 24, 2010 Filing,
Docket Nos. ER10-2210-000, EL07-39-____ and ER08-695-0004, (“August 2010 Compliance Filing”) at
p. 16.
Page 13
2. New York City Locality
In NYC, Pivotal Suppliers are subject to Mitigation Measures. A Pivotal Supplier is an
ICAP Supplier that, along with its Affiliated Entities, Controls In-City Capacity in excess of the
pivotal control threshold.16 The Capacity controlled by Pivotal Suppliers (“Mitigated UCAP”)
must be offered into the Spot Market Auction at a price at or below the lesser of the default
UCAP Offer Reference Level (“Default Reference Price”) or the ICAP Supplier’s Going-
Forward Costs. There is not a “must-offer” requirement for Capacity located in the ROS or
Long Island Localities.
The NYC Capacity that was not sold, as a percent of available Capacity, was less than
0.26% per month on average for the Winter 2010-2011 and Summer 2011 Capability Periods.
The low levels can be explained by the implementation of the Supplier-side Mitigation Measures that became effective as of the Summer 2008 Capability Period.17
Chart 9 below illustrates the effects of the Supplier-Side Mitigation Measures. As
depicted in Chart 9, these measures include a Pivotal Control Threshold determined by the
surplus amount of NYC Capacity above the Locality Capacity Requirement. An Entity is
deemed a Pivotal Supplier if the number of MW it Controls is greater than the threshold. If an
Entity is a Pivotal Supplier, then it is subject to the Default Reference Price. The Default
Reference Price, as shown in Chart 9, becomes the cap that the Pivotal Supplier must offer at or
below in the ICAP Spot Market Auction unless the Pivotal Supplier’s Going Forward Costs
(“GFCs”), as determined by the NYISO, are higher than the Default Reference Price.
The level of unoffered and unsold MW can be inferred from Chart 9 by comparing the NYC Spot Market Auction price to the UCAP Offer Reference Level (also referred to as the “Default Reference Price”). The Default Reference Price is the price on the demand curve if all available UCAP is offered and sold. The difference between the Spot Market Auction Price and Default Reference Price can be attributed to In-City Capacity that is either not offered or offered at a price above the Default Reference Price. Note that the NYC Spot Market Auction Price will diverge from the Default Reference Price when the NYCA ICAP Spot Market Auction sets the NYC Spot Market Auction price. This divergence is the result of the auction rules, and is not caused by unoffered or unsold NYC Capacity.
16 See Services Tariff Attachment H Sections 23.2.1 and 23.4.5.
17 See earlier reports for the analysis of the New York City Locality prior to the effectuation of the Supplier-Side Mitigation Measures and removal of the bid-caps.
Page 14
Chart 9. In-City Mitigation Results 2011
$16.001800
$14.001600
1400
$12.00
1200
$10.00
1000
$8.00
800
$6.00
600
$4.00
400
$2.00200
$-0
Month
Spot Auction PriceDefault Reference PricePivotal Control Threshold
Page 15
Chart 10 depicts the levels of available generator UCAP and SCR UCAP in the NYC Locality.
Chart 10. NYC Generator and SCR UCAP
10,000600
9,500500
9,000400
8,500300
`
8,000200
7,500100
7,0000
Month
NYC Generator UCAPNYC SCR UCAP
3. ROS Capacity Market
Additional Details
This section of the report addresses possible withholding of Capacity in the ROS region
from November 2010 through October 2011. For this review, the NYISO conducted a detailed
analysis of unoffered and unsold capacity from resources located in the ROS area of the NYCA;
this section of the review does not pertain to Capacity located in NYC and on Long Island.
Chart 11 shows monthly average values over each Capability Period for four ROS Capacity variables: available, offered, sold, and exported.
Page 16
Chart 11. ROS Capacity Available, Offered, Sold and Exported
25,0001,400
1,258
24,5001,200
24,0001,000
845
23,500817807800
23,000600
471560
22,500420400
367
289
22,000200
21,5000
ROS AvailableROS OfferedROS SoldCapacity Exports
Examination of ROS Capacity data pertaining to individual Market Participants revealed
general patterns in unsold and unoffered capacity. The patterns suggest a three-way
classification of suppliers by market sector: all generation-owning transmission owners, five
ROS generation owners, and other suppliers, which includes SCRs. 18 Note that these
classifications and the following table follow the same approach in displaying the unoffered and
unsold capacity in the ROS area that was used in the NYISO’s December 2010 Report.19 Table
2 of this December 2011 Report summarizes the monthly averages for each Capability Period from the Summer 2008 Capability Period through October 2011.
18 Special Case Resources participate in the NYISO’s Capacity markets through Responsible Interface Parties.
19See ER01-3001, ER03-647, Motion for Leave to Respond, and Response, of the New York Independent System Operator, Inc. filed July 27, 2009.
Page 17
Table 2. ROS Unoffered and Unsold Capacity MW by Type of Market Participant
Summer 2008Winter 2008-2009Summer 2009Winter 2009-2010Summer 2010Winter 2010-2011Summer 2011
UnofferedUnsoldUnofferedUnsoldUnofferedUnsoldUnofferedUnsoldUnofferedUnsoldUnofferedUnsoldUnofferedUnsold
MWMWMWMWMWMWMWMWMWMWMWMWMWMW
All ROS
TOs204.50.064.10.069.20.091.00.0158.20.0127.70.092.30.0
60.11%0.00%21.22%0.00%56.79%0.00%46.98%0.00%59.90%0.00%26.16%0.00%33.97%0.00%
5 ROS
GenCos67.961.679.5173.824.50.068.751.423.314.171.4179.715.772.9
19.96%100.00%26.30%95.00%20.09%0.00%35.44%66.69%8.82%32.66%14.63%16.46%5.76%6.91%
All Others
incl. SCRs67.80.0158.79.228.20.034.125.782.629.1288.9912.1163.7981.6
19.93%0.00%52.49%5.00%23.12%0.00%17.58%33.31%31.28%67.34%59.21%83.54%60.25%93.09%
Total
Unoffered/
Unsold340.261.6302.3183.0122.00.0193.777.0264.243.2488.01091.8271.61054.5
Total
Available
MW22,980.024,071.023,197.024,116.523,262.124,768.723,126.6
Notes:
(1) All ROS Transmission Owners category includes the TOs’ SCRs
(2) 5 ROS Generating Companies category was used to maintain continuity with the previous reports
Page 18
Salient facts from the above tables are:
• The group of all ROS generation-owning Transmission Owners consistently had
unoffered capacity which ranged from 21% to 60% of total unoffered capacity.
• The group of all ROS generation-owning Transmission Owners had no Capacity that
was offered and unsold capacity.
• The group of five generation owners consistently had unoffered capacity which
ranged from 6% to 35% of total unoffered capacity.
• The group of five generation owners had unsold capacity which accounted for 0% to
100% of total Capacity that was offered and unsold capacity.
• The group of all Others including SCRs consistently had unoffered capacity that
ranged from 18% to 60% of total unoffered capacity for the period Summer 2008
through Summer 2011.
• The group of all Others including SCRs had Capacity that was offered and unsold
capacity that ranged from 0% to 93%.
Analysis of Unoffered Capacity
This section of the report provides a detailed analysis of the unoffered capacity in the
ROS region. This section also presents the maximum price impact of the unoffered capacity, in each month and averaged over the six months of each Capability Period, consistent with the December 2010 Report. In general, the responses suggest that the Installed Capacity Suppliers’ reasons for not offering the Capacity were benign, and none of the instances evidence behavior intended to artificially raise prices.
The NYISO contacted each Installed Capacity Supplier that had at least 15 MW of
unoffered capacity in any one month in either the Winter 2010-2011 Capability Period or the
Summer 2011 Capability Period for an explanation of why it did not offer all of its capacity.20 There were 22 Market Participants with at least 15 MW of unoffered capacity in any month, and the NYISO sought explanations from each of them. The following information was provided to the NYISO by ICAP suppliers.
20 Confidential Attachment I-F is filed as a confidential attachment, which provides a more
detailed summary of Market Participants’ explanations for having unoffered and unsold capacity.
Page 19
1. Thirteen of the Market Participants individually responded that the failure to offer its
capacity was the result of an administrative oversight. The NYISO’s records showed
that twelve of the thirteen Market Participants did not offer capacity in one month,
and one Market Participant did not offer capacity in two months. The majority of
instances had unoffered capacity ranging from 15 to 25 MW; however, in one
instance, a Market Participant did not offer 243.5 MW. That instance was the largest
amount of capacity not offered by a Market Participant due to administrative
oversight.
2. A generation-owning Transmission Owner keeps approximately 30 MW of aging gas-
fueled generation out of operation for the first five months during the Summer Capability Period due to environmental restrictions.
3.A renewable generation owner routinely does not offer approximately 15 MW to 25
MW of UCAP due to neighboring state rules.
4. Four ICAP Suppliers had unoffered capacity associated with their resources being
permanently or temporarily withdrawn from the ICAP market.
5. A generation-owning Transmission Owner routinely does not offer the full quantity
of capacity available from several of its resources. Over the analysis period for this report, this Market Participant did not offer an amount that ranged from
approximately 50 MW to 110 MW in each month. This action was explained to be primarily due to a conservative operating approach.
6. A generation-owning Transmission Owner did not offer 54 MW in each of the Winter
2010-2011 Capability Period due to a natural gas fuel restriction that prevents the plant from being able to run at full capacity.
7. A generation owner has a PURPA contract that prohibits it from selling any Capacity
above the level of the bilateral contract. The amount of unoffered capacity ranges
from 23 MW in Summer Capability Period months to 67 MW in Winter months.
Table 3 below shows the maximum price impact of the unoffered capacity based on the
slopes of the ICAP Demand Curves for the relevant Capability Periods. The maximum price
impact is calculated as the greater of (1) the product of the monthly unsold MW and the slope of
the ICAP Demand Curve and (2) the ICAP Spot Market Auction Market Clearing Price, since
the price impact cannot exceed the auction price. Monthly basis and seasonal averages are
reported. The maximum price impact of the unoffered capacity, averaged over the six months of
Page 20
the Winter 2010-2011 and Summer 2011 Capability Periods, was $0.35/kW-mo and $0.27/kW-
mo, respectively.
Table 3. Maximum Price Impact of Unoffered Capacity
Total
MonthUnoffered
MW
Nov-10310.2
Dec-10305.5
Jan-11317.2
Feb-11431.6
Mar-11432.6
Apr-11425
May-11298.2
Jun-11176.5
Jul-1190.2
Aug-1190.9
Sep-11390.8
Oct-11 212.2
Monthly
Maximum
Price
Impact
$0.01
$0.50
$0.50
$0.65
$0.30
$0.15
$0.65
$0.46
$0.15
$0.05
$0.18
$0.13
Seasonal
Average
Maximum
Price Impact
$0.35
$0.27
Analysis of Unsold Capacity
This section of the report analyzes and reports on unsold capacity in the ICAP Spot
Market Auction. It also presents the maximum price impact of the unsold capacity, in any one month and the price impact average for the six months of the Capability Period. The NYISO contacted each generator for an explanation of its behavior if (a) the class of generators that it was in had more than 15 MW of unsold capacity in a given month and (b) if the generator had a ICAP Spot Market Auction offer that was greater than the generator’s class average Net GFC with half net revenues (“GFCs with half net revenues”, as described below).
In addition to calculating the monthly maximum and average maximum price impacts, three metrics were calculated in this report for the analysis period:
a. Class average going forward costs (“GFCs”), with and without a risk adjustment;
b. Estimated monthly price impacts of unsold capacity associated with offers above class average GFCs.
i. Monthly Price Impacts
Table 4 below includes the average monthly maximum price impact of unsold capacity
for each Capability Period. The price impacts reported in Table 4 exceed the NYISO’s threshold
Page 21
for determining whether GFCs are evaluated in all months of the analysis period, November 2010 through October 2011. Specifically, both of the Capability Period impacts exceeded the $0.20/kW-month threshold. The average price impacts were $0.35/kW-month and $0.24/kW-
month in the Winter 2010/2011 and Summer 2011 Capability Periods, respectively.
Table 4. Maximum Price Impact of ROS Unsold MW
Month
Nov-10
Dec-10
Jan-11
Feb-11
Mar-11
Apr-11
May-11
Jun-11
Jul-11
Aug-11
Sep-11
Oct-11
Total Unsold
MW
1378.3
1301.7
487.9
389.0
1026.7
1418.1
141.4
262.3
921.3
844.1
499.3
495.7
Monthly
Maximum
Price
Impact
$0.01
$0.50
$0.50
$0.65
$0.30
$0.15
$0.37
$0.55
$0.15
$0.05
$0.18
$0.13
Seasonal
Average
Maximum
Price Impact
$0.35
$0.24
ii. Class Average Going Forward Costs
The NYISO calculated class average GFCs for generator classes that had at least 15 MW of unsold capacity in a given month. Four generator classes had unsold capacity that met this criterion: natural gas combined cycle, Class A; no. 6 fuel oil steam turbine, Class F; natural gas steam turbine, Class G; and sub-critical coal steam turbine units, Class H.
The NYISO reviewed the ROS generating units listed in the NYISO’s Load and Capacity
Data Report (referred to as the “Gold Book”) applicable to November 2010 through October
2011, and assigned the units to classes based on primary fuel and technology. Attachment I-B to
this report, “Existing Generating Facilities”, shows the generating units in ROS that the NYISO
assigned to the four classes for which class average GFCs were calculated.
For purposes of this report, class average GFCs are defined as costs (other than
production costs) that could be reasonably expected to be avoided if the plant was mothballed for
at least one year. (See Table 5 for definitions.) These GFCs may provide insight into why a
generator offered its Capacity at a non-zero offer price. The assumption for this report is that an
Installed Capacity Supplier would only want to sell Capacity from a generator if the Capacity
Page 22
revenues it receives cover the generator’s GFCs. In this analysis, GFCs are calculated for the
entire Capacity of the plant. For this report, GFCs are calculated from industry data, such as
labor rates, expenses for contract services, administrative and general, and insurance. Attachment I-C to this report, Class Average Avoidable Costs, presents the avoidable fixed cost components of the class average GFCs for classes A, F, G, and H.
Generators face uncertainty about net revenues, among other things, and this uncertainty may influence the prices at which they offer Capacity. To account for this uncertainty, the
NYISO calculated class average GFCs including varying levels of net revenues: full, half, and none. Attachment I-D to this report, Class Average Going Forward Costs, shows the class
average GFCs for classes A, F, G, and H, calculated as the avoidable costs from Attachment I-C less the varying levels of net revenues.
Table 5. Going Forward Cost Definitions
Going Forward Costs (GFCs)Costs that would be avoided or deferred if a generator was
mothballed for a year or more, based on the calculation of
the industry average cost data for the type of generator.
Net energy and ancillary servicesEstimated energy plus ancillary services revenues minus
revenues (net revenues)estimated production costs, with a minimum value of zero.
GFCs with full net revenuesGFCs minus net revenues. This value is used to represent
Net GFCs with certainty of net revenues.
GFCs with half net revenuesGFCs minus 0.5 times net revenues. This value is used to
represent Net GFCs with some uncertainty.
GFCs with no net revenuesGFCs. This value is used to represent Net GFCs without
certainty of net revenues.
Unit Specific Net GFCs withGFCs plus unit-specific adjustments (i.e., the dollar amount
Recognized Adjustmentsidentified by the generator for an adjustment that is readily
recognizable as an appropriate adjustment), minus the unit
specific net revenues.
Unit Specific Net GFCs with allGFCs plus all unit-specific adjustments identified by the
Adjustmentsgenerator, minus the unit specific net revenues.
The NYISO estimated net Energy and Ancillary Services revenues for the units in the
four classes over the analysis period. Net revenues were equal to estimated Energy revenues
plus Ancillary Services revenues minus estimated production costs. A minimum value of zero
was used for net revenues; that is, if production cost exceeded Energy and Ancillary Services
revenues, a value of zero was used for the net revenue figure. Unit-specific net revenues were
Page 23
calculated for 19 generating units in the four classes listed above. Two of the 19 units had
negative net revenue estimates. The net revenues were averaged across the units in each class; the class average net revenues are included in Attachment I-D.
The NYISO implemented the following several enhancements to the net revenue methodology the NYISO used in the December 2010 Report:
• Hourly fuel costs were calculated based on meter data using hourly fuel prices.
• For generators that could burn one or more fuels, hourly data from the EPA Continuous
Emissions Modeling System (CEMS) were used to identify which fuel(s) were burned
and in what proportion. These hourly fuel types or mixes were used as the cost basis for
the hourly fuel cost calculation.
• The startup costs were calculated based on how long the generator had been offline, using
meter data and the generator’s startup cost reference curve.
• Incremental energy above the minimum generation amount was assigned a cost based on
a weighted average heat rate calculated from the generator’s energy reference curve.
GFCs with full net revenues were calculated for use as a proxy for net going forward costs with certainty of net revenues. Annual going forward costs minus full net revenues for the November 2010 to October 2011 period varied from $0.69/kW-year for Class A to $21.64/kW-year for Class H. Summer values ranged from $0.07/kW-month to $2.40/kW-month, and Winter values ranged from $0.04/kW-month to $1.20/kW-month.
GFCs with half net revenues was calculated for use as a proxy for net going forward costs
with some uncertainty. Annual going forward costs minus half net revenues for the November
2010 to October 2011 period vary from $2.37/kW-year for Class A to $26.12/kW-year for Class
H. Summer values range from $0.25/kW-month to $2.90/kW-month. Winter values range from $0.12/kW-month to $1.45/kW-month.
GFCs with no net revenues were calculated for use as a proxy for net going forward costs without certainty of net revenues. Annual going forward costs with no net revenues for the
November 2010 to October 2011 period vary from $13.05/kW-year for Class G to $43.28/kW-
year for Class H. Summer values range from $1.45/kW-month to $4.80/kW-month. Winter values range from $0.73/kW-month to $2.41/kW-month.
Table 6 below shows the amount of unsold capacity by month for which class average
Net GFCs were calculated and the amount of unsold capacity for which class average Net GFCs
Page 24
were not calculated (i.e., generators within classes with less than 15 MW of unsold capacity in
each month). The total unsold capacity values in the second column are for the entire NYCA;
they are equal to the monthly sums of unsold capacity across all three locations in Table 1. The
unsold capacity used in the maximum price impact calculation in Table 4 is based on the ROS
location only.
Table 6. Unsold MW Used for GFC Calculations
Total Unsold MW forTotal Unsold MW for
Totalwhich class averagewhich class average
UnsoldGFCs calculatedGFCs not calculated
MonthMW(Unsold MW > 15)(Unsold MW < 15)
Nov-101401.9703.3698.6
Dec-101301.71242.659.1
Jan-11487.9487.90.0
Feb-11389.0389.00.0
Mar-111029.3903.0126.3
Apr-111422.71278.1144.6
May-11141.4141.40.0
Jun-11262.3262.30.0
Jul-11922.6888.334.3
Aug-11871.8617.2254.6
Sep-11512.1485.526.6
Oct-11658.3545.9112.4
iii. Unsold Capacity Impact Analysis
As part of the analysis of unsold capacity, the NYISO contacts generator owners for unit-
specific information if a generator’s offer for unsold capacity exceeded the class average “GFCs
with half net revenues” for the class to which the generator was assigned. The values of these
GFCs are shown in Attachment I-D. Of the 19 generators for which class average GFCs were
calculated, six generators had offers that exceeded the class average GFCs with half net
revenues. The NYISO calculated unit-specific GFCs for these six units, which were owned by
two Market Participants. As part of this process, the NYISO provided the generation owners the
class average avoidable costs and gave them the opportunity to provide information regarding
adjustments to the class average values to reflect their unit-specific avoidable costs. Both of the
generation owners provided qualitative explanations for their offering behavior but declined to
provide quantitative information. In one case, the Market Participant stated that it does not
analyze GFCs for its auction activity, and that its offering behavior was more related to short-
term costs and risks associated with bidding into the Day Ahead Market. The other Market
Page 25
Participant did not provide quantitative adjustments stating that its units’ net revenues would have likely exceeded the avoidable costs, such that the resulting GFC calculation would have been about the same. Section II of Confidential Attachment I-F includes more detailed
information regarding the explanations of unsold capacity for the two Market Participants that offered above GFCs with half net revenues.
After collecting unit-specific GFC information, the NYISO performed ICAP Spot Market
Auction simulations for a more detailed understanding of how the non-zero price offers may
have affected Market Clearing Prices. Because the two generators that were contacted did not
have quantitative adjustments to the NYISO’s class average GFC calculations, the NYISO did
not analyze any scenarios with adjustments to GFCs.21 Therefore, the NYISO simulated auction
outcomes under three scenarios: GFCs with full net revenues, GFCs with half net revenues, and
GFCs with no net revenues. These scenarios are labeled scenarios 1, 2, and 3 in Table 7.
The NYISO performed the simulations by replacing offers that originally did not clear with the unit-specific GFC at varying levels of net revenues in each of the three scenarios. For the other thirteen generators from whom the NYISO did not request information regarding GFC adjustments, the NYISO utilized GFC values reflecting class average avoidable costs. It is
important to note that offers were only replaced with the GFC value if the offer was not awarded
any MW. If the offer was marginal and only cleared a portion of its MW, or if the offer was
inframarginal, the specific offers at the original offer prices were used. The offers that were
analyzed for purposes of the simulations are provided in Attachment I-A.22
Table 7 shows the results of the auction simulations in each of the three scenarios, for each month of the analysis period. Column B shows the original NYCA ICAP Spot Market
Auction prices. Columns C, D, and E show the simulated NYCA price under each of the three
scenarios. Columns F, G, and H show the price reduction relative to the original clearing price.
The simulation price deltas relative to the original clearing prices are strictly zero or negative.
This results from the simulation methodology stated in the previous paragraph: only offers that
entirely did not clear were replaced with GFCs. The amount of the price reduction shown in the
21 In the January 2010 Report, for the Market Participants that had submitted GFC adjustments, the NYISO calculated GFCs in three manners: disregarding all adjustments, including some recognized adjustments, and including all adjustments.
22 The unmasked unsold capacity offers are provided in Confidential Attachment I-F.
Page 26
simulations is strictly decreasing as less revenues are recognized in the GFC calculations. That outcome is consistent with what would be expected.
Table 7. Price Impact Analysis Results
ABCDEFGH
Original
MonthMCPS1S2S3S1 deltaS2 deltaS3 delta
Nov-100.010.010.010.010.000.000.00
Dec-100.500.250.280.28(0.25)(0.22)(0.22)
Jan-110.500.250.350.35(0.25)(0.15)(0.15)
Feb-110.650.500.640.64(0.15)(0.01)(0.01)
Mar-110.300.150.150.15(0.15)(0.15)(0.15)
Apr-110.150.010.050.05(0.14)(0.10)(0.10)
May-110.650.650.650.650.000.000.00
Jun-110.550.300.300.30(0.25)(0.25)(0.25)
Jul-110.150.010.050.05(0.14)(0.10)(0.10)
Aug-110.050.020.050.05(0.03)0.000.00
Sep-110.180.100.100.10(0.08)(0.08)(0.08)
Oct-110.130.080.090.09(0.05)(0.04)(0.04)
S1: GFCs with full net revenues
S2: GFCs with half net revenues
S3: GFCs with no net revenues
iv. Conclusions
The results of the simulations shown in Table 7 indicate that the NYCA ICAP Spot
Market Auction prices would have potentially been lower if the offers that entirely did not clear
were offered at the GFC values. In all three scenarios, the price reductions ranged from
$0.00/kW-month to $0.25/kW-month. For the first scenario in which unsold offers were
replaced with GFCs with full net revenues, the price reduction was $0.12/kW-month on average.
The second scenario with GFCs with half net revenues had an average reduction of $0.09/kW-
month, and the third scenario with GFCs with no net revenues also had an average reduction of
$0.09/kW-month.
While these potential price reductions represent a large percentage of the original Spot
Market Auction clearing price, the reductions are a relatively small total dollar amount. As
noted earlier, the simulations were performed by replacing only offers that entirely did not clear
with GFCs, which is why the simulated prices all were lower than the original auction prices. If
all offers were replaced with GFCs, it would be possible for the simulated prices to exceed the
original prices. The unsold capacity analysis is based upon a considerably larger amount of
Page 27
unsold capacity than that historically observed. However, the associated low potential price impacts do not indicate that economic withholding occurred.
The analysis shows that the estimated Going Forward Costs did not indicate that
significant economic withholding occurred over the analysis period. During this period, the
NYCA ICAP Spot Market Auctions cleared well below the estimated Going Forward Costs for the majority of the ROS generators with unsold capacity, which indicates the absence of
significant economic withholding in the ROS region.
A similar conclusion can be drawn regarding the MW amounts of unoffered and unsold capacity. Although there was a historically large amount of unoffered and unsold capacity
shown in Tables 3 and 4, the associated maximum price impact was relatively low. This result is attributable to the fact that the existing UCAP levels consistently exceeded the NYCA zero
crossing point throughout November 2010 through October 2011.
Page 28
Attachment I-A. Unsold Capacity Offers (Masked)
Page 29
AUCTIONAUCTIONLOCATIONOFFEROFFERPTIDAWARDEDMARKET
TYPEMONTHDESCRIPTIONCAPACITYPRICENAMECAPACITYCLEARING PRICEUNSOLD
Spot11/1/2010ROS389.00.01Unit61383.10.015.897
Spot11/1/2010ROS313.10.01Unit62308.40.014.746
Spot11/1/2010ROS388.70.01Unit63382.80.015.892
Spot11/1/2010ROS100.00.01Unit6098.50.011.516
Spot11/1/2010ROS79.20.01Unit9478.00.011.201
Spot11/1/2010ROS39.00.01Unit8338.40.010.591
Spot11/1/2010ROS386.20.01Unit68380.30.015.855
Spot11/1/2010ROS57.60.01Unit6956.70.010.873
Spot11/1/2010ROS672.20.01Unit7662.00.0110.190
Spot11/1/2010ROS3.10.01Unit563.10.010.047
Spot11/1/2010ROS8.10.01Unit578.00.010.123
Spot11/1/2010ROS0.20.01Unit550.20.010.003
Spot11/1/2010ROS408.30.01Unit4402.10.016.190
Spot11/1/2010ROS31.80.01Unit2031.30.010.482
Spot11/1/2010ROS0.30.01Unit160.30.010.004
Spot11/1/2010ROS52.70.01Unit12351.90.010.799
Spot11/1/2010ROS265.00.01Unit84261.00.014.017
Spot11/1/2010ROS104.50.01Unit85102.90.011.584
Spot11/1/2010ROS33.50.01Unit9233.00.010.508
Spot11/1/2010ROS1.10.01Unit331.10.010.017
Spot11/1/2010ROS142.50.01Unit24140.30.012.160
Spot11/1/2010ROS40.70.01Unit2540.10.010.617
Spot11/1/2010ROS5.10.01Unit265.00.010.077
Spot11/1/2010ROS59.60.01Unit2758.70.010.903
Spot11/1/2010ROS53.60.01Unit2852.80.010.812
Spot11/1/2010ROS24.90.01Unit2924.50.010.377
Spot11/1/2010ROS15.00.01Unit3014.80.010.227
Spot11/1/2010ROS47.00.01Unit3146.30.010.712
Spot11/1/2010ROS1.90.01Unit321.90.010.029
Spot11/1/2010ROS2.10.01Unit342.10.010.032
Spot11/1/2010ROS13.00.01Unit3512.80.010.197
Spot11/1/2010ROS13.90.01Unit3613.70.010.211
Spot11/1/2010ROS0.10.01Unit370.10.010.002
Spot11/1/2010ROS4.70.01Unit384.60.010.071
Spot11/1/2010ROS6.40.01Unit396.30.010.097
Spot11/1/2010ROS4.60.01Unit404.50.010.070
Spot11/1/2010ROS22.20.01Unit4121.90.010.336
Spot11/1/2010ROS4.00.01Unit1183.90.010.061
Spot11/1/2010ROS0.10.01Unit1050.10.010.002
Spot11/1/2010ROS0.20.01Unit1080.20.010.003
Spot11/1/2010ROS0.10.01Unit960.10.010.002
Spot11/1/2010ROS0.10.01Unit1010.10.010.002
Spot11/1/2010ROS0.20.01Unit1000.20.010.003
Spot11/1/2010ROS0.20.01Unit1140.20.010.003
Spot11/1/2010ROS0.30.01Unit1100.30.010.004
Spot11/1/2010ROS0.70.01Unit1070.70.010.011
Spot11/1/2010ROS0.10.01Unit970.10.010.002
Spot11/1/2010ROS0.10.01Unit1120.10.010.002
Spot11/1/2010ROS0.50.01Unit1160.50.010.007
Spot11/1/2010ROS0.10.01Unit950.10.010.002
Spot11/1/2010ROS0.30.01Unit1150.30.010.004
Spot11/1/2010ROS0.20.01Unit1130.20.010.003
Spot11/1/2010ROS0.20.01Unit1040.20.010.003
Spot11/1/2010ROS0.10.01Unit1170.10.010.002
Spot11/1/2010ROS0.10.01Unit980.10.010.002
Spot11/1/2010ROS1.00.01Unit1061.00.010.015
Spot11/1/2010ROS0.10.01Unit990.10.010.002
Spot11/1/2010ROS0.30.01Unit1090.30.010.004
Spot11/1/2010ROS0.20.01Unit1020.20.010.003
Spot11/1/2010ROS0.20.01Unit1110.20.010.003
Spot11/1/2010ROS0.60.01Unit1030.60.010.009
AUCTIONAUCTIONLOCATIONOFFEROFFERPTIDAWARDEDMARKET
TYPEMONTHDESCRIPTIONCAPACITYPRICENAMECAPACITYCLEARING PRICEUNSOLD
Spot11/1/2010ROS2.00.01Unit 1222.00.010.030
Spot11/1/2010ROS1.60.01Unit 1211.60.010.024
Spot11/1/2010ROS1.50.01Unit 21.50.010.023
Spot11/1/2010ROS0.30.01Unit 10.30.010.004
Spot11/1/2010ROS0.10.01Unit 30.10.010.002
Spot11/1/2010ROS39.00.05Unit 930.00.0139.000
Spot11/1/2010ROS62.40.05Unit 50.00.0162.400
Spot11/1/2010ROS34.60.05Unit 420.00.0134.600
Spot11/1/2010ROS2.30.05Unit 1200.00.012.300
Spot11/1/2010ROS100.00.05Unit 430.00.01100.000
Spot11/1/2010ROS81.70.07Unit 60.00.0181.700
Spot11/1/2010ROS2.10.1Unit 450.00.012.100
Spot11/1/2010ROS35.80.1Unit 880.00.0135.800
Spot11/1/2010ROS38.90.1Unit 900.00.0138.900
Spot11/1/2010ROS20.10.1Unit 230.00.0120.100
Spot11/1/2010ROS60.50.1Unit 910.00.0160.500
Spot11/1/2010ROS63.20.1Unit 1190.00.0163.200
Spot11/1/2010ROS10.80.1Unit 580.00.0110.800
Spot11/1/2010ROS23.80.1Unit 470.00.0123.800
Spot11/1/2010ROS34.50.1Unit 480.00.0134.500
Spot11/1/2010ROS13.60.1Unit 500.00.0113.600
Spot11/1/2010ROS20.30.1Unit 490.00.0120.300
Spot11/1/2010ROS0.30.1Unit 750.00.010.300
Spot11/1/2010ROS0.90.1Unit 760.00.010.900
Spot11/1/2010ROS0.50.1Unit 170.00.010.500
Spot11/1/2010ROS100.00.1Unit 440.00.01100.000
Spot11/1/2010ROS100.00.15Unit 430.00.01100.000
Spot11/1/2010ROS100.00.2Unit 440.00.01100.000
Spot11/1/2010ROS10.10.25Unit 590.00.0110.100
Spot11/1/2010ROS107.80.25Unit 430.00.01107.800
Spot11/1/2010ROS162.20.26Unit 440.00.01162.200
Spot11/1/2010ROS0.20.3Unit 710.00.010.200
Spot11/1/2010ROS85.00.5Unit 770.00.0185.000
Spot11/1/2010ROS10.00.6Unit 790.00.0110.000
11/1/2010 Total5,127.03,748.71,378.302
Spot12/1/2010ROS388.70.5Unit 63164.20.5224.5
Spot12/1/2010ROS85.00.5Unit 7735.90.549.1
Spot12/1/2010ROS50.00.5Unit 8021.10.528.9
Spot12/1/2010ROS38.70.55Unit 800.00.538.7
Spot12/1/2010ROS11.30.55Unit 810.00.511.3
Spot12/1/2010ROS10.00.6Unit 790.00.510.0
Spot12/1/2010ROS50.00.6Unit 810.00.550.0
Spot12/1/2010ROS50.00.65Unit 810.00.550.0
Spot12/1/2010ROS50.00.7Unit 810.00.550.0
Spot12/1/2010ROS50.00.75Unit 810.00.550.0
Spot12/1/2010ROS69.50.85Unit 810.00.569.5
Spot12/1/2010ROS30.50.85Unit 820.00.530.5
Spot12/1/2010ROS389.00.93Unit 610.00.5389.0
Spot12/1/2010ROS100.00.95Unit 820.00.5100.0
Spot12/1/2010ROS100.01.15Unit 820.00.5100.0
Spot12/1/2010ROS50.31.3Unit 820.00.550.3
12/1/2010 Total1,523.0221.31,301.7
Spot1/1/2011ROS3.30.5Unit 41.70.51.6
Spot1/1/2011ROS201.80.5Unit 63104.50.597.3
Spot1/1/2011ROS389.00.93Unit 610.00.5389.0
1/1/2011 Total594.1106.2487.9
Spot2/1/2011ROS389.00.93Unit 610.00.65389.0
2/1/2011 Total389.00.0389.0
AUCTIONAUCTIONLOCATIONOFFEROFFERPTIDAWARDEDMARKET
TYPEMONTHDESCRIPTIONCAPACITYPRICENAMECAPACITYCLEARING PRICEUNSOLD
Spot3/1/2011ROS10.00.3Unit 794.80.35.2
Spot3/1/2011ROS389.00.3Unit 61187.80.3201.2
Spot3/1/2011ROS0.60.33Unit 140.00.30.6
Spot3/1/2011ROS0.40.33Unit 120.00.30.4
Spot3/1/2011ROS4.60.33Unit 80.00.34.6
Spot3/1/2011ROS0.10.33Unit 150.00.30.1
Spot3/1/2011ROS0.30.33Unit 90.00.30.3
Spot3/1/2011ROS0.80.33Unit 100.00.30.8
Spot3/1/2011ROS0.60.33Unit 130.00.30.6
Spot3/1/2011ROS0.70.33Unit 110.00.30.7
Spot3/1/2011ROS388.70.5Unit 630.00.3388.7
Spot3/1/2011ROS110.40.5Unit 770.00.3110.4
Spot3/1/2011ROS313.10.93Unit 620.00.3313.1
3/1/2011 Total1,219.3192.61,026.7
Spot4/1/2011ROS19.50.15Unit 789.10.1510.4
Spot4/1/2011ROS388.80.15Unit 43180.60.15208.2
Spot4/1/2011ROS362.20.15Unit 44168.20.15194.0
Spot4/1/2011ROS10.10.25Unit 590.00.1510.1
Spot4/1/2011ROS164.00.3Unit 610.00.15164.0
Spot4/1/2011ROS10.00.3Unit 790.00.1510.0
Spot4/1/2011ROS0.20.3Unit 710.00.150.2
Spot4/1/2011ROS0.40.3Unit 700.00.150.4
Spot4/1/2011ROS4.90.33Unit 80.00.154.9
Spot4/1/2011ROS0.30.33Unit 90.00.150.3
Spot4/1/2011ROS0.80.33Unit 100.00.150.8
Spot4/1/2011ROS0.90.33Unit 110.00.150.9
Spot4/1/2011ROS0.40.33Unit 120.00.150.4
Spot4/1/2011ROS0.60.33Unit 130.00.150.6
Spot4/1/2011ROS0.60.33Unit 140.00.150.6
Spot4/1/2011ROS0.10.33Unit 150.00.150.1
Spot4/1/2011ROS388.70.5Unit 630.00.15388.7
Spot4/1/2011ROS110.40.5Unit 770.00.15110.4
Spot4/1/2011ROS313.10.93Unit 620.00.15313.1
4/1/2011 Total1,776.0357.91,418.1
Spot5/1/2011ROS168.20.65Unit 7475.10.3793.1
Spot5/1/2011ROS48.30.93Unit 620.00.3748.3
5/1/2011 Total216.575.1141.4
Spot6/1/2011ROS262.30.93Unit 620.00.55262.3
6/1/2011 Total262.30.0262.3
Spot7/1/2011ROS5.10.15Unit 732.10.153.0
Spot7/1/2011ROS5.10.15Unit 742.10.153.0
Spot7/1/2011ROS50.00.15Unit 420.60.1529.4
Spot7/1/2011ROS23.10.15Unit 229.50.1513.6
Spot7/1/2011ROS100.00.15Unit 4341.20.1558.8
Spot7/1/2011ROS50.00.18Unit 430.00.1550.0
Spot7/1/2011ROS50.00.2Unit 40.00.1550.0
Spot7/1/2011ROS42.30.2Unit 430.00.1542.3
Spot7/1/2011ROS50.00.25Unit 40.00.1550.0
Spot7/1/2011ROS7.60.25Unit 590.00.157.6
Spot7/1/2011ROS82.20.3Unit 40.00.1582.2
Spot7/1/2011ROS0.20.4Unit 710.00.150.2
Spot7/1/2011ROS0.30.4Unit 700.00.150.3
Spot7/1/2011ROS13.00.5Unit 770.00.1513.0
Spot7/1/2011ROS236.20.5Unit 630.00.15236.2
Spot7/1/2011ROS19.50.6Unit 790.00.1519.5
Spot7/1/2011ROS262.30.93Unit 620.00.15262.3
AUCTIONAUCTIONLOCATIONOFFEROFFERPTIDAWARDEDMARKET
TYPEMONTHDESCRIPTIONCAPACITYPRICENAMECAPACITYCLEARING PRICEUNSOLD
7/1/2011 Total996.975.6921.3
Spot8/1/2011ROS35.20.05Unit 4219.90.0515.3
Spot8/1/2011ROS3.00.05Unit 751.70.051.3
Spot8/1/2011ROS0.90.05Unit 760.50.050.4
Spot8/1/2011ROS34.50.05Unit 619.50.0515.0
Spot8/1/2011ROS14.30.05Unit 498.10.056.2
Spot8/1/2011ROS14.00.05Unit 507.90.056.1
Spot8/1/2011ROS1.40.1Unit 450.00.051.4
Spot8/1/2011ROS3.20.1Unit 720.00.053.2
Spot8/1/2011ROS15.60.1Unit 870.00.0515.6
Spot8/1/2011ROS4.90.1Unit 860.00.054.9
Spot8/1/2011ROS4.70.1Unit 660.00.054.7
Spot8/1/2011ROS5.10.1Unit 670.00.055.1
Spot8/1/2011ROS3.80.1Unit 520.00.053.8
Spot8/1/2011ROS4.80.1Unit 510.00.054.8
Spot8/1/2011ROS4.50.1Unit 530.00.054.5
Spot8/1/2011ROS4.30.1Unit 540.00.054.3
Spot8/1/2011ROS48.30.1Unit 180.00.0548.3
Spot8/1/2011ROS50.80.13Unit 190.00.0550.8
Spot8/1/2011ROS6.40.15Unit 200.00.056.4
Spot8/1/2011ROS0.30.15Unit 700.00.050.3
Spot8/1/2011ROS0.20.15Unit 710.00.050.2
Spot8/1/2011ROS14.50.17Unit 210.00.0514.5
Spot8/1/2011ROS100.00.18Unit 440.00.05100.0
Spot8/1/2011ROS100.00.2Unit 440.00.05100.0
Spot8/1/2011ROS7.60.25Unit 590.00.057.6
Spot8/1/2011ROS50.00.25Unit 440.00.0550.0
Spot8/1/2011ROS100.00.28Unit 430.00.05100.0
Spot8/1/2011ROS19.50.3Unit 790.00.0519.5
Spot8/1/2011ROS39.70.3Unit 430.00.0539.7
Spot8/1/2011ROS50.00.35Unit 440.00.0550.0
Spot8/1/2011ROS25.00.4Unit 440.00.0525.0
Spot8/1/2011ROS24.90.5Unit 440.00.0524.9
Spot8/1/2011ROS110.30.5Unit 770.00.05110.3
8/1/2011 Total901.757.6844.1
Spot9/1/2011ROS0.30.2Unit 700.00.180.3
Spot9/1/2011ROS0.20.2Unit 710.00.180.2
Spot9/1/2011ROS13.30.2Unit 230.00.1813.3
Spot9/1/2011ROS69.90.2Unit 440.00.1869.9
Spot9/1/2011ROS7.60.25Unit 590.00.187.6
Spot9/1/2011ROS100.20.5Unit 610.00.18100.2
Spot9/1/2011ROS307.80.93Unit 630.00.18307.8
9/1/2011 Total499.30.0499.3
Spot10/1/2011ROS53.00.13Unit 4324.00.1329.0
Spot10/1/2011ROS25.80.15Unit 190.00.1325.8
Spot10/1/2011ROS36.00.16Unit 440.00.1336.0
Spot10/1/2011ROS298.50.2Unit 630.00.13298.5
Spot10/1/2011ROS13.30.2Unit 230.00.1313.3
Spot10/1/2011ROS0.20.2Unit 710.00.130.2
Spot10/1/2011ROS0.30.2Unit 700.00.130.3
Spot10/1/2011ROS7.60.25Unit 590.00.137.6
Spot10/1/2011ROS85.00.5Unit 770.00.1385.0
10/1/2011 Total519.724.0495.7
Attachment I-B. Existing Generating Facilities
Page 34
2011 Capability Year
EXISTING GENERATING FACILITIES AS OF OCTOBER 2010
Owner,NameSUM20112010
LocationFuel
REF.Operator,In-ServicePlateCRISCapabilityCo-Net
NO.and / orDateRatingCap (A)(Megawatts)GenUnitFCTypeTypeTypeEnergy
Billing OrganizationStation UnitZonePTIDTownCntyStYYYY-MM-DD(MW)(MW)SummerWinterY/NTypeTS123(GWh)CF
1064Athens Generating Company, LPAthens 1F23668Athens039362004-05-01441.0316.6310.9395.5CCNG2,243.372.5%
1065Athens Generating Company, LPAthens 2F23670Athens039362004-05-01441.0315.6309.3390.9CCNG1,827.759.6%
1066Athens Generating Company, LPAthens 3F23677Athens039362004-05-01441.0312.8311.1396.1CCNG2,037.165.8%
1659PSEG Energy Resource & Trade, LLCBethlehem GS1F323560Bethlehem001362005-07-01297.7252.3246.6282.4CCNGFO21,409.160.8%
1660PSEG Energy Resource & Trade, LLCBethlehem GS2F323561Bethlehem001362005-07-01297.7252.3246.6282.4CCNGFO21,409.160.8%
1661PSEG Energy Resource & Trade, LLCBethlehem GS3F323562Bethlehem001362005-07-01297.7252.3246.6282.4CCNGFO21,409.160.8%
Class A Averages2004-11-303692842793381,72363.8%
1647NRG Power Marketing LLCOswego 5C23606Oswego075361976-02-01901.8850.3822.0844.5NSTWAFO631.90.4%
1648NRG Power Marketing LLCOswego 6C23613Oswego075361980-07-01901.8835.2826.0843.0NSTWAFO632.80.4%
1335International Paper CompanyTiconderogaF23804Ticonderoga031361970-01-0142.17.69.810.2YSTFO60.10.1%
1119Dynegy Power Marketing, Inc.Danskammer 1G23586Newburgh071361951-12-0172.067.066.565.7NSTTAFO6NGFO23.00.5%
1120Dynegy Power Marketing, Inc.Danskammer 2G23589Newburgh071361954-09-0173.562.761.763.7NSTTAFO6NGFO24.30.8%
1126Dynegy Power Marketing, Inc.Roseton 1G23587Newburgh071361974-12-01621.0614.8609.7626.0NSTTAFO6NGFO2204.63.8%
1127Dynegy Power Marketing, Inc.Roseton 2G23588Newburgh071361974-09-01621.0605.7602.5605.0NSTTAFO6NGFO2159.03.0%
Class F Averages1968-12-18462435428437621.6%
1421Mirant Energy Trading, LLCBowline 1G23526West Haverstraw087361972-09-01621.0577.7578.3558.0NSTTANGFO6180.43.6%
1422Mirant Energy Trading, LLCBowline 2G23595West Haverstraw087361974-05-01621.0557.4529.1561.8NSTWANGFO6112.62.4%
Class G Averages1973-07-016215685545601463.0%
1006AES Eastern Energy, LPSomersetA23543Somerset063361984-08-01655.1686.5678.0684.1NSTWABIT4,596.177.0%
1639NRG Power Marketing LLCDunkirk 1A23563Dunkirk013361950-11-01100.096.275.074.9NSTTABIT358.754.6%
1640NRG Power Marketing LLCDunkirk 2A23564Dunkirk013361950-12-01100.097.275.074.9NSTTABIT365.755.7%
1641NRG Power Marketing LLCDunkirk 3A23565Dunkirk013361959-09-01217.6201.4185.0185.0NSTTABIT1,053.165.0%
1642NRG Power Marketing LLCDunkirk 4A23566Dunkirk013361960-08-01217.6199.1185.0184.9NSTTABIT889.854.9%
1644NRG Power Marketing LLCHuntley 67A23561Tonawanda029361957-12-01218.0196.5189.5187.5NSTTABIT973.959.0%
1645NRG Power Marketing LLCHuntley 68A23562Tonawanda029361958-12-01218.0198.0189.5187.5NSTTABIT1,073.665.0%
1001AES Eastern Energy, LPCayuga 1C23584Lansing109361955-09-01155.3154.1154.0154.5NSTTABIT837.962.0%
1002AES Eastern Energy, LPCayuga 2C23585Lansing109361958-10-01167.2154.7158.7155.1NSTTABIT943.769.5%
1726Trigen-Syracuse Energy Corp.Syracuse Energy ST2C323598Syracuse067361991-08-0190.658.962.861.9NSTBITFO224.54.6%
1121Dynegy Power Marketing, Inc.Danskammer 3G23590Newburgh071361959-10-01147.1137.2138.5137.0NSTTABITNGFO2652.954.4%
1122Dynegy Power Marketing, Inc.Danskammer 4G23591Newburgh071361967-09-01239.4236.2236.7236.5NSTTABITNGFO21,073.751.9%
Class H Averages1963-01-252102011941941,07063.0%
Attachment I-C. Class Average Avoidable Costs
Classification of ROS Generating Units
Class AClass FClass GClass H
TechnologyCombined CycleSteam ElectricSteam ElectricSteam Electric
Primary FuelNatural Gas#6 Fuel OilNatural GasCoal
Total Units in Group67212
Dual-Fueled Units in Group3422
Average Capacity Factor63.8%1.6%3.0%63.0%
Average In-Service Date30-Nov-200418-Dec-19681-Jul-197325-Jan-1963
Average Nameplate Rating (MW)369.4461.9621.0210.5
Net Plant Capacity - Summer (MW)278.5428.0553.4193.2
Net Plant Capacity - Winter (MW)338.3436.9559.9193.7
Net Plant Capacity - Summer/Winter Average (MW)308.4432.4556.7193.4
Fixed O&M and Fixed Cost Assum ptions
Class AClass FClass GClass H
Average Labor Rate, incl. Benefits (2011$/hour)58.3358.3358.3358.33
Number of Operating and Maintenance Staff27.0025.0021.0041.00
Labor - Routine O&M (2011$/year)3,275,7563,033,1082,547,8104,974,297
Routine Materials and Contract Services (2011$/year)3,037,5004,050,0003,825,0002,405,250
Administrative and General (2011$/year)585,000540,000483,750802,125
Other Fixed Cost Assum ptions
Insurance Rate0.30%0.30%0.30%0.30%
Market value of plant (2011$/kW)1,238788788900
Insurance (2011$/year)1,371,2121,091,2051,467,113568,328
Total Fixed O&M and Fixed Costs8,269,4688,714,3138,323,6738,749,999
$/kW-year (2011$)$26.81$20.15$14.95$45.24
Avoidable Cost Percentages for a Mothballed Unit
Labor - Routine O&M
Materials and Contract Services - Routine Administrative and General
Insurance
PJM Category for Percent Avoidable
Class A
82.18%
90.00%
84.46%
60.00%
Combined Cycle
2 on 1, Frame F
Class FClass GClass H
75.42%75.42%88.71%
90.00%90.00%90.00%
80.06%80.06%90.16%
60.00%60.00%60.00%
Oil and Gas Steam Oil and Gas Steam Subcritical Coal
Annual Avoidable Costs for a Mothballed Unit (2011$/year)
Class AClass FClass GClass H
Labor - Routine O&M2,692,0162,287,6111,921,5934,412,774
Materials and Contract Services - Routine2,733,7503,645,0003,442,5002,164,725
Administrative and General494,091432,311387,279723,232
Insurance822,727654,723880,268340,997
Total Annual Avoidable Costs6,742,5857,019,6456,631,6397,641,727
Total Annual Avoidable Costs (2011$/kW-year)$21.86$16.23$11.91$39.51
Page 36
Attachment I-D. Class Average Going Forward Costs
November 2010 - October 2011 (2011$)
Class AClass FClass GClass H
ROSROSROSROS
TechnologyCombined Cycle Steam Electric Steam Electric Steam Electric
Primary FuelNatural Gas#6 Fuel OilNatural GasCoal
Avoidable Costs - Mothball ($/kW-yr)21.8616.2311.9139.51
Avoidable Costs - Mothball ($/kW-yr) - UCAP basis123.9517.7813.0543.28
Net Revenues ($/kW-yr) - Actual53.196.198.1334.30
Going forward costs minus full net revenues ($/kW-yr)20.6911.595.3921.64
Summer ($/kW-month)0.071.280.602.40
Winter ($/kW-month)0.040.640.301.20
Going forward costs minus half net revenues ($/kW-yr)2.3714.688.9826.12
Summer ($/kW-month)0.251.621.002.90
Winter ($/kW-month)0.120.810.501.45
Going forward costs minus zero net revenues ($/kW-yr)23.9517.7813.0543.28
Summer ($/kW-month)2.481.961.454.80
Winter ($/kW-month)1.240.980.732.41
Note 1. All remaining values in this table are expressed in UCAP terms
Note 2. The three GFC calculations reflect the average costs and revenues of the underlying generators within the class.
Because individual generator GFCs are assigned a minimum value of zero, averaging across a group produces
a different result from showing the results individually.
Page 37
Confidential Attachment I-E. Unsold Capacity Offers (Unmasked)
(Not included with the public filing.)
Page 38
Confidential Attachment I-F. Market Participant Explanations
(Not included with the public filing.)
Page 39
II.Report on New Generation Projects
In its October 23, 2006 order, the Commission ordered the NYISO to submit “a list of
investments in new generation projects in New York (including a description and current status of each such project), regardless of the stage of project development at the time of the filing.”23 The NYISO keeps a list of Interconnection Requests and Transmission Projects for the New
York Control Area (“NYCA”) that includes information about all generation projects in the State that have requested interconnection.
The NYISO interconnection process is described in two attachments of the NYISO
OATT: Attachment X entitled, “Standard Large Facility Interconnection Procedures,” and
Attachment Z entitled, “Small Generator Interconnection Procedures.” Attachment X applies to Generating Facilities that exceed 20 MW in size and to Merchant Transmission Facilities,
collectively referred to as “Large Facilities.” Attachment Z applies to Generating Facilities no larger than 20 MW.
Under Attachment X, Developers of Large Facilities must submit an Interconnection
Request to the NYISO. The NYISO assigns a Queue Position to all valid Interconnection
Requests. Under Attachment X, proposed generation and transmission projects undergo up to three studies: the Feasibility Study, the System Reliability Impact Study, and the Facilities Study. The Facilities Study is performed on a Class Year basis for a group of eligible projects pursuant to the requirements of Attachment S of the NYISO OATT. Under Attachment Z, proposed small generators undergo a process that is similar, but with different paths and options that are
dependent on the specific circumstances of the project.
Proposed generation and transmission projects currently in the NYISO Interconnection
Process are listed on the list of Interconnection Requests and Transmission Projects for the
NYCA (“NYISO Interconnection Queue”). The generation projects on that list are shown in
Attachment A, which is dated November 30, 2011. The NYISO updates the NYISO
Interconnection Queue on at least a monthly basis and posts the most recent list on the NYISO’s
public web site at
http://www.nyiso.com/public/markets_operations/services/planning/documents/index.jsp.
23 New York Indep. Sys. Operator, Inc., 117 FERC ¶ 61,086, at P 14 (2006).
Page 40
Explanations for the various columns of the list are provided in the notations on the last page of the list. The status of each project on the NYISO Interconnection Queue is shown in the column labeled “S.” An explanation of this column is provided in Attachment B. Also, note that the proposed in-service date for each project is the date provided to the NYISO by the respective Owner/Developer, is updated only on a periodic basis, and is subject to change.
Page 41
Attachment II-A. Interconnection Queue
Page 42
INTERCONNECTION REQUESTS AND TRANSMISSION PROJECTS / NEW YORK CONTROL AREA
QueueDateSPWPType/LocationInterconnectionLastAvailabilityProposed In-Service
Pos.Owner/DeveloperProject Nameof IR(MW)(MW)FuelCounty/StateZPointUtilitySUpdateof StudiesOriginalCurrent
20KeySpan Energy, Inc.Spagnoli Road CC Unit
106TransGas Energy, LLCTransGas Energy
115Central Hudson Gas & ElectricEast Fishkill Transformer
119ECOGEN, LLCPrattsburgh Wind Farm
127A Airtricity Munnsville Wind Farm, LLC Munnsville
147NY Windpower, LLCWest Hill Windfarm
154KeySpan Energy for LIPAHoltsville-Brentwood-Pilgrim
155Invenergy NY, LLCCanisteo Hills Windfarm
157BP Alternative Energy NA, Inc.Orion Energy NY I
161Marble River, LLCMarble River Wind Farm
166St. Lawrence Windpower, LLCSt. Lawrence Wind Farm
168Dairy Hills Wind Farm, LLCDairy Hills Wind Farm
169Alabama Ledge Wind Farm, LLC Alabama Ledge Wind Farm
171Marble River, LLCMarble River II Wind Farm
180A Green PowerCody Rd
182Howard Wind, LLCHoward Wind
189PPM Energy, Inc.Clayton Wind
197PPM Roaring Brook, LLC / PPMRoaring Brook Wind
198New Grange Wind Farm, LLCArkwright Summit Wind Farm
201NRG EnergyBerrians GT
204A Duer's Patent Project, LLCBeekmantown Windfarm
205National GridLuther Forest
206Hudson Transmission PartnersHudson Transmission
207Cape Vincent Wind Power, LLCCape Vincent
213Noble Environmental Power, LLC Ellenburg II Windfield
216Nine Mile Point Nuclear, LLCNine Mile Point Uprate
222Ball Hill Windpark, LLCBall Hill Windpark
224NRG Energy, Inc.Berrians GT II
227A Laidlaw Energy Group Inc.Laidlaw Energy & Env.
231Seneca Energy II, LLCSeneca
232Bayonne Energy Center, LLCBayonne Energy Center
234Steel Winds, LLCSteel Winds II
237Allegany Wind, LLCAllegany Wind
239Western Door Wind, LLCWestern Door Wind
239A Innovative Energy System, Inc.Modern Innovative Plant
241Noble Chateaugay Windpark II, LLC Chateaugay II Windpark
245Innovative Energy System, Inc.Fulton County Landfill
246PPM Energy, IncDutch Gap Wind
247RG&ERussell Station
250Seneca Energy II, LLCOntario
251CPV Valley, LLCCPV Valley Energy Center
253Marble River, LLCMarble River SPS
254Ripley-Westfield Wind LLCRipley-Westfield Wind
260Stephentown Regulation Services, LL Stephentown
New Gen Report_Attach A_Nyiso_Interconnection_Queue_113011
5/17/99250CC-NG Suffolk, NY
10/5/01 1100CC-NG Kings, NY
4/24/02N/AACDutchess, NY
5/20/02 78.2WYates, NY
10/9/026WMadison, NY
4/16/04 31.5WMadison, NY
8/19/04N/AACSuffolk, NY
9/17/04 148.5WSteuben, NY
10/12/04100100WHerkimer, NY
12/7/048484WClinton, NY
2/8/0579.579.5WJefferson, NY
2/8/05120120WWyoming, NY
2/8/0579.879.8WGenesee, NY
2/8/05 132.3 132.3WClinton, NY
3/17/051010WMadison, NY
3/21/05 57.457.4WSteuben, NY
4/8/05126126WJefferson, NY
7/1/057878WLewis, NY
7/21/05 79.879.8WChautauqua, NY
8/17/05200200CC-NG Queens, NY
10/31/05 19.519.5WClinton, NY
11/2/054040LSaratoga, NY
12/14/05660660DC/AC NY, NY - Bergen, NJ
1/12/06210210WJefferson, NY
4/3/062121WClinton, NY
5/5/06168168NUOswego, NY
7/21/069090WChautauqua, NY
8/23/065090CC-NG Queens , NY
10/30/0677WoCattaraugus, NY
11/2/066.46.4MSeneca, NY
11/27/06500500CT-DBayonne, NJ
12/8/061515WErie, NY
1/9/0772.572.5WCattaraugus, NY
1/30/07100100WYates, NY
1/31/076.46.4MNiagara, NY
3/15/07 19.519.5WFranklin, NY
4/17/073.23.2MMontgomary, NY
6/1/07250250WJefferson, NY
6/11/07300325CC-NG Monroe, NY
7/2/075.65.6MOntario, NY
7/5/07656753CC-NG Orange, NY
8/13/07 TBDTBD ACClinton, NY
8/14/07 124.2 124.2WChautauqua, NY
9/25/07 20 20 F Rensselaer, NY
KSpagnoli Road 138kVLIPA
JE13St, Rainey, or Farragut-345kV CONED
GEast Fishkill 345kV/115kVCONED/CHG&E
CEelpot Rd-Flat St. 115kVNYSEG
E46kV lineNYSEG
COneida-Fenner 115kVNM-NG
KHoltsville & Pilgrim 138kVLIPA
CBennett-Bath 115kVNYSEG
EWatkins Rd.-Inghams 115kVNM-NG
DWillis-Plattsburgh WP-1 230kVNYPA
ELyme Substation 115kVNM-NG
CStolle Rd.-Meyer 230kVNYSEG
BOakfield-Lockport 115kVNM-NG
DWillis-Plattsburgh WP-2 230kVNYPA
CFenner - Cortland 115kVNM-NG
CBennett-Bath 115kVNYSEG
ECoffeen St-Thousand Island 115kV NM-NG
EBoonville-Lowville 115kVNM-NG
ADunkirk-Falconer 115kVNM-NG
JAstoria West Substation 138kVCONED
DKents Falls - Sciota 115kVNYSEG
FRound Lake 115kVNM-NG
JWest 49th Street 345kVCONED
ERockledge Substation 115kVNM-NG
DWillis-Plattsburgh WP-2 230kVNYPA
CScriba Station 345kVNM-NG
ADunkirk-Gardenville 230kVNM-NG
JAstoria West Substation 138kVCONED
A13.2kVNM-NG
CGoulds Substation 34.5kVNYSEG
JGowanus Substation 345kVConEd
ASubstation 11A 115kVNM-NG
AHomer Hill - Dugan Rd. 115kVNM-NG
CGreenidge - Haley Rd. 115kVNYSEG
AYoungstown - Sanborn 34.5kVNM-NG
DChateaugay Substation 34.5kVNYSEG
FEphratah - Amsterdam 69kVNM-NG
EIndian River - Black Rive 115kVNM-NG
BRussell Station 115kVRG&E
CHaley Rd. - Hall 34.5kVNYSEG
GCoopers - Rock Tavern 345kVNYPA
DMoses-Willis-Plattsburgh 230kVNYPA
ARipley - Dunkirk 230kVNM-NG
F Stephentown 115kV NYSEG
83/31/10SRIS20062013/06
82/26/08SRIS20072012/Q3
48/19/08None2007/062012
109/30/10SRIS, FS2005/022012/05
114/30/11SRIS, FS2005/122013/12
109/30/10SRIS, FS2006/Q42012/09
53/31/11None2007/062017
62/28/11FES, SRIS2006/082013/12
66/30/10FES, SRIS2006/072013/12
117/31/11SRIS, FS20062012/10
106/30/11SRIS, FS2006/122013/09
83/31/10SRIS2006/112012/02
910/31/11FES, SRIS2007/12-2009/12N/A
117/31/11SRIS, FS2007/122012/10
113/31/11NoneNone2011/Q4
1311/30/11 FES, SRIS, FS2007/102011/12
82/28/11FES, SRIS2006/122013/10
113/31/11 FES, SRIS, FS2009/122012/12
910/31/11FES, SRIS2008/12N/A
96/30/11FES, SRIS2008/022014/06
104/30/11None2008/062013/06
65/31/11SIS2007/082012/Q2
1211/30/11 FES, SRIS, FS2009/Q22013/05
106/30/11 FES, SRIS, FS2009/Q42013/09
1010/31/11SRIS, FS2007/10N/A
119/30/11SRIS, FS2010/Q32012/06-2014/06
1011/30/11FES, SRIS2008/102011/12
96/30/11FES, SRIS2010/062014/06
710/28/09NoneN/A
104/30/11SRIS, FS2009/072011/12
1211/30/11FES, SRIS2008/112012/05
1110/31/11SRIS, FS2007/12N/A
1011/30/11FES, SRIS2009/10N/A
66/30/11FES, SRIS2010/102012/10
85/31/11None2007/122012/07
610/31/11None2008/07N/A
1411/30/11None2008/Q3I/S
65/31/11FES, SRIS2010/122013/12
68/31/10SRIS2013/072013/07
1111/30/11None2009/10N/A
811/30/11FES/SRIS2012/052012/10
57/31/11None2007/122012/10
810/31/11FES, SRIS2007/12N/A
1411/30/11None2008/10I/S
Updated: 11/30/2011
INTERCONNECTION REQUESTS AND TRANSMISSION PROJECTS / NEW YORK CONTROL AREA
QueueDateSPWPType/LocationInterconnectionLastAvailabilityProposed In-Service
Pos.Owner/DeveloperProject Nameof IR(MW)(MW)FuelCounty/StateZPointUtilitySUpdateof StudiesOriginalCurrent
261Astoria Generating CompanySouth Pier Improvement
263Stony Creek Wind Farm, LLCStony Creek Wind Farm
264RG&ESeth Green
266NRG Energy, Inc.Berrians GT III
267Winergy Power, LLCWinergy NYC Wind Farm
270Wind Development Contract Co LLC Hounsfield Wind
271State Line Wind Power LLCState Line Wind
276Air Energie TCI, Inc.Crown City Wind Farm
284Broome Energy Resources, LLC Nanticoke Landfill
285Machias Wind Farm, LLCMachias I
289New York State Electric & GasCorning Valley Trans.
290A Green Island Power AuthorityGreen Island Power
291Long Island Cable, LLCLI Cable - Phase 1
292Long Island Cable, LLCLI Cable - Phase 2a
294Orange & RocklandRamapo-Sugarloaf
295CCH Holdings Group, LLCCross Hudson II
305Transmission Developers Inc.Transmission Developers NYC
307New York Wire, LLCNew York Wire-Phase 1
308Astoria Energy II, LLCAstoria Energy II
310Cricket Valley Energy Center, LLC Cricket Valley Energy Center
311New York State Electric & GasConcord Casino
315CRC Renewables, LLCOnondaga Renewables
319AES Energy Storage, LLCCayuga Energy Storage
320AES Energy Storage, LLCSomerset Energy Storage
322Rolling Upland Wind Farm, LLCRolling Upland Wind
326NYSEG/RG&ERochester SVC/PST Trans.
330Long Island Solar Farm LLCUpton Solar Farms
331National GridNortheast NY Reinforcement
333National GridWestern NY Reinforcement
335NextEra Energy Resources, LLC Cold Creek Spring Wind
336Enfield Energy, LLCBlack Oak Wind
337Long Island Power AuthorityNorthport Norwalk Harbor
338RG&EBrown's Race II
339RG&ETransmission Reinforcement
340RG&EBrown's Race III
342Albany Energy, LLCAlbany Landfill
343Champlain Wind Link, LLCChamplain Wind Link I
344Champlain Wind Link, LLCChamplain Wind Link II
346Beacon PowerScotia Industrial Park
347Franklin Wind Farm, LLCFranklin Wind
349Taylor Biomass Energy, LLCTaylor Biomass
350Lake Erie Wind, LLCLake Erie Wind
351Linden VFT, LLCLinden VFT Uprate
353Chautauqua CountyChautauqua County Landfill
New Gen Report_Attach A_Nyiso_Interconnection_Queue_113011
10/2/07105108CT-NG Kings, NY
10/12/07 88.588.5WWyoming, NY
10/23/072.82.8HMonroe, NY
11/28/07744789CC-NG Queens, NY
11/30/07601601WNew York, NY
12/13/07 268.8 268.8WJefferson, NY
12/20/07 124.8 124.8WChautauqua, NY
1/30/089090WCortland, NY
3/6/081.61.6MBroome, NY
3/27/08 79.279.2WCattaraugus, NY
4/1/08 N/AN/AACSteuben, NY
4/7/082020LAlbany, NY
4/14/08440440WSuffolk, NY
4/14/08220220WSuffolk, NY
4/29/08 N/AN/AACOrange/Rockland, NY
5/6/08800800ACNew York, NY-NJ
7/18/08 10001000DCQuebec - NY, NY
7/29/08550550DCNJ - Kings, NY
8/20/08576 617.2 CS-NG Queens, NY
9/22/08 1002 1115 CC-NG Dutchess, NY
9/24/08 48.048.0LSullivan, NY
10/23/084747WoOnondaga, NY
12/3/082020ESOnondaga, NY
12/3/082020ESNiagara, NY
1/13/09 59.459.4WMadison, NY
3/9/09N/AN/AACMonroe, NY
4/7/0931.532SSuffolk, NY
4/22/09 N/AN/AACSaratoga, NY
5/5/09N/AN/AACCattaraugus, NY
6/9/09 150.7 150.7WCattaraugus, NY
6/29/095050WThompkins, NY
7/14/09 N/AN/AACSuffolk, NY
8/11/098.38.3HMonroe, NY
8/17/09 N/AN/AACMonroe, NY
9/2/0922HMonroe, NY
9/3/094.84.8MAlbany, NY
9/29/09600600ACClinton, NY - VT
9/29/09600600ACClinton, NY - VT
11/24/092020FSchenectady, NY
12/2/09 50.450.4WDelaware, NY
12/30/09 22.622.6SWMontgomery, NY
2/16/10810810WChautauqua, NY
3/2/101515ACRichmond, NY-NJ
4/26/10 3.2 3.2 M Chautauqua, NY
JGowanus 138kV
CStolle Rd - Meyer 230kV
B11kV
JAstoria 345kV
JGowanus Substation 345kV
EFitzpatrick - Edic 345kV
ASouth Ripley - Dunkirk 230kV
CCortland - Fenner 115kV
CNanticoke Landfill Plant 34.5kV
AGardenville - Homer Hill 115kV
CAvoca and Hillside 230kV
FMaplewood - Johnson Rd 115kV
KRuland Road 138kV
KRuland Road 138kV
GRamapo - Sugarloaf 138kV
JWest 49th St. Substation 345kV
JAstoria Substation 345kV
JGowanus Substation 345kV
JAstoria 345kV
GPleasant Valley - Long Mt. 345kV
ECoopers Corner - Rock Hill
CGeres Lock 115kV
CMilliken 115kV
ASomerset 69kV
ECounty Line - Brothertown 115kV
BStation 124 115kV
K8ER Substation 69kV
FNGrid 230kV
ANGrid 115kV
ASalamanca - Falconer 115kV
CBlack Oak Rd 115kV
KNorthport 138kV
BStation 3 / Station 137 34.5kV
BNiagara - Kintigh 345kV
BStation 6 34.5 kV
F34.5kV
DPlattsburgh - New Haven, VT 230kV
DPlattsburgh - New Haven, VT 345kV
FSpier - Rotterdam
ESidney - Delhi 115kV
FMaybrook - Rock Tavern
ADunkirk - Gardenville 230kV
JGoethals 345kV
A Hartfield - South Dow 34.5kV
ConEd810/31/11FES, SRIS2010/062015/01
NYSEG1011/30/11FES, SRIS2010/012012/12
RG&E76/30/10None2008/04N/A
NYPA89/30/11FES, SRIS2010/062013/06
ConEd58/31/10FES2015/012017/01
NYPA612/31/10FES/SRIS2010/09N/A
NM-NG610/31/11FES, SRIS2010/12N/A
NM-NG65/31/11FES, SRIS2011/122014/12
NYSEG106/30/10None2008/07N/A
NM-NG56/30/10FES2010/122012/12
NYSEG149/30/11SIS2010/12I/S
NM-NG611/30/11SIS2009/122012/Q4
LIPA58/31/10FES2013/012016/01
LIPA58/31/10FES2013/062016/01
O&R68/31/10SIS2009/062011/12
ConEd512/31/10FES2011/062013/06
ConEd/NYPA65/31/11FES, SRIS2014/Q12016/Q2
ConEd511/3/10FES2013/072014/10
NYPA1411/30/11SRIS2011/05I/S
ConEd99/30/11FES, SRIS2014/122014/12
NYSEG510/28/09None2009/09N/A
NM-NG55/31/11None2011/032013/06
NYSEG512/31/10None2010/07N/A
NYSEG512/31/10None2010/07N/A
NYSEG55/31/11FES2012/122014/12
NYSEG63/31/11SIS2011/122012-2013
LIPA1411/30/11SRIS2011/05I/S
NM-NG1210/31/11SIS2010-20192010-2019
NM-NG57/31/09None2014/Q22014/Q2
NM-NG59/30/11FES2012/122012/12
NYSEG510/31/11FES2010/102013/10
LIPA61/31/11SIS20162016
RG&E910/31/11None2011/08N/A
RG&E610/31/11SIS2015/092015/09
RG&E712/31/10None2010/12N/A
NM-NG97/31/11None2010/122012/01
NYPA58/31/10None2014/062014/06
NYPA412/22/09None2014/062014/06
NM-NG63/31/11None2011/082012/08
NYSEG35/31/11None2012/122012/12
CHGE96/30/11SRIS2012/042012/Q4
NM-NG49/30/11FES2015/122015/12
CONED96/30/11SRIS2010/11N/A
NM-NG146/30/11None2011/03I/S
Updated: 11/30/2011
INTERCONNECTION REQUESTS AND TRANSMISSION PROJECTS / NEW YORK CONTROL AREA
QueueDateSPWPType/LocationInterconnectionLastAvailabilityProposed In-Service
Pos.Owner/DeveloperProject Nameof IR(MW)(MW)FuelCounty/StateZPointUtilitySUpdateof StudiesOriginalCurrent
354Atlantic Wind, LLCNorth Ridge Wind5/13/10100100
355Brookfield Renewable PowerStewarts Bridge Hydro8/3/1033
357NRG EnergyNY Power Pathway9/10/10 10001000
358Anabaric Northeast & PowerBridgeWest Point Transmission9/13/10 10001000
360NextEra Energy Resources, LLC Watkins Glen Wind12/22/10 300.8 300.8
361US PowerGen Co.Luyster Creek Energy2/15/11401444
362Monticello Hills Wind, LLCMonticello Hills Wind3/7/112020
363Poseidon Transmission, LLCPoseidon Transmisssion4/27/11500500
364Bruce Hill Wind, LLCBruce Hill Wind5/4/111818
365Transmission Developers Inc.Champlain Hudson SPS7/15/11 TBD TBD
366NextEra Energy Resources, LLC Watkins Glen East8/2/11 150.6 150.6
367Orange & RocklandNorth Rockland Transformer9/14/11 TBD TBD
368Consolidated Edison Company of NY Feeder 76 Ramapo to Rock Tav 10/13/11 TBD TBD
369Clover Leaf Power, LLCClover Leaf Hollers Ave10/24/11 173.9 192.8
370Smokey Avenue Wind, LLCSmokey Avenue Wind10/28/111818
371Ridgeline Eastern EnergyRidgeline Eastern Energy10/31/111818
372Dry Lots Wind, LLCDry Lots Wind10/31/113333
W St. Lawrence, NYE Nicholville - Parishville 115kVNM-NG
H Saratoga, NYF Spier Falls - EJ WestNM-NG
,,-
DCWestchester, NYH New Scotland - Roseton or Buchanan 345kVor Coned
DC Greene, Westchester, NY F, H Leeds - Buchanan North 345kVNM-NG/ConEd
W Schuyler, NYC Hillside - Meyer 230 kVNYSEG
CC Queens, NYJ Astoria SubstationCONED
W Otsego, NYE W. Winfield - Richfield Spring 46kV NYSEG
DC Suffolk, NYK Ruland Rd. SubstationLIPA
W Delaware, NYE Axtell Road Substation 34.5 kVNYSEG
AC Queens, NYJ Astoria and Farragut Subsations ConEd/NYPA
W Schuyler, NYC Montour Falls SubstationNYSEG
AC Rockland, NYG Line Y94 345kVConEd
AC Orange, Rockland, NY G Ramapo to Rock Tavern 345 kV ConEd/CenHud
CT Bronx, NYJ Parkchester City Substation 138 kV ConEd
W Otsego, NYE Worcester - Schenevus 23kVNM-NG
W Delaware, NYE River Rd Substation 46kVNYSEG
W Herkimer, NY E Schuyler to Whitesboro NM-NG
56/30/11FES2014/122014/12
53/31/11None2012/102012/10
32/28/11None2016/072016/07
36/30/11None2015/05-2016/05 2015/05-2016/05
36/30/11None2013/092013/06
39/30/11None2014/062014/06
57/31/11None2012/112012/11
310/31/11None2016/052016/05
311/30/11None2013/122013/12
47/31/11None2016/Q12016/Q1
211/30/11None2013/Q32014/Q2
49/30/11None2016/062016/06
411/30/11None2016/082016/08
111/30/11None2016/122016/12
211/30/11None2013/122013/12
211/30/11None2013/112013/11
2 11/30/11 None 2014/11 2014/11
NOTES: ● The column labeled 'SP' refers to the maximum summer megawatt electrical output. The column labeled 'WP' refers to the maximum winter megawatt electrical output.
● Type / Fuel. Key: ST=Steam Turbine, CT=Combustion Turbine, CC=Combined Cycle, CS= Steam Turbine & Combustion Turbine, H=Hydro, PS=Pumped Storage, W=Wind, NU=Nuclear, NG=Natural Gas, M=Methane, SW=Solid Waste, S=Solar, Wo=Wood, F=Flywheel ES=Energy Storage, O=Oil, C=Coal, D=Dual Fuel, AC=AC Transmission, DC=DC Transmission, L=Load
● The column labeled 'Z' refers to the zone
● The column labeled 'S' refers to the status of the project in the NYISO's LFIP. Key: 1=Scoping Meeting Pending, 2=FES Pending, 3=FES in Progress, 4=SRIS/SIS Pending, 5=SRIS/SIS in Progress, 6=SRIS/SIS Approved, 7=FS Pending, 8=Rejected Cost Allocation/Next FS Pending, 9=FS in Progress, 10=Accepted Cost Allocation/IA in Progress, 11=IA Completed, 12=Under Construction, 13=In Service for Test, 14=In Service Commercial, 0=Withdrawn
● Availability of Studies Key: None=Not Available, FES=Feasibility Study Available, SRIS=System Reliability Impact Study Available, FS=Facilities Study and/or ATRA Available ● Proposed in-service dates are shown in format Year/Qualifier, where Qualifier may indicate the month, season, or quarter.
New Gen Report_Attach A_Nyiso_Interconnection_Queue_113011Updated: 11/30/2011
Interconnection Queue Status Key
1=Scoping Meeting Pending
2=FESA Pending
3=FES in Progress
4=SRIS Pending
5=SRIS in Progress
6=SRIS Approved
7=FS Pending
8=Rejected Cost Allocation/ Next
FS Pending--
9=FS in Progress
10=Accepted Cost Allocation/ IA in
Progress
11=IA Completed
12=Under Construction
13=In Service for Test
14=In Service Commercial
0=Withdrawn
Interconnection Request has
been received, but scoping
meeting has not yet occurred
Awaiting execution of Feasibility Study Agreement
Feasibility Study is in Progress
Awaiting execution of SRIS Agreement and/or OC approval of SRIS scope
SRIS Approved by NYISO Operating Committee
Awaiting execution of Facilities Study Agreement
Project was in prior class year,
but rejected cost allocation—
Awaiting execution of Facilities
Study Agreement for next Class
Year or the start of the next
Class Year
Project in current Class Year Facilities Study
Interconnection Agreement is being negotiated
Interconnection Agreement is
executed and/or filed with FERC
Project is under construction
Project is no longer in the Queue
Page 46
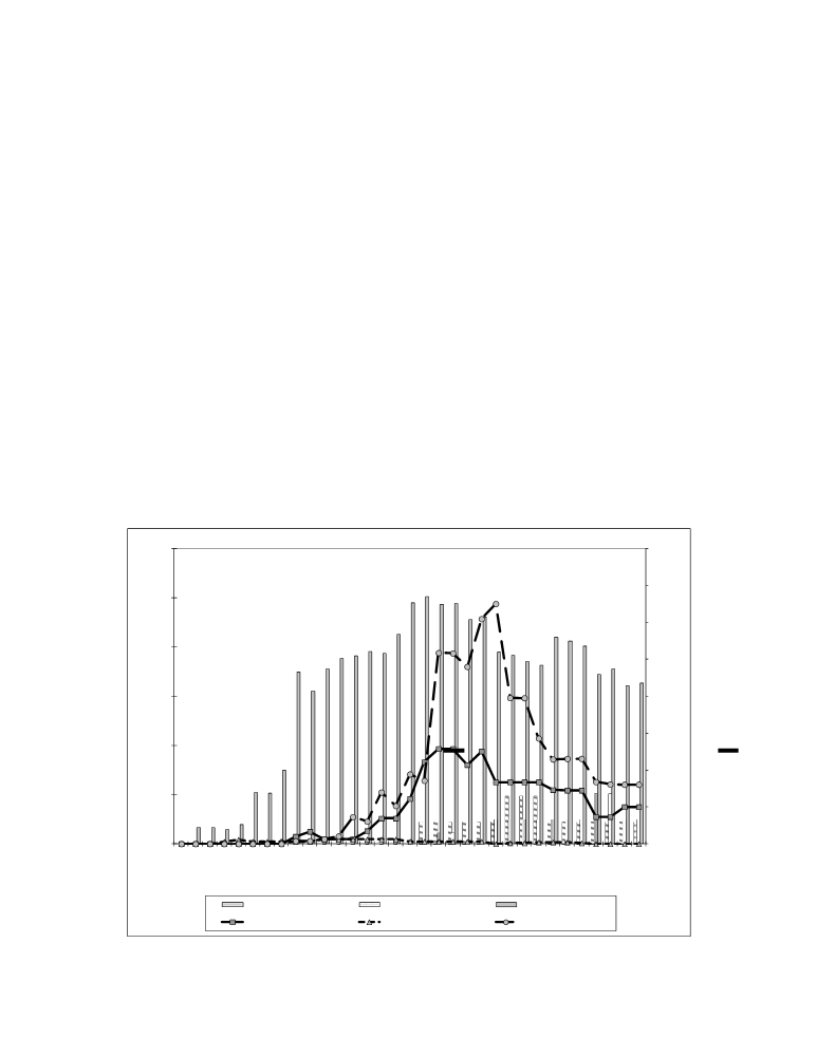
III. New Generation Projects and Net Revenue Analysis
The ICAP Demand Curves are designed to send signals to build new generation when it is needed. In past reports, the NYISO stated that it is difficult to relate the development of new generation to the ICAP Demand Curves given the lead time required to site, develop, and
construct new generation, and the address other barriers to new entry. The NYISO utilizes in this section of the report the same methodology it as in past reports and it is continuing to review the methodology for potential enhancements for future reports. In the summer of 2011, a 550 MW combined cycle facility located in New York City entered the Capacity market. The
NYISO anticipates that planned new generation projects will commence commercial operation. The projects currently in the study processes are listed on the NYISO’s interconnection queue in accordance with the time schedules provided by the developers.
The graph below depicts the amount of generation listed on the NYISO’s interconnection queue since 2003 in New York City, Long Island, and Rest of State - with wind projects
depicted separately from generation projects with other fuel types.
Chart 12. NYISO Interconnection Queue Projects
120008000
7000
10000
6000
8000
5000
60004000
3000
4000
2000
2000
1000
00
Wind Ca pa city-NYCWind Ca pa city-LIWind Ca pa city-ROS
All Other Ca pa city-NYCAll Other Ca pa city-LIAll Other Ca pa city-ROS
Page 47
This analysis is based on periodically updated versions of the NYISO interconnection
queue dating from May 2003 through October 2011.24 For purposes of this analysis, only
projects that entered the queue after May 1, 2003 were considered. Since the queue includes
projects at various stages, for purposes of this study it is reasonable to include only projects that
are deemed active. Accordingly, pre-2005 period projects with codes ‘I’, ‘W’, or ‘C’ were
excluded; for 2005 and beyond, status codes 0, 1, 12, 13, and 14 were omitted.
Generally, the amount of generation in the interconnection process has increased since the ICAP Demand Curves became effective in May 2003. The number of MW associated with projects based on technologies other than wind (measured on the left Y-axis, above) did not increase significantly until the summer of 2005. The graph above shows that beginning with the Winter 2007-2008 Capability Period, Rest of State has seen a sharply rising trend in the number of MW in the interconnection queue, particularly new non-wind projects. Since the January 2009 report and continuing through the date of this report, there has been a decrease in the total amount of Rest of State generation and New York City non-wind generation in the
interconnection queue. Chart 12 does not include proposed HVDC connections into New York
City, which currently total more than 4,200 MW -- an increase of roughly 1,900 MW from late
2008.
Proposed Resource Additions
In January 2011, the NYISO Board of Directors approved the 2010 Comprehensive
Reliability Plan (“CRP”), which was the fifth CRP since its introduction in 2006. Like the 2009
report, the 2010 CRP determined that there are no additional resource needs through the ten-year
Study Period under expected Bulk Power System conditions. The NYISO continues to track on
a quarterly basis the market-based projects that were submitted for the 2008 CRP, the last year of
which resource needs were identified. Table 8 presents the market-based projects and
24 Each project in the queue is provided a status code that identifies its position in the study
process that ranges from the initial scoping meeting to being in service. Prior to 2005, each project was
provided a status-code based on the NYISO System Reliability Impact Study from the following:
P=Pending, A=Active, I=Inactive, R=Under Review, C=Completed, W=Withdrawn. Starting in 2005, the
classification system was changed and status-codes were based on the standard steps in the NYISO’s
interconnection process as follows: 1=Scoping Meeting Pending, 2=FES Pending, 3=FES in Progress,
4=SRIS Pending, 5=SRIS in Progress, 6=SRIS Approved, 7=FS Pending, 8=Rejected Cost
Allocation/Next FS Pending, 9=FS in Progress, 10=Accepted Cost Allocation/IA in Progress, 11=IA
Completed, 12=Under Construction, 13=In Service for Test, 14=In Service Commercial, 0=Withdrawn,
where FES=Feasibility Study Available, SRIS=System Reliability Impact Study Available, FS=Facilities
Study and/or ATRA Available.
Page 48
Transmission Owners’ plans that were submitted in response to requests for solutions and were
included in the 2008 CRP. The table indicates that, as of June 2011, 520 MW of solutions are
still being reported to the NYISO as moving forward with development. The Empire Generation
Project, a market-based project in the 2008 CRP, went in-service in August 2010 and, therefore
is not listed in the Table 8. There are a number of other projects in the NYISO interconnection
queue that also are moving forward in the interconnection process, but which have not been
offered as market based solutions in the CRPP process.
Table 8. June 2011 Status of the 2008 CRP Market - Based Solutions and TOs’ Plans
Original
Project TypeSubmitted
MWZone
Resource Proposals
In-
Service
Date
Current Status1
Gas Turbine
NRG Astoria Re-
powering2
CRP 2005, CRP
2007, CRP 2008
520 MWJJan - 2011
New Target June 2014
NYISO interconnection
queue projects # 201 and
# 224
Back-to-Back2008 and was anQ2/2011New Target May 2013
HVDC, AC Linealternative regulated660 MWPJM - JPJM QueueNYISO interconnection
HTPproposal in CRPO66queue projects # 206
2005
TOs' Plans
ConEd M29
Project
CRP 2005N/A
In-Service 2011
JMay - 2011NYISO interconnection
queue projects # 153
1 Status as provided by Market Participant as of June 2011
2 NRG submitted three proposals, one of which was withdrawn. For the purposes of the Market-Based solutions' evaluation, the NYISO assumed the lowest MW proposal.
Revenue Analysis
The Commission’s order directing the NYISO to submit this filing stated that the NYISO
should include a complete net revenue analysis to provide information about whether NYISO
market revenues are adequate to incent new capacity resources in regions where Capacity is
needed. Where there is growing pressure on existing Capacity, e.g., the reserve margin is
shrinking, there should be a rise in combined revenues from energy and Capacity markets. As
the NYISO did for prior annual reports, for this report, the NYISO examined the level of “need”
Page 49

for additional Capacity by looking at the percentage of Capacity in excess of the applicable
minimum Installed Capacity requirement. The NYISO then looked at possible revenues from the Capacity and energy markets for a hypothetical combustion turbine. Based on the methodology used, which is the same as used in past years, the analysis shows that, in general, there is a
tendency for revenues to increase as the percentage of excess Capacity decreases and vice versa.
Quantification of “Need”
For purposes of this analysis, the excess of Capacity relative to the minimum requirement was used as a proxy for need. Capacity Margins are calculated as:
Capacity Margin % =x 100
Using this definition, a value in excess of 100% reflects an excess Capacity margin. A
relatively high value indicates less of a need for new Capacity and, conversely, declining values
suggest an increased need. The following table displays the required and available amounts of
Capacity (UCAP) as calculated from detailed data from monthly certifications, auction offers,
and sales awards.
Table 9. Available Capacity vs. Required Capacity
20072008200920102011
Requirement (MW)37,22836,63336,36235,04534,684
NYCAAvailable Cap. (MW)38,64138,19238,21737,27238,041
Capacity margin %103.8%104.3%105.1%106.4%109.7%
Requirement (MW)9,0588,9118,8558,3368,832
NYCAvailable Cap. (MW)10,1589,8589,6128,7539,660
Capacity margin %112.1%110.6%108.5%105.0%109.4%
Requirement (MW)5,0564,6854,7495,0215,052
LIAvailable Cap. (MW)5,1925,3535,3315,864255,952
Capacity margin %102.7%114.3%112.3%116.8%117.8%
In Table 9, the required Capacity is based on the annual NYCA Minimum Installed
Capacity Requirement and for each of NYC and Long Island, the respective Locational
Minimum Installed Capacity requirements. Available Capacity reflects the aggregate of UCAP
25 The available capacity for Long Island (LI) in 2010 was 5,864 MW; however, this table in the 2010 annual report incorrectly stated it was 5,662 MW. Consequently, the capacity margin for Long Island in the 2010 annual report should have been stated as 116.8%.
Page 50
ratings excluding the amount imported via external transactions.26 In 2011, the NYCA capacity margin increased in part due to a decrease in the IRM from 18.0% to 15.5%.
Measure of Revenues
As with the analysis in prior reports, for this report, the NYISO assumed a revenue
requirement based on the ICAP Demand Curve for the respective years. It uses a levelized
annual revenue requirement for a given capability year (May - April) that is derived from a cost
of new entry (“CONE”) of a gas-fueled simple-cycle, combustion turbine (“GT”) for a given
location in the NYCA or the respective Locality. For purposes of the annual report analysis, the
NYISO used prior reports’ methodology, which is based on Summer/Winter DMNCs, to convert
these annual revenue requirements into Summer and Winter $/kW-month equivalents. Next,
these monthly UCAP values were used to compute annual revenue requirements for each year
from 2007 through 2011.
Table 10, below, shows the annual revenue requirement for a hypothetical new entry unit based on the assumptions in ICAP Demand Curves for the corresponding Capability Years,
including the financial assumptions and different benchmark technologies for each of New York City, Long Island and the NYCA. For example, the notional figures for New York City in 2007 were based on a pair of LM 6000 Combustion Turbines, and the 2008 - 2011 Demand Curves
were based on an LMS 100 unit.
Table 10. Annual Revenue Requirements in UCAP Terms ($/MW)
20072008200920102011
NYCA$98,964$103,835$103,312$105,115$110,577
NYC$208,650$209,747$213,943$244,147$233,486
LI$186,021$180,914$194,743$211,069$214,785
Table 11 below shows the individual elements of revenues (i.e., those earned in the
Energy, Ancillary Services, and ICAP markets) that a hypothetical GT may have received based
26 In contrast to the prospective figures used in the NYISO’s annual Load & Capacity Reports, these charts reflect data based on realized outcomes over the summer Capability Periods.
Page 51
on actual LBMPs, natural gas prices, and other reasonable parameters used to calculate variable
costs.27
For this and previous reports, a model has been used to calculate the Energy and
Ancillary Services revenue for the hypothetical Demand Curve peaking plants: net energy
revenues are earned in hours when the day-ahead market LBMP price exceeds the calculated
variable cost; otherwise, day-ahead Ancillary Services revenues are earned. This approach is
similar to the “standard method” used by the MMU in its annual State of the Market reports.
In past annual reports, Ancillary Services revenues were based on 10 minutes reserve
prices. In this report, the NYISO revised the input so that the Ancillary Services revenues earned
by the hypothetical Demand Curve peaking plant reflected the capability of the applicable
Demand Curve peaking plant. This update required a change so that Ancillary Service revenues
for the hypothetical NYCA GT are based on Day-Ahead 30 minutes reserve prices. As a result,
the benchmark Ancillary Services revenues for NYCA have been recalculated for years 2007 -
2011. The results of the analysis are presented in Table 11. Because Table 12 and Chart 13 are
derived from data in Table 11, the adjustment reflected in Table 11 also affected the
corresponding NYCA revenue margins in Table 12 and Chart 13 for years 2007 through 2011.
27 The assumed parameters for the 2011 benchmark combustion turbines are based on the latest NERA Demand Curve Report (15 November 2010): For NYCA, Heat Rate = 10,206 btu/kWh, Variable Operating & Maintenance Costs (VOM) = $1/MWh, and Forced Outage Rate = 3%; For NYC and LI, Heat Rate = 9023 btu/kWh, VOM = $5/MWh, and Forced Outage Rate = 3.84%.
Page 52
NYCA
28
Energy$6,220$6,251
A/S$1,825$8,641
Capacity $31,310 $26,050
$5,291$20,815$16,646
$4,058$1,161$341
$27,920 $18,420 $3,820
16%15%14%52%80%
5%21%11%3%2%
80% 64% 75% 46% 18%
Total$39,355$40,942$37,269$40,397$20,807100%100%100%100%100%
Energy$32,575$41,243$24,221$59,052$59,02821%37%25%34%41%
A/S$13,002$17,894$14,155$7,648$12,8928%16%15%4%9%
NYCCapacity$111,220$51,980$58,640$104,600$72,44071%47%60%61%50%
Total$156,797$111,117$97,016$171,299$144,360100%100%100%100%100%
Energy$58,548$48,229$32,79529$84,130$95,78043%49%43%76%86%
LongA/S$9,804$16,998$11,829$5,356$11,4007%17%16%5%10%
Capacity$67,830$33,970$30,800$20,790$3,84050%34%41%19%3%
Total$136,182$99,197$75,424$110,276$111,020100%100%100%100%100%
In order to assess revenue adequacy for purposes of this report, Revenue Margin” is used.
“Revenue Margin”is Benchmark Revenues expressed as a percentage of Required Revenues, as
the metric. Revenue Margins are calculated as:
Using this approach, a higher value indicates a greater degree of adequacy of revenues.
The following table displays the values of Revenue Margins for the hypothetical peaking plant:
Table 12. Revenue Margins
LI73%55%39%52%52%
In 2011, Revenue Margins fell in both NYCA and New York City, largely due to the
decrease in capacity revenues. On Long Island, the decrease in capacity revenue was offset by an increase in the projected energy and ancillary services revenues, resulted in a Revenue Margin
similar to 2010.
28 These values are for the Capital Zone (Zone F), which is used as a representation for revenues in the NYCA .
29 The energy and A/S revenues for Long Island (LI) in 2009 have been updated to $32,759 and $11,829/MW from the $48,229 and $16,998/MW previously reported.
Page 53
To assess whether revenue stream for the hypothetical unit is adequate in relation to the
level of need for new Capacity, data from Tables 9 and 12 are graphed below, showing revenue
(Chart 13) and Capacity (Chart 14) margins. Chart 15 plots the Installed Capacity revenue
component of the total net revenue as a percentage of the cost of new entry in the NYCA and in
each Locality. In Chart 14, the high levels of excess Capacity in 2008 through 2010 do not lead
to corresponding declines in Capacity revenue. The reason they do not is the market rules
provide that UCAP Market Clearing Price is the greater of the NYCA or the respective Locality
clearing price. Both NYCA and New York City exhibit declining trends in revenue margins in
2011. If such conditions persist, it is reasonable to expect levels of excess Capacity to decline.
Page 54
Chart 13. UCAP-based Revenue Margins
80%
70%
60%
50%
40%
30%
20%
10%
0%
20072008200920102011
NYCA Revenue MarginNYC Revenue MarginLI Revenue Margin
Chart 14. UCAP-based Capacity Margins
120.0%
115.0%
110.0%
105.0%
100.0%
95.0%
20072008200920102011
NYCA Capacity MarginNYC Capacity MarginLI Capacity Margin
Page 55
Chart 15. Capacity Market Revenues Relative to CONE Requirements
60.0%
50.0%
40.0%
30.0%
20.0%
10.0%
0.0%
20072008200920102011
NYCANYCLI
Page 56
Attachment III-A
November 1999 - December 2009
Installed Capacity Auction Activity
New York Control Area (NYCA) Capacity
NYCACapability Period*MonthlySpot MarketMinimumExcess
(Strip)RequiredSold
MonthMWPriceMWPriceMWPriceMWMW
November-9935563.1
December-9935563.1
January-00Installed Capacity Market Existed but all purchases and sales were35563.1
February-00bilateral35563.1
March-0035563.1
April-0035563.1
May-001976.0$1.50434.2$1.3032.7$0.5035636.01976.0
June-001976.0$1.50528.4$1.4037.1$1.2835563.11976.0
July-001976.0$1.50344.2$1.80140.8$1.9835563.11976.0
August-001976.0$1.50351.4$1.62194.8$1.7735563.11976.0
September-001976.0$1.50648.9$1.3281.3$1.1635563.11976.0
October-001976.0$1.50681.6$1.3096.9$0.8935563.11976.0
November-004010.6$1.041813.6$1.00157.7$0.8035563.14010.6
December-004010.6$1.041854.1$0.97167.2$0.8635563.14010.6
January-014010.6$1.041847.6$0.97170.5$0.8535563.14010.6
February-014010.6$1.041893.8$0.95177.2$0.8335563.14010.6
March-014010.6$1.042032.8$0.95208.1$0.7935563.14010.6
April-014010.6$1.041659.7$0.87192.3$0.5935563.14010.6
May-012738.6$1.90852.3$2.251022.2$9.5836132.02738.6
June-012738.6$1.90397.6$2.681521.0$9.4136132.02738.6
July-012738.6$1.901776.6$4.311534.9$9.4436132.02738.6
August-012738.6$1.901788.4$4.561601.3$9.3536132.02738.6
September-012738.6$1.901701.2$4.161498.0$9.2136132.02738.6
October-012738.6$1.901787.1$4.031473.4$9.1436132.02738.6
November-011760.4$2.00878.0$0.105.8$-32892.31760.4
December-011760.4$2.00687.2$0.496.5$-32892.31760.4
January-021760.4$2.00750.5$0.84133.0$0.7532892.31760.4
February-021760.4$2.00836.2$0.7025.5$-32892.31760.4
March-021760.4$2.00901.3$0.6130.0$0.2532892.31760.4
April-021760.4$2.00677.9$0.695.6$0.0232892.31760.4
May-023201.6$1.75552.1$0.332.3$-32479.53201.6
June-023201.6$1.75438.3$0.3620.3$0.0132479.53201.6
July-023201.6$1.75721.9$0.9711.1$0.0132479.53201.6
August-023201.6$1.75722.6$0.9155.4$0.0132479.53201.6
September-023201.6$1.75714.0$0.2571.2$0.0132479.53201.6
October-023201.6$1.75712.1$0.161.4$-32479.53201.6
November-023486.7$0.651024.3$0.5085.0$0.4034169.73486.7
December-023486.7$0.651219.3$0.2851.4$0.1034169.73486.7
Figure 1.a.
Page 57
November 1999 - December 2009
Installed Capacity Auction Activity
New York Control Area (NYCA) Capacity
NYCACapability Period*MonthlySpot MarketMinimumExcess
(Strip)RequiredSold
MonthMWPriceMWPriceMWPriceMWMW
January-033486.7$0.651584.4$0.26189.1$2.1034169.73486.7
February-033486.7$0.651623.1$0.3485.6$0.5034169.73486.7
March-033486.7$0.651825.9$0.3258.8$0.2534169.73486.7
April-033486.7$0.651571.5$0.154.2$0.0134169.73486.7
May-032889.2$1.671634.8$1.30101.5$0.2535303.50
June-032889.2$1.671866$1.062148.7$2.3435303.52073.2
July-032889.2$1.671249.2$2.012824.2$2.2835303.52274.1
August-032889.2$1.671344.1$2.043096.6$2.2535303.52299.3
September-032889.2$1.671396.7$1.973134.1$2.0835303.52448.1
October-032889.2$1.671408.4$1.933253.2$2.0135303.52504.8
November-032163.2$1.172128.8$1.156833$1.9435203.42566.9
December-032163.2$1.171860.1$1.487203.1$1.7935203.42698.6
January-042163.2$1.172083.6$1.506972.2$1.7535203.42732.1
February-042163.2$1.172475.9$1.586379.9$1.7335203.42747.4
March-042163.2$1.172180$1.546569.8$1.0035203.43369.3
April-042163.2$1.172646.7$0.996987.5$0.8035203.43543.8
May-042441$1.682489.7$1.656189.1$1.3135584.53328
June-042441$1.682133.6$1.486239.9$1.2735584.53355.3
July-042441$1.681756.7$1.296410.6$1.0435584.53518.8
August-042441$1.682046.5$1.156544.7$1.1735584.53428.1
September-042441$1.682258.8$1.166456.2$1.0735584.53499.6
October-042441$1.682460.8$1.186633.9$1.1235584.53465.6
November-043050.7$0.602344.4$0.706730.6$0.7035515.93759.3
December-043050.7$0.603058.4$0.696011.5$0.6135515.93823.5
January-053050.7$0.602945.8$0.595928.6$0.2735515.94064.8
February-053050.7$0.602769.6$0.496256.2$0.2535515.94082.2
March-053050.7$0.602890.9$0.456025.4$0.4135515.93966.2
April-053050.7$0.602891.5$0.486241.1$0.2735515.94064.8
May-052624.6$0.751630$0.756975.7$2.0035799.23110.8
June-052624.6$0.751752.9$1.406306.6$1.9635799.23135.2
July-052624.6$0.754077.8$1.295073.3$1.0035799.23703.4
August-052624.6$0.753819.1$0.815147.3$1.0035799.23703.4
September-052624.6$0.753412.5$0.815303.5$1.4535799.23436.7
October-052624.6$0.753861.2$1.035142$1.2535799.23555.2
November-052987.1$0.622676.1$0.676661.9$0.8535761.53789
December-052987.1$0.623466.7$0.686306$0.6535761.53907.2
Page 58
Figure 1.a. (cont’d)
November 1999 - December 2009
Installed Capacity Auction Activity
New York Control Area (NYCA) Capacity
NYCACapability Period*MonthlySpot MarketMinimumExcess
(Strip)Required
Sold
MonthMWPriceMWPriceMWPriceMWMW
January-062987.1$0.623966.1$0.635625.3$2.0135761.53102.5
February-062987.1$0.623379.8$1.016432.7$1.6735761.53305.2
March-062987.1$0.625214.9$0.585234.1$0.5735761.53954.5
April-062987.1$0.624899.7$0.515357.5$0.4035761.54055
May-063014.5$1.442196.7$1.646936.8$3.2537154.22526.4
June-063014.5$1.442747.7$2.386163$3.1237154.22601.6
July-063014.5$1.442914.1$2.585901.1$3.3337154.22481.4
August-063014.5$1.443447.6$2.855488.5$3.0037154.22675.1
September-063014.5$1.444041.3$2.755087.8$2.8037154.22295.3
October-063014.5$1.444258$2.625368.3$2.7737154.22814.8
November-063167.7$2.503170.9$1.737454.7$1.5037319.23577.8
December-063167.7$2.502475.7$2.307841.7$2.1837319.23170.5
January-073167.7$2.502756.5$2.457780.6$2.7137319.22853.4
February-073167.7$2.503308.7$2.517029.1$2.6737319.22876.6
March-073167.7$2.504699.7$1.805932.2$1.3437319.23673.8
April-073167.7$2.504653.5$1.615912$1.1037319.23817.9
May-073196.6$2.252610.6$2.406283.6$3.1637228.32618.7
June-073196.6$2.252748$2.815876.5$3.3937228.32485.6
July-073196.6$2.252849.9$2.995749.7$3.5237228.32407.6
August-073196.6$2.253136.7$2.985334.6$3.4337228.32462.4
September-073196.6$2.253694.8$2.905513.6$3.1437228.32631.6
October-073196.6$2.253943.4$2.825503.1$3.0337228.32698.2
November-073064.4$1.912586.1$1.909045.5$1.6036819.23503.7
December-073064.4$1.912743.1$1.988009.1$2.2236819.23149.2
January-083064.4$1.913753.2$2.257053.4$3.4036819.22477.3
February-083064.4$1.913065.0$2.506848.0$3.1836819.22602.7
March-083064.4$1.914215.1$1.488288.3$1.0536819.23818.1
April-083064.4$1.914308.8$1.177759.5$0.7536819.23989.6
May-082994.7$2.671851.8$2.808294.8$2.6036632.53080.6
June-082994.7$2.672460.9$2.877684.7$2.9436632.52909.9
July-082994.7$2.671972.8$2.968324.1$2.8036632.52981.6
August-082994.7$2.672542.7$2.877451.6$2.7036632.53030.1
September-082994.7$2.673494.7$2.736766.6$2.4536632.53156.4
October-082994.7$2.673526.1$2.556944.8$1.9336632.53418.3
November-082810.1$1.772596.0$1.609114.6$1.0036492.63877.473
December-082810.1$1.772200.1$1.509113.9$1.2536492.63752.079
Page 59
Figure 1.a. (cont’d)
November 1999 - December 2009
Installed Capacity Auction Activity
New York Control Area (NYCA) Capacity
NYCACapability Period*MonthlySpot MarketMinimumExcess
(Strip)Required
Sold
MonthMWPriceMWPriceMWPriceMWMW
January-092810.1$1.772987.3$1.506134.4$3.1936492.62779.0
February-092810.1$1.773863.7$2.505837.4$1.7736492.63492.1
March-092810.1$1.773674.6$1.105781.5$0.5036492.64128.2
April-092810.1$1.773991.3$0.505849.7$0.3036492.64228.6
May-092371.1$3.012500.2$3.017374.3$2.6136362.43216.7
June-092371.1$3.013034.3$3.507545.3$4.2236362.42505.4
July-092371.1$3.013915.6$4.116357.9$4.4236362.42420.6
August-092371.1$3.014459.5$4.195789.5$3.4236362.42857.0
September-092371.1$3.014413.9$3.495838.0$2.7636362.43147.7
October-092371.1$3.014957.6$2.595533.5$2.2336362.43380.5
November-093201.1$1.753044.6$1.556845.8$0.5035785.34081.4
December-093201.1$1.753125.0$1.306162.9$0.7535785.33976.7
January-103201.1$1.753765.0$1.668871.7$1.8535785.33505.4
February-103201.1$1.753948.2$2.248506.4$3.4935785.32810.0
March-103201.1$1.754425.9$1.478381.1$0.8535785.33933.4
April-103201.1$1.754420.5$0.748433.0$0.6435785.34021.8
May-102868.1$2.473372.0$2.547827.0$3.5235045.32860.2
June-102868.1$2.474521.8$2.518863.7$2.1235045.33396.5
July-102868.1$2.474335.2$1.906036.0$1.9135045.33475.3
August-102868.1$2.473982.7$1.635467.0$1.6835045.33563.7
September-102868.1$2.474376.5$0.977993.5$0.6335045.33964.3
October-102868.1$2.474178.9$0.458165.3$0.4835045.34022.9
November-102691.9$0.394179.3$0.279383.4$0.0135832.54295.9
December-102691.9$0.394173.1$0.108433.9$0.5035832.54100.2
January-112691.9$0.393272.7$0.659786.2$0.5035832.54100.2
February-112691.9$0.393848.7$0.458839.8$0.6535832.54040.0
March-112691.9$0.394111.8$0.158199.3$0.3035832.54180.1
April-112691.9$0.394450.5$0.208448.2$0.1535832.54240.0
May-113280.5$0.553416.9$0.607530.4$0.6534684.43911.1
June-113280.5$0.553475.2$0.607382.8$0.5534684.43948.7
July-113280.5$0.553769.6$0.507562.7$0.1534684.44104.2
August-113280.5$0.553922.3$0.167786.3$0.0534684.44142.8
September-113280.5$0.553832.0$0.107936.4$0.1834684.44093.1
October-113280.5$0.554200.8$0.107384.2$0.1334684.44105.9
Page 60
Figure 2.a.
November 1999 - December 2009
Installed Capacity Auction Activity New York City Locality (NYC) Capacity
NYCCapability Period*MonthlySpot MarketMinimumExcess
(Strip)RequiredSold
MonthMWPriceMWPriceMWPriceMWMW
November-998305.6
December-998305.6
January-00Installed Capacity Market Existed but all purchases and sales were8305.6
February-00bilateral8305.6
March-008305.6
April-008305.6
May-005408.8$8.7559.4$12.500.0-8272.0
June-005408.8$8.75313.4$9.4652.7$12.508272.0
July-005408.8$8.75342.7$9.40100.0$12.508272.0
August-005408.8$8.75332.6$9.42133.9$12.508272.0
September-005408.8$8.75344.5$9.40149.5$12.508272.0
October-005408.8$8.75304.2$9.49214.0$12.508272.0
November-004861.4$8.75735.0$8.74170.3$8.758272.0
December-004861.4$8.75785.1$8.74154.8$8.758272.0
January-014861.4$8.75899.5$8.74154.8$8.758272.0
February-014861.4$8.75921.7$8.71154.8$8.758272.0
March-014861.4$8.75936.5$8.74156.0$8.758272.0
April-014861.4$8.75985.6$8.56156.7$8.728272.0
May-015316.6$8.75248.7$8.75235.1$12.508375.0(est.)
June-015316.6$8.75228.4$10.92299.0$12.188375.0(est.)
July-015316.6$8.75407.8$9.77292.5$8.838375.0(est.)
August-015316.6$8.75440.1$8.38350.1$9.468375.0(est.)
September-015316.6$8.75434.9$8.42316.0$8.348375.0(est.)
October-015316.6$8.75430.1$7.99343.4$8.728375.0(est.)
November-013972.5$9.40772.8$9.0077.7$4.807613.3
December-013972.5$9.40906.8$6.8811.5$ -7613.3
January-023972.5$9.40492.6$5.47377.3$8.257613.3
February-023972.5$9.40631.1$6.69229.3$9.207613.3
March-023972.5$9.40784.3$6.9290.6$7.507613.3
April-023972.5$9.40932.9$7.1211.6$9.407613.3
May-024355.2$9.20684.1$9.3830.5$9.397621.6
June-024355.2$9.20671.2$6.1116.7$0.507621.6
July-024355.2$9.20684.7$5.340.3$0.017621.6
August-024355.2$9.20693.8$5.1515.1$2.007621.6
September-024355.2$9.20688.4$4.8324.5$0.017621.6
October-024355.2$9.20699.0$4.7219.2$1.957621.6
November-024540.0$7.00748.1$6.4061.1$4.108021.8
December-024540.0$7.00762.7$4.0929.9$2.808021.8
Page 61
Figure 2.a. (cont’d)
November 1999 - December 2009
Installed Capacity Auction Activity New York City Locality (NYC) Capacity
NYCCapability Period*MonthlySpot MarketMinimumExcess
(Strip)RequiredSold
MonthMWPriceMWPriceMWPriceMWMW
January-034540$7.00787.9$4.0213.3$2.108021.8
February-034540$7.00808.6$3.511.5$3.008021.8
March-034540$7.00799.7$3.9721.9$4.008021.8
April-034540$7.00829.7$3.399.1$3.608021.8
May-032501.7$11.223016.3$10.00110.2$12.368356.70.0
June-032501.7$11.22683$13.782375.5$11.468356.70.0
July-032501.7$11.22527.9$11.572558$11.468356.70.0
August-032501.7$11.22567.9$11.562497.9$11.468356.70.0
September-032501.7$11.22558.1$11.562499.5$11.468356.70.0
October-032501.7$11.22638.8$11.552415.1$11.458356.70.0
November-03475$6.55579.3$6.675029.3$6.988346.1571.0
December-03475$6.55909.4$6.644711$6.988346.1571.0
January-04475$6.55968.9$6.644644.8$6.988346.1571.0
February-04475$6.552167.5$6.773422.4$6.988346.1571.0
March-04475$6.551938$6.053841.5$6.988346.1571.0
April-04475$6.552047.2$6.003779.1$6.988346.1571.0
May-041245.3$11.152022.4$11.162898.3$11.428444.6214.9
June-041245.3$11.152532.8$11.292391.9$11.428444.6214.9
July-041245.3$11.152705.7$11.292261.3$11.428444.6214.9
August-041245.3$11.153126.1$11.251854.4$11.428444.6214.9
September-041245.3$11.153272.4$11.251798.6$11.428444.6214.9
October-041245.3$11.152771.9$11.212336.3$11.428444.6214.9
November-042249.4$6.681253.8$6.963137.5$7.128469.5705.9
December-042249.4$6.681606$7.072758.3$7.128469.5705.9
January-052249.4$6.682433.6$7.031919.3$7.128469.5705.9
February-052249.4$6.682596.5$7.031761.5$7.128469.5705.9
March-052249.4$6.682671.8$7.031784$7.128469.5705.9
April-052249.4$6.682611.4$7.031851.9$7.128469.5705.9
May-052547.2$11.681035.2$11.862547.1$12.038526.8284.0
June-052547.2$11.682657.9$11.80974.2$11.968526.8291.3
July-052547.2$11.682742.6$11.82992.5$11.958526.8292.5
August-052547.2$11.682689.7$11.821134.8$11.868526.8301.6
September-052547.2$11.682842$11.821086.6$11.708526.8318.2
October-052547.2$11.682644.5$11.821238.1$11.868526.8301.6
November-051846.4$5.11943.9$6.393865.4$6.558569.2854.3
December-051846.4$5.112130.4$6.442674.7$6.558569.2854.3
Page 62
Figure 2.a. (cont’d)
November 1999 - December 2009
Installed Capacity Auction Activity New York City Locality (NYC) Capacity
NYCCapability Period*MonthlySpot MarketMinimumExcess
(Strip)Required
Sold
MonthMWPriceMWPriceMWPriceMWMW
January-061846.4$5.112558.2$6.212116.6$6.558569.2854.3
February-061846.4$5.113162.5$5.782037.4$6.558569.2854.3
March-061846.4$5.112704.7$5.782031.7$6.558569.2854.3
April-061846.4$5.113237.1$5.881540.4$6.558569.2854.3
May-062186.7$12.351422.7$12.432209.8$12.718798.1255.9
June-062186.7$12.351447.8$12.412165.3$12.718798.1255.9
July-062186.7$12.351580.0$12.451909.6$12.718798.1255.9
August-062186.7$12.351604.5$12.511870.7$12.718798.1255.9
September-062186.7$12.351603.6$12.511953.5$12.718798.1255.9
October-062186.7$12.351628.1$12.542316.7$12.718798.1255.9
November-063298.4$5.671023.5$5.802057.8$5.848831.5974.8
December-063298.4$5.671039.2$5.842018.8$5.848831.5974.8
January-073298.4$5.671193.4$5.821973.8$5.848831.5974.8
February-073298.4$5.671143.1$5.812144.0$5.848831.5974.8
March-073298.4$5.671199.7$5.802008.8$5.848831.5974.8
April-073298.4$5.671105.5$5.821971.6$5.848831.5974.8
May-071894.0$12.371099.1$12.343125.4$12.729058.3281.1
June-071894.0$12.371209.4$12.362951.5$12.729058.3281.1
July-071894.0$12.371154.3$12.363073.0$12.729058.3281.1
August-071894.0$12.371162.6$12.363153.8$12.729058.3281.1
September-071894.0$12.371252.0$12.363037.9$12.729058.3281.1
October-071894.0$12.371339.4$12.362942.8$12.729058.3281.1
November-07908.2$5.321393.5$5.614438.1$5.778870.81009.5
December-07908.2$5.321632.1$5.604067.3$5.778870.81009.5
January-08908.2$5.321551.7$5.434662.5$5.778870.81009.5
February-08908.2$5.321388.9$5.574442.2$5.778870.81009.5
March-08908.2$5.323039.2$3.783348.7$1.058870.81494.9
April-08908.2$5.323696.4$2.742964.9$0.758870.81591.6
May-08494.9$6.50903.4$6.524987.2$5.538910.6985.9
June-08494.9$6.502100.2$5.653745.8$6.038910.6930.1
July-08494.9$6.502071.5$5.863758.3$6.338910.6896.9
August-08494.9$6.502490.8$6.033349.2$6.178910.6914.8
September-08494.9$6.502790.4$5.923083.4$5.988910.6935.7
October-08494.9$6.502652.6$5.883230.1$5.838910.6951.9
November-081260.8$2.791378.2$2.283974.3$1.529003.41447.1
December-081260.8$2.791234.1$1.594186.0$1.259003.41558.1
Page 63
Figure 2.a. (cont’d)
November 1999 - December 2009
Installed Capacity Auction Activity New York City Locality (NYC) Capacity
NYCCapability Period*MonthlySpot MarketMinimumExcess
(Strip)Required
Sold
MonthMWPriceMWPriceMWPriceMWMW
January-091260.8$2.791559.5$1.514151.0$3.199003.41579.9
February-091260.8$2.792094.1$3.063729.9$1.779003.41592.0
March-091260.8$2.791867.6$1.493622.8$0.509003.41592.0
April-091260.8$2.791706.0$0.753755.6$0.309003.41586.6
May-09436.7$6.75757.9$7.004976.3$8.728855.3707.3
June-09436.7$6.751782.7$8.603854.3$8.658855.3714.2
July-09436.7$6.752593.8$8.712930.4$8.478855.3732.7
August-09436.7$6.752509$8.522960.2$8.458855.3735.1
September-09436.7$6.752162.5$8.403403.2$7.658855.3816.4
October-09436.7$6.752495.1$7.622926.6$7.708855.3811.1
November-09825.2$4.652274.7$1.943124.0$1.238551.61422.3
December-09825.2$4.651757.6$1.683607$0.768551.61467.4
January-10825.2$4.651186.5$4.384257.0$1.858551.61497.1
February-10825.2$4.651180.1$6.274240.3$7.988551.6782.0
March-10825.2$4.651787.4$7.403472.0$7.728551.6807.3
April-10825.2$4.651995.3$7.503468.4$7.168551.6860.1
May-101096.8$12.90335.7$13.014004.2$13.538336.0372.0
June-101096.8$12.901896.7$13.332571.5$13.138336.0403.6
July-101096.8$12.901700.8$12.982797.1$13.058336.0412.1
August-101096.8$12.901484.3$12.943025.4$12.978336.0418.7
September-101096.8$12.901847.1$12.842799.0$12.508336.0457.8
October-101096.8$12.901758.3$12.452855.1$12.728336.0439.2
November-101109.8$4.60829.9$4.754571.0$4.298737.51179.5
December-101109.8$4.60914.2$4.283389.7$3.668737.51237.6
January-111109.8$4.601975.7$3.663135.3$3.998737.51207.6
February-111109.8$4.601670.3$4.253516.2$3.578737.51245.8
March-111109.8$4.601723.0$4.004231.1$3.578737.51246.0
April-111109.8$4.601719.8$3.823509.6$3.328737.51269.1
May-11726.5$13.541663.8$13.203354.4$11.978832.0462.4
June-11726.5$13.542216.9$12.002896.2$11.768832.0482.3
July-11726.5$13.541926.1$11.843301.5$5.768832.01046.9
August-11726.5$13.541645.3$9.503361.6$5.838832.01040.8
September-11726.5$13.541334.0$6.993680.6$5.718832.01052.3
October-11726.5$13.541280.1$6.493511.6$9.018832.0883.0
Page 64
Figure 3.a.
November 1999 - December 2009
Installed Capacity Auction Activity
Long Island Locality (LI) Capacity
LICapability Period*MonthlySpot MarketMinimumExcess
(Strip)RequiredSold
MonthMWPriceMWPriceMWPriceMWMW
November-994555.3
December-994555.3
January-00Installed Capacity Market Existed but all purchases and sales were4555.3
February-00bilateral4555.3
March-004555.3
April-004555.3
May-000-0-0-4638.0
June-000-0-0-4638.0
July-000-0-0-4638.0
August-000-0-0-4638.0
September-000-0-0-4638.0
October-000-0-0-4638.0
November-000-0-0-4638.0
December-000-0-0-4638.0
January-010-0-0-4638.0
February-010-0-0-4638.0
March-010-0-0-4638.0
April-010-0-0-4638.0
May-010-0-3.2$10.834625.0
June-010-0-7.0$10.834625.0
July-010-0-20.2$10.834625.0
August-010-0-21.3$10.834625.0
September-010-0-33.0$10.834625.0
October-010-0-33.0$10.834625.0
November-010-0.6$3.508.5$12.334077.6
December-010-1.3$3.5037.4$12.334077.6
January-020-1.3$5.0039.7$12.334077.6
February-020-0$ -40.6$11.504077.6
March-020-14.0$11.5026.4$11.494077.6
April-020-41.4$11.480-4077.6
May-020-0-0-4177.8
June-020-0-0-4177.8
July-020-0-0-4177.8
August-020-0-0-4177.8
September-020-0-0-4177.8
October-020-0-0-4177.8
November-020-0-0-4256.2
December-020-0-0-4256.2
Page 65
Figure 3.a. (cont’d)
November 1999 - December 2009
Installed Capacity Auction Activity
Long Island Locality (LI) Capacity
LICapability Period*MonthlySpot MarketMinimumExcess
(Strip)RequiredSold
MonthMWPriceMWPriceMWPriceMWMW
January-030-0-0-4256.2
February-030-0-0-4256.2
March-030-0-0-4256.2
April-030-0-0-4256.2
May-036.6$9.412.2$24.000.2$23.004415.30.0
June-036.6$9.410.0--------341.9$5.174415.3341.9
July-036.6$9.411.0$5.00344.7$5.144415.3344.7
August-036.6$9.411.1$5.00441.8$4.034415.3441.8
September-036.6$9.410.0--------397.8$4.554415.3396.2
October-036.6$9.410.0--------397.8$4.554415.3396.0
November-030.0$4.000.0--------114.3$8.144401.983.7
December-030.0$4.000.0--------107.5$8.224401.976.9
January-040.0$4.000.0--------128.2$7.994401.997.0
February-040.0$4.000.6$7.50202.6$7.084401.9176.0
March-040.0$4.000.6$7.00142.6$7.724401.9119.9
April-040.0$4.000.6$6.85199$7.044401.9179.7
May-0411.2$8.001.6$8.0097.5$9.834761.581.2
June-0411.2$8.0011.2$9.2990.8$9.794761.584.3
July-0411.2$8.0015.9$8.67193.4$8.424761.5192.9
August-0411.2$8.0016.4$8.05213.1$8.164761.5213.1
September-0411.2$8.0016.2$8.06214.2$8.154761.5214.2
October-0411.2$8.0016.2$8.06214.2$8.154761.5214.2
November-0413.9$4.0010.9$4.00358.2$6.344736.0357.7
December-0413.9$4.009.0$4.33368.5$6.214736.0367.6
January-0513.9$4.009.0$3.81372.1$6.164736.0371.4
February-0513.9$4.007.6$3.68373.3$6.144736.0372.8
March-0513.9$4.007.0$3.54371.9$6.164736.0371.9
April-0513.9$4.007.0$3.54367.4$6.234736.0365.8
May-0510.6$8.002.7$8.0085.5$12.154904.985.4
June-0510.6$8.002.0$8.50100.4$11.964904.997.8
July-0510.6$8.004.3$9.00195.3$10.484904.9195.0
August-0510.6$8.004.6$8.50222.5$10.064904.9222.5
September-0510.6$8.004.6$8.61233$9.904904.9233.0
October-0510.6$8.004.6$8.71260$9.494904.9260.0
November-0515.0$0.6810.0$5.00330.5$8.374962.4330.5
December-0515.0$0.6810.1$4.99344.5$8.164962.4344.5
Page 66
Figure 3.a. (cont’d)
November 1999 - December 2009
Installed Capacity Auction Activity
Long Island Locality (LI) Capacity
LICapability Period*MonthlySpot MarketMinimumExcess
(Strip)Required
Sold
MonthMWPriceMWPriceMWPriceMWMW
January-0615.0$0.6810.0$5.00288.1$9.004962.4288.1
February-0615.0$0.6810.0$5.00343.1$8.184962.4343.1
March-0615.0$0.6810.0$5.00350.8$8.074962.4350.8
April-0615.0$0.6810.0$5.00346.1$8.144962.4346.1
May-064.0$6.509.0$6.50166.8$11.155110.3165.0
June-064.0$6.502.3$7.50469.3$6.765110.3462.5
July-064.0$6.503.0$7.00483.0$6.525110.3478.8
August-064.0$6.503.0$6.75497.2$6.315110.3493.0
September-064.0$6.504.6$6.50503.4$6.195110.3500.8
October-064.0$6.507.2$6.00513.6$6.025110.3512.6
November-061.5$3.509.6$3.75672.0$3.665072.2669.4
December-061.5$3.5011.1$3.50670.6$3.655072.2669.7
January-071.5$3.5014.6$3.50673.0$3.605072.2672.9
February-071.5$3.5014.6$3.50672.3$3.615072.2672.3
March-071.5$3.5014.6$3.50672.3$3.615072.2672.3
April-071.5$3.5014.6$3.32672.3$3.615072.2672.3
May-072.2$3.753.0$3.75450.3$7.255056.3450.2
June-072.2$3.753.0$5.50353.1$8.785056.3353.1
July-072.2$3.750.0$0.0451.5$7.235056.3451.4
August-072.2$3.751.0$5.50454.0$7.225056.3672.3
September-072.2$3.751.3$5.50455.6$7.175056.3672.3
October-072.2$3.751.4$5.50455.7$7.175056.3450.2
November-070.0$0.002.0$3.50631.5$4.314972.5630.6
December-070.0$0.000.0$0.00635.9$4.274972.5633.0
January-080.0$0.001.9$3.70640.3$4.204972.5637.4
February-080.0$0.007.2$3.00645.1$4.074972.5645.1
March-080.0$0.002.8$0.00648.5$4.024972.5648.5
April-080.0$0.002.8$0.00648.8$4.014972.5648.8
May-080.0$2.8021.8$2.80652.1$2.604684.9650.8
June-080.0$2.80130.5$2.88644.9$2.944684.9583.3
July-080.0$2.80168.2$2.94653.4$2.804684.9650.8
August-080.0$2.80165.7$2.86657.4$2.704684.9656.3
September-080.0$2.80102.0$2.80659.4$2.454684.9658.9
October-080.0$2.80108.2$2.77668.7$1.934684.9668.7
November-080.3$1.771.8$1.60772.8$1.004566.1772.6
December-080.3$1.7710.0$1.50802.4$1.254566.1802.2
Page 67