10 Krey Boulevard Rensselaer, NY 12144
November 18, 2016
By Electronic Delivery
Honorable Kimberly D. Bose, Secretary Federal Energy Regulatory Commission 888 First Street, NE
Washington, DC 20426
Re: New York Independent System Operator, Inc., Docket No. ER17-___-000;
Proposed ICAP Demand Curves for the 2017/2018 Capability Year and
Parameters for Annual Updates for Capability Years 2018/2019,
2019/2020 and 2020/2021
Dear Secretary Bose:
In accordance with Section 5.14.1.2.2 of the New York Independent System Operator, Inc. (“NYISO”) Market Administration and Control Area Services Tariff (“Services Tariff”),1 Section 205 of the Federal Power Act2 and Part 35 of the regulations of the Federal Energy
Regulatory Commission (“Commission”), the NYISO respectfully submits proposed
amendments to Section 5.14.1.2 of the Services Tariff to define the ICAP Demand Curves
applicable for the 2017/2018 Capability Year. The NYISO also proposes the methodologies and inputs that will be used in conducting the annual updates to determine the ICAP Demand Curves for the 2018/2019, 2019/2020 and 2020/2021 Capability Years.3
The ICAP Demand Curves, as well as the methodologies and inputs for the annual
updates covered by this reset period,4 are the result of the extensive periodic review process
required by Section 5.14.1.2.2 of the Services Tariff (commonly referred to as the “ICAP
Demand Curve reset” or “DCR” process). The NYISO’s proposed ICAP Demand Curves and
methodologies and inputs for the upcoming annual updates have been informed by the thorough
1 Capitalized terms not otherwise defined herein shall have the meaning specified in the Services Tariff and the NYISO Open Access Transmission Tariff (“OATT”).
2 16 U.S.C. § 824d.
3 See Docket No. ER16-1751-000, New York Independent System Operator, Inc., Proposed
Services Tariff Revisions to Implement Enhancements to the Periodic Reviews of the ICAP Demand Curves (May 20, 2016) (hereinafter referred to as the “DCR Enhancements Filing”); and New York
Independent System Operator, Inc., 156 FERC ¶ 61,039 (2016) (hereinafter referred to as the “DCR Enhancements Order”).
4 References to “reset period” herein means the period of Capability Years for which ICAP Demand Curves resulting from the methodologies and inputs established during each DCR remain in effect. For example, the reset period covered by this DCR encompasses the 2017/2018 through
2020/2021 Capability Years.
Honorable Kimberly D. Bose November 18, 2016
Page 2
analysis of an independent consultant, supplemental analysis conducted by NYISO staff, and the comments of stakeholders and the Market Monitoring Unit (“MMU”). The NYISO’s proposal is designed to ensure that the ICAP Demand Curves fulfill their fundamental objective of attracting new and retaining existing capacity necessary to ensure achievement of New York’s applicable statewide and locational minimum Installed Capacity requirements.5
As further described herein, although costs and offsetting revenues have been adjusted to
reflect changes in the underlying markets since the last DCR (including more recent data and
updated cost estimates), the basis of the ICAP Demand Curves remains largely unchanged from
that approved by the Commission in 2014.6 The NYISO proposes the continued use of the F
class frame turbine as the peaking unit7 technology for each of the ICAP Demand Curves.
Consistent with the last reset, the NYISO also proposes to maintain the requirement that peaking
plants include dual fuel capability for the New York City (“NYC”), Long Island (“LI”) and G-J
Locality ICAP Demand Curves, while continuing use of a gas-only peaking plant design for the
NYCA ICAP Demand Curve. Furthermore, the NYISO proposes that the peaking plants for the
NYC, LI and G-J Locality ICAP Demand Curves continue to include selective catalytic
reduction (“SCR”) emissions control technology to ensure compliance with applicable
environmental requirements. The major change in the peaking plant design since the last reset is
that the NYISO now proposes that the peaking plant for the NYCA ICAP Demand Curve also
include SCR emissions controls.8
The NYISO respectfully requests: (i) issuance of an order on or before January 17, 2017 (i.e., sixty days from the date of this filing letter) accepting the proposed ICAP Demand Curves for the 2017/2018 Capability Year and the methodologies and inputs to be used in conducting the annual updates for the 2018/2019 through 2020/2021 Capability Years; and (ii) an effective date of January 17, 2017 for the proposed revisions to Section 5.14.1.2 of the Services Tariff to reflect the parameters of the ICAP Demand Curves for 2017/2018 Capability Year.
5 See, e.g., New York Independent System Operator, Inc., 118 FERC ¶ 61,182 at P 17 (2007).
6 See New York Independent System Operator, Inc., 146 FERC ¶ 61,043 (2014) (“2013 DCR
Order”).
7 The Services Tariff requires use of the costs and projected net Energy and Ancillary Services
revenues for a “peaking plant” in determining the values of the ICAP Demand Curves. A “peaking unit”
is defined as “the unit with technology that results in the lowest fixed costs and highest variable costs
among all other units’ technology that are economically viable.” The Services Tariff defines a “peaking
plant” to mean “the number of units (whether one or more) that constitute the scale identified in the
periodic review.”
8 In the last reset, the peaking plant for the NYCA ICAP Demand Curve was assumed to operate
pursuant to a federally enforceable cap on annual operating hours in lieu of including SCR emissions
controls.
Honorable Kimberly D. Bose November 18, 2016
Page 3
I.Documents Submitted
1.This filing letter;
2.A clean version of the proposed revisions to the Services Tariff (“Attachment I”);
3.A blacklined version of the proposed revisions to the Services Tariff (“Attachment
II”);
4. An Affidavit from Paul J. Hibbard, Dr. Todd Schatzki and Craig Aubuchon of
Analysis Group, Inc., including the Study to Establish New York Electricity Market
ICAP Demand Curve Parameters dated September 13, 2016 (“Attachment III”);
5. An Affidavit from Thomas A. Vivenzio and Dr. William F. Frazier of Lummus
Consultants International, Inc. (“Attachment IV”); and
6. An Affidavit from David Allen of the NYISO including the Proposed NYISO
Installed Capacity Demand Curves for Capability Year 2017/2018 and Annual
Update Methodology and Inputs for Capability Years 2018/2019, 2019/2020, and 2020/2021 dated September 15, 2016 (“Attachment V”).
II.Background and Overview of DCR Process
Section 5.14.1.2 of the Services Tariff requires that the NYISO conduct periodic reviews
of the parameters of the ICAP Demand Curves. The Services Tariff specifies that the DCR must
assess: (i) the current localized levelized embedded cost of a peaking plant underlying each
ICAP Demand Curve; and (ii) the likely projected net Energy and Ancillary Services (“EAS”)
revenues to be earned by each peaking plant from participation in the NYISO-administered
markets.9 The Services Tariff further requires that, for the purposes of the DCR and
establishment of the ICAP Demand Curves, the costs and estimated revenues of each peaking
plant should not be determined based on current market conditions. Instead, the DCR requires
that such costs and revenues be estimated under market conditions in which the available
capacity is equal to the applicable minimum Installed Capacity requirement plus the MW value
of the peaking plant (referred to herein as the “tariff-prescribed level of excess conditions”).10
This requirement is designed to ensure that the ICAP Demand Curves are established at a level
that should provide sufficient revenues to cover the costs of a peaking plant when market entry
by such facility is required to maintain reliability.
As part of this DCR, the NYISO proposed to review the current reset process and identify
potential enhancements thereto, including an assessment of increasing the period between resets.
Stakeholders approved certain enhancements to the DCR process that were accepted by the
9 See Services Tariff § 5.14.1.2.2.
10 Id.
Honorable Kimberly D. Bose November 18, 2016
Page 4
Commission on July 18, 2016.11 The enhancements include: (i) extending the period between
DCRs to four years; (ii) implementing annual updates of certain parameters for the Capability
Years between DCRs; and (iii) implementing a more transparent and predictable methodology
for estimating net EAS revenues expected to be earned by a peaking plant from participation in
the NYISO-administered markets. These enhancements are designed to provide for increased
transparency, stability and predictability with respect to the DCR process and capacity market
outcomes.
The NYISO conducted a process, which included stakeholder input, to select an
independent consultant for the DCR related to the ICAP Demand Curves beginning with the
2017/2018 Capability Year.12 In August 2015, the NYISO selected Analysis Group, Inc. (“AG”)
to serve as the independent consultant for this DCR.13 The Independent Consultant commenced
discussions with stakeholders in October 2015 and led discussions with stakeholders regarding
the DCR during 12 Installed Capacity Working Group (“ICAPWG”) meetings between October
2015 and August 2016.14 At each of these meetings, and through multiple opportunities to
provide feedback and written comments, stakeholders provided input regarding the Independent
Consultant’s assumptions, analysis, estimates and preliminary results. The Independent
Consultant also communicated with, and sought input from, the MMU at various stages
throughout the process. The Independent Consultant, together with NYISO staff, also met with
the New York State Department of Environmental Conservation to review and discuss applicable
environmental requirements for this DCR and developments since the last reset that impact such
requirements.
Based on the numerous presentations and discussions at the ICAPWG meetings and
consideration of the feedback received throughout the stakeholder process, the Independent
Consultant issued its draft report on June 23, 2016.15 Stakeholders were provided the
opportunity to provide written comments in response to the draft report.16 After consideration of
11 See DCR Enhancements Filing and DCR Enhancements Order.
12 The Commission accepted ICAP Demand Curves resulting from the last reset run through the end of the 2016/2017 Capability Year.
13 See Services Tariff §§ 5.14.1.2.2.4.1 and 5.14.1.2.2.4.2. Lummus Consultants International,
Inc. (“Lummus”) serves as a subcontractor to AG to assist AG in the development of certain data and
information related to the DCR. AG, together with Lummus, is referred to herein as the “Independent
Consultant.”
14 In total, the DCR was discussed during 18 ICAPWG meetings between October 2015 and September 2016.
15 See Services Tariff § 5.14.1.2.2.4.3. The draft report provided preliminary values for the
2017/2018 Capability Year ICAP Demand Curves using the historic data period from May 2013 through
April 2016 for determining net EAS revenue estimates. AG and Lummus, Study to Establish New York
Electricity Market ICAP Demand Curve Parameters (June 23, 2016), available at:
http://www.nyiso.com/public/webdocs/markets_operations/committees/bic_icapwg/meeting_materials/20
16-06-27/Analysis%20Group%20NYISO%20DCR%20Draft%20Report%20-%20FINAL.pdf.
16 See Services Tariff § 5.14.1.2.2.4.4. Stakeholder comments in response to the Independent
Consultant’s draft report are posted with the meeting material for the June 27, 2016 ICAPWG meeting,
Honorable Kimberly D. Bose November 18, 2016
Page 5
the comments received, the Independent Consultant issued an initial version of its final report on
August 16, 2016, reflecting final recommendations and the final models for determining net EAS
revenues and calculating the ICAP Demand Curve parameters. This version of the final report
contained interim values for the ICAP Demand Curves for the 2017/2018 Capability Year using
the historic data period from August 2013 through July 2016 for determining net EAS revenue
estimates. The updated version of the Independent Consultant’s final report was issued on
September 13, 2016.17 The updated version reflected final values for the ICAP Demand Curves for the 2017/2018 Capability Year using the historic data period from September 2013 through August 2016 for determining net EAS revenue estimates.18
On August 17, 2016, NYISO staff issued its draft recommendations for the 2017/2018
ICAP Demand Curves and the methodologies and inputs to be used in conducting annual updates
for the 2018/2019 through 2020/2021 Capability Years.19 In developing its draft
recommendations, the NYISO considered the feedback from stakeholders throughout the
process, as well as the analysis and recommendations of the Independent Consultant.
Stakeholders were provided an opportunity to submit written comments in response to NYISO
staff’s draft recommendations.20 After consideration of the feedback from both stakeholders and
the MMU, NYISO staff issued its final recommendations on September 15, 2016.21
Stakeholders were then provided the opportunity to submit written comments to the
NYISO Board of Directors (“Board”) in response to NYISO staff’s final recommendations.22
available at:
http://www.nyiso.com/public/markets_operations/committees/meeting_materials/index.jsp?com=bic_icap
wg.
17 See Services Tariff § 5.14.1.2.2.4.6.
18 The updated version of the Independent Consultant’s final report is included as Exhibit D of the Affidavit of Paul J. Hibbard, Dr. Todd Schatzki and Craig Aubuchon attached hereto as Attachment III
(“AG Affidavit”).
19 See Services Tariff § 5.14.1.2.2.4.7. NYISO, Proposed NYISO Installed Capacity Demand
Curves for Capability Year 2017/2018 and Annual Update Methodology and Inputs for Capability Years 2018/2019, 2019/2020, and 2020/2021 (August 17, 2016), available at:
http://www.nyiso.com/public/webdocs/markets_operations/committees/bic_icapwg/meeting_materials/20
16-08-19/Initial%20Draft%20NYISO%20DCR%20Recommendation%20Final.pdf.
20 See Services Tariff § 5.14.1.2.2.4.7. Stakeholder comments in response to NYISO staff’s draft
recommendations are posted with the meeting material for the September 8, 2016 ICAPWG meeting,
available at:
http://www.nyiso.com/public/markets_operations/committees/meeting_materials/index.jsp?com=bic_icap
wg.
21 See Services Tariff § 5.14.1.2.2.4.8. NYISO staff’s final recommendations are included as
Exhibit A of the Affidavit of David Allen attached hereto as Attachment V (“Allen Affidavit”). Appendix IV of NYISO staff’s final recommendations includes comments from the MMU in accordance with the requirements of Section 5.14.1.2.2.4.5 of the Services Tariff.
22 See Services Tariff § 5.14.1.2.2.4.9. Stakeholder comments to the Board are posted on the
NYISO website within the “Demand Curve Reset Comments” section of the “2017-2021 Demand Curve
Honorable Kimberly D. Bose November 18, 2016
Page 6
Stakeholders were also provided the opportunity for oral presentations before the Board on
October 17, 2016.23 After consideration of stakeholder comments, NYISO staff’s final
recommendations (including the comments of the MMU), and the Independent Consultant’s final report, the Board directed the NYISO to file the proposed ICAP Demand Curves for the
2017/2018 Capability Year, together with the proposed methodologies and inputs for use in
conducting the annual updates for the 2018/2019 through 2020/2021 Capability Years, that are set forth in NYISO staff’s final recommendations.24
III.Peaking Unit Technology and Design
Section 5.14.1.2.2 of the Services Tariff defines the peaking unit as the “technology that
results in the lowest fixed costs and highest variable costs among all other units’ technology that
are economically viable.” The Commission has established that economic viability
determinations are a matter of judgment that is informed by the consideration of multiple
factors.25 These factors include: (i) the availability of the technology to most market
participants; (ii) existence of sufficient operating experience to demonstrate that the technology
is proven and reliable; (iii) whether the technology is dispatchable and capable of being cycled to
provide peaking service; and (iv) the ability to achieve compliance with applicable
environmental requirements and regulations.26 These criteria were applied in this DCR to
determine the appropriate peaking unit technology and equipment design for each of the ICAP
Demand Curves.27
A fundamental objective of the ICAP Demand Curves is that the underlying peaking
plant should be able to capture sufficient revenues to support market entry if needed to ensure
attainment of the applicable minimum capacity requirements. To achieve this fundamental
objective, the ICAP Demand Curves must be derived based on the costs and net EAS revenues of
a representative peaking plant that can reliably be constructed and operated in multiple instances
if necessary to ensure compliance with the applicable minimum capacity requirements.
Establishing the ICAP Demand Curves purely on the basis of a single least possible cost design
is likely to result in providing price signals that could sustain only the development of, at best, a
single facility. If, however, system conditions dictated a need to develop more than one peaking
plant during a given reset period, such a market design would likely fail its objective and could
Reset” subfolder of the “Reference Documents” folder, available at:
http://www.nyiso.com/public/markets_operations/market_data/icap/index.jsp.
23 See Services Tariff § 5.14.1.2.2.4.9.
24 See Allen Affidavit at Exhibit A (“NYISO Staff Final Recommendations”).
25 See, e.g., 2013 DCR Order at P 60; New York Independent System Operator, Inc., 134 FERC ¶ 61,058 at P 37 (2011) (“2010 DCR Order”); and New York Independent System Operator, Inc., 125 FERC ¶ 61,299 at P 20 (2008) (“2007 DCR Rehearing Order”).
26 Id.
27 AG Affidavit, Exhibit D at 13 (“Independent Consultant Final Report”); and Affidavit of
Thomas A. Vivenzio and Dr. William F. Frazier at ¶ 12 attached hereto as Attachment IV (“Lummus
Affidavit”).
Honorable Kimberly D. Bose November 18, 2016
Page 7
require reliance on out-of-market action to ensure continued availability of sufficient resources to maintain reliability.
The NYISO carefully considered the views of all stakeholders in determining the peaking
plant designs proposed herein, as well as current and past application of existing regulatory
requirements. The NYISO’s proposal is intended to ensure that the ICAP Demand Curves are
capable of providing appropriate price signals regarding the value of capacity in each capacity
region, while simultaneously ensuring that the curves are capable of providing the needed
revenues to elicit new market entry if and when required to ensure that reliability is maintained.
As described herein, the NYISO’s proposed peaking plant design for each ICAP Demand Curve
is just and reasonable.
The peaking unit technology and plant designs (i.e., generator technology, dual fuel
capability and emission control technology) proposed by the NYISO are largely unchanged from
those approved by the Commission in the last reset. For the NYC, LI and G-J Locality ICAP
Demand Curves, the peaking plant design is the same as the last reset. For the NYCA ICAP
Demand Curve, the NYISO proposes in this DCR to require the installation of SCR emissions
control technology, which was not included as part of the peaking plant design in the last reset.
A. Peaking Unit Technology
Consistent with the last reset, the NYISO proposes continued use of a simple cycle F
class frame turbine as the peaking unit technology for all of the ICAP Demand Curves.28 The F class frame turbine remains the technology representing the lowest fixed costs and highest
variable costs among all other technologies that were deemed economically viable.29
Certain stakeholders, however, contend that a simple cycle H class frame turbine should
be selected as the peaking unit technology. These stakeholders note that a developer proposing
to potentially install a simple cycle H class frame turbine with SCR emissions controls recently
cleared its proposed project in the ISO New England, Inc. (“ISO-NE”) forward capacity market
auction for the 2019/2020 capacity commitment period. These stakeholders have also noted that,
in the currently ongoing process at ISO-NE to update the cost of new entry (“CONE”) value
underlying its capacity demand curve construct for the 2021/2022 capacity commitment period, the consultant hired by ISO-NE has proposed to base the costs of a simple cycle turbine design on the H class frame turbine.
The H class frame turbine in simple cycle configuration was not considered in this DCR
because, at this time, it is not economically viable as required by the Services Tariff. Currently,
the H class frame turbine has no actual commercial operating experience in a simple cycle
28 NYISO Staff Final Recommendations at 40-41; Independent Consultant Final Report at 8-9, 12-18 and 93-94; and AG Affidavit at ¶ 23.
29 Id.
Honorable Kimberly D. Bose November 18, 2016
Page 8
configuration. Therefore, the technology is unable to meet the screening criteria of having
sufficient commercial operating experience to demonstrate that it is proven and reliable.30
The ICAP Demand Curves have never been established using a technology that was
without actual operating experience. In two prior instances, the ICAP Demand Curves proposed
by the NYISO have used relatively emerging technologies. In the 2007 DCR, the NYISO
proposed to establish the NYC and LI ICAP Demand Curves using the LMS100 aeroderivative
technology.31 Additionally, for the 2013 DCR, the NYISO proposed to establish the NYC, LI
and G-J Locality ICAP Demand Curves using a simple cycle F class frame turbine equipped with
SCR emissions controls.32 In both cases, however, the technology possessed actual commercial
operating experience demonstrating that the technology was proven and reliable. At the time it
was proposed, the LMS100 technology was in commercial operation at a single facility in South
Dakota and had accumulated nearly 600 operating hours over 9 months. The F class frame
turbine with SCR emissions controls had accumulated approximately 500 operating hours over a
7 month period across 4 units operating at a single facility in California at the time it was
proposed by the NYISO. In both cases, the Commission found that the respective commercial operating experience for each technology was sufficient to demonstrate that it was proven and, thus, economically viable.33
The simple cycle H class frame turbine lacks any similar track record of performance. In
fact, if actually constructed and brought into service, the proposed project that recently cleared in
the ISO-NE forward capacity auction is likely to be the first facility to commercially operate the
H class frame turbine technology with SCR emissions controls in a simple cycle configuration.
This project, however, has not yet commenced construction nor has it received a siting permit
necessary for it to proceed. Moreover, it is unclear at this time whether the proposed project,
even if permitted and constructed, will ultimately utilize the H class frame turbine technology.
The petition submitted by the project developer requesting approval to construct and operate the
project specifically indicates that the project will utilize the H class frame turbine “or a
comparable unit.”34 Even if the project ultimately is granted authorization to proceed and is
30 NYISO Staff Final Recommendations at 41; and Independent Consultant Final Report at 17.
31 Docket No. ER08-283-000, New York Independent System Operator, Inc., Tariff Revisions to Implement Revised ICAP Demand Curves for Capability Years 2008/2009, 2009/2010 and 2010/2011 at 5-7 (November 30, 2016); and New York Independent System Operator, Inc., 122 FERC ¶ 61,064 at P 23 (2008) (“2007 DCR Order”).
32 Docket No. ER14-500-000, New York Independent System Operator, Inc., Proposed Tariff
Revisions to Implement Revised ICAP Demand Curves and a New ICAP Demand Curve for Capability
Years 2014/2015, 2015/2016 and 2016/2017 and Request for Partial Phase-In and for Any Necessary
Tariff Waivers at 10-16 (November 27, 2013) (“2013 DCR Filing”); and 2013 DCR Order at P 57-60.
33 See, e.g., 2007 DCR Order at P 23 and 2013 DCR Order at P 58.
34 Massachusetts Energy Facilities Siting Board Docket No. EFSB15-06, NRG Canal 3
Development LLC, Canal Unit 3: Petition Before the Massachusetts Energy Facilities Siting Board for Approval to Construct at 1-1, 1-8 and 1-9 (December 3, 2015), available at:
http://web1.env.state.ma.us/DPU/FileRoomAPI/api/Attachments/Get/?path=EFSB15-
06%2fFullCanalUnit3EFSBPetition.pdf.
Honorable Kimberly D. Bose November 18, 2016
Page 9
constructed, the developer has indicated that the project is not expected to enter commercial operation until approximately mid-2019.35
At best, it will likely not be known until at least mid-2019 whether any simple cycle H
class frame unit with SCR emissions controls may become commercially operational and
available to potentially demonstrate that such technology is proven and reliable. As such, this
technology remains unproven at this time and reliance on it to serve as a peaking unit technology
in New York is premature. The NYISO will continue to monitor the developments related to the
simple cycle H class frame unit and determine whether sufficient commercial operating
experience has occurred to support consideration of this technology in the next reset.
With respect to the ongoing proceedings at ISO-NE to update the CONE value for its
demand curve construct for the 2020/2021 capacity commitment period, the consultant hired by
ISO-NE has expressly acknowledged that there are no simple cycle H class frame turbines in
commercial operation.36 Furthermore, the NYISO understands that ISO-NE does not require a
similar “economic viability” determination, as is required by the Services Tariff, when selecting proxy technologies used to establish values for its demand curve construct. Thus, the technology selections being discussed in the ongoing proceedings at ISO-NE are irrelevant to determinations made in the NYISO’s DCR.37
Despite this conclusion, cost and net EAS revenue estimates along with the resulting
ICAP Demand Curve parameters based on a simple cycle H class frame turbine were developed by the Independent Consultant for informational purposes only. This information was developed to provide stakeholders a comparison of the relative difference in values between the F and H class frame turbines. This information also helps to provide transparency to the marketplace as to the potential for outcomes in future DCRs in the event that the simple cycle H class frame turbine with SCR emissions controls is in fact constructed in the coming years and operates to a sufficient degree to demonstrate that the technology is proven and reliable.
B. SCR Emissions Controls
Consistent with the peaking plant designs approved by the Commission in the last reset,
the NYISO proposes that the peaking plants for the NYC, LI and G-J Locality ICAP Demand
Curves include SCR emissions controls to comply with applicable nitrogen oxides (“NOx”)
35 Id. at 1-3 and 1-20.
36 Concentric Energy Advisors, Inc., ISO-NE CONE and ORTP Analysis - An Evaluation of the
entry cost parameters to be used in the Forward Capacity Auction to be Held in February 2018 (“FCA-
12”) and Forward [Draft Report] at 13 (October 2016), available at: https://www.iso-ne.com/library.
37 The structural differences between ISO-NE’s forward capacity market construct and the
NYISO’s nearer-term capacity market construct further demonstrate the irrelevance of the ongoing
proceedings in ISO-NE to this DCR. The nearer-term nature of the NYISO’s capacity market construct
supports the need for reliance on proven and reliable technologies to serve as the peaking unit. This helps
to ensure that the ICAP Demand Curves provide adequate price signals regarding the value of and need
for capacity supply throughout the State based on current and near-term future system conditions.
Honorable Kimberly D. Bose November 18, 2016
Page 10
emissions requirements in New York.38 Due to changes in the applicable environmental
requirements since the last reset, the NYISO proposes to alter the peaking plant design for the
NYCA ICAP Demand Curve from the last reset to now include SCR emissions controls.39 These
changes demonstrate that an alternative compliance approach of applying an annual operating
hours cap in lieu of installing SCR emissions controls is, in the NYISO’s view, no longer a
viable option for the NYCA ICAP Demand Curve peaking plant. Unlike the last reset, a peaking
plant without SCR emissions controls in this DCR would have the potential to emit considerably
greater NOx emissions annually (i.e., 2.5 times more) than a similar plant design that includes
such back-end controls. This creates significant uncertainty regarding the ability of such a plant
to receive the necessary permits and authorizations to be constructed and operate in New York.
Moreover, a review of air permits for electric generators in New York indicates that no facility
has been permitted using this alternative compliance option during the NYISO’s existence.
To be constructed and operate in New York, the peaking plant will be required to obtain
all necessary air permits, as well as a certificate of environmental compatibility and public need
from the New York State Board on Electric Generation Siting (“Siting Board”) pursuant to
Article 10 of the New York Public Service Law (“PSL”).40 Obtaining the necessary air permits
will require that the peaking plant achieve compliance with both New Source Performance
Standards (“NSPS”) and New Source Review (“NSR”) permit requirements for applicable
pollutants.41
NSPS Requirements
The NSPS requirements for NOx mandate that each of the peaking unit technologies
evaluated limit NOx emissions to less than 15 ppmv at 15% oxygen (“O2”) while operating on
natural gas. The F class frame turbine, which has a NOx emissions rate of 9 ppmv at 15% O2
while operating on natural gas, is the only peaking unit technology evaluated that can achieve
this requirement without the installation of SCR emissions controls.42 Therefore, regardless of
the NSR requirements described below, the other peaking unit technologies evaluated (i.e., the
LMS100 aeroderivative technology and Wartsila reciprocating engines) would require
installation of SCR emissions controls to obtain the air permits needed to operate in New York.43
38 2013 DCR Order at P 57-60.
39 Id. at P 74-77. In the last reset, the NYISO proposed that the NYCA ICAP Demand Curve
peaking plant operate pursuant to a federally enforceable limitation on annual operating hours in lieu of
installing SCR emissions controls to achieve compliance with applicable NOx emissions requirements.
40 NYISO Staff Final Recommendations at 6-10; Independent Consultant Final Report at 19-29; and Lummus Affidavit at ¶ 24-29.
41 Id.
42 NYISO Staff Final Recommendations at 7; Independent Consultant Final Report at 19-20; and Lummus Affidavit at ¶ 26.
43 Although not economically viable for this DCR, the NSPS requirements for NOx would also mandate installation of SCR emissions controls on the H class frame turbine.
Honorable Kimberly D. Bose November 18, 2016
Page 11
The NSPS requirements for simple cycle combustion turbines also establish a capacity
factor based limitation for carbon dioxide (“CO2”) emissions. This limitation requires that the
peaking unit technologies limit their operating hours over either a 12 month operating period or a
three-year rolling average basis to less than the applicable capacity factor for a given technology.
The applicable capacity factor limit for a simple cycle F class frame turbine is approximately
38%, which translates into an operating hour limit of approximately 3,300 hours per year.44
NSR Requirements
The peaking plant must also comply with the applicable NSR requirements, including the
application of Best Available Control Technology (“BACT”) and Lowest Achievable Emissions
Rate (“LAER”) determinations for emissions of criteria pollutants and precursors. For a given
pollutant, the NSR requirements vary depending on whether the facility at issue is located in an
area designated as in attainment or in nonattainment. For attainment areas, a facility is subject to
review under the Prevention of Significant Deterioration (“PSD”) requirements and a BACT
determination is required. For facilities located in nonattainment areas, the applicable
requirements of the Nonattainment New Source Review (“NNSR”) program and LAER apply.
For this DCR, the applicable thresholds for NOx emissions are 100 tons per year in Load Zones C, F and G (Dutchess County) and 25 tons per year in Loads Zone G (Rockland County), J (NYC) and K (LI).45 Furthermore, the Independent Consultant concluded that any facility
subject to a BACT/LAER determination would result in a requirement to include SCR emissions controls to reduce NOx emissions.46
For nonattainment areas (i.e., Load Zones J, K and G [Rockland County]) and peaking
plant designs that include dual fuel capability, the Independent Consultant concluded that the
peaking plant design must include SCR emissions controls.47 This determination is driven by the very restrictive NOx emissions threshold (i.e., 25 tons per year) in nonattainment areas and the much higher NOx emissions rates that result while operating on the peaking plant’s alternative fuel source (i.e., ultra-low sulfur diesel fuel oil [“ULSD”]). Thus, SCR emissions controls are required to be included in the peaking plant designs for the G-J Locality, NYC and LI ICAP
Demand Curves. This result is the same as the last reset.
For a peaking plant located in an attainment area (i.e., Load Zones C, F and G [Dutchess
County]) that is based on a gas-only F class frame turbine design, achievement of compliance
with the NSR regulatory paradigm for NOx emissions presents a material issue in determining
44 NYISO Staff Final Recommendations at 7; and Independent Consultant Final Report at 20 and
27.
45 NYISO Staff Final Recommendations at 8-10; Independent Consultant Final Report at 21-28; and Lummus Affidavit at ¶ 27.
46 Independent Consultant Final Report at 23-26.
47 Id. at 26; and Lummus Affidavit at ¶ 25.
Honorable Kimberly D. Bose November 18, 2016
Page 12
the applicable peaking plant design and resulting costs thereof.48 The applicable environmental
regulations do provide an alternative compliance option that could potentially be pursued in lieu
of installing SCR emissions controls to reduce NOx emissions. This alternative requires that the
facility operate pursuant to a federally enforceable limitation on annual operating hours to ensure
that annual emissions from the facility remain below the threshold for “major source”
designation.49 This would allow the facility to avoid the otherwise applicable BACT/LAER
assessment. The Commission approved the NYISO’s proposal to use this alternative compliance
approach for the NYCA ICAP Demand Curve peaking plant in the last reset.50
Although this alternative compliance option remains available in the regulations, the
Independent Consultant and the NYISO conclude that it is not a viable option for a
representative peaking plant in this DCR. Changes in the applicable environmental requirements since the last reset now dictate that the peaking plant design should include SCR emissions
controls regardless of whether the plant includes dual fuel capability. These changes result in a gas-only peaking plant design without SCR emissions controls having the potential to emit 2.5 times more NOx annually than a similar plant design that includes these emissions controls.51 This poses a significant risk to the ability of such a plant to obtain the necessary permits and approvals for construction and operation in New York.
Certain stakeholders oppose this conclusion and the NYISO’s proposal to include SCR
emissions controls for a gas-only peaking plant design. Other stakeholders, however, support the
proposal to include SCR emissions controls in all locations. As further described herein, the
materially greater adverse potential environmental impacts associated with a plant design that
does not include SCR emissions controls creates a significant risk that such a plant would not
obtain the necessary approvals under Article 10 to proceed with construction. Moreover, such a
design has not been permitted during the NYISO’s existence. Therefore, the Independent
Consultant and the NYISO conclude that a representative peaking plant design should include
SCR emissions controls in all locations regardless of whether it is a gas-only or dual fuel plant.
Article 10 Requirements
In addition to obtaining the necessary air permits to operate, each peaking plant must
obtain a certificate of environmental compatibility and public need from the Siting Board. To
issue such a certificate, Article 10 mandates that the Siting Board find that “the adverse
environmental effects of the construction and operation of the facility will be minimized or
48 The NYISO is proposing a dual fuel plant design for Load Zone G. As such, SCR emissions controls would be required.
49 NYISO Staff Final Recommendations at 8-9; Independent Consultant Final Report at 27-28; and Lummus Affidavit at ¶ 27.
50 2013 DCR Order at P 74-77.
51 NYISO Staff Final Recommendations at 8-9; Independent Consultant Final Report at 27-28; and Lummus Affidavit at ¶ 29.
Honorable Kimberly D. Bose November 18, 2016
Page 13
avoided to the maximum extent practicable.”52 Article 10 also empowers the Siting Board to exercise its authority in granting a certificate regardless of any draft air permits (and
accompanying restrictions and limitations contained therein) that may have been issued for a project.53 This reservation of independent authority to the Siting Board could permit the Siting Board to impose more stringent requirements than the air permits issued for a project or simply deny a project’s application, preventing it from being constructed.
In the last reset, when compared to a peaking plant design that included SCR emissions
controls, the uncontrolled unit operating pursuant to an annual operating hours cap produced far
less emissions on an annual potential to emit basis than the design including SCR emissions
controls.54 Therefore, in the last reset, the NYISO concluded that the uncontrolled unit subject to
an annual operating hours limitation represented a design that, arguably, would minimize the
adverse impacts of NOx emissions to the maximum extent practicable. As such, this design
appeared reasonable and capable of obtaining a certificate from the Siting Board pursuant to
Article 10.
The applicable environmental requirements have changed significantly since the last reset.
These changes have now invalidated the rationale previously relied upon by the NYISO and
demonstrate that the alternative compliance option of an annual operating hours cap in lieu of installing SCR emissions controls is not viable for this DCR. Based on the environmental
requirements applicable for this DCR, a peaking plant design without SCR emissions controls would now produce 2.5 times more NOx emissions on an annual potential to emit basis than a unit that includes such back-end controls, as shown in the figure below.55 Accordingly, the
peaking plant design without SCR emissions controls no longer appears to comport with the
requirements of Article 10.56 As a result there is significant uncertainty regarding whether such a design could obtain a certificate from the Siting Board.
52 PSL § 168(3)(c).
53 PSL § 172. Article 10 expressly provides that “issuance by the department of environmental conservation of [air and other required] permits shall in no way interfere with the required review by the [Siting Board] of the anticipated environmental and health impacts relating to construction and operation of the facility as proposed, or its authority to deny an application for certification ….”
54 NYISO Staff Final Recommendations at 8-9; and Independent Consultant Final Report at 27.
55 NYISO Staff Final Recommendations at 8-9; Independent Consultant Final Report at 27; and Lummus Affidavit at ¶ 27-29.
56 Id.
Honorable Kimberly D. Bose November 18, 2016
Page 14
120
100
80
60
40
20
0
No operating hour
limit
Operating hour
limit ~ 950
hours/year
2013 DCR
Operating hour limit ~
2,500 hours/year
CO2 NSPS operating
hour limit ~ 3,360
hours/year
Current DCR
Synthetic Minor with no SCRPlant Design with SCR
Additional Relevant Factors Considered
Research conducted by the NYISO regarding air permits for electric generation facilities in New York further supports the conclusion that the alternative compliance option to avoid SCR emissions controls is not viable for this DCR. The NYISO is not aware of a single instance
during its existence in which a permit was issued in New York for an electric generation facility that authorized the use of an annual operating hours cap in lieu of installing SCR emissions
controls to reduce NOx emissions.57
This conclusion is further supported by other changes in the applicable limitations on
NOx emissions implemented since the last reset. The following changes clearly indicate a
continued progression of requiring further reductions in NOx emissions from power plants:
• On November 1, 2016, the State announced the implementation of new regulations to
reduce NOx emissions from existing distributed generation facilities throughout New
York. The new requirements are more stringent than the standards recently enacted by
the U.S. EPA for such facilities.58
• On October 1, 2015, the U.S. EPA revised the national ambient air quality standard
(“NAAQS”) for ozone from 75 ppb to 70 ppb. The revised standard will require the State to revise its State Implementation Plan (“SIP”) to achieve compliance with the more
57 NYISO Staff Final Recommendations at 9.
58 See Rules for Distributed Generation Sources (6 NYCRR Part 222), available at:
http://www.dec.ny.gov/regulations/104487.html.
Honorable Kimberly D. Bose November 18, 2016
Page 15
stringent standard. SIP revisions could include mandating additional emission control measures for existing facilities and/or revisions to the NSR requirements.59
• On September 7, 2016, the U.S. EPA also significantly reduced New York’s seasonal
NOx emissions budget under the Cross State Air Pollution Rule (“CSAPR”).60 The
revised budget, which takes effect on May 1, 2017, reduces the State’s emissions budget
by approximately 50%. The new budget is nearly 10% below the actual 2015 NOx
emissions of affected electric generators in New York.
The foregoing clearly demonstrates that changes in the applicable regulatory
requirements since the last reset undermine the continued viability of the alternative compliance
option of using an annual operating hours limitation in lieu of installing SCR emissions controls
in New York for this DCR. As such, a reasonable and representative peaking plant design
should include SCR emissions controls in all locations. Failure to include such controls is likely
to result in a design that is either incapable of being constructed in New York or, at best,
potentially constructed in a single, limited one-off circumstance without the ability to be
repeated, if necessary. This could result in the establishment of ICAP Demand Curves that may
ultimately fail to produce adequate price signals to elicit and support new entry into the market
when needed to maintain reliability.
C. Dual Fuel Capability
Consistent with the last reset, the NYISO proposes that the peaking plant designs for the NYC, LI and G-J Locality ICAP Demand Curves continue to include dual fuel capability.61 The NYISO also proposes to maintain the gas-only peaking plant design approved by the
Commission in the last reset for the NYCA ICAP Demand Curve.62
Similar to the last reset, certain stakeholders continue to oppose the inclusion of dual fuel
capability for the G-J Locality ICAP Demand Curve. These stakeholders maintain that it is
possible for a peaking plant to interconnect directly to an interstate pipeline in Load Zone G.
This would avoid the imposition of any applicable local gas distribution company (“LDC”) gas
tariff requirements for dual fuel capability imposed on generators directly interconnecting to the
LDC gas system. Furthermore, these stakeholders contend that, in the absence of LDC imposed
59 NYISO Staff Final Recommendations at 9-10; and Independent Consultant Final Report at 27-
28.
60 U.S. EPA, Final Cross-State Air Pollution Rule Update (September 7, 2016), available at:
https://www.gpo.gov/fdsys/pkg/FR-2016-10-26/pdf/2016-22240.pdf.
61 2013 DCR Order at P 83.
62 Id. The NYISO’s proposal differs from the recommendations of the Independent Consultant in this respect. The Independent Consultant recommended that dual fuel capability be included in the
peaking plant design for all locations, including the NYCA ICAP Demand Curve. See Independent
Consultant Final Report at 32-33; and AG Affidavit at ¶ 23 and 28-30. The MMU concurred with the Independent Consultant’s recommendation for dual fuel capability for the NYCA ICAP Demand Curve, as it relates to a peaking plant located in Load Zone F.
Honorable Kimberly D. Bose November 18, 2016
Page 16
dual fuel requirements, dual fuel capability should only be included in the G-J Locality ICAP
Demand Curve if the incremental revenues derived from such capability fully offset the cost
thereof over the three-year historic period covered by the net EAS revenues model for a given
Capability Year.
Other stakeholders oppose the NYISO’s proposal to continue use of a gas-only peaking
plant design for the NYCA ICAP Demand Curve. These stakeholders contend that several
factors support including dual fuel capability for all locations. They first note that the State’s
growing reliance on natural gas to produce electricity indicates a need for dual fuel capability
statewide in order to ensure continued reliability. These stakeholders also note that public
policies that promote increasing reliance on intermittent renewable generation to serve consumer
electricity demand underscore the importance of dual fuel capability in all locations. Increased
levels of intermittent renewable generation will place a growing demand on flexible generation
to be available to serve in a load following capacity and quickly meet demand when intermittent
renewable facilities, such as wind and solar, are unavailable. Lastly, these stakeholders note that
dual fuel capability serves as an important hedge to help mitigate electricity price spikes during
periods when natural gas prices spike.
The conditions that the Commission found justified the inclusion of dual fuel capability for the NYC, LI and G-J Locality ICAP Demand Curves in the last reset remain unaltered. For NYC and LI, there are local electric reliability rules that require dual fuel capability.63 In these locations, nearly all generation is interconnected to the LDC gas system and LDC gas tariffs
impose dual fuel requirements on electric generators.64 Therefore, dual capability is mandated in these areas and must be included in the peaking plant design.
Load Zones C, F and G, however, are somewhat differently situated. Currently, there are
not mandatory requirements imposed by local electric reliability rules that would require units in
these areas to include dual fuel as part of interconnecting to the electric system.65 Generators in
these locations may also possess the option of directly interconnecting to the interstate pipeline
system in order to avoid the imposition of any LDC gas tariff mandates for dual fuel capability.66
Therefore, in the absence of a mandatory requirement for dual fuel capability, other relevant
factors must be evaluated to determine whether such capability is necessary in a given location to deem the peaking plant design “economically viable” under the Services Tariff. This includes consideration of the other benefits and costs associated with dual fuel capability, such as the
reliability benefit of having an onsite alternate fuel source.
63 NYISO Staff Final Recommendations at 4.
64 Id.
65 The NYISO has identified a project for 2017 to further assess capacity market performance
assurance and potential dual fuel requirements. To the extent that this project results in the imposition of mandatory dual fuel requirements, the NYISO will assess any implications thereof on the proposed ICAP Demand Curves as part of that separate project effort.
66 NYISO Staff Final Recommendations at 4.
Honorable Kimberly D. Bose November 18, 2016
Page 17
Dual fuel capability presents the opportunity for additional revenue earnings through the
potential ability to operate on an alternative, lower cost fuel during periods of natural gas price
spikes.67 In this manner, dual fuel capability also serves as a price hedging mechanism to
mitigate the level of electricity price spikes during periods of high natural gas prices.68 The
impacts of this price hedge were demonstrated during the winter 2013/2014 period. While gas
prices in certain areas of the State increased by nearly 400% in January 2014, compared to
December 2013, wholesale electricity prices in New York increased by less than half the spike in
gas prices. In large part, this was due to the existence of dual fuel capability and the ability of
generators with such capability to operate on a lower cost alternative fuel.69 Dual fuel capability
also provides reliability benefits in light of the State’s growing reliance on natural gas fired
generation to meet electricity demand.70
Additionally, there are concerns regarding the ability of pipeline developers to expand the capability of the interstate pipeline system in New York. The Constitution Pipeline project was recently denied certain required permits, indefinitely delaying construction of that project.
Kinder Morgan also recently announced the cancellation of its North East Energy Direct pipeline project. Both of these projects would have expanded the capacity available on the interstate
pipeline system running through New York.71
In approving the inclusion of dual fuel capability for the G-J Locality ICAP Demand
Curve in the last reset, the Commission identified various relevant considerations that supported
inclusion of this capability.72 It was noted that LDC gas tariffs in Load Zone G include
requirements for dual fuel capability for LDC connected generation facilities.73 The
Commission also noted other considerations that supported inclusion of dual fuel capability for
the G-J Locality ICAP Demand Curve such as: (i) the relative costs of dual fuel capability versus
securing firm gas service through an interstate pipeline interconnection coupled with a firm gas
contract; (ii) the growing reliance on natural gas fired generation in New York; and (iii) siting
67 Id. at 5; Independent Consultant Final Report at 32-33; and AG Affidavit at ¶ 30.
68 NYISO Staff Final Recommendations at 4.
69 NYISO, Winter 2013-2014 Cold Weather Operating Performance (presented at the March 13,
2014 Joint Electric-Gas Coordination Working Group and Market Issues Working Group meeting) at 22,
available at:
http://www.nyiso.com/public/webdocs/markets_operations/committees/bic_miwg/meeting_materials/201
4-03-13/Winter%202013-1014%20NYISO%20Cold%20Snap%20Operations%20EGCW-MIWG.pdf.
70 NYISO Staff Final Recommendations at 4; Independent Consultant Final Report at 33; and AG Affidavit at ¶ 30.
71 The NYISO takes no position on the merits of either pipeline project or the regulatory
proceedings relating thereto. The NYISO merely cites these two projects as examples of recent pipeline development efforts in New York.
72 2013 DCR Order at P 83.
73 Id.
Honorable Kimberly D. Bose November 18, 2016
Page 18
flexibility afforded by included dual fuel capability.74 These considerations remain unchanged for the G-J Locality.
The G-J Locality is a relatively geographically constrained region. The inclusion of dual
fuel capability provides increased siting flexibility for the peaking plant by allowing site
selections that would require either an interconnection to the LDC gas system or the interstate
pipeline system. This increased siting flexibility increases the potential for a developer to
identify a location that coincidentally minimizes both electric and gas interconnection costs.75
This region is also primarily located downstream of the constraints on the interstate pipeline
system. Therefore, the current concerns regarding the ability to expand pipeline infrastructure
and gas pipeline capacity in New York underscore the reliability benefits gained from dual fuel
capability in this region. Based on consideration of all of the foregoing factors, the NYISO
proposes to maintain dual fuel capability for the G-J Locality ICAP Demand Curve.
While recognizing the reliability and other benefits of dual fuel capability, the
circumstances presented in Load Zones C and F are distinguishable from the G-J Locality. The
upstate New York region is far less geographically constrained and generally presents greater
availability of sites and infrastructure (both electric and gas) with which a new facility could
interconnect.76 Moreover, natural gas supply conditions in the upstate New York region are, at
least in the near term, more favorable than the lower Hudson Valley due, in part, to the fact that
this region is generally located upstream of the interstate pipeline constraints in State and has
connections to natural gas supplies from the nearby shale gas producing regions.77 The
NYISO’s interconnection queue also indicates that developers proposing conventional
generation projects in the upstate region are generally not including dual fuel capability at this
time.78 The NYISO, therefore, has concluded that, for this DCR, a gas-only peaking plant design for the NYCA ICAP Demand Curve remains reasonable.
D. Peaking Plant Costs
The Services Tariff requires that the DCR assess “the current localized levelized
embedded cost of a peaking plant” for each ICAP Demand Curve.79 Consistent with prior resets,
the Independent Consultant conducted a rigorous analysis to develop estimates of the capital
investment costs for the peaking plant designs for each ICAP Demand Curve, as well as the
74 Id.
75 NYISO Staff Final Recommendations at 4-5; Allen Affidavit at ¶ 10; Independent Consultant Final Report at 32-33; and AG Affidavit at ¶ 30.
76 NYISO Staff Final Recommendations at 5; and Allen Affidavit at ¶ 11.
77 Id.
78 Allen Affidavit at ¶ 11.
79 See Services Tariff § 5.14.1.2.2.
Honorable Kimberly D. Bose November 18, 2016
Page 19
associated fixed operations and maintenance (“O&M”) and variable O&M costs for each peaking
plant.80
The capital investment cost estimates include the direct installed costs of the plant,
owner’s costs, financing costs during construction and working capital and inventories costs.
The direct installed costs are comprised of the cost to engineer, procure and construct (“EPC”)
each peaking plant, the associated electric interconnection costs and the gas interconnection
costs. Other costs not covered by EPC, such as social justice costs, financing costs during
construction, working capital and inventory costs, and any applicable deliverability costs are
included as part of the owner’s cost.81 The EPC cost estimates are not site-specific and, instead,
reflect generic sites within each of the relevant Load Zones assessed. A contingency was applied
to the total direct and indirect project costs to account for the uncertainties inherent in the generic
site estimates and the potential for cost increases that could result during detailed design and
procurement.82 For the NYISO’s proposed peaking plant designs, the applicable peaking plant
capital investment cost estimates (in 2015 dollars) are $960 per kW for the NYCA ICAP
Demand Curve, $1,168 per kW for the G-J Locality ICAP Demand Curve, $1,272 per kW for the
NYC ICAP Demand Curve and $1,313 per kW for the LI ICAP Demand Curve.83 The NYISO
proposes to adopt the cost estimates developed by the Independent Consultant for each of the
relevant peaking plant designs.84
As required by the Commission,85 the NYISO conducted an assessment to determine
whether any of the peaking plants would incur deliverability costs under the tariff-prescribed
level of excess conditions.86 The NYISO’s assessment determined that the peaking plants in all
locations, except Long Island, were deliverable.87 For Long Island, it was determined that
certain transmission system upgrades would be required in order to award Capacity Resource
Interconnection Service (“CRIS”) rights for the peaking plant.88 The deliverability upgrades
required for the peaking plant design proposed by the NYISO for the LI ICAP Demand Curve
consist of replacing approximately 3 miles of 69 kV overhead transmission line conductors.89
The estimated cost of these upgrades, plus a contingency, is $18.48 million.90 These costs are
80 Independent Consultant Final Report at 33-48 and 109-147; and Lummus Affidavit at ¶ 15-22 and 32-35.
81 Id.
82 Id.
83 NYISO Staff Final Recommendations at 14-15.
84 Id. at 14-19.
85 See, e.g., 2010 DCR Order at P 53.
86 NYISO Staff Final Recommendations at 10-13.
87 Id. at 12.
88 Id.
89 Id.
90 Id.; and Independent Consultant Final Report at 41 and 112.
Honorable Kimberly D. Bose November 18, 2016
Page 20
included as separate line item in the owner’s cost category of the capital investment cost for the NYISO’s proposed LI ICAP Demand Curve peaking plant.91
The NYISO assessed whether the System Deliverability Upgrades (“SDUs”) required for its proposed peaking plant design for the LI ICAP Demand Curve would potentially result in the award of Incremental TCCs that could serve as an offset to the cost of such upgrades.92 The
NYISO concluded that the required SDUs would not result in the award of any Incremental
TCCs because the relevant upgrades are limited to reconductoring of certain 69 kV transmission lines on Long Island. The 69 kV transmission system on Long Island is currently not secured in the Day-Ahead Market or the TCC auctions. Therefore, the upgrades would not be eligible for any Incremental TCC award at this time.93
The Independent Consultant also developed the fixed and variable O&M costs, as well as the performance characteristics for each peaking plant design.94 Fixed O&M consists of two components - fixed plant expenses and fixed non-operating expenses. Typical fixed plant
expenses include plant staff labor costs, routine O&M costs, routine planned maintenance, and administrative and general expenses. The total fixed O&M costs also account for other expenses such as site leasing costs, insurance and property taxes. The proposed property tax rates for the peaking plants are further discussed in Section III.E below.
Variable O&M costs are those costs directly related to the generation of electricity,
including start-up costs. The total variable O&M costs generally consist of two components -
consumables (e.g., ammonia for the SCR, chemicals, water and other production-related
expenses, including SCR and oxidation catalyst replacement) and major equipment maintenance.
The performance characteristics for each peaking plant design include the average
degraded net capacity output (including seasonal values), net heat rate, seasonal average
Dependable Maximum Net Capability (“DMNC”) capacity ratings, plant start-up time and fuel
required for start-up. The variable O&M and performance characteristics are used in
determining net EAS revenue estimates and the ICAP Demand Curve parameters for each
Capability Year.
The NYISO proposes to adopt the fixed O&M costs, variable O&M costs and
performance characteristics developed by the Independent Consultant for each of the relevant peaking plants.95
91 Id.
92 See, e.g., 2010 DCR at P 63; and NYISO Staff Final Recommendations at 12.
93 NYISO Staff Final Recommendations at 12.
94 Id. at 18-19, 21-22 and 47-51; Independent Consultant Final Report at 42-53, 118-123 and 132-
147; and Lummus Affidavit at ¶ 20-22.
95 NYISO Staff Final Recommendations at 18-19, 21-22 and 47-51.
Honorable Kimberly D. Bose November 18, 2016
Page 21
E. Property Taxes
The NYISO proposes the same property tax treatment for the peaking plants that was
approved by the Commission in the last reset.96 For the NYC ICAP Demand Curve, the peaking plant will qualify for the as-of-right 15 year tax abatement provided for under the New York State Real Property Tax law.97 For years 16-20 of the proposed amortization period, the NYC ICAP Demand Curve peaking plant will be subject to an effective tax rate of 4.8%.98
For all locations outside of NYC, the NYISO proposes that the peaking plants be subject
to an effective tax rate of 0.75% for the entire 20 year proposed amortization period. This rate is
based on the assumption that the peaking plants outside NYC will enter into a Payment in Lieu
of Taxes (“PILOT”) agreement that will cover the proposed 20 year amortization period.99
In the last reset, the 0.75% tax rate accepted by the Commission for locations outside
NYC was primarily based on a review of PILOT agreements for three, more recent combined
cycle facilities constructed in New York. For this DCR, the Independent Consultant broadened
the dataset by reviewing 2014 PILOT payment data reported publicly by the Office of the New
York State Comptroller.100 Based on this data, the Independent Consultant identified PILOT
agreements for 11 natural gas fired generators in New York.101 Using the capital investment cost
information included in the Comptroller’s data, the Independent Consultant calculated effective
tax rates for each of these facilities.102 The effective tax rates for the examined facilities ranged
from 0.2% to 2.1%, with a median value of 0.83%.103 Therefore, the Independent Consultant
proposed retaining use of the currently approved 0.75% property tax rate for all locations outside
NYC.
Certain stakeholders contend that the proposed 0.75% property tax rate for locations
outside NYC is too low. These stakeholders contend that public policies favoring additional
renewable generation and other clean energy resources, as well as property tax increase
restrictions implemented since the last reset are likely to place upward pressure on future PILOT payments for natural gas fired generators, such as the peaking plant.
96 See 2013 DCR Order at P 90-91 and 94.
97 New York Real Property Tax Law §§ 489-aaaaaa et seq.
98 NYISO Staff Final Recommendations at 21; Independent Consultant Final Report at 45-46; and AG Affidavit at ¶ 33.
99 NYISO Staff Final Recommendations at 21-22 and 48-51; Independent Consultant Final Report at 45-46; and AG Affidavit at ¶ 34-35.
100 Id.
101 Id.
102 Id.
103 Id.
Honorable Kimberly D. Bose November 18, 2016
Page 22
In response to these claims, the NYISO requested and obtained a copy of the recent
PILOT agreement for a new natural gas fired, combined cycle facility that is currently under
construction in the lower Hudson Valley region.104 The average effective tax rate for this facility
over the first 20 years of the PILOT agreement is 0.18% in real dollar terms.105 This effective
tax rate is lower than the effective tax rates for three other recent combined cycle facilities
constructed in New York (i.e., Athens, Bethlehem and Empire).106 This demonstrates that the
property tax increase restrictions and public policies favoring renewable generation resources do
not appear to have had an adverse impact on the tax rates afforded to new fossil fuel fired
generators in New York.107
Certain other stakeholders contend that the 0.75% tax rate for locations outside of NYC is
too high and should be reduced to a value closer to 0.5%. These stakeholders contend that the
Independent Consultant’s effective tax rate calculations are overstated because the underlying
capital investment cost for each of the examined facilities was not translated to 2014 dollars to
provide for consistency with the year in which the relevant PILOT payments were made.
In response to these concerns, the NYISO conducted certain additional analysis regarding PILOT agreements for natural gas fired generators in New York.108 The NYISO supplemented the analysis performed by the Independent Consultant by converting the underlying capital
investment cost for each project to 2014 dollars and then recalculating the effective tax rates. The effective tax rates for this alternative methodology range from 0.15% to 1.6%, with a
median value of 0.77% for the examined facilities located outside NYC.109
Based on its additional analysis, as well as the initial analysis conducted by the
Independent Consultant, the NYISO has concluded that the 0.75% property rate tax approved by the Commission in the last reset for locations outside NYC remains a reasonable and appropriate value and should be retained for this DCR.
IV.Net EAS Revenue Offset
The Services Tariff requires that the DCR assess the likely net EAS revenues to be
earned by the peaking plant for each ICAP Demand Curve from participation in the NYISO-
administered markets.110 As part of the DCR enhancements accepted by the Commission on
July 18, 2016, the NYISO proposed to replace the net EAS revenue estimation methodology
104 NYISO Staff Final Recommendations at 49.
105 Id. at 49.
106 Id.
107 Id.
108 Id. at 48-51.
109 Id.
110 See Services Tariff § 5.14.1.2.2.

Honorable Kimberly D. Bose November 18, 2016
Page 23
used for the past three resets with a more transparent and formulaic methodology that relies on actual historic data.111
The net EAS revenues model developed by the Independent Consultant determines the
estimated annual net EAS revenues that would be earned by each peaking plant based on the
prior 36 months of historic data on market prices and variable costs (i.e., September through
August).112 Generally, for each hour of the historic period, the model determines whether each
peaking plant should be committed and dispatched to produce Energy or provide Operating
Reserves based on a consideration of historic LBMPs and reserve prices (both as adjusted to
account for the tariff-prescribed level of excess conditions), coincident fuel and emission
allowance prices, non-fuel variable costs, start-up costs and the operational characteristics of the
peaking plant. The model considers both Day-Ahead and real-time commitment and dispatch
opportunities, while respecting the physical operating characteristics of the peaking plant. This
includes the ability of the peaking plant to buy-out of a previously determined Day-Ahead
commitment in real-time to the extent it would be economically advantageous for the plant to do
so, as well as the ability to produce Energy or provide Operating Reserves in real-time in the
absence of a prior Day-Ahead commitment.
The commitment and dispatch logic of the model is summarized in the figures below.113
Net EAS Revenues Model Day-Ahead Commitment Logic
Energy Block
Profitable?
Yes
Reserve Profit >=
Energy Profit?
YesNo
Commit DAMCommit DAM
ReserveEnergy
No
Reserve Profit > 0?
YesNo
Commit DAMNo DAM
ReserveCommitment
111 DCR Enhancements Filing at 5-7; and DCR Enhancements Order at P 16.
112 NYISO Staff Final Recommendations at 22-29; Independent Consultant Final Report at 68-85; and AG Affidavit at ¶ 36-46. For example, the historic data period used by the net EAS revenues model for the 2017/2018 Capability is September 2013 through August 2016.
113 Independent Consultant Final Report at 71.

Honorable Kimberly D. Bose November 18, 2016
Page 24
Net EAS Revenues Model Real-Time Commitment and Dispatch Logic
DAM
Commitment?
EnergyNo Commitment
Reserve
RTD Reserve
More Profitable?
YesNo
Buy Out of Energy
Commitment at RTD
Price w/ Fuel Penalty
Provide
RTD Energy
More Profitable?
No
Yes
Buy Out of Reserve
Commitment at RTDSimilar logic to
Priceday-ahead using
real-time prices
to select Provide
Reserves
DispatchDispatch
dispatch Reserves
The model also accounts for any operating hour restrictions or limitations imposed on the peaking plant to comply with applicable environmental requirements.114 These limitations are
essentially applied after-the-fact. The model will first determine the optimal dispatch of the
peaking plant for a given 12 month period (i.e., September through August). If the optimal
dispatch exceeds a specified annual operating hours limitation, the model will then reduce the
number of hours that it determined the peaking plant would otherwise produce Energy to ensure compliance with the specified limitation. In doing so, the model reduces the hours in which the peaking plant would otherwise produce Energy by eliminating the hours with the lowest level of net Energy revenues first. The model continues eliminating hours based on increasing values of net Energy revenues earned in each hour until a sufficient number of hours have been eliminated to ensure compliance with the specified limitation.
The net EAS revenues determined by the model are increased by an adder to reflect
expected revenues for Ancillary Services not accounted for in the model.115 The value of this
adder for the NYISO’s proposed peaking plants is $1.43 per kW-year to account for voltage
support service (“VSS”) revenues that are likely to be earned by the peaking plant. Additional
details regarding the commitment and dispatch logic, assumptions and inputs used by the model
are provided in the Independent Consultant Final Report and are summarized in the table in
Section VI.B below.116
The net EAS revenues model developed by the Independent Consultant achieves the
desired objectives of transparency and predictability, while simultaneously ensuring that the
114 Id. at 70.
115 NYISO Staff Final Recommendations at 22 and 39; Independent Consultant Final Report at 72; and AG Affidavit at ¶ 43.
116 Independent Consultant Final Report at 67-85; and AG Affidavit at ¶ 36-53.
Honorable Kimberly D. Bose November 18, 2016
Page 25
estimates it produces are reasonable and appropriate. The proposed model was thoroughly vetted
with stakeholders and is posted publicly on the NYISO’s website.117 The NYISO proposes to
adopt the Independent Consultant’s net EAS revenues model. This model was used to produce
the net EAS revenue estimates utilized in determining the ICAP Demand Curves for the
2017/2018 Capability Year and will be used in producing the net EAS revenue estimates as part
of the annual update process for the 2018/2019 through 2020/2021 Capability Years.
A. Natural Gas Hub Prices
Fuel prices are one of the single largest drivers of variable costs for the peaking plants.
Therefore, use of reasonable and representative fuel prices is critically important to the ability of
the net EAS revenues model to produce appropriate and reasonable results. The Services Tariff
requires that, as part of the DCR, the appropriate data sources for fuel prices be determined.118
For natural gas prices, this includes both the data source from which the applicable historical
prices are determined, as well as the appropriate natural gas hub pricing point for each peaking
plant location.
The selection of the appropriate gas hub pricing point for each location is not a
straightforward exercise because, for nearly all locations, there are multiple available options.
Therefore, in this DCR, a multi-factor assessment was conducted to determine the appropriate
natural gas hub pricing point for each location.119 The criteria considered by the assessment
were: (1) correlation of gas hub prices with LBMPs for the relevant location and the extent to
which the gas hub prices reflect New York electricity market dynamics; (2) the liquidity and
depth of trading activity at the gas hub; (3) geographic proximity of the gas hub to the location at
issue; and (4) precedent for the gas hub prices being used in prior DCRs and other NYISO
studies and evaluations (including NYISO planning studies and evaluations conducted by the
MMU).
An important factor for this DCR was the correlation of the gas hub prices to LBMPs for
the location and the extent to which the relevant gas hub prices reflect electricity market
dynamics. In some instances it became readily apparent from a review of historic data that
certain candidate gas hub pricing points were likely not representative of marginal fuel supply
costs in the electricity market, particularly during winter months such as the winter 2013-2014
period.120
117 The net EAS revenues model posted on the NYISO website within the “Final Net EAS Model September 13, 2016” section of the “2017-2021 Demand Curve Reset” subfolder of the “Reference
Documents” folder, available at:
http://www.nyiso.com/public/markets_operations/market_data/icap/index.jsp. Prior iterations of the
model are also available within this same area of the NYISO website, tracking the evolution of the model throughout the DCR and any adjustments thereto in response to stakeholder feedback.
118 See Services Tariff § 5.14.1.2.2.2.
119 NYISO Staff Final Recommendations at 22-24 and 53-68; Independent Consultant Final Report at 74-80; and AG Affidavit at ¶ 47-53.
120 Independent Consultant Final Report at 74-78; and AG Affidavit at ¶ 48.
Honorable Kimberly D. Bose November 18, 2016
Page 26
Gas hub pricing points that are not correlated with electricity market dynamics and
pricing outcomes may reflect near-term arbitrage opportunities for generators that can obtain
access to such lower cost fuel supplies. While these arbitrage opportunities are reflective of
current conditions, they may not be reflective of gas supply pricing under the longer-term
equilibrium conditions that are required to be considered in establishing the ICAP Demand
Curves.121 Use of these gas hub pricing points could result in significantly overstating the net
EAS revenues that a peaking plant would expect to earn under the tariff-prescribed level of
excess conditions. Any such material overstatement of net EAS revenues could result in the
establishment of ICAP Demand Curves that do not provide appropriate price signals regarding
the value of capacity.122
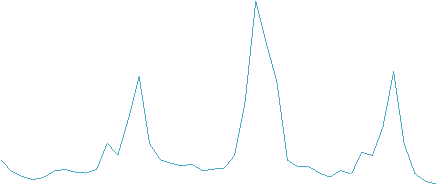
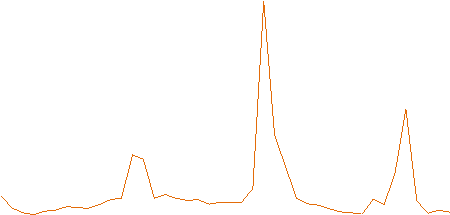
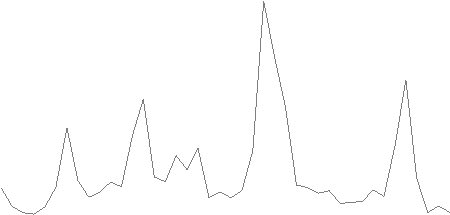
The figures below depict the relative correlation of various potential gas hub pricing points for the locations assessed during this DCR.123
121 The DCR requires that net EAS revenue estimates reflect the expected conditions when new
entry is needed (i.e., the tariff-prescribed level of excess conditions), not current system conditions.
122 The NYISO conducted sensitivity analysis regarding certain of the alternative gas hub pricing
points advocated for by some stakeholders. This analysis indicated that use of Dominion North for Load
Zone C would result in a reference point price for the 2017/2018 Capability Year NYCA ICAP Demand
Curve that is approximately 40% lower than the currently effective value for the 2016/2017 Capability
Year. Replacing Iroquois Zone 2 with Millennium for Load Zone G would result in a reference point
price for the 2017/2018 Capability Year G-J Locality ICAP Demand Curve that is nearly 60% lower than
the currently effective value for the 2016/2017 Capability Year. See NYISO Staff Final
Recommendations at 54.
123 Independent Consultant Final Report at 75-78.
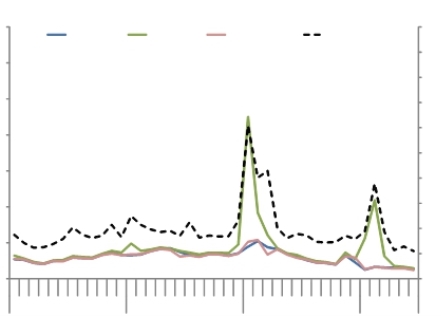
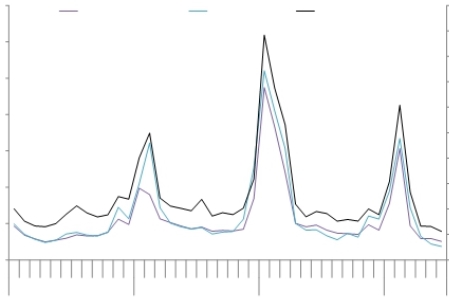
Honorable Kimberly D. Bose November 18, 2016
Page 27
Natural Gas Hub Prices and LBMPs for Load Zone C
Monthly AverageDAM LBMP
Spot Fuel Prices
($/MMBtu)
$35$200
Dominion NTETCO M3Millennium EastC-Central (LBMP)
$30
$25
$20
$15
$10
$5
$0
13579111357911135791113
201220132014 2015 Source: ICE (Millennium East); SNL (All Others).
Natural Gas Hub Prices and LBMPs for Load Zone F
Monthly Average
Spot Fuel Prices
($/MMBtu)
$35
$180
$160
$140
$120
$100
$80
$60
$40
$20
$0
5
DAM LBMP
$200
$30
$25
$20
$15
$10
$5
$0
Iroquois Zn 2
123456789 1011 12 1234
2012
Source: SNL Financial.
TGP Z6
5 6 7 8 9 1011 12 1 2 3 4 5
2013
F - Capital (LBMP)
6 7 8 9 1011 12 1 2 3 4 5 6
2014 2015
$180
$160
$140
$120
$100
$80
$60
$40
$20
$0
Honorable Kimberly D. Bose November 18, 2016
Page 28
Natural Gas Hub Prices and LBMPs for Load Zone G
Monthly Average Spot Fuel Prices ($/MMBtu)
$35
Iroquois Z2TGP Z6TETCO M3
$30
$25
$20
$15
$10
$5
$0
123456789 1011 12 12345678
20122013
Source: ICE (Millennium East); SNL (All Others).
DAM LBMP
$200
Millennium EastG-Hudson Valley (LBMP)
$180
$160
$140
$120
$100
$80
$60
$40
$20
$0
9 1011 12 123456789 1011 12 123456
20142015
Natural Gas Hub Prices and LBMPs for Load Zones J and K
Monthly Average
Spot Fuel Prices
($/MMBtu)
$35Iroquois Zn 2
$30
$25
$20
$15
$10
$5
$0
123456789 1011 12 1
2012
Source: SNL Financial.
Transco Zn 6 NYJ - NYC (LBMP)
23456789 1011 12 12345678
20132014
DAM LBMP
K - LI (LBMP)$200
$180
$160
$140
$120
$100
$80
$60
$40
$20
$0
9 1011 12 123456
2015
Honorable Kimberly D. Bose November 18, 2016
Page 29
The Services Tariff also mandates that the gas hub pricing selections made in the DCR
remain fixed for the duration of the four year reset period. Thus, ensuring that the gas hub is
both liquid and has a reliable history of trading activity is critically important to provide
assurance that it will continue to produce appropriate and reasonable prices going forward. In
the case of certain alternative gas hub pricing points that were considered (i.e., Dominion North
for Load Zone C and Millennium for Load Zone G [Rockland County]), the Independent
Consultant’s review of historic trading activity indicated that, although trading at each of these
gas hubs has been increasing in recent years, they currently lack the depth of trading history
provided by other candidate gas hubs for the same locations (e.g., TETCO M3 and Iroquois Zone
2, respectively).124
Based on the evaluation of the potential gas hub pricing points for each location using the multi-factor assessment described above, the following gas hub prices are proposed for use
during the reset period encompassed by this DCR:125
Load ZoneNatural Gas Hub
Load Zone CTETCO M3
Load Zone FIroquois Zone 2
Load Zone GIroquois Zone 2
Load Zone JTransco Zn 6 NY
Load Zone KTransco Zn 6 NY
For most Load Zones, the natural gas hub pricing points proposed for this DCR are the
same as those utilized in the last reset. The limited changes are the use of Iroquois Zone 2
instead of Tennessee Zone 6 for Load Zone F, and the use of Iroquois Zone 2 as the sole gas hub
pricing point for Load Zone G.126 For Load Zone F, Iroquois Zone 2 and Tennessee Zone 6 are
very similarly situated as it relates to the evaluation of the specified criteria. Iroquois Zone 2,
however, was selected because Tennessee Zone 6 is more likely to be affected by electricity
market and supply conditions in ISO-NE. This could result in Tennessee Zone 6 prices being
inconsistent with New York market dynamics and conditions. Iroquois Zone 2 is proposed as the
sole gas hub pricing point for Load Zone G because it is far better correlated than TETCO M3 to
LBMPs in the zone and, therefore, is most reflective of market dynamics in Load Zone G.127
124 Id. at 79.
125 NYISO Staff Final Recommendations at 23; Independent Consultant Final Report at 78; and AG Affidavit at ¶ 49-53.
126 In the last reset, Iroquois Zone 2 was used as the applicable gas hub pricing point for the
Dutchess County location in Load Zone G and TETCO M3 was used as the gas hub pricing point for the Rockland County location in Load Zone G.
127 NYISO Staff Final Recommendations at 23; Independent Consultant Final Report at 77-79; and AG Affidavit at ¶ 51-53.
Honorable Kimberly D. Bose November 18, 2016
Page 30
Certain stakeholders oppose the proposed gas hub pricing points for Load Zone C and
Load Zone G. These stakeholders contend that the Services Tariff requires that gas hub pricing
point selections be based solely on geography. Accordingly, they advocate for use of Dominion
North for Load Zone C and Millennium or TETCO M3 for the Rockland County location in
Load Zone G. Other stakeholders, including the MMU (as it relates solely to Load Zone G),
contend that for certain locations a “blended” gas hub price should be utilized. For Load Zone
G, these stakeholders advocate for a blend consisting of unspecified portions of Iroquois Zone 2,
Millennium and/or TETCO M3. With respect to Load Zone C, certain stakeholders argue for a
blended price that might consist of unspecified portions of Dominion North, Millennium and/or
TETCO M3.
Contrary to the assertions of these stakeholders, the Services Tariff does not include any mandate that gas hub pricing point selections be based solely on geography. The Services Tariff merely requires that a gas hub pricing point be selected for each of the relevant locations and clarifies that selection of such gas hub pricing points is a decision that must be made as part of the DCR.128 Thus, the Services Tariff merely dictates that the applicable gas hub pricing points be those that are determined as part of the extensive stakeholder process required by the DCR and reflect those that are ultimately accepted by the Commission.
The NYISO and the Independent Consultant fully considered the alternative gas hub
pricing points advocated by certain stakeholders. Dominion North and Millennium were
ultimately not recommended for use in this DCR because both gas hub pricing points: (i) are not well correlated with electricity market pricing outcomes and, thus, may not be representative of fuel supply costs incurred by marginal supply resources in the energy market; and (ii) have lower levels of trading history and activity in comparison to readily available and reasonable
alternatives (e.g., TETCO M3 and Iroquois Zone 2).129
Furthermore, use of a “blended” gas hub price for any location is not appropriate. There is no readily available publication that produces a “blended” price for the locations at issue. Therefore, the NYISO would be in the position of having to “create” such a price. The NYISO does not have any principled rationale, at this time, for developing what the appropriate “blend” would be for any given location that would ensure that any such blending methodology is
appropriate and sustainable for the four year reset period.130 Therefore, the NYISO does not support the use of any blended price mechanism at this time.
B. Real-Time Pricing
The net EAS revenues model makes real-time commitment and dispatch decisions based
solely on Real-Time Dispatch (“RTD”) LBMPs. Certain stakeholders noted that this does not
align with the NYISO’s actual Real-Time Market, in which prices produced by the Real-Time
128 See Services Tariff § 5.14.1.2.2.2.
129 NYISO Staff Final Recommendations at 23; Independent Consultant Final Report at 77-79; and AG Affidavit at ¶ 50 and 52-53.
130 AG Affidavit at ¶ 53.
Honorable Kimberly D. Bose November 18, 2016
Page 31
Commitment (“RTC”) software are used for commitment and actual real-time settlements and payments to generators are based on the LBMPs determined by RTD. Certain stakeholders contend the model’s reliance solely on RTD prices may result in a significant overstatement of the net EAS revenues that are likely to be earned by a peaking plant.
The Independent Consultant has assessed the potential impacts of using only RTD prices
in the model.131 A review of the RTC prices during the historical period relevant for the
2017/2018 ICAP Demand Curves indicates that, on average, RTC and RTD prices were not
significantly different. The Independent Consultant found that there was no systematic
difference between RTC and RTD prices and that RTC prices were either higher or lower than
RTD prices, depending on the interval.132 The Independent Consultant conducted certain
sensitivity analysis by replacing the RTD prices used in the model with RTC prices and found
that the resulting net EAS revenue estimates were not materially different. In fact, the net EAS
revenue estimates using RTC prices were generally less than 1% lower than the estimates
produced using RTD prices.133 Additionally, unlike RTC prices, the hourly integrated RTD
prices are already posted and publicly available on the NYISO’s website. Therefore, it was
concluded that use of RTD prices only in the model produced reasonable and appropriate results.
As such, no modifications to the model were deemed necessary. The NYISO concurs with this
conclusion and proposes that the net EAS revenues model use only RTD prices for real-time
commitment and dispatch.
C. Fuel Availability
In the last reset, net EAS revenue estimates for gas-only peaking plants were reduced to account for the potential of natural gas unavailability. The logic applied in the last reset
eliminated any net Energy revenues on days when the maximum temperature did not exceed 20oF.134 This logic was developed based on the NYISO’s review of then available confidential outage data for generators participating in its markets. Certain stakeholders have advocated for the inclusion of a similar reduction mechanism for this DCR.
The NYISO has again reviewed confidential data available to it regarding generator
operations and availability in New York over the three-year historic period of relevance for the
131 NYISO Staff Final Recommendations at 27-28; Independent Consultant Final Report at 70; AG Affidavit at ¶ 45; and AG, NYISO 2015/2016 ICAP Demand Curve Reset: Stakeholder Comments Related to Net Energy and Ancillary Services Revenues Model at 5-14 (presented at the July 20, 2016 ICAPWG meeting), available at:
http://www.nyiso.com/public/webdocs/markets_operations/committees/bic_icapwg/meeting_materials/20
16-07-
20/AG%20Draft%20Net%20EAS%20Feedback%2007202016%20ICAPWG%20Final%207%2014%202 016%20(2).pdf.
132 Id.
133 Id.
134 NYISO Staff Final Recommendations at 27.
Honorable Kimberly D. Bose November 18, 2016
Page 32
2017/2018 Capability Year. This review has indicated that the logic applied in the last reset can no longer be supported.
Notably, however, the mere absence of dual fuel capability and the requirement for a gasonly peaking plant to bid only on the basis of applicable gas prices likely provides an appropriate accounting for the loss in economic value from not having dual fuel capability. Because of the existing dual fuel capability within New York’s generation fleet, increases in LBMPs during
spikes in gas prices tend to be less than the underlying increase in gas prices. This is, in part, the result of generators operating on lower cost alternative fuels.135 As a result, a gas-only unit may be uneconomic and not scheduled by the net EAS revenues model during periods of gas price spikes. This appropriately reduces the gas-only unit’s potential energy revenue earnings
compared to the earnings of a unit with dual fuel capability.
Some stakeholders have also urged that the net EAS revenues model be revised to
incorporate additional logic to reflect potential difficulties in replenishing ULSD for a dual fuel
peaking plant during winter conditions.136 The onsite storage for ULSD incorporated into the
peaking plant design for a dual fuel unit provides the capability to operate for 96 hours before
needing to replenish the oil supply.137 The Independent Consultant reviewed the results of the
net EAS revenues model for the 2017/2018 Capability Year ICAP Demand Curves and
determined that for each location the minimum number of days to burn through the entire 96
hours of ULSD was 7 days for Load Zone J, 19 days for Load Zone K and 55 days for Load
Zones F and G. Moreover, the maximum run-time on ULSD in any 12-month period was 123
hours in Load Zone K, which occurred during the 2013-2014 period.138 These results indicate
that the onsite storage assumed for dual fuel peaking plants is adequate. These results also
demonstrate that conditions (including any replenishment delays) that could result in ULSD
being unavailable for energy production are not anticipated to occur.
The NYISO concludes that the net EAS revenues model produces reasonable and
appropriate results. No additional adjustments appear necessary to account for the concerns raised by certain stakeholders regarding potential fuel availability issues.
135 See, e.g., NYISO, Winter 2013-2014 Cold Weather Operating Performance (presented at the March 13, 2014 Joint Electric-Gas Coordination Working Group and Market Issues Working Group meeting) at 22, available at:
http://www.nyiso.com/public/webdocs/markets_operations/committees/bic_miwg/meeting_materials/201
4-03-13/Winter%202013-1014%20NYISO%20Cold%20Snap%20Operations%20EGCW-MIWG.pdf.
136 NYISO Staff Final Recommendations at 27; and Independent Consultant Final Report at 80.
137 This equates to a 4 day on-site oil reserve (or 6 days of operation on oil during on-peak
periods), which is included in the in the upfront investment cost estimates for peaking plants designs that
include dual fuel capability. This represents an increase to the on-site oil reserve requirement of 3 days
from the last reset.
138 Independent Consultant Final Report at 80 and 158.
Honorable Kimberly D. Bose November 18, 2016
Page 33
D. Intraday Natural Gas Costs
The net EAS revenues model includes intraday fuel premium/discount values for
determining real-time (or intraday) natural gas prices.139 The applicable values in the model are 10% for Load Zones C, F and G, 20% for Load Zone J and 30% for Load Zone K.140 These are the same values used by the MMU in its 2015 State of the Market Report for determining
intraday gas prices. These represent average values over the course of a year and are applied in every real-time hour. The applicable real-time gas price is determined by increasing the relevant day-ahead gas price for the hour by the applicable premium value.
Certain stakeholders contend that the premium values likely understate “true” intraday gas prices during winter gas demand peak periods when gas prices spike and the intraday
markets can be volatile. As a result, these stakeholders argue that the net EAS revenues model likely overstates real-time energy market revenues earned by a peaking plant. Other
stakeholders, however, contend that application of the premiums in all real-time hours may overstate intraday gas prices during periods when there are no significant differences between day-ahead and intraday gas prices. These stakeholders note that this could actually result in an understatement of revenues by the net EAS revenues model.
The Independent Consultant assessed the potential impacts of the proposed intraday
premium values and determined that they are not likely to result in any materially significant
under- or over-statement of estimated net EAS revenues for the peaking plants.141 This
assessment noted that any potential over-statement of revenues during winter peak periods would likely be offset by an understatement of revenue earnings during other months.142 The NYISO also reviewed proprietary gas price data, which confirms that the proposed values represent
reasonable average annual values.143 Therefore, the NYISO proposes to adopt the intraday gas premium/discount values proposed by the Independent Consultant.
139 NYISO Staff Final Recommendations at 29; Independent Consultants Final Report at 80; and AG Affidavit at ¶ 46.
140 Id.
141 NYISO Staff Final Recommendations at 29; Independent Consultant Final Report at 69; and
AG, NYISO 2015/2016 ICAP Demand Curve Reset: Stakeholder Comments Related to Net Energy and
Ancillary Services Revenues Model at 16-21 (presented at the July 20, 2016 ICAPWG meeting), available
at:
http://www.nyiso.com/public/webdocs/markets_operations/committees/bic_icapwg/meeting_materials/20
16-07-
20/AG%20Draft%20Net%20EAS%20Feedback%2007202016%20ICAPWG%20Final%207%2014%202 016%20(2).pdf.
142 Id.
143 NYISO Staff Final Recommendations at 29.
Honorable Kimberly D. Bose November 18, 2016
Page 34
E. Level of Excess Adjustment Factor Values
The Service Tariff mandates that net EAS revenue estimates for the peaking plant reflect the tariff-prescribed level of excess conditions.144 Consistent with the methodology approved by the Commission in the last reset, the NYISO proposes to account for this requirement by using level of excess adjustment factors (“LOE-AF”).145 The net EAS revenues model multiplies
historic LBMPs and reserve prices by the relevant LOE-AF values to approximate market
outcomes under the tariff-prescribed level of excess conditions.146
The LOE-AF values are determined using production cost modeling simulations to
determine projected LBMPs based on current system conditions and LBMPs under system
conditions that reflect the tariff-prescribed level of excess conditions.147 The LOE-AF values are determined by dividing the projected LBMPs under the tariff-prescribed level of excess
conditions by the projected LBMPs under current system conditions.
As was done in the last reset, the production cost modeling was conducted using GE
Energy Consulting’s Multi Area Production Simulation (“GE-MAPS”) software program. The relevant LBMPs for each case were determined for the years covered by this reset (i.e., 2017-
2021) using the 2016 Congestion Assessment Resource Integration Study (“CARIS”) Phase 2 base case dataset. This database was developed in accordance with the applicable tariff and
other requirements and was reviewed with stakeholders on several occasions at the Electric
System Planning Working Group before being presented to the Business Issues Committee on July 13, 2016. The 2016 CARIS Phase 2 database is the most current CARIS database
representation of the New York market and the assumptions regarding load forecasts, fuel and emission allowance prices and resource mix changes.
Use of the CARIS Phase 2 database and the assumptions contained therein is consistent
with commitments made during the stakeholder discussions related to the DCR. Certain
stakeholders, however, now advocate for certain adjustments to the resource mix assumptions
embedded in the CARIS Phase 2 database.148 These stakeholders contend that, in light of the
recent Clean Energy Standard order issued by the New York State Public Service Commission
(“CES Order”),149 the CARIS Phase 2 database used to determine the LOE-AF values should be
revised to no longer assume the retirement of the Ginna and Fitzpatrick nuclear facilities in 2017.
The CES Order, in part, includes a requirement for Load Serving Entities to purchase zero-
144 Services Tariff §§ 5.14.1.2.2 and 5.14.1.2.2.2.
145 See 2013 DCR Filing at 28; 2013 DCR Order at P 2 and 165.
146 NYISO Final Recommendations at 25-27 and 70-72; Independent Consultant Final Report at 81-83 and 150-151; and AG Affidavit at ¶ 41-42.
147 Id.
148 NYISO Staff Final Recommendations at 26.
149 See Case 15-E-0302, Proceeding on Motion of the Commission to Implement a Large-Scale
Renewable Program and a Clean Energy Standard, Order Adopting a Clean Energy Standard (issued and effective August 1, 2016.).
Honorable Kimberly D. Bose November 18, 2016
Page 35
emission credits from qualifying nuclear plants in New York. These stakeholders contend that
the CES Order should result in the retention of the Ginna and Fitzpatrick nuclear facilities.
Notably, neither Ginna nor Fitzpatrick have formally rescinded their previously issued notices, or statements, of intent to retire since issuance of the CES Order or provided any other notification to the NYISO that would meet the NYISO’s CARIS database inclusion rules to modify the currently assumed retirement of these facilities. Therefore, the LOE-AF values derived from the current CARIS Phase 2 database remain the appropriate values. As such, the NYISO proposes use of these LOE-AF values for this DCR.150
F. Impacts of Shortage Pricing
Certain stakeholders have advocated for the development of an unspecified adder to the
net EAS revenue estimates determined by the net EAS revenues model to account for the
resulting changes in shortage pricing from the NYISO’s implementation of revised shortage
pricing costs on November 4, 2015 (“Comprehensive Shortage Pricing”).151 The actual impacts
of Comprehensive Shortage Pricing on market outcomes and prices since its implementation are
already captured by the model. Moreover, the annual update process ensures that these impacts
continued to be recognized in a timely manner. In fact, capturing the impacts of market rule
changes, such as Comprehensive Shortage Pricing, was a primary motivation for the new annual
updating process.152 Accordingly, there is no need for any such adjustment as the annual update
process will capture the effects of Comprehensive Shortage Pricing on market outcomes as they
actually occur.
V.ICAP Demand Curve Parameters
The key parameters necessary for establishing the ICAP Demand Curves are: (i) the
maximum allowable price of capacity; (ii) the reference point price; and (iii) the point at which the price of capacity declines to zero (commonly referred to as the zero-crossing point). The maximum allowable price of capacity is established at 1.5 times the applicable localized
levelized embedded cost of the peaking plant. The reference point price is determined, in part, based on the net CONE value, derived by subtracting the relevant net EAS revenue estimate for a peaking plant from the levelized embedded cost value of the same plant.
150 In response to the concerns raised by the stakeholders advocating for adjustments to the
retirement assumptions for Ginna and Fitzpatrick that are embedded in the 2016 CARIS Phase 2 database, the NYISO developed alternative LOE-AF values and results for a revised database that did not include these retirements. See NYISO Staff Final Recommendations at 71-72.
151 See Docket No. ER15-1061, New York Independent System Operator, Inc., Proposed Tariff
Revisions to Ancillary Service Demand Curves and the Transmission Shortage Cost (February 18, 2015); and New York Independent System Operator, Inc., 151 FERC ¶ 61,057 (2015).
152 See DCR Enhancements Filing at 10.
Honorable Kimberly D. Bose November 18, 2016
Page 36
A. Levelized Fixed Charge and Financial Parameters
The Services Tariff requires that the DCR assess “the current localized levelized
embedded cost of a peaking plant” for each ICAP Demand Curve.153 This requires that the upfront capital investment costs for each peaking plant, including property tax and insurance, be translated into an annualized level. This translation accounts for: (i) the weighted average cost of capital (“WACC”) that is assumed to be required by a developer of the peaking plant to recover its up-front investments costs, plus a reasonable return on that investment; (ii) the term in years over which the developer is assumed to recover its up-front investment costs (commonly referred to as the “amortization period”); and (iii) the applicable tax rates.154 The WACC is derived from a series of financial parameters related to the development of the peaking plant, including the
required return on equity (“ROE”), the cost of debt (“COD”), and the capital structure for the
project (as reflected in the ratio of debt to equity [“D/E ratio”]).155
The Independent Consultant developed the parameters necessary to translate the up-front investment costs of the peaking plant for each ICAP Demand Curve into an annualized level
based on an assessment of relevant data and information, as well as its reasoned judgment and experience.156 The proposed parameters, as well as the analysis conducted to derive such
parameters, were fully vetted with stakeholders. The proposed parameters are designed to
appropriately reflect the financial risks faced by a developer in pursuing the construction and
operation of a peaking plant in New York on a merchant basis.157 After consideration of the
relevant data and information, as well as feedback from stakeholders, the table below reflects the financial parameters recommended by the Independent Consult for use in translating the up-front investment costs of the peaking plant into an annualized level.
Financial ParameterRecommended Value
ROE13.4%
COD7.75%
D/E Ratio55/45
WACC10.3%
Amortization Period20 years
The proposed ROE was derived based on analyzing data from several sources, including estimates for the ROE of certain publicly traded independent power producing companies
153 See Services Tariff § 5.14.1.2.2.
154 NYISO Staff Final Recommendations at 20-21; Independent Consultant Final Report at 54-66 and 148-159; and AG Affidavit at ¶ 54-70.
155 Id.
156 Id.
157 Id.
Honorable Kimberly D. Bose November 18, 2016
Page 37
(“IPPs”).158 This assessment, using the capital asset pricing model (“CAPM”), identified ROEs for the IPPs ranging from 10.0% to 12.5%.159 Because these values represent a portfolio of
projects and financing structures, the Independent Consultant also reviewed data regarding the ROE for stand-alone project finance approaches to generation projects. This data indicated that the required ROE for a project finance approach was significantly higher and likely in the range of 15% or greater.160 Based on the Independent Consultant’s reasoned judgment and experience, the value of 13.4% was recommended to reflect a balance between the lower values determined for the asset portfolios of IPPs and the higher project finance values.161
The proposed COD value was determined based on a review of debt costs for IPPs. The
data reviewed by the Independent Consultant indicated that debt costs for IPPs have ranged from
5% to 8% since 2013.162 The 7.75% value, which is toward the upper end of the observed range
of debt costs, was selected by the Independent Consultant as consistent with more recent generic
debt costs of firms with ratings similar to that of IPPs, which value is close to 8% in recent
months.163
The proposed D/E ratio (i.e., 55/45) was based on an analysis of IPP capital structures. The Independent Consultant found that current IPP capital structures are high compared to
historic levels.164 The Independent Consultant recommended use of a lower value to: (i)
recognize announcements by several IPPs that they will seek to deleverage their current capital structures; and (ii) provide greater consistency with the information obtained from other sources indicating a likely lower debt level for merchant projects similar to the peaking plant than is currently evidenced by the portfolio-wide capital structure of IPPs.165
The proposed 20-year amortization period reflects the same value approved by the
Commission for the F class frame turbine in the last reset.166 Given the proposal to continue use of this same technology, the NYISO finds that continued use of the previously approved
amortization period value is reasonable. The Independent Consultant assessed the currently
approved amortization period value and concluded that it remains an appropriate and reasonable value for the peaking plant.167
158 Independent Consultant Final Report at 59-60; and AG Affidavit at ¶ 64-65.
159 Id.
160 Id.
161 Id.
162 Independent Consultant Final Report at 57-59 and 148-149; and AG Affidavit at ¶ 63. 163 AG Affidavit at ¶ 63.
164 Independent Consultant Final Report at 60-61; and AG Affidavit at ¶ 66. 165 AG Affidavit at ¶ 66.
166 2013 DCR Order at P 117-118.
167 Independent Consultant Final Report at 55-56; and AG Affidavit at ¶ 57-58.
Honorable Kimberly D. Bose November 18, 2016
Page 38
Certain stakeholders have advocated for either reductions, or increases, to certain of the
proposed parameters values (e.g., ROE, COD, the amortization period and/or the D/E ratio). The NYISO has considered these comments and finds the Independent Consultant’s recommended
financial parameters to be justified based on the analysis conducted by the Independent
Consultant. As such, the NYISO proposes to adopt the financial parameters recommended by
the Independent Consultant.
B. ICAP Demand Curve Reference Point Calculation
Subtracting the estimated annual net EAS revenues for a peaking plant from its
annualized fixed charge value produces an annual net CONE value. The ICAP Demand Curves are utilized in the monthly ICAP Spot Market Auctions administered by the NYISO. Therefore, the annual net CONE value must be translated into a monthly value for use in the auctions. The Services Tariff also requires that the reference point value for each ICAP Demand Curve be determined under the tariff-prescribed level of excess conditions.168
In past resets, accounting for the tariff-prescribed level of excess conditions in calculating the ICAP Demand Curve reference point values has been accomplished through a procedure that was not entirely transparent to market participants.169 Consistent with the principles of increased transparency, predictability and understandability that have guided the recent enhancements to
the DCR, the Independent Consultant has proposed a more formulaic and transparent manner to account for the tariff-prescribed level of excess conditions when calculating the ICAP Demand
Curve reference point values.170
The NYISO finds that the proposed revisions to the calculation of the ICAP Demand
Curve reference point values are consistent with the requirements of the Services Tariff and an enhancement to the current procedures that results in a more transparent and formulaic process. Accordingly the NYISO proposes to adopt the Independent Consultant’s revised formula for
calculating these values.
The translation of the annual net CONE value into a monthly reference point value for
use in the ICAP Sport Market Auctions also includes an annual adjustment to account for
seasonal differences in capacity availability (commonly referred to as the winter-to-summer ratio
or “WSR”). This adjustment is intended to reflect the fact that changes in capacity availability
between the Summer Capability Period and Winter Capability Period contribute to differences in
capacity prices throughout the year. To provide for revenue adequacy for the peaking plant
when market entry is needed to maintain the applicable minimum capacity requirements, these
seasonal differences are accounted for through use of annually updated WSR values.
168 See Services Tariff § 5.14.1.2.2.
169 NYISO Staff Final Recommendations at 32-34; Independent Consultant Final Report at 90-92; and AG Affidavit at ¶ 23.
170 Id.
Honorable Kimberly D. Bose November 18, 2016
Page 39
The NYISO calculated the final WSR values for the 2017/2018 Capability Year consistent with the requirements of the Services Tariff.171 The table below provides the applicable WSR values used in calculating the reference point values for the 2017/2018 Capability Year.172
ICAP Demand Curve2017/2018 WSR Value
NYCA1.037
G-J Locality1.054
NYC1.077
LI1.075
For the 2017/2018 Capability Year, the calculated reference point value for the NYCA ICAP Demand Curve was the same for each of the locations evaluated. Consistent with past resets, the NYISO proposes continued use of Load Zone F as the location for determining the parameters of the NYCA ICAP Demand Curve.173 Although the calculated reference point
values for each location are the same, Load Zone F results in the lowest annual net CONE value for the NYCA ICAP Demand Curve.174
C. ICAP Demand Curve Zero-Crossing Point
The Services Tariff requires that each DCR assess “the associated point at which the
dollar value of the ICAP Demand Curves should decline to zero.”175 The current zero-crossing point values approved by the Commission for each ICAP Demand Curve are (i) 112% of the
applicable minimum capacity requirement for NYCA; (ii) 115% of applicable minimum capacity requirement for the G-J Locality; (iii) and 118% of respective applicable minimum capacity
requirements for NYC and LI.176
The NYISO currently has ongoing efforts to assess, with its stakeholders, the process for
establishing the minimum capacity requirements for Localities and whether any adjustments
171 See Services Tariff § 5.14.1.2.2.3; Docket No. ER16-1751-000, New York Independent System Operator, Inc., Request for Leave to Answer and Answer of the New York Independent System Operator, Inc. (June 27, 2016); and DCR Enhancements Order at P 29-30.
172 NYISO Staff Final Recommendations at 31-32; and Independent Consultant Final Report at 88-89. The detailed spreadsheets related to the calculation of the applicable WSR values for the
2017/2018 Capability Year are posted on the NYISO’s website within the “2017-2021 Demand Curve Reset” subfolder of the “Reference Documents” folder, available at:
http://www.nyiso.com/public/markets_operations/market_data/icap/index.jsp.
173 NYISO Staff Final Recommendations at 40-41.
174 Id.
175 See Services Tariff § 5.14.1.2.2.
176 2013 DCR Filing at 32-35; and 2013 DCR Order at P 140.
Honorable Kimberly D. Bose November 18, 2016
Page 40
thereto are warranted. In light of these ongoing efforts, the NYISO and the Independent
Consultant agreed that it would not be appropriate to propose any adjustments to the currently effective zero-crossing point values for the ICAP Demand Curves for this reset period.177 In the interest of market stability, the NYISO proposes to retain the current zero-crossing point values for each ICAP Demand Curve (i.e., 112% for the NYCA ICAP Demand Curve, 115% for the G-J Locality ICAP Demand Curve and 118% for the NYC and LI ICAP Demand Curves).178
Stakeholders did not indicate any objection to this proposal. The NYISO will, as required by the Services Tariff, reassess the zero-crossing point values in the next DCR.
VI.Annual Updates
The recently approved enhancements to the DCR process include conducting transparent and formulaic annual updates to establish the ICAP Demand Curves for the second through
fourth years encompassed by each reset period.179 The annual update process consists of updates to the following parameters each year: (i) adjusting the levelized localized embedded cost of the peaking plant for each ICAP Demand Curve based on a composite escalation factor;180 (ii)
determining new net EAS revenue estimates for each peaking plant using updated cost and
market price information;181 (iii) determining updated WSR values;182 and (iv) determining the
revised values of the ICAP Demand Curves utilizing the updated values described above.183 The Services Tariff requires that the NYISO post the results of annual updates to its website on or
before November 30th of the calendar year prior to the commencement of the Capability Year for which the updated ICAP Demand Curves apply.184
A. Composite Escalation Factor for Adjusting Peaking Plant Costs
The levelized localized embedded cost of the peaking plant for each ICAP Demand
Curve will be updated annually using a single, NYCA-wide composite escalation factor.185 The
composite escalation factor measures the year-over-year percentage change in values for certain
publicly available inflation indices that relate to the costs of building a new power plant. The
composite escalation factor consists of four components: (i) changes in construction material
177 NYISO Staff Final Recommendations at 34; Independent Consultant Final Report at 87-88; and AG Affidavit at ¶ 23.
178 Id.
179 DCR Enhancements Filing at 10-17; and DCR Enhancements Order at P 27-30. 180 See Services Tariff § 5.14.1.2.2.1.
181 See Services Tariff § 5.14.1.2.2.2.
182 See Services Tariff § 5.14.1.2.2.3
183 Id.
184 See Services Tariff § 5.14.1.2.2. For example, the updated ICAP Demand Curves for the
2018/2019 Capability Year will be posted to the NYISO’s website on or before November 30, 2017.
185 See Services Tariff § 5.14.1.2.2.1.
Honorable Kimberly D. Bose November 18, 2016
Page 41
costs (“materials component”); (ii) changes in turbine generator costs (“turbine component”);
(iii) changes in labor costs (“labor component”); and (iv) changes in the general cost of goods
and services (“general component”). The costs of the proposed peaking plant for each ICAP
Demand Curve are broken down into each of these general cost categories in order to derive
average NYCA-wide weighting factors that should be applied to each component.
The table below provides the proposed data source and weighting factor for each of the components to be used in determining the applicable composite escalation factor values during this reset period.186
Cost
Component
Index Value
DataWeighting
Interval Factor
BLS Quarterly Census of Employment and
Labor
Materials
Wages, New York - Statewide, NAICS 2371
Utility System Construction, Private, All
Establishment Sizes, Average Annual
BLS Producer Price Index for Commodities, Not
Seasonally Adjusted, Intermediate Demand by
Commodity Type (ID6), Materials and
Components for Construction (12)
Annually28%
Monthly37%
BLS Producer Price Index for Commodities, Not
TurbineSeasonally Adjusted, Machinery and EquipmentMonthly20%
(11), Turbines and Turbine Generator Sets (97)
Bureau of Economic Analysis: Gross Domestic
GeneralProduct Implicit Price Deflator, Index 2009 =Quarterly15%
100, Seasonally Adjusted
Section 5.14.1.2.2.4.11 of the Services Tariff requires that the NYISO calculate and
report the final values for the composite escalation factor and the inflation rate for the general component thereof that would have applied for the 2017/2018 Capability Year had an annual update been conducted for such year. These values are relevant for certain aspects of the
NYISO’s buyer-side capacity market mitigation measures (“BSM Rules”).187 The relevant final value of the composite escalation factor for the 2017/2018 Capability Year is 1.48%, and the applicable value of the general component thereof is 1.22%.
B. Net EAS Model Inputs
The net EAS revenue projections for each peaking plant are refreshed as part of the
annual update process. For purposes of the annual updates for this reset period, the NYISO will
utilize the same net EAS revenues model used to determine the net EAS revenue projections for
186 NYISO Staff Final Recommendations at 38; and Independent Consultant Final Report at 101-
102.
187 The BSM Rules are set forth in Section 23.4.5.7 et seq. of Attachment H of the Services Tariff.
Honorable Kimberly D. Bose November 18, 2016
Page 42
the 2017/2018 Capability Year, updating the model to replace the oldest twelve month period in the underlying dataset with the most recent twelve month period ending in August.188
The model used for projecting net EAS revenues, the commitment and dispatch logic of that model (including the manner in which the model will account for the operating
characteristics of each peaking unit technology and any operating hours restrictions or limitations relating thereto), and the data inputs used for determining the applicable market prices and costs used by the model were developed as part of the DCR and will remain fixed for the four year
period covered by this DCR.189
The table below summarizes the proposed data inputs to be used for this reset period.190
Data Input Value/Source
Factor Used in Annual
Updates for Each ICAP
Demand Curve
Net EAS Revenue Model, including Commitment and Dispatch Logic
NYCA191G-J Locality192NYCLI
The net EAS revenues model is posted on the NYISO website within the “Final Net EAS Model September 13, 2016” section of the “2017-
2021 Demand Curve Reset” subfolder of the “Reference Documents” folder, available at:
http://www.nyiso.com/public/markets_operations/market_data/icap/ind ex.jsp.
1x0 Siemens
Peaking plant
Variable Cost per Start
($/Start) (per unit)193
1x0 Siemens1x0 Siemens1x0 Siemens
SGT6-5000F5SGT6-5000F5SGT6-5000F5
with SCR/COwith SCR/COwith SCR/CO
$10,300$10,500$11,000
SGT6-
5000F5 with
SCR/CO
$10,900
188 See Services Tariff § 5.14.1.2.2.2. For example, for the annual update to determine ICAP
Demand Curve values for the 2018/2019 Capability Year, the annual net EAS revenue projection will be based on cost and pricing data for the period from September 1, 2014 through August 31, 2017
189 In certain circumstances, these factors will represent a value that will remain fixed for the four year reset period. In other instances, these factors will relate to a data source that will be used for
determining applicable market price or cost information used by the model.
190 NYISO Staff Final Recommendations at 38-40.
191 The data inputs for NYCA represent the NYISO’s proposal to use Load Zone F as the appropriate location for the NYCA ICAP Demand Curve peaking plant.
192 The data inputs for the G-J Locality represent the NYISO’s proposal to use Dutchess County as the appropriate location for the G-J Locality ICAP Demand Curve peaking plant.
193 The start-up cost is calculated as the start-up fuel quantity multiplied by the applicable day ahead fuel price, plus the variable O&M cost per start. The start-up fuel quantity for the proposed peaking plant technology and design is provided in the Independent Consultant Final Report. See Independent Consultant Final Report at 140.
Honorable Kimberly D. Bose November 18, 2016
Page 43
Data Input Value/Source
Factor Used in Annual
Updates for Each ICAP
Demand Curve
Net Plant Heat Rate (HHV basis), Degraded
Energy Prices (day-ahead and real-time)
Operating Reserves Prices
(day-ahead and real-time)
Level of Excess Adjustment
Factors
Ancillary Services Adder for Voltage Support Service
($/kW-yr.)
Peaking plant primary Fuel
Type
Peaking plant secondary (if any) Fuel Type
NYCA191G-J Locality192NYCLI
See NYISO Staff Final Recommendation at 18 (Table 9)
This data is publically available through the NYISO DSS System, via the NYISO website
This data is publically available through the NYISO DSS System, via the NYISO website
See NYISO Staff Final Recommendations at 26 (Table 13)
$1.43$1.43$1.43$1.43
Natural GasNatural GasNatural GasNatural Gas
-ULSDULSDULSD
Fuel tax adder - Gas--6.9%1.0%
Fuel tax adder - ULSD
Transportation cost adder -
Gas ($/MMBtu)
Transportation cost adder -
ULSD ($/MMBtu)
Real-time intraday gas premium/discount
Fuel Pricing Point - Gas
Fuel Pricing Point - ULSD
--
$0.27$0.27
$2.00$1.50
10%10%
IroquoisIroquois
Zone 2Zone 2
New YorkNew York
Harbor Harbor
4.5%-
$0.20$0.25
$1.50$1.50
20%30%
TranscoTransco
Zn 6 NYZn 6 NY
New YorkNew York
Harbor Harbor
Fuel Price Data source - Gas Fuel Price Data Source -
ULSD
Peaking plant Variable
Operating and Maintenance
Cost
SNL Financial
https://www.eia.gov/dnav/pet/hist/LeafHandler.ashx?n=PET&s=EER_
EPD2DXL0_PF4_Y35NY_DPG&f=D
See Independent Consultant Final Report at 119 for the applicable data relating to the proposed peaking plants for the G-J, Locality, NYC and LI ICAP Demand Curves; and Independent Consultant Final Report at 133 for the applicable data relating to the proposed peaking plant for the NYCA ICAP Demand Curve. The applicable values are also
provided within the “Lummus Performance and OM Data” spreadsheet posted with the net EAS revenues model (see the “Final Net EAS
Model September 13, 2016” section of the “2017-2021 Demand Curve Reset” subfolder of the “Reference Documents” folder, available at:
http://www.nyiso.com/public/markets_operations/market_data/icap/ind ex.jsp)
Honorable Kimberly D. Bose November 18, 2016
Page 44
Data Input Value/Source
Factor Used in Annual
Updates for Each ICAP
Demand Curve
Peaking plant CO2 Emissions
Rate
Peaking plant NOx Emissions
Rate
Peaking plant SO2 Emissions
Rate
CO2 Emission Allowance
Cost
NOx Emission Allowance
Cost
SO2 Emission Allowance
Cost
NYISO Rate Schedule 1
Charges for Injection Billing
Units
NYCA191G-J Locality192NYCLI
See Independent Consultant Final Report at 140. The applicable values are also provided within the “Lummus Performance and OM Data”
spreadsheet posted with the net EAS revenues model (see the “Final Net EAS Model September 13, 2016” section of the “2017-2021
Demand Curve Reset” subfolder of the “Reference Documents” folder, available at:
http://www.nyiso.com/public/markets_operations/market_data/icap/ind ex.jsp)
RGGI Regional Allowance Auction Results, available on RGGI’s
website at https://www.rggi.org/market/co2_auctions/results
SNL Financial
SNL Financial
http://www.nyiso.com/public/markets_operations/market_data/miscella
neous/index.jsp?docs=rate-schedule-1
C. ICAP Demand Curve Parameter Updates
The NYISO will utilize the updated levelized embedded cost values and annual net EAS
revenue projections to derive the updated values of the ICAP Demand Curves.194 The maximum
value of each ICAP Demand Curve is set at an amount equal to the monthly value of the updated
levelized embedded cost for the applicable peaking plant, multiplied by 1.5. The reference point
is set at the annual net CONE value for each peaking plant, translated into a monthly value that
194 See Services Tariff § 5.14.1.2.2.3.
Honorable Kimberly D. Bose November 18, 2016
Page 45
accounts for seasonal differences in capacity availability and the tariff-prescribed level of excess conditions. Calculations of the reference point value will use annually updated WSR values. The applicable capacity ratings for each peaking plant used in calculating the reference point price were determined during the DCR and will remain fixed for the four year period of the reset. The proposed zero-crossing point for each ICAP Demand Curve DCR was also determined
during the DCR and will remain fixed for the reset period of this DCR.
The table below summarizes the proposed data inputs to be used in calculating the ICAP Demand Curve parameters for this reset period.195
Data Input Value
Factor Used in AnnualType of
Updates for Each ICAPValue Demand Curve
NYCA196G-J Locality197NYCLI
ICAP Demand Curve Parameter Values
Fixed for
Zero-crossing pointReset Period112%115%118%118%
Reference Point Price Calculation
Peaking Plant Net
Degraded Capacity
(DMNC ICAP MW)
Peaking Plant Summer Capability Period
DMNC
Peaking Plant Winter Capability Period
DMNC
Level of Excess
WSR Values
Fixed for
Reset Period
Fixed for
Reset Period
Fixed for
Reset Period
Fixed for
Reset Period
Updated
Annually
217.0128.0217.6219.1
224.6226.8226.9224.9
230.3230.3228.7230.3
100.6%101.5%102.3% 103.9%
These values are updated annually and will be
publically available via the NYISO website.
195 NYISO Staff Final Recommendations at 36-37.
196 The data inputs for NYCA represent the NYISO’s proposal to use Load Zone F as the appropriate location for the NYCA ICAP Demand Curve peaking plant.
197 The data inputs for the G-J Locality represent the NYISO’s proposal to use Dutchess County as the appropriate location for the G-J Locality ICAP Demand Curve peaking plant.
Honorable Kimberly D. Bose November 18, 2016
Page 46
VII.Description of Tariff Amendments
The NYISO proposes to revise Section 5.14.1.2 of the Services Tariff to reflect the
parameters of the ICAP Demand Curves for the 2017/2018 Capability Year. Specifically, the
NYISO proposes to modify the table in Section 5.14.1.2 of the Services Tariff to include a new
column specifying the applicable parameters of the ICAP Demand Curves for the 2017/2018
Capability Year, while deleting the existing columns specifying the parameters for the
2013/2014 through 2015/2016 ICAP Demand Curves. The NYISO also proposes to populate the
table included in Section 5.14.1.2.2.3 of the Services Tariff with the relevant values for the
2017/2018 Capability Year.
VIII.Effective Date
The NYISO respectfully requests issuance of an order by Commission accepting the
proposed ICAP Demand Curves for the 2017/2018 Capability Year and the methodologies and
inputs to be used in conducting annual updates for the 2018/2019 through 2020/2021 Capability
Years within sixty days from the date of this filing (i.e., on or before January 17, 2017). The
NYISO requests an effective date of January 17, 2017 for the proposed revisions to Section
5.14.1.2 of the Services Tariff to reflect the parameters of the 2017/2018 Capability Year ICAP Demand Curves.
IX.Communications and Correspondence
All communications and service in this proceeding should be directed to:
Robert E. Fernandez, General Counsel
Raymond Stalter, Director, Regulatory Affairs *Garrett E. Bissell, Senior Attorney
10 Krey Boulevard
Rensselaer, NY 12144
Tel: (518) 356-6107
Fax: (518) 356-7678
gbissell@nyiso.com
*Person designated for receipt of service.
X.Service
The NYISO will send an electronic link to this filing to the official representative of each
of its customers, to each participant on its stakeholder committees, to the New York State Public
Service Commission, and to the New Jersey Board of Public Utilities. In addition, the complete
filing will be posted on the NYISO’s website at www.nyiso.com.
Honorable Kimberly D. Bose November 18, 2016
Page 47
XI.Conclusion
The proposal set forth herein to establish the ICAP Demand Curve parameters for the
2017/2018 Capability Year, as well as the methodologies and inputs to be used in conducting
annual updates to the ICAP Demand Curves for the 2018/2019 through 2020/2021 Capability
Years are the result of the extensive stakeholder process required by the Services Tariff.
Although various stakeholders advocate for certain changes to the proposal that would either
lower or increase the reference point values of the ICAP Demand Curves, the NYISO’s proposal
is just and reasonable. The NYISO respectfully requests: (i) that the Commission issue an order
accepting the NYISO’s proposal on or before January 17, 2017; and (ii) an effective date of
January 17, 2017 for the proposed revisions to Section 5.14.1.2 of the Services Tariff.
Respectfully submitted,
/s/ Garrett E. Bissell
Garrett E. Bissell
Senior Attorney
New York Independent System Operator, Inc.
10 Krey Blvd.
Rensselaer, New York 12144 (518) 356-6107
gbissell@nyiso.com
cc:Michael Bardee
Nicole Buell
Anna Cochrane
Kurt Longo
Max Minzner
Daniel Nowak
Larry Parkinson
J. Arnold Quinn
Douglas Roe
Kathleen Schnorf
Jamie Simler
Gary Will